
Guidelines for Canadian Drinking Water Quality: Guideline Technical Document – pH
Table of Contents
Part I. Overview and Application
Part II. Science and Technical Considerations
- 4.0 Definition and measurement
- 5.0 Relationship between pH and water quality characteristics
- 6.0 Drinking water treatment processes and pH
- 7.0 Distribution system considerations
- 8.0 Health effects of pH
- 9.0 Assessment
- 10.0 Rationale
- 11.0 References
- Appendix A: List of acronyms

Download the entire report
(PDF format, 513K, 46 pages)
Organization: Health Canada
Related Topics
The operational guideline for pH is a range of 7.0 to 10.5 in finished drinking water.
pH is a measure of the acidity/basicity of water. The control of pH is important during drinking water treatment, to maximize treatment effectiveness and efficiency, and in the distribution system, to control corrosion and reduce leaching from distribution system and plumbing components.
This guideline technical document reviews and assesses the relationships between pH and other water quality characteristics, water treatment processes and distribution system considerations. It also outlines health risks associated with exposure to extreme pH levels. Although the document includes information on pH throughout treatment and distribution, the operational guideline for pH is intended to apply to finished water in the distribution system.
Health Canada recently completed its review of the considerations associated with the pH of drinking water. Based on this review, the operational guideline for the pH of finished drinking water is an acceptable range of 7.0 to 10.5.
2.1 Water quality characteristics
The pH level of water is interrelated with other water characteristics. These include physical properties (primarily temperature); chemical characteristics, such as the levels of dissolved organic carbon and hardness, as well as the alkalinity and buffering properties of the water; and microbiological characteristics, such as biofilm.
2.2 Treatment processes
pH can have a major effect on water chemistry, which will also significantly affect the performance of many treatment processes, including coagulation and disinfection. Although water pH is an important parameter in the formation of disinfection by-products, its effects vary from one by-product to another. It is necessary to monitor pH throughout the treatment process and to adjust it as needed.
2.3 Distribution systems
The adjustment and control of pH in the distribution system, including through adequate buffering, are essential to control corrosion and minimize exposure to metals such as lead. Buffering will reduce the impact that other water characteristics can have on pH. A higher pH (up to 10.5) in the distribution system will result in lower concentrations of lead and other metals at the tap.
2.4 Health effects
There is no evidence of an association between the pH of the diet (food or drinking water) and direct adverse health effects. Extreme levels of pH have been linked to some health effects, including irritation of the skin and eyes. The most significant impact of pH on health is indirect and related to exposure to metals leached from the distribution system and to disinfection by-products formed as a result of treatment processes.
3.0 Application of the guideline
Note: Specific guidance related to the implementation of drinking water guidelines should be obtained from the appropriate
Current science indicates that the guideline for the pH of finished drinking water should be flexible to allow systems to determine the most appropriate pH for their individual water quality goals. The acceptable pH range of 7.0-10.5 would provide utilities the flexibility required to achieve water quality goals and to control contaminant concentrations and corrosion by combined treatment approaches appropriate to the materials in the distribution system and premise plumbing. It is important to note that pH cannot be considered in isolation for controlling corrosion. Adjustment of pH by itself is not considered appropriate; other parameters, such as alkalinity and dissolved inorganic carbon, also need to be considered.
3.1 Monitoring
The monitoring frequency for pH will be dependent on the specific purpose or objective of the monitoring. Operational and process-specific pH monitoring may vary in frequency and is generally not done in isolation. On-site analysis of water quality parameters includes pH, chlorine residual, turbidity and temperature to provide a baseline for specific trends in water quality throughout the treatment plant. Additionally, monitoring of these and other water quality parameters, such as dissolved inorganic carbon, alkalinity, nitrate and nitrite, can help a utility maintain drinking water quality in the distribution system and identify changes that can lead to corrosion. Monitoring should be done in the distribution system. Locations of particular importance for pH monitoring in the distribution system include areas with high residence times (e.g., dead-ends), areas where maintenance or upgrades are being conducted (e.g., application of cement lining in pipes) and points in the distribution system where drinking water sources are blended. The sampling frequency required for small systems will depend on the water quality and the complexity of treatment and distribution systems. Since disinfection efficacy is impacted by pH, even systems with minimal treatment should monitor pH. Where there are complex sources and distribution systems (e.g., multiple wells with varying water quality, mixing zones), the frequency and number of sites monitored may need to be increased.
The monitoring of pH should be done continuously at the point where the treated water enters the distribution system and throughout the distribution system. Where continuous monitoring is not possible, grab samples should be regularly taken and analyzed to ensure that any fluctuations in the quality of the finished drinking water are identified and the causes addressed.
For effective operation of the distribution system, it is good practice to ensure that finished drinking water in the distribution system maintains a pH within 0.2 pH units. Changes in distribution system pH can be indicative of deteriorating drinking water quality, and fluctuations in pH should be minimized. If an unusual or unexpected change in distribution system pH occurs, it should be investigated and its cause determined.
Monitoring of pH is used in conjunction with monitoring of disinfectant residual, alkalinity, dissolved inorganic carbon and nitrite to ensure that the quality of drinking water in the distribution system is maintained and that corrosion is being controlled.
Part II. Science and Technical Considerations
4.0 Definition and measurement
4.1 Definition of pH
At a given temperature, the intensity of the acidic or basic property of the water is indicated by the pH, which is the negative logarithm of the hydrogen ion activity (APHA et al., 2012). The hydrogen ion activity is nearly equal to its concentration in most potable waters and, for this reason, is generally stated as a concentration (Sincero and Sincero, 2003; Schock and Lytle, 2011). Pure water is slightly ionized; when the reaction is at equilibrium, the ion product (Kw) can be expressed by the following equation (Sincero and Sincero, 2003; APHA et al., 2012):
Kw = [H+] × [OH−] (Equation 1)
= 1.01 × 10⁻¹⁴ at 25°C
and
[H+] = [OH−]
= 1.005 × 10⁻⁷
where:
- [H+] is the activity of hydrogen ions (mol/L); and
- [OH−] is the activity of hydroxide ions (mol/L).
The activity of hydrogen ions, also called an effective concentration, refers to the ions that participate in the reaction and is different from the actual concentration of ions in a solution. A logarithmic scale is a convenient way to express the ionic activities:
(-log10[H+]) + (-log10[OH−]) = -log10 Kw (Equation 2)
= 14 at 25°C
or
pH + pOH = pKw (Equation 3)
where:
- pH = -log10[H+];
- pOH = -log10[OH−]; and
- pKw = -log10Kw.
Equation 3 shows that as pH increases, pOH decreases correspondingly, and vice versa, as pKw is a constant at a given temperature. The pH scale is usually represented as a range from 0 to 14, with pH 7.0 representing neutrality (at 25°C), and the activities of the hydrogen and hydroxide ions are each approximately 10-7 mol/L. The neutral point is temperature dependent, and the pH neutral points are 7.5 and 6.5 at 0°C and 60°C, respectively. Natural waters usually have pH values in the range of 4.0 to 9.0; however, most are slightly basic because of the presence of bicarbonates and carbonates of the alkali and alkaline earth metals. As the scale is logarithmic, a drop in pH by 1.0 unit is equivalent to a 10-fold increase in acidity (APHA et al., 2012).
In a national survey conducted by Health Canada in 2009 and 2010, the pH levels of 129 samples of raw water were measured at 64 treatment plants in winter and summer. Data for raw water showed that pH ranged from 4.6–8.57 for 93 surface water samples and 6.1–9.18 for 36 groundwater samples (Health Canada, 2012b).
4.2 Measurement of pH
pH is one of the most important operational water quality parameters. Measurement of pH is one of the most frequently used tests in water chemistry. Every process in water treatment, including coagulation, precipitation, water softening, disinfection and corrosion control, is dependent on pH.
The most accurate method to measure the pH of a water sample is the potentiometric method. The potentiometric method is based on the Nernst equation, which describes the relationship between the galvanic potential of a defined electrode pair and the activity of the hydrogen ion (Dye, 1952; Kohlmann, 2003):
E = E0 – (2,303 RT/nF) × log aH+
where:
- E is the total potential between two electrodes (mV);
- E0 is the temperature-dependent standard potential of electrode;
- R is the gas constant (Jmol−1K-1);
- T is the absolute temperature (°K);
- n is the valency (charge) of the ion (n = 1 for H+);
- F is the Faraday constant (C mol-1); and
- aH+ is the activity of the hydrogen ion.
The potentiometric method uses a pH meter, which includes a pH-measuring electrode (usually a glass electrode), a reference electrode, a high impedance voltmeter and a temperature-compensating device. The reference electrode is calomel, silver–silver chloride or some other reference electrode of constant potential. The pH-measuring and reference electrodes can be two physically separate electrodes, known as an electrode pair. For convenience, the majority of modern pH meters have both electrodes joined in a single glass body assembly known as a combination electrode.
When the electrodes are immersed in a reference solution, a circuit is completed through the potentiometer, and the potentiometer measurement is used to determine the activity of the hydrogen ions. The reference electrode must have a constant and stable potential to be able to provide an accurate measurement. Deviation in the potential of the reference electrode will cause the overall potential to change, which will affect the pH reading at the measuring device (Kohlmann, 2003).
Based upon the Nernst equation, the term “2.303 RT/nF” is called a “slope factor” and describes the change in the total potential between the measuring and the reference electrodes for every 10-fold change in the activity of the H+ ion. The slope factor is 59.16 mV for every 10-fold change in hydrogen ion activity at 25°C. In theory, the potential measured at pH 7.0 (isopotential point) is 0 mV (Kohlmann, 2003).
An accurate pH measurement requires calibration of the pH meter using buffers of known pH and adjusting the meter accordingly. The calibration is performed to compensate for the changes in the potential within the measuring and the reference electrodes, as well as any changes in the potential between them. The calibration also involves checking the slope of the measuring electrode and should be done, at minimum, daily (U.S. EPA, 1982). As ionic strength of the water can have an effect on pH measurement, other quality assurance/quality control measures, such as the use of a control or reference solution with a similar ionic strength to the sample water, should be considered.
The potentiometric measurement of pH in a closed system is affected by temperature in two ways: 1) a mechanical effect due to the physical changes in the electrode properties; and 2) a chemical effect caused by the equilibrium changes of the water sample (APHA et al., 2012). As the glass electrode is an ionic conductor, temperature fluctuations will affect the resistance of the electrode and will result in incorrect pH readings. As the temperature rises, the resistance across the glass bulb of the electrode decreases.
Glass electrodes are relatively free from interference related to colour, turbidity, oxidizing and reducing agents. However, at pH levels above 10, they experience interference caused by lithium, sodium and potassium cations. To reduce the possibility of such error (alkaline error), measurements at pH above 10 should be conducted with special “low sodium error” electrodes (APHA et al., 2012). Acid error affects the low end of the pH scale, usually below 1.0. As most water process applications are well above this pH, acid error is uncommon (Kohlmann, 2003).
In a closed system, any change in the temperature of the tested sample also results in a change in the activity of the hydrogen ions in that solution and subsequently in its pH value. A decrease of about 0.45 pH units occurs as the temperature is raised by 25°C in pure water (Langelier, 1946). For this reason, pH meters typically include a temperature compensation device in the measuring circuit. It is important to measure the pH as soon as possible after the sample collection to minimize the impact of temperature (Larson, 1975; Kohlmann, 2003). The temperature of the sample may take time to stabilize during cold water conditions. As such, analysts must ensure that the pH meter has reached equilibrium during cold water analysis to ensure an accurate measurement.
As the pH of water is controlled by the carbon dioxide–bicarbonate–carbonate equilibrium system, any change in the carbon dioxide (CO2) concentration will affect the pH level of water. When continuous monitoring is not possible, a grab sample should be collected carefully to minimize aeration and splashing. Samples should be analyzed as soon as possible after sampling, while taking extreme care not to shake the sample or stir rapidly during the measurement. Waters that are not at equilibrium with the atmosphere (e.g., groundwater, high-pH waters) are subject to changes when exposed to the atmosphere (see Figure 1); therefore, the sample containers should be filled completely and kept sealed prior to analysis and measured in a closed system configuration, if possible.
pH meters for laboratory or field use are readily available from various vendors and suppliers. Pocket-sized, battery-powered, portable meters are suitable for field use. The portable meters can measure pH values with an accuracy of ± 0.05 pH units. Larger, more sophisticated models of pH meters can attain an accuracy of ± 0.01 pH units. Care must be taken when handling such equipment. The electrodes generally need to be replaced periodically.
Alternative methods for determining the pH of a solution are the use of indicators and colorimeters. The indicators (litmus) are specifically designed materials that change colour when exposed to different pH values. The colour of a wetted sample paper is compared with a standard colour scale. pH indicator strips are typically used for preliminary measurement or for small-volume samples and cannot be used for continuous monitoring of pH. The colorimeter device uses a vial filled with an appropriate volume of sample, to which a reagent is added. The colour of the sample changes and is compared with a colour wheel or spectral standard to interpolate the pH value (Kohlmann, 2003).
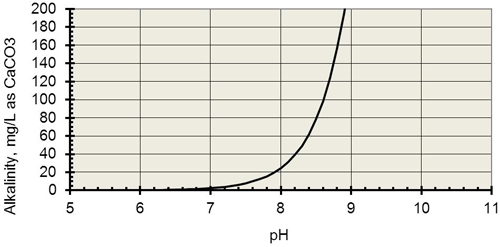
long description
With a vertical axis in units of alkalinity as mg/L CaCO3 ranging from 0 to 200 and an horizontal axis in pH units ranging from 5 to ll, this graph shows that as carbon dioxide is lost from the sample to the atmosphere, the alkalinity of the sample increases from 0 to 200, thereby causing pH readings to rise from 7 to 9. This demonstrates the error introduced into pH readings if the original sample is exposed to the atmosphere.
4.2.1 Approved analytical methods
The U.S. Environmental Protection Agency (EPA) has two approved analytical methods (Methods 150.1 and 150.2) to measure pH in drinking water (U.S. EPA, 2011). Both methods are potentiometric methods, whereby the pH of the sample is determined electrometrically using either a glass electrode in combination with a reference electrode or a combination electrode. Method 150.2 can be used for continuous online measurement of the pH of samples.
The following methods, developed by voluntary consensus standard organizations, are approved by the U.S. EPA and available to measure pH: ASTM-D 1293 (ASTM, 1984, 1995, 1999) and SM 4500-H+ B (APHA et al., 1992, 1995, 1998 and 2005), as well as the online version of SM 4500-H+ B-00 (APHA et al., 2011).
5.0 Relationship between pH and water quality characteristics
The pH level of water can affect, and in some cases be affected by, the physical, chemical and microbiological characteristics of the water, as described below.
5.1 Physical characteristics
Physical characteristics of water include temperature, colour, taste, odour, turbidity and total dissolved solids. Temperature is the single most important physical characteristic affecting the pH of water.
5.1.1 Temperature
Changes in temperature will affect the ionization equilibrium of any weak acids and bases that are present in the water. Increases in water temperature will cause the water to dissociate more, resulting in a decrease in pH. In pure water, a decrease in pH of about 0.45 units occurs as the temperature is raised by 25°C from 75°C to 100°C (Langelier, 1946; Dye, 1952; Larson and Henley, 1955a,b). However, when the weak acids and bases are present in the water, the magnitude of this effect depends on the alkalinity and dissolved inorganic carbon (DIC) content of the water. Figure 2 provides an example of how a pH observed at 10°C needs to be corrected to obtain the corresponding pH at 25°C for waters of different alkalinities.
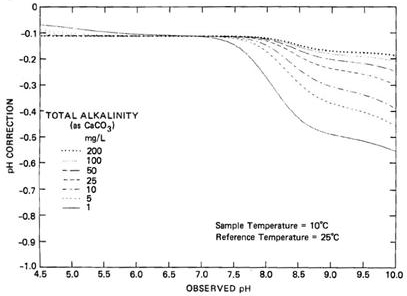
long description
The graph depicts seven lines representing the pH of water samples with total alkalinities of 1, 5, 10, 25, 50, 100 and 200 mg/L (as CaCO3), plotted with a vertical axis showing the correction to be applied to the observed pH (in increments of 0.1 pH units ranging from 0 to -1.0) and a horizontal axis showing the observed pH levels (ranging from 4.5 to 10) at 10°C. The lines converge at a pH correction of -0.11 units until pH 7.1. Above pH 7.1, the lines diverge, illustrating that the changes in temperature affect all alkalinities, with the greatest impact on waters of alkalinity well below 100 mg/L (as CaCO3).
5.2 Chemical characteristics
5.2.1 Dissolved inorganic carbon
Inorganic carbon chemistry is important in many water treatment applications, including coagulation, water softening, corrosion, oxidation and many processes involving acid–base reactions.
DIC is the sum of the concentration of the total inorganic carbon species in the water, including dissolved carbon dioxide (CO2), bicarbonate (HCO3−) and carbonate (CO32−), as well as carbonate species bound to metals as ion pairs or complexes. Commonly, DIC is expressed in milligrams of carbon per litre (mg C/L).
When dissolved in water, carbon dioxide is hydrated by the water molecules to form carbonic acid (H2CO3):
CO2 + H2O H2CO3

However, for this reaction, the concentration of the dissolved carbon dioxide exceeds that of carbonic acid, and only a small fraction of carbonic acid exists. The symbol H2CO3* denotes the sum of the concentrations of CO2 and H2CO3 in the water (Stumm and Morgan, 1996; Butler and Cogley, 1998; Edzwald and Tobiason, 2011; Crittenden et al., 2012). For pure water in contact with the atmosphere, DIC is simply defined as:
DIC = [H2CO3*] + [HCO3-] + [CO32-]
As H2CO3* has acidic properties, the DIC concentration is an important parameter in many processes in surface water and groundwater, where it can affect the pH. The weathering of aluminum silicate and/or carbonate minerals increases the concentration of bicarbonate in the source water and thus the pH. The respiration of algae or the biodegradation of organic matter increases the carbon dioxide concentration and decreases the pH of the water. All of these reactions affect the DIC concentration, pH and chemical composition of the water (Edzwald and Tobiason, 2011). The bicarbonate and carbonate species affect many important reactions in corrosion chemistry, such as the ability of the water to form protective metallic carbonate-based scale or passivating film (Schock and Lytle, 2011). The DIC concentration plays an important role in stabilizing the pH of the water and can be calculated if the pH, alkalinity, temperature and ionic strength are known. However, in some water applications, if the DIC concentration is low (below 5 mg/L), the presence of weak acids (e.g., phosphoric acid) and bases (e.g., dissociated sodium and calcium hypochlorite) may contribute to the alkalinity and complicate the computation of the DIC concentration from pH and alkalinity results (Butler and Cogley, 1998; Schock and Lytle, 2011).
Closed system conditions (i.e., no contact with air) occur in groundwater, in the bottom stratified water layer in lakes and reservoirs, in distribution systems and in many water treatment processes. The total inorganic carbon content is constant in closed systems (Edzwald and Tobiason, 2011). Several authors have shown that when plotting the inorganic carbon concentration of 10-3 M (or 12 mg/L, a common condition for water supplies) as a function of pH at 25°C, the dominant form of inorganic carbon is H2CO3* at pH less than 5; HCO3- at pH ranging from 6.3 to 10.3; and CO32- at pH greater than 10 (Stumm and Morgan, 1996; Butler and Cogley, 1998; Edzwald and Tobiason, 2011; Crittenden et al., 2012).
5.2.2 Alkalinity
Alkalinity is a measure of the capacity of the water to neutralize acids. It is influenced by the presence of the conjugate bases of inorganic carbon (HCO3-and CO32-) and organic acids, as well as orthophosphate (H2PO4-, HPO42-, and PO43-), ammonia and silicate, all of which consume acid (H+) when it is added to the water. Alkalinity can also be influenced by the presence of OH− ion when it is in excess relative to the H+ ion. For most water supplies and water treatment applications, the dominant conjugate bases are those from inorganic carbon. For the simple case of negligible contributions of other weak acids and bases relative to the carbonic acid system, the total alkalinity (TALK) is described by the following relationship (Edzwald and Tobiason, 2011):
TALK = [HCO3-] + 2[CO32-] + [OH−] − [H+]
Alkalinity has historically been characterized as having operational forms expressed as phenolphthalein alkalinity and as total alkalinity (APHA et al., 2012). Phenolphthalein alkalinity and total alkalinity are both measured by titration, but each has a different titration endpoint.
Water that has a pH higher than 8.3 is said to have “phenolphthalein alkalinity,” which is alkalinity due primarily to the presence of carbonate or hydroxide ions. Phenolphthalein alkalinity is determined by titration to an endpoint pH of 8.3, which corresponds to the conversion of carbonate ions to bicarbonate ions. The phenolphthalein indicator changes from pink to colourless at pH 8.3 when this conversion occurs.
Total alkalinity is the final endpoint for the alkalinity titration and is determined by titration to the carbonic acid equivalence point. In drinking water practice in North America, alkalinity is most frequently expressed in milligrams of calcium carbonate per litre (mg/L as CaCO3) (Edzwald and Tobiason, 2011). Commonly, in water supply and treatment applications, the endpoint of the titration is assumed to be a pH of 4.5, which corresponds to an equivalence point pH for an alkalinity of slightly over 150 mg/L as CaCO3 (APHA et al., 2012). However, the pH of the equivalence point varies depending on the concentrations of carbonate, bicarbonate, hydroxide and other proton-consuming anions weaker than this endpoint and can lie between pH 8.3 and 4.5 (Stumm and Morgan, 1996; Butler and Cogley, 1998). For higher-alkalinity waters, the endpoint of titration is an approximation.
The endpoint of the total alkalinity titration can be identified by four principal approaches of varying levels of accuracy (APHA et al., 2012):
- the use of an indicator dye, such as the mixed methyl red–bromocresol green indicator, which changes colour from green to pink at pH 4.5;
- direct pH meter titration to pH 4.5;
- a full titration to the carbonic acid equivalence point, identified with any of several different mathematical or graphical approaches; or
- for alkalinities below 20 mg/L as CaCO3, Method 2320B-4d, a two-point acid addition/pH measurement method developed by Larson and Henley (1955a,b). This method uses the linear relationship between the amount of acid added and the change in pH to calculate the alkalinity.
5.2.3 Buffer intensity
The difference between alkalinity and buffer intensity of the water is often misunderstood. Whereas alkalinity is a measure of the capacity of the water to neutralize acids, buffer intensity is an ability of the water to provide resistance against the pH fluctuations caused by the addition of water treatment chemicals or by water quality changes in the distribution system. Buffer intensity is defined as the derivative of the total alkalinity titration curve (Stumm and Morgan, 1996; Butler and Cogley, 1998). This ability of the water to resist pH fluctuations is strongly influenced by the DIC concentration, pH and alkalinity of the water and is also a function of temperature and ionic strength. As shown in Figure 3, at a specific pH, water with a higher DIC concentration (and therefore higher alkalinity) will have higher buffer intensity (Kirmeyer et al., 2000; Schock and Lytle, 2011).
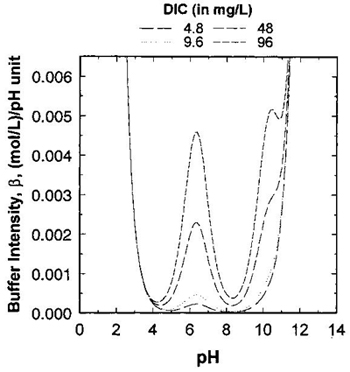
long description
The graph depicts four lines representing water samples with dissolved inorganic carbon (DIC) concentrations of 4.8, 9.6, 48 and 96 mg/L. The vertical axis provides a scale of buffer intensity in units of (mol/L)/pH unit with increments of 0.001 and a range of values from 0.00 to 0.006. The horizontal axis provides a scale of pH ranging in values from 0 to 14. The lines begin converged as one line with pH 3 having the highest buffer intensity which then decreases rapidly until pH of 4. The lines diverge between pH values of 4 to 8 where buffer intensity peaks at 0.0045 at pH 6.5 for a DIC concentration of 96 mg/L. Buffer intensity is seen to increase with increasing DIC. The graph shows that there is minimal buffer intensity (below 0.0001) between pH 8 and 8.5 for all DIC concentrations and that buffer intensity increases exponentially above pH 10 for all DIC concentrations .The lines representing the samples with DIC levels of 4.8 and 9.6 show negligible buffer intensity at all pH values between 4 and 10.
Generally, the buffer intensity of natural waters is greater at pH levels of approximately 6.3 and 10.3, which correspond to the equilibrium constants pK1 and pK2, respectively, of the carbonate system. The minimum buffer intensity of water is approximately at pH 8.3, which corresponds to the point where pH is equal to ½(pK1 + pK2) of the carbonate system (Butler and Cogley, 1998; Clement and Schock, 1998; Kirmeyer et al., 2000; Schock and Lytle, 2011).
5.2.4 Hardness
Hardness is primarily caused by the presence of calcium and magnesium in the water and is reported in mg/L as CaCO3. Generally, the carbonate hardness is defined as the concentration of Ca2+ and Mg2+ cations in water that are associated with the anions that comprise the alkalinity (HCO3 – and CO32-) (Randtke, 2011; Crittenden et al., 2012). In general, waters with a calcium carbonate concentration less than 75 mg/L are considered soft; between 75 and 150 mg/L, moderately hard; between 150 and 300 mg/L, hard; and more than 300 mg/L, very hard (Post et al., 2011). Calcium carbonate, magnesium hydroxide and many carbonate oxide solids are less soluble at higher pH values; therefore, increasing the pH of hard water may cause unintended side effects, such as increased scaling in the treatment plant and distribution system.
The Langelier saturation index (LSI) identifies whether a calcium carbonate scale will form or not, based on the following equation:
LSI = pH − pHs
where pHs is the pH at which water is saturated with calcium carbonate.
When the LSI is greater than 0, the water will tend to precipitate CaCO3 scales, whereas when the LSI is less than 0, the water will tend to dissolve CaCO3 scales. The LSI is not a corrosion index; although it tends to predict whether CaCO3(s) will precipitate or dissolve, it does not predict how much will precipitate or whether the structure of the precipitated solid will provide resistance to corrosion (Larson, 1975). Predicting calcium carbonate formation is important because (1) it identifies a constraint (the formation of a detrimental scaling deposit) on the ability to adjust pH; (2) it can be considered to minimize deterioration of cement linings; and (3) it can help monitor treatment process consistency (e.g., lime softening). Many computational and empirical methods exist to estimate the onset of scaling. Accurate estimation is not straightforward, because many water chemistry parameters interfere with the nucleation, growth and deposition of hardness-derived scales. Challenges include knowledge of (1) the concentrations, identities and formation constants for the important complexing ligands that can solubilize calcium carbonate; (2) the kinetics of nucleation and growth of the calcium carbonate form; and (3) the presence of cations and anions that can inhibit the nucleation and growth of calcium carbonate (Schock and Lytle, 2011). Available software currently does not address these limitations.
5.2.5 Metals
Metals present in distributed water as a result of the internal corrosion of lead, copper, iron and other materials will be affected by pH. The properties of solid and aqueous metal species in water are dependent on pH. In general, as pH decreases, the solubility of metal species increases, resulting in elevated levels of metals in the water. By changing the aqueous forms (complexes, free ions, ion pairs) of metals, pH can dramatically alter the solubility, surface charge and sometimes the aquatic toxicity of the metals. This relationship is dependent on other water quality factors, such as alkalinity, DIC concentration, oxidant levels and concentrations of other constituents in the water, such as chloride, sulphate, natural organic matter (NOM), corrosion inhibitors and ammonia.
5.3 Microbiological characteristics
The pH range commonly found in water supplies generally supports the growth of biofilm. Biofilms are communities of microorganisms that adhere to surfaces and may be released to the bulk water, depending on its physical and chemical characteristics. Biofilms that form on distribution and premise piping systems may be associated with the scale that forms as a result of corrosion (corrosion by-products), and this association with the scale may shield them from disinfection. This interrelationship can result in microbiologically influenced corrosion (MIC), in the distribution system: bacteria react with the pipe material, creating microenvironments that can alter pH and other chemical characteristics of the water and also change the corrosion by-product scales formed on the surface of the material (LeChevallier et al., 1993). MIC can produce lower localized pH conditions, resulting in corrosion and pitting, and can affect metal solubility and the oxidation–reduction potential of the water (Lee et al., 1980; Schock and Lytle, 2011). Nitrification is caused by nitrifying bacteria in the distribution system and frequently occurs when chloramine is used as a secondary disinfectant. Nitrification can lower the pH of the water and cause lead corrosion (Douglas et al., 2004; Edwards and Dudi, 2004; Zhang et al., 2008, 2010).
6.0 Drinking water treatment processes and pH
It is necessary to characterize the source water to identify potential treatment challenges and to evaluate the technologies that can reasonably be expected to meet water quality goals. pH is one of several general water quality variables that must be considered when selecting and configuring the treatment sequences for a given water source. Since pH can have a major effect on the performance of treatment processes (e.g., coagulation, disinfection, precipitative softening) and on water chemistry, pH adjustment at various points in the treatment train will be needed to optimize the efficiency of treatment processes. As the pH of the source water may be impacted by environmental factors, characterization of the raw water quality is an important component in determining the initial treatment steps. The pH of water during the coagulation process will affect the coagulant’s chemistry and must be controlled in order to optimize performance and minimize the amount of coagulant in the treated water. The efficiency of the different disinfectants used in water treatment also strongly depends on the pH of the water. Daily and seasonal pH variations may have an impact on disinfectant stability and CT (the product of residual concentration of disinfectant [C] and disinfectant contact time [T]) requirements for disinfection.
The pH of the water has also been characterized as one of the most important parameters affecting the formation and speciation of disinfection by-products (DBPs) (Stevens et al., 1989). Studies and field observations show that the formation of trihalomethanes (THMs) typically increases at high pH, whereas the formation of haloacetic acids (HAAs) follows an opposite trend. pH has also been shown to affect the formation of other DBPs, such as bromate (von Gunten, 2003) and N-nitrosodimethylamine (NDMA) (Mitch and Sedlak, 2002). However, the adjustment of pH to control DBP formation is not a simple process, as the altering of the water chemistry may have an impact on other processes (e.g., coagulation, disinfection).
The effect of pH on the solubility of corrosion by-products formed during the corrosion process (e.g., lead solids, passivating scales) is key to understanding the concentration of metals at the tap.
In general, the specific processes and overall treatment objectives (e.g., coagulation, disinfection, DBP formation, corrosion control) must be considered when selecting the most appropriate pH. Although pH is integral to the individual processes, it may be necessary to adjust pH for optimum water quality in the distribution system and, ultimately, at the tap. It is imperative to control the pH throughout the treatment process and to routinely monitor the pH of the source water and of the water in the distribution system (Kirmeyer et al., 2002). The pH of water during individual treatment processes in a treatment train and that of the finished drinking water will vary between utilities, depending on the quality of the water sources and the treatment strategy.
6.1 Conventional and enhanced coagulation
The coagulation process is an essential step of conventional water treatment, and its efficiency is strongly affected by several factors, including pH. Coagulants added to water hydrolyze rapidly and form insoluble precipitates that destabilize the negatively charged colloidal particles, such as clays, algae, cysts and viruses. This destabilization allows aggregation of particles to occur via chemical and van der Waals interactions (Stumm and Morgan, 1969; Crittenden et al., 2012).
Aluminum and ferric salts are the primary coagulants used in drinking water treatment. The solubility of the resulting aluminum and ferric hydroxide precipitates depends on the pH of the water, and pH must be considered in order to maximize coagulant performance and minimize the amount of residual aluminum and iron in the treated water. Soluble hydrolysis products are formed when metal hydroxide precipitates undergo dissolution. Positively charged hydrolysis products as well as Al3+ and Fe3+ ions are formed at low pH, whereas only negatively charged hydrolysis products are formed at higher pH. Thus, the operating region for aluminum hydroxide precipitation is in the pH range of 5.5 to 7.7, with minimum solubility occurring at a pH of approximately 6.3 at 25°C. The pH range for iron precipitation is approximately 5.0 to 8.5, with minimum solubility occurring at about pH 8.0. The ferric species are less soluble over a wider pH range (Letterman and Yiacoumi, 2011; Crittenden et al., 2012). The minimum solubility for any coagulant depends on the specific water quality and needs to be determined on a case-by-case basis. Some utilities that use alum as a coagulant and operate their process at a pH below 6.0 may be affected by the solubility of aluminum (i.e., aluminum carry-over into finished water) (U.S. EPA, 2007). Conversely, pH above the optimum level in a given water with a particular mix of coagulants and polymer coagulant aids can also result in excessive aluminum solubility and carry-over to the distribution system.
Historically, coagulation was practised and optimized for turbidity (particle) removal. However, coagulation processes can also be optimized for NOM removal with higher doses of coagulants and optimization of pH. Enhanced coagulation is considered to be one of the best available technologies for the removal of DBP precursors for conventional water treatment facilities that treat surface water or groundwater under the influence of surface water. The treatment process associates the total organic carbon (TOC) removal requirement with the raw water alkalinity to avoid adding high dosages of the coagulants to reduce the pH to between 5 and 6, a range where the coagulants appear to be most effective (Krasner and Amy, 1995; Letterman and Yiacoumi, 2011). TOC, pH and alkalinity levels are the controlling factors in determining the effectiveness of enhanced coagulation for a particular source water. Jar tests are an effective tool to determine the target pH of coagulation and to identify the precursor removal trends during the process. As the addition of alum and ferric salts decreases the pH, the target pH level for TOC removal for a specific water quality can be achieved by progressively increasing the coagulant dosage, adding an acid or a combination of both (Krasner and Amy, 1995; Vrijenhoek et al., 1998; U.S. EPA, 2008). However, the target pH value is dependent on the alkalinity of the raw water and should account for the fact that higher coagulant dosages are needed to reduce the pH in higher-alkalinity water. To achieve the desire TOC removal, the pH levels are 5.5, 6.3, 7.0 and 7.5 for waters with alkalinity levels of 0 – 60, > 60 – 120, > 120 – 240 and > 240 mg/L as CaCO3, respectively (U.S. EPA, 1999a, 2008). For water with low alkalinity (< 60 mg/L as CaCO3), when the addition of small amounts of coagulant drives the pH below its target value before TOC removal is achieved, an addition of base is required to maintain the pH (U.S. EPA, 1999a).
DBP precursor removal by cationic polymers can also be influenced by the pH of the treated water (Amy and Chadik, 1983; U.S. EPA, 1999a). Amy and Chadik (1983) examined THM precursor removal from seven different natural water sources by coagulation with cationic polymer as the sole coagulant. The results demonstrated that decreasing the pH from approximately 7.6 to 6.0 increased the removal of THM precursors for each of the tested waters.
The changes in water chemistry associated with pH reduction in enhanced coagulation will affect other treatment processes. Potentially significant secondary effects of enhanced coagulation are identified for four treatment processes: (1) primary disinfection, (2) control of inorganic contaminants, (3) particle and pathogen removal and (4) residuals handling. The reduction of pH improves the disinfection characteristics of chlorine and ozone (O3), decreases the effectiveness of chlorine dioxide and tends to destabilize monochloramine (Carlson et al., 2000). A lower pH may lead to the formation of less dense and more fragile flocs, resulting in decreased efficiency of the clarification process, including shorter run times of the filters and premature breakthrough. The appropriate optimal pH levels should be selected by balancing the benefits of improving precursor removal with possible negative impacts on turbidity removal and the corrosion of concrete and mechanical equipment within the plant at lower pH (Singer, 1999; Carlson et al., 2000; U.S. EPA, 2008), and it may be necessary to subsequently increase the pH.
6.2 Disinfection and formation of by-products
6.2.1 Disinfection
In general, all drinking water supplies should be disinfected, and a disinfectant residual should be maintained throughout the distribution system. The disinfection efficiency may be affected by a variety of physical, chemical and biological factors. Temperature and pH are two physical factors that are known to play an important role in the inactivation process for most commonly used disinfectants (U.S. EPA, 1999b; Clark and Boutin, 2001).
Chlorine is the most common disinfectant in water treatment for both primary and secondary disinfection. It is typically used in one of three forms: (1) chlorine gas under pressure, which is dissolved in water at the point of application; (2) a solution of sodium hypochlorite; and (3) solid calcium hypochlorite (U.S. EPA, 1999b). The disinfection efficiency of chlorine strongly depends on the pH of the water. When chlorine gas is added to water, it is rapidly hydrolyzed to form hypochlorous acid (HOCl), a weak acid that dissociates to produce hypochlorite (OCl−) ion with a dissociation constant (pKa) of approximately 7.6 at 20°C. The distribution of both chlorine species (HOCl/ OCl−) depends on the pH of the water. HOCl is the dominant species between pH 6.0 and pH 7.6, while the OCl− ion is the dominant species above pH 7.6. At pH 6.0, greater than 95% of the chlorine exists as HOCI, while at pH 10.0, 99.7% of the free chlorine exists as OCl− (Scarpino et al., 1972; Haas, 2011). As the germicidal effect of HOCl is higher than that of the OCl− ion, chlorine disinfection is more effective at low pH values (U.S. EPA, 2007). However, it is important to note that HOCl still provides excellent inactivation for bacteria and viruses, because free chlorine is a very strong oxidant, even at elevated pH values.
The inactivation efficiency of gaseous chlorine and hypochlorite is the same as that of chlorine at the same pH value. However, the addition of chlorine gas can reduce the pH of the water and the addition of sodium and/or calcium hypochlorite yields a hydroxide ion, which may increase the pH; both of these potential effects depend on the buffer intensity of the water. Therefore, without a pH adjustment to maintain the pH of the treated water, gaseous chlorine will have greater disinfection efficiency than hypochlorite (U.S. EPA, 1999b).
With increasing pH, inactivation using chlorine is less efficient, and therefore the required CT value must be increased. When using free chlorine at 20°C, increasing the pH from a range of 6–9 to 10 reduces the level of virus inactivation by a factor of 8 to 10 times, depending on the log inactivation sought (Health Canada, 2011a). The required CT value to achieve a 4-log inactivation of viruses using free chlorine at 20°C is increased from 3 to 22 mg·min/L when the pH increased from a range of 6.0–9.0 to pH 10.0 (U.S. EPA, 2003). Similarly, the CT requirements to achieve 3 log inactivation of Giardia lamblia cysts with a chlorine residual of less than 0.4 mg/L at 20°C and at pH levels of 6.5, 8.5 and 9.0 were 44 mg·min/L, 89 mg·min/L and 105 mg·min/L, respectively (Health Canada, 2012a). At 10°C for a 0.5 log inactivation, a contact time of 16 minutes corresponds to an increase in the required free chlorine residual from 1.0 mg/L at pH 6.5 to 1.2 mg/L at pH 7.0 (U.S. EPA, 2007).
Chlorine dioxide (ClO2) is a disinfectant that can be used instead of chlorine as a primary disinfectant. Chlorine dioxide disinfects by oxidation; it is very effective against bacteria, viruses and Giardia cysts and can provide some inactivation of Cryptosporidium oocysts at higher temperatures (Health Canada, 2012a). It effectively oxidizes iron, manganese and taste- and odour-causing compounds and produces low concentrations of THMs and HAAs, but can form other DBPs, such as chlorite and chlorate (U.S. EPA, 2007). Chlorine dioxide exists in drinking water as an undissociated gas at pH values ranging from 6 to 9, and its disinfection efficiency increases with increasing pH within this range (Benarde et al., 1965; Berman and Hoff, 1984; Chen et al., 1985; Clark and Boutin, 2001). Berman and Hoff (1984) reported a greater than 99% virus inactivation with a chlorine dioxide dose of 0.5 mg/L at pH 6 in one minute. At pH 10, the same rate of inactivation was achieved in less than 15 seconds with the same disinfectant dose. Barbeau et al. (2005) found that the efficiency of chlorine dioxide against bacteria spores and bacteriophage was greater at pH 8.5 than at pH 6.5.
Ozone (O3) is a potent disinfectant/oxidant that can be used for a variety of treatment objectives, such as disinfection, oxidizing organics (including taste- and odour-causing compounds), removing trace contaminants and pretreatment prior to biological processes. Ozone is most effective against viruses and slightly less effective against Cryptosporidium oocysts (U.S. EPA, 2007). Like chlorine dioxide, ozone exists in water as a dissolved gas. It is subject to losses due to volatilization and oxidant demand in water. Reports suggest that the disinfection efficiency of ozone does not depend on pH in the range normally encountered in water treatment (Clark and Boutin, 2001; U.S. EPA, 2007; Health Canada, 2012a). However, the ozone decomposition rate increases in solutions at higher pH in which various oxidants with different reactivities are formed, which may affect the inactivation of microorganisms (U.S. EPA, 1999b; Carlson et al., 2000; Haas, 2011). The major ozonation by-products are not subject to reactions favoured at high pH (i.e., alkaline hydrolysis reactions). Instead, pH plays a role by altering the rate of decomposition of ozone to hydroxyl radicals. As pH increases, the rate of decomposition of ozone is accelerated. It has been postulated that this decomposition process is responsible for a decrease in the classical formation of ozonation by-products (e.g., aldehydes; Reckhow and Singer, 2011).
The efficiency of ultraviolet (UV) light for primary disinfection of water depends on the intensity of the light and the length of time the microorganisms are exposed to it. As the mechanism of inactivation by UV light appears to be photochemical, pH is not expected to alter its efficiency. However, certain water quality parameters (i.e., pH, alkalinity and temperature) influence lamp sleeve fouling rates. Polyvalent cations such as iron, calcium and magnesium may deposit onto the quartz sleeve, causing fouling and reducing the UV transmittance to the water. pH may affect the light absorption characteristics of humic material in the water, and it may indirectly affect the efficiency of disinfection by changing the disinfection demand (U.S. EPA, 2007; Haas, 2011).
The use of chloramination as a secondary disinfectant in drinking water treatment has gained increasing popularity as concerns have grown regarding adverse health effects attributed to chlorinated DBPs. Chemically, chloramines are a complex group of disinfectants (mono-, di- and trichloramines); monochloramine is the preferred species for disinfection purposes because of its biocidal properties as well as the taste and odour problems associated with di- and trichloramines (Kirmeyer et al., 2004). The chlorine to ammonia ratio, pH and method of application are critical parameters to consider when using chloramine as a secondary disinfectant (Hoff, 1986). The rate of monochloramine formation is highly dependent upon pH. The optimum conditions for the formation of monochloramine are pH in the range of 6.5 to 9.0 (the ideal pH is 8.3) and a chlorine:ammonia-nitrogen weight ratio between 3:1 and 5:1 (Daniel, 1998; Kirmeyer et al., 2004). A pH in the range of 4 to 6 favours the formation of dichloramine, whereas a pH below 4.4 favours the formation of trichloramine (U.S. EPA, 1999b). The disinfection efficiency of monochloramine is pH dependent and increases at lower pH, with partial hydrolysis of monochloramine to free chlorine likely being a factor (Fleischacker and Randtke, 1983; Hoff, 1986; Clark and Boutin, 2001). Generally, for monochloramine disinfection, pH is maintained at a value greater than 8.3. Although monochloramine is more stable than free chlorine, it decomposes and releases free ammonia, a factor contributing to nitrification in the distribution system. An acidic water pH catalyzes the monochloramine decay, and the disinfectant residual drops rapidly at pH 6 or below (Reckhow and Singer, 2011). In addition, nitrification may lower the pH of the water and has been cited as a cause of the release of lead into drinking water (Douglas et al., 2004).
6.2.2 Disinfection by-products
DBPs are chemical compounds produced as an unintended consequence of disinfection or oxidation processes in drinking water treatment. A number of factors in addition to the nature of the NOM determine the composition of DBPs. The choice of the disinfectant and its dose, pH and temperature can all affect DBP formation. Current scientific data show that the benefits of disinfecting drinking water (reduced rates of infectious illness) are much greater than any health risks from DBPs.
The overall reaction between chlorine and NOM is relatively insensitive to pH over the range of typical water treatment practices (Reckhow and Singer, 2011). However, the formation of specific halogenated DBPs is strongly influenced by the pH level of the water (Fleischacker and Randtke, 1983). THMs and HAAs are the two major groups of halogenated DBPs found in drinking water. With increasing pH, THM formation increases, whereas HAA formation decreases (Krasner et al., 1989; Pourmoghaddas and Stevens, 1995). THMs show generally low formation at pH 5, increased formation by approximately 20% in the pH range of 7.0 to 8.2 and an increase of 40% when the pH is greater than 8.5 (Edwards and Reiber, 1997a,b; Navalon et al., 2008; U.S. EPA, 2008; Reckhow and Singer, 2011). The increased formation of THMs at high pH is due to base hydrolysis reactions, which promote THM formation. HAAs are unaffected by base hydrolysis reactions, but their formation pathways at high pH result in a lower formation potential (Rechhow and Singer, 2011). It is important to note that dihaloacetic acid and trihaloacetic acid have different pathways of formation and hence different pH dependencies: dihaloacetic acid formation tends to be relatively independent of pH, whereas trihaloacetic acid formation decreases with increasing pH (U.S. EPA, 2008; Reckhow and Singer, 2011). Detailed information may found in the guideline technical documents for THMs and HAAs (Health Canada, 2006, 2008a).
Chlorite and chlorate ions are formed in drinking water when chlorine dioxide is used in the treatment process. For potable water applications, chlorine dioxide is generated on-site from sodium chlorite in reaction with either gaseous chlorine or hypochlorous acid under acidic conditions. Typically, pH values in the range of 3.5 to 5.5 are preferred, as more acidic conditions (i.e., pH 2.5 to 3) lead to the formation of chlorate (Gates et al., 2009). To overcome the basicity of sodium chlorite and the hydroxide produced in the reaction, acid is added along with the hypochlorous acid to maintain the optimum pH for chlorine dioxide generation (Gordon et al., 1990; U.S. EPA, 1999b; Singer and Reckhow, 2011). Precise operation (“tuning”), proper maintenance and the generation technology employed with the chlorine dioxide generator have a large bearing on the chlorine dioxide production efficiency and the rate at which chlorite and other undesirable by-products, such as chlorate, hydrogen peroxide and perchlorate, are formed (Gordon, 2001; Gates et al., 2009). Hypochlorite solutions are known to contain various impurities, including bromate, chlorate and chlorite. These may be present during manufacturing, or they may form during transportation and storage. Chlorate and chlorite are known degradation products of hypochlorite (Gordon et al., 1995). Hypochlorite degradation is associated with factors such as pH and temperature. Snyder et al. (2009) found that controlling the pH of hypochlorite solutions within the 11 to 13 range, even after dilution, helps prevent rapid decomposition and the subsequent formation of chlorate. However, it must be noted that decomposition at pH greater than 13 results in perchlorate formation. Approximately 50–70% of the chlorine dioxide consumed by oxidation reactions is reduced to chlorite under typical water treatment conditions (Werdenhoff and Singer, 1987). The production of chlorite and chlorate may increase in a water system with a high oxidant demand and a pH greater than 9. In alkaline conditions, chlorine dioxide disproportionates to form both chlorite and chlorate (Aieta and Berg, 1986; U.S. EPA, 2007). More detailed information on chlorine dioxide DBPs may found in the guideline technical document on chlorite and chlorate (Health Canada, 2008b).
The application of ozone to water naturally containing bromide will result in the formation of aqueous bromine species (hypobromite [OBr−] ions and hypobromous acid [HOBr]), which lead to the formation of both inorganic and organic DBPs (Haag and Hoigné, 1983; Krasner et al., 1993; Siddiqui and Amy, 1993). At pH 8.86 and 20°C, the two bromine species are equally distributed. Bromide oxidation to inorganic and/or organic bromine compounds during ozonation is a function of water quality and water treatment variables (Amy et al., 1997). Bromate (BrO3-), an inorganic DBP, can form through a number of possible pathways (Song et al., 1997; von Gunten and Oliveras, 1998). The pH of water during ozonation has two main impacts on bromate formation. In the direct pathway, the oxidation driven by molecular ozone, bromide is oxidized sequentially to HOBr/OBr−, bromite (BrO2-) and finally BrO3-. A lower pH shifts the equilibrium between the aqueous bromine species (HOBr/OBr-) to the hypobromous acid and decreases the concentration of the more reactive hypobromite ion. Decreasing the pH generally decreases bromate formation (Amy et al., 1997; Song et al., 1997; Williams et al., 2003). Song et al. (1997) and Williams et al. (2003) observed an approximately 50% decrease in bromate formation when the pH was decreased from 7.5 to 6.5. Benefits of decreasing the pH to control bromate formation may be offset by the formation of total organic bromine compounds, such as bromoform and bromoacetic acids. Since hypobromous acid and NOM serve as primary reactants for the formation of total organic bromine compounds, the production is expected to be favoured at low pH (Haag and Hoigné, 1983; Amy et al., 1997; Song et al., 1997). More detailed information on bromate may found in the guideline technical document on bromate (Health Canada, 1998) Little information exists in the literature on by-products formed by direct UV photolysis or the factors that may affect by-product formation (Malley et al., 1995). Although UV light does not contribute to the formation of DBPs such as THMs and HAAs, it may influence DBP precursors at high UV doses, outside of the disinfection practices (Linden and Rosenfeldt, 2011).
Wang et al. (2015) observed BrO3– formation during UV/chlorine treatment, with greater formation occurring at lower pH (6.5). It was reported that chlorine photolysis produced hydroxyl radical and ozone, which play important roles in the formation of BrO3– in the presence of bromide (Forsyth et al., 2013; Wang et al., 2015). Small changes in the structure of NOM have been reported, but no effects on THM or HAA formation were noted (Magnuson et al., 2002). A potential concern for UV-induced by-products is the photolysis of nitrate to nitrite. The formation of nitrite is a complex process and may be influenced by the presence of organic matter and pH. However, when the nitrate concentration is below10 mg/L as nitrogen, there is only a minimal chance that nitrite formation would occur (Linden and Rosenfeldt, 2011).
NDMA is a nitrogen-containing DBP that may be formed during the treatment of drinking water, particularly during chloramination and, to a lesser extent, chlorination (Charrois and Hrudey, 2007; Nawrocki and Andrzejewski, 2011; Reckhow and Singer, 2011). A laboratory study (Schreiber and Mitch, 2005) suggested that the chlorination state of the organic nitrogen precursors and the partial formation of dichloramine are the two important factors that may affect NDMA formation. The study showed that NDMA formation, involving dichloramine and dimethylamine, was highly pH dependent. When chloramines were formed in situ in deionized water and at chlorine to ammonia molar ratios less than 1 (chlorine to ammonia-nitrogen weight ratio of 5:1), approximately 1–2 orders of magnitude less NDMA was formed at pH 5.1 than at pH 6.9 and pH 8.8, respectively. In addition, reactions involving dichloramine showed higher NDMA formation from dimethylamine compared with chlorinated dimethylamine at pH 6.9, whereas at pH 5.6, more NDMA was formed by reaction with chlorinated dimethylamine (Schreiber and Mitch, 2005). More detailed information on NDMA may found in the guideline technical document on NDMA (Health Canada, 2011b).
6.3 Precipitative softening
Precipitative softening, commonly referred to as lime softening, relies on the precipitation of calcium carbonate and magnesium hydroxide [Mg(OH2)] primarily to remove hardness (Ca2+ and Mg2+ ions). It can also be used to remove various dissolved organic and inorganic contaminants. Lime softening processes are generally divided into three groups: (1) conventional lime softening to remove carbonate hardness (only lime is used); (2) lime–soda ash softening to remove carbonate and non-carbonate hardness (e.g., sulphate or chloride salt); and (3) excess lime softening to remove both calcium and magnesium and sometimes silica (U.S. EPA, 2007).
The conversion of bicarbonate to carbonate is a function of the pH of the water. Theoretically, a complete utilization of bicarbonate alkalinity for calcium precipitation requires a pH value of greater than 12. In practice, the optimum pH for calcium carbonate precipitation may be as low as 9.5, as a significant amount of carbonate is in equilibrium with bicarbonate, and more carbonate is formed as precipitation occurs (Crittenden et al., 2012). Precipitation of magnesium hydroxide requires a pH greater than 10.5, higher than can be achieved by the stoichiometric addition of lime. Therefore, an excess of lime is added to raise the pH to the point where magnesium hydroxide will precipitate (Randtke, 2011).
Enhanced softening refers to the process of improved removal of DBP precursors by precipitative softening. Generally, enhanced softening involves adding a coagulant and increasing the lime dose to raise the pH and achieve greater organic carbon removal, presumably through stronger interactions between calcium ions and precursors. If magnesium is present in the raw water and pH is increased to between 10.5 and 10.8, the co-precipitation of magnesium hydroxide and calcium carbonate will enhance precursor removal (U.S. EPA, 1999a, 2008).
Precipitative softening produces water with significant scale formation potential, and the higher pH level can increase THM formation. In general, finished water from softening plants tends to be less corrosive towards materials in the distribution system. Historically, the pH of finished water in softening plants has ranged between 7.5 and 10 (U.S. EPA, 2007; Elder and Budd, 2011). However, to prevent encrustation of filter media and excessive deposition of CaCO3 scale in the distribution system, some softening plants will add carbon dioxide (recarbonation) to reduce the pH and stabilize the water prior to distribution. When selecting an appropriate finished water pH goal, the optimum pH for corrosion control should be taken into consideration.
6.4 Adsorption
Activated alumina, granular ferric oxide and granular ferric hydroxide adsorbents, and iron oxides coated on or incorporated into various media can be used for the removal of inorganic contaminant anions, including arsenic, fluoride, selenium, silica, phosphate, vanadate and NOM (fulvate) anions, from drinking water.
Adsorption by activated alumina is a physicochemical process by which ions in the feed water are adsorbed to the oxidized activated alumina surface. Owing to the amphoteric nature of activated alumina, this process is sensitive to pH. The activated alumina adsorbs anions at pH values below its isoelectric point. The isoelectric point or the pH of zero-point-of-charge is defined as the pH value where the net surface charge is zero. For activated alumina, the pH of zero-point-of-charge is in the range of 8.2–9.2, depending on the purity of the medium. A number of studies have shown that optimum removal is achieved at a pH range of 5.5–6.0 for arsenic and fluoride and in the range of 5.0–6.0 for selenium (Clifford, 1999; U.S. EPA, 2002, 2004; Meenakshi and Maheshwari, 2006). Above the pH of zero-point-of-charge, activated alumina may predominantly adsorb cations, but the use of activated alumina as a cation exchanger is rare in water treatment (Clifford et al., 2011), with the exception of its use for the removal of radium (Clifford et al., 1988).
Several iron-based media demonstrate an affinity to adsorb both forms of arsenic [As(III) and As(V)]. The performance of the adsorptive media depends on factors such as arsenic concentration and species, pH, presence of competing anions and media-specific characteristics, such as media life and empty bed contact time requirements. However, the adsorptions of As(III) and As(V) are affected very differently by the pH of the water. The adsorption of As(V) decreases with increasing pH in the 3 to 10 range because, as the pH increases, the surface charge of the medium becomes less positive and there is less attraction to the negatively charged As(V) species of H2AsO4- and HAsO42-. The H2AsO4- species dominates between pH 2.0 and 7.0, and HAsO42- dominates between pH 7.0 and 11.0. The adsorption of As(III) increases with higher pH values, with the maximum adsorption at pH 9.0. This is likely because the uncharged species, H3AsO3, predominates for As(III) in the pH range of natural waters. At pH 9.0, the H2AsO3- form occurs, thus increasing the affinity for the positively charged iron solid surface. The range of effective adsorption of both As(III) and As(V) overlaps in the pH range of 6.0 to 7.5, with more As(V) adsorbed at lower pH and more As(III) adsorbed at higher pH (Jain and Loeppert, 2000). The optimal pH range for arsenic removal is specific to each tested medium type and can range from 5.5 to 9.0 (U.S. EPA, 2004).
6.5 Chemical oxidation
Chemical oxidation processes play an important role in the treatment of drinking water. These processes change the oxidation state of constituents to a form that can be more readily removed by subsequent treatment steps. The most common chemical oxidants are chlorine, ozone, chlorine dioxide and permanganate. Most of these chemicals are also disinfectants, so to some degree, oxidation will occur even when these chemicals are used primarily to inactivate microbes. These oxidants will reduce inorganic species (e.g., iron, manganese, sulphide) and synthetic organic compounds, and can also be used to destroy taste- and odour-causing compounds and to eliminate colour. Ozone is very reactive and undergoes spontaneous decomposition resulting in the formation of hydroxyl radicals (advanced oxidation process). Contaminants that are not degraded by molecular ozone can be appreciably oxidized by hydroxyl radicals. In many cases, the oxidation of these contaminants is enhanced at higher pH values due to the more rapid generation of hydroxyl radicals (Singer and Reckhow, 2011).
The treatment effectiveness of many oxidative processes is influenced by pH, as well as temperature, oxidant dose, reaction time and the presence of interfering substances. Oxidation reactions with chlorine tend to be more effective at low pH values, whereas the kinetic rates of oxidation involving permanganate tend to be higher with increasing pH levels (Singer and Reckhow, 2011).
The key variables that affect the oxidation of DBP precursors by ozone, prior to chlorination, are pH, alkalinity, ozone dose and the nature of the organic contaminants. At low pH, the oxidation of DBP precursors by ozone is quite effective. However, above a given critical pH, ozone is less effective and may increase the level of chlorination by-product precursors. For most humic substances, the critical pH is 7.5, as the decomposition rate of ozone to hydroxyl radicals increases rapidly. Therefore, at pH levels in the 6,0–7.0 range where molecular ozone predominates, the initial THM precursor by-products are different in nature than those formed by hydroxyl radical oxidation at higher pH levels (U.S. EPA, 1999b).
Manganese is typically removed from water using direct oxidation/coagulation/filtration or adsorption/oxidation (e.g., greensand) in a filter bed (Singer and Reckhow, 2011). Manganese in the form of dissolved Mn(II) can be directly oxidized to a MnO2(s) precipitate, which is removed downstream by a physical process such as clarification and filtration or membrane filtration. The rates of the oxidation reactions, and therefore the size of the contact basin required, are pH dependent. The principles of manganese treatment using adsorption/oxidation are based on the presence of manganese oxides on filter media. Manganese oxides are capable of adsorbing dissolved Mn(II). The oxide surface then acts as a catalyst for the oxidation of the adsorbed Mn(II) so that more oxides are produced. When employing manganese oxide–coated filter media, care must be exercised to maintain the optimal pH and oxidizing conditions in the filter bed. Both the sorption kinetics and sorption capacity are increased with increasing water pH; to ensure effective removal of manganese, slightly alkaline pH values (7.0–8.0) are recommended (Knocke et al., 1988, 1991; Kohl and Medlar, 2006).
6.6 Membrane filtration
Membrane processes incorporate semi-permeable barriers that allow selective passage of constituents. There are two main groups of membranes: (1) microfiltration (MF) and ultrafiltration (UF), which remove particles; and (2) reverse osmosis (RO) and nanofiltration (NF), which remove particles and dissolved materials (Elder and Budd, 2011). MF and UF use low-pressure membranes that remove particles larger than the pore size of the membrane. Microbes (bacteria, Cryptosporidium, Giardia) and some organic carbon can be removed by these processes. NF membranes have pore sizes between those used in UF and RO. NF and RO will remove minerals (e.g., sodium, sulphate, chloride, calcium, magnesium and bicarbonate ions), which may result in more corrosive finished water and exacerbate the release of metals in the distribution system (Duranceau and Taylor, 2011). The removal of contaminants can cause mineral imbalances that could increase the corrosive nature of the treated water (Schock and Lytle, 2011). Post-treatment adjustment of the pH and alkalinity may be required as a corrosion control measure following RO and NF (U.S. EPA, 2007).
Charge repulsion is an important rejection mechanism for RO and NF membranes. The polymeric membranes acquire surface charge when in contact with an aqueous medium, which has a significant influence on the membrane rejection characteristics (Duranceau and Tyler, 2011). Childress and Elimelech (1996) investigated the effect of the pH of the water on the surface charge of commercial RO and NF membranes. All membranes surfaces were amphoteric, being positively charged in the lower pH range, and negatively charged at pH greater than 5.0, with their isoelectric points (no charge) ranging between pH 3.0 and 5.0. Hong and Elimelech (1997) investigated the influence of pH on fouling of NF membranes by NOM, in the presence of divalent cations. The authors observed a decline in product water flux when the pH of the water was decreased to 4.0. The observation was attributed to decreased electrostatic repulsion between the membrane surface and the NOM molecules, resulting in an increased sorption rate of NOM on the membrane surface.
6.7 Ion exchange
Ion exchange is used to remove dissolved ionic constituents in the water. In drinking water treatment applications, the ion exchange process is primarily used for water softening and demineralization (e.g., removal of Ca2+ , Mg2+, SO42-). Water softening is the most widely used cation exchange process, whereby positively charged ions on the surface of the ion exchange medium are exchanged with positively charged ions in the water. This process does not alter the pH, DIC concentration, dissolved oxygen concentration, chlorine concentration, temperature or alkalinity of the finished water, but it does increase the dissolved solids content (Sorg et al., 1999; Elder and Budd, 2011). Anion exchange media replace negatively charged ions in solution (nitrate, fluoride, sulphate and arsenic) with negatively charged ions on the media (typically chloride) to remove these contaminants from water (U.S. EPA, 2012).
Strong acid cation resins operate over a very wide pH range because the functional groups attached to the matrix (sulphonate groups) are strongly acidic and are ionized throughout the entire pH range. Weak acid cation resins can exchange ions only in the neutral to alkaline pH range, as the functional groups (carboxylates) are not ionized at lower pH values. Maximum resin capacity is reached between pH 10 and 11 (Clifford et al., 2011).
The quaternary amine functional groups of strong base anion resins are ionized in the pH range of 1–13. Weak base anion exchange resins are useful only at acidic pH (< 6), where functional groups can act as positively charged exchange sites for anions (Clifford et al., 2011).
6.8 Air stripping and aeration
Air stripping and aeration are gas transfer processes that can remove dissolved gases such as hydrogen sulphide (H2S) and carbon dioxide, oxidize iron and manganese, and remove some tastes and odours from water. These processes are also used to remove volatile organic compounds (VOCs) and radon from solution. The rate of the gas transfer process for these constituents in solution is affected by pH and the constituent’s solubility in water relative to its corresponding partial pressure in the gas phase. For example, at neutral pH, ammonia exists as an ion in water and cannot be stripped. At higher pH (above 9 or 10), however, it becomes soluble and can be stripped (Hand et al., 2011).
6.9 pH adjustment in drinking water treatment and distribution systems
In drinking water treatment plants, pH can be adjusted at various points to optimize the efficiency of treatment processes such as coagulation or disinfection. Adjusting the pH will affect the effectiveness of coagulation to remove organic matter and turbidity and can affect the efficiency of primary and secondary disinfection. It also affects the formation of DBPs. Adjusting the pH of treated water may help reduce the release of metals in distributed water; for example, raising the pH remains one of the most effective methods for minimizing lead and iron levels in distributed drinking water.
Treatment chemicals used for adjusting pH include caustic soda, potash, lime and sulfuric acid. Minimal pH adjustment can also be achieved using CO2, with either sodium carbonate or sodium bicarbonate; however, this combination primarily adjusts alkalinity. Aeration is a non-chemical treatment method that introduces air in the water, removing CO2 and resulting in a pH increase. Another method of adjusting pH is the use of limestone contactors: water flows through a bed of crushed limestone, dissolving the limestone and causing the pH (as well as alkalinity [or DIC concentration] and calcium level) to increase. These last two methods offer less precise control of the pH adjustment. A combination of lime or caustic soda and carbon dioxide offers more precise control, as it allows the pH and alkalinity of the water to be independently adjusted.
7.0 Distribution system considerations
7.1 Water distribution systems and pH changes
Chemical, physical and biological factors can affect the pH of treated water throughout the treatment and distribution systems. The ability of water to provide buffering against a pH change is related to pH, alkalinity and DIC concentration. As discussed previously, waters with enough DIC will be less prone to pH fluctuations because bicarbonate and carbonate ions in the water will buffer the change. The greatest buffering occurs at pH 6.3 and above pH 9. Therefore, distributed waters in the pH 8–8.5 range with low concentrations of DIC (< 10 mg C/L) will tend to have highly variable pH in the distribution system. These waters will be prone to pH decreases caused by uncovered storage facilities, nitrification activity in the distribution system and corrosion of cast iron pipes. They may also experience pH increases in the distribution system if cement pipes are present. Degradation of cement-based materials can be a source of calcium hydroxide (lime) in distributed water, potentially resulting in an increase in pH and alkalinity.
Adequate buffering in the distribution system is important to control corrosion (Schock and Lytle, 2011). If pH is adjusted to control the release of lead and copper, it is essential that the target pH be maintained in the distribution system out to the premise piping where the release of metals occurs. Use of phosphate corrosion inhibitors to control the release of lead and copper requires strict pH ranges for the inhibitors to be effective. Even when the pH of the finished water is maintained in the appropriate range for the inhibitor (pH 7.2–7.8), pH changes in the distribution system from inadequate buffering may decrease the effectiveness of the orthophosphate inhibitor.
Nitrification in the distribution system is associated with the use of chloramines as a secondary disinfectant and the presence of excess ammonia. Nitrification may lower the pH and alkalinity of the water, potentially accelerating brass corrosion and causing problems with lead release (Skadsen, 2002; Douglas et al., 2004).
Spikes in pH due to the long retention time in asbestos-cement or other cement-lined piping can create regions in the distribution system with high pH (Leroy et al., 1996; Kirmeyer et al., 2000) and elevated levels of THMs (Kirmeyer et al., 2000).
7.2 Relationship between pH and corrosion
The effect of pH on the solubility of by-products formed during the corrosion process (e.g., lead solids, passivating scales) is key to understanding the concentration of metals at the tap. The release of metals from materials used in distribution and premise piping systems will be affected by pH, but also by the alkalinity and DIC levels of the water, as they influence the formation of the passivating scale on the surface of the material. The presence of these passivating scales on pipe surfaces will help prevent the release of lead or copper to the water (Schock and Lytle, 2011). The impact of pH on the release of each of these metals is discussed below.
Lead can be released from a variety of lead-based materials used in the distribution and premise piping systems. These materials include smaller-diameter lead service lines, galvanized piping, lead solder, brass and bronze components, faucets and fittings in residences and other buildings. The solubility of the main lead corrosion by-products—namely, divalent lead [Pb(II)] solids such as cerussite (PbCO3), hydrocerussite [Pb3(CO3)2(OH)2] and lead hydroxide [Pb(OH)2]—largely determines the lead levels at the tap (Schock, 1980, 1990; Sheiham and Jackson, 1981; Boffardi, 1988, 1990; U.S. EPA, 1992; Leroy, 1993). Depending on the pH and alkalinity of the water, minerals in the passivating scales will vary. For example, a study by McNeill and Edwards (2004) showed that at pH 7.2, hydrocerussite was the dominant scale present at an alkalinity of 15 mg/L as CaCO3, but that cerussite dominated when the alkalinity was 300 mg/L as CaCO3. However, at an alkalinity of 45 mg/L as CaCO3, cerussite was the dominant scale at pH 7.2, whereas hydrocerussite dominated at pH 7.8.
In distribution systems, lead corrosion by-products are typically less soluble in water with higher pH. The examination of utility data shows that the lowest levels of lead at the tap are associated with pH levels above 8 (Karalekas et al., 1983; Lee et al., 1989; Dodrill and Edwards, 1995; Douglas et al., 2004). Several water systems have increased pH to the 9–10 range for optimum control of lead release (Douglas et al., 2004; MOE, 2009; Massachusetts Water Resources Authority, 2010). Theoretical lead solubility models for Pb(II) show that the lowest lead levels occur when the pH is around 9.8 (Schock, 1989; Schock et al., 1996). However, theoretical solubility relationships have not yet been developed for Pb(IV) solids; as a result, this optimum pH may not be valid for controlling lead release when water quality conditions favour the formation of tetravalent lead [Pb(IV)] scales, such as lead dioxide (PbO2). Interestingly, Pb(IV) solids have been found on lead pipes from several water systems with high oxidation–reduction potential (Schock et al., 1996; Schock and Lytle, 2011). Lead dioxide has been found to be present in waters of low pH and frequently in waters with high alkalinity (Schock et al., 2001, 2005). Lytle and Schock (2005) also showed that Pb(IV) compounds formed rapidly at pH 6–6.5 in water with relatively high free chlorine residuals (highly oxidative conditions).
Release of lead from leaded solder is primarily controlled by galvanic corrosion, and increasing pH has been associated with a decrease in the corrosion of leaded solders (Oliphant, 1983; Schock and Lytle, 2011). Use of orthophosphates for lead control depends on strict maintenance of distribution system pH in the 7.2–7.8 range in order to form Pb(II) orthophosphate passivating films.
The release of copper is highly pH dependent. When copper corrodes, it is oxidized to Cu(I) (cuprous) and Cu(II) (cupric) species, which may form protective copper carbonate–based (passivating) scales on the surface of copper plumbing materials. The formation of scales depends on pH and on levels of DIC and oxidizing agents in the water (Atlas et al., 1982; Pisigan and Singley, 1987; Schock et al., 1995; Ferguson et al., 1996). In general, copper solubility increases (i.e., copper levels increase) with increasing DIC concentration and decreasing pH (Schock et al., 1995; Ferguson et al., 1996). Copper levels may be adequately controlled at pH levels that are lower than those that might be considered optimum for controlling lead release. Groundwaters that have high alkalinity and high DIC levels are prone to copper corrosion problems. In these cases, adjusting pH may be impractical because of the potential for calcium carbonate precipitation.
Release of iron from iron-based drinking water materials, such as cast iron, steel and ductile iron, has been modelled based on the formation of protective ferrous solid scales (FeCO3). Iron levels in the bulk water were generally reported to decrease with increasing pH (Karalekas et al., 1983; Kashinkunti et al., 1999; Sarin et al., 2003), as both the corrosion rate and the degree of tuberculation of iron generally increase with increasing pH, particularly in the pH range of 7.0–9.0 (Larson and Skold, 1958; Stumm, 1960; Pisigan and Singley, 1987). The rate of oxidation of iron increases with increasing pH, resulting in both decreased iron release and red water episodes. Waters with high buffer intensity will mitigate changes in pH, and a relatively stable pH will encourage the formation of the more protective ferrous-based solids and result in lower iron release.
Zinc coatings on iron and galvanized steel corrode similarly to iron, but the corrosion reactions are typically slower. When the pipe is new, corrosion depends strongly on pH. Pisigan and Singley (1985) found that below pH 7.5, zinc levels increased in drinking water (DIC concentration of 50 mg C/L). At pH levels of 7.5–10.4, hydrozincite, the most stable corrosion by-product, predominates. Very alkaline waters (i.e., pH > 10.4) can be aggressive to zinc and will often remove galvanized coatings (zinc hydroxides predominate). The nature of the passivating film formed on the pipe changes in response to various chemical factors. Water with moderate levels of DIC and high buffer intensity appear to produce good passivating films (Crittenden et al., 2012). Studies have shown increases in the corrosion rate of zinc with increasing carbonate hardness, even in the presence of orthophosphate. This increase may be caused by the formation of aqueous carbonate complexes that increase zinc solubility (Schock and Lytle, 2011).
Water with low pH, low alkalinity and low calcium is aggressive towards cement materials. Asbestos-cement pipes are particularly susceptible to low-pH (pH < 7.5–8.0) waters with high (400 mg/L) sulphate levels (Leroy et al., 1996; Schock and Lytle, 2011). Lime from the cement releases calcium and hydroxide ions into the drinking water and can result in a substantial pH increase, depending on the buffering capacity of the water (Leroy et al., 1996). More detailed information on corrosion control may found in the guidance document on controlling corrosion in the distribution system (Health Canada, 2009).
7.3 Examples of utilities distributing water at pH above 8.5
In a national survey conducted by Health Canada in 2009 and 2010, the pH levels of 127 samples of treated and distribution system water were measured at 64 treatment plants in winter and summer. Data showed that 12.5% of the treatment plants distributed water at a pH above 8.5, with one plant achieving a distributed water pH of 9.6 (Health Canada, 2012b). In both Canada and the United States, many systems have adjusted the distributed water pH to levels above 8.5 specifically to control lead. These include treatment plants in Ottawa, Ontario (Douglas et al., 2007); Saskatoon, Saskatchewan (City of Saskatoon, 2012); Boston, Massachusetts (Massachusetts Water Resources Authority, 2010); Cincinnati, Ohio (Miller and Bolton plants) (Greater Cincinnati Water Works, 2012); San Francisco and Oakland, California (Wilczak et al., 2010); Ann Arbor, Michigan (Skadsen, 2002); and Providence, Rhode Island (Yanonni and Covellone, 1998; Marchand and Rabideau, 2011). Eight of these systems (all systems listed above, except for the Miller Plant in Cincinnati) provide finished drinking water at pH 9.0 or above, with Providence maintaining a pH of 10.2 in the distributed water (Marchand and Rabideau, 2011). These water systems are operating their treatment processes to provide optimum removal or inactivation of microbiological, physical and chemical contaminants while also attempting to minimize metal release in their distribution systems.
8.0 Health effects of pH
Taken as a whole, the evidence shows no association between the pH of the diet (food or drinking water) and direct adverse health effects, although irritation of the skin and mucosa can occur following dermal exposure to extreme pH values (WHO, 2007). However, pH can influence the solubility of certain substances in the distribution system, increasing the risk of exposure to contaminants and potentially resulting in adverse health effects.
8.1 Regulation of pH in the human body
The digestion of most food items and physiological processes such as cell respiration can produce variations in the acid or base load within the human body (Cordain et al., 2005). The human body maintains homeostasis by continuously absorbing and handling pH variations to maintain the pH in the blood between 7.36 and 7.4 (Arnett, 2007; Vormann and Remer, 2008). The human body has three main systems to do this, including chemical buffers (e.g., carbonate, carbonic acid), which prevent immediate pH changes. In addition, ventilation through the lungs and reabsorption and excretion of ions by the renal system are systems for the short- and long-term regulation of pH. Metabolic acidosis (low pH of body fluids) or alkalosis (increased pH of body fluids) may result from critical illnesses or extreme events, such as severe vomiting, diarrhea, renal, bronchial or gastrointestinal disease, diabetes and excessive protein intake, as well as intense exercise, aging or menopause (Swenson, 2001; Cordain et al., 2005; Institute of Medicine, 2005; Arnett, 2007; Kaplan and Kallum, 2011).
8.2 Diet and pH
Whether the pH of the diet can influence the pH of the blood is controversial (Buclin et al., 2001; Vormann and Goedecke, 2006; Fenton and Lyon, 2011). It has been hypothesized that a diet comprising food items that generate high doses of acid compounds after metabolism (high in protein, low in fruits and vegetables) lowers the acid-buffering capacity of the body (Vormann and Goedecke, 2006). An increase in the risk of developing chronic diseases, such as osteoporosis, has been suggested in observational studies (Marsh et al., 1988; Tucker et al., 1999; Frassetto et al., 2000).
A lower physiological pH (based on sodium and serum bicarbonate levels) was associated with higher levels of metabolic inflammation markers (C-reactive protein and leukocyte count) in adults participating in the U.S. National Health and Nutrition Examination Survey during 1999–2006 (Farwell and Taylor, 2010). However, the cross-sectional study design prevents the conclusion of a cause–effect relationship, and multiple biases (e.g., the participants did not eat controlled diets) could have influenced the results.
The effects reported above are not applicable to drinking water pH. The acids and bases found in drinking water are extremely diluted and, as such, do not influence the pH of the body. Similarly, food items that have a naturally low pH (e.g., lemon juice and vinegar, with pH values of 3.4 and 2.8, respectively) do not represent a health risk to individuals who consume them (WHO, 2007).
8.3 Secondary effects of pH
As mentioned in previous sections, the pH of drinking water is closely related to other aspects of water quality (Nordberg et al., 1985; NHMRC, 1996). Acidic water can mobilize certain metals from the soil and pipe systems, make them more bioavailable and change their toxicity (Nordberg et al., 1985; Traina and Laperche, 1999; Langmuir et al., 2005). For example, the concentrations of aluminum, cadmium, selenium, arsenic, lead and copper in drinking water can be increased by low pH, which may present a risk to human health (NHMRC, 1996). However, the change in toxicity with altered pH is metal and organism specific (Ho et al., 1998; Tan and Wang, 2011).
8.4 Effects on skin
8.4.1 Skin irritation in humans
Extreme pH values (over 11 and under 4) can enhance the skin irritation effects of certain solutions.
Healthy men in the U.S. Army developed rashes, vesicles, bullae and subungual purpura (bleeding under the fingernails) on their hands after they were immersed in very hot water containing a strong machine detergent (sodium metasilicate, sodium tripolyphosphate and sodium carbonate) at pH 11.35 for an estimated 4 to 8 hours (Goldstein, 1968). It was not possible to clearly distinguish which agent was responsible for the effects.
Skin vapour loss (a measure of damage of the stratum corneum of the skin) was measured in 19 healthy volunteers exposed to one of five commercial soaps (pH 3.6–10.33) or distilled water (pH 5.6) for 24 hours (Hassing et al., 1982). The effect of soaps with pH 10.33 or 5.86 did not differ from that of distilled water. However, soaps with pH 5.78 and pH 3.6 induced a significant increase in skin vapour loss. Skin vapour loss on the forearm increased sharply in two male volunteers after exposure to sodium hydroxide (NaOH) in solution at a pH of over 11.3 for 1 hour (Spruit and Malten, 1968). Blisters formed at pH 11.95. Solutions at pH 7.0, 8.0, 9.0 or 10.0 had no effect on intact skin.
Hand cleaners with pH in the range 3.5 to 10.07 were tested for irritancy (van Ketel et al., 1984). The scores were based on the severity of erythema, scaling and fissuring of hand skin. Only the most acidic one (pH 3.5) significantly increased the severity of erythema and fissuring.
Wahlberg (1984) applied different concentrations of sodium hydroxide in distilled water (pH 11.6, 11.7 and 12.7) or soluble oil (pH 10) on the thighs of a healthy man for 5 minutes. Only the solution at pH 12.7 produced a significant increase in blood flow and erythema. Hansen (1983) investigated skin disease in 541 cleaning women working in a hospital in Denmark and in a control group of 157 shop assistants doing mostly dry work. The cleaning women were exposed to trademark detergents (often alkaline) via patches on their back for 48 hours. The cleaners had significantly more occupational dermatosis (prevalence of 15.3%), characterized by erythema with infiltration of papules or vesicles, compared with the control group (odds ratio = 2.00, P < 0.025). The detergents contained many substances, among which were allergens (formaldehyde, nickel, etc.), alkaline compounds (sodium carbonate, trisodium phosphate, sodium metasilicate, etc.) and acidic compounds (phosphoric acid, hydrochloric acid, etc.). It was not possible to clearly determine which agent was responsible for the effects.
8.4.2 Skin irritancy in animals
The pH of different substances applied to animal skin was not found to be a good indicator of irritancy, but it seemed to enhance the skin-damaging effects of substances.
The irritancy of 56 chemicals (liquid or solid form) used in the cosmetic industry on the skin of albino rabbits (New Zealand strain) exposed for 4 or 23 hours was evaluated by three different protocols: 1) the official French government test method for assessing irritancy of cosmetics and toiletries, 2) the methods of the Association française de Normalisation (AFNOR) and 3) the Organisation for Economic Co-operation and Development (OECD) method for skin products (Guillot et al., 1982b). pH was not found to be a good indicator of the irritant potency of these chemicals. For example, whereas dimethyl sulphate (pH 1) was a severe irritant, oxalic acid (pH 1) was only moderately irritating, and three other compounds with pH values between 2 and 3 were not irritating. The authors indicated that alkaline substances tended to be irritants, but other chemical properties were responsible for enhancing the effects. Similar results were obtained with chemicals with pH values above 10, which were classified as non-irritant to moderately irritant, for both liquid and solid forms.
Mice injected intracutaneously in the abdominal skin with an isotonic solution (1:1 histidine glutamate and lysine glutamate) showed signs of irritation at and below pH 4 and at and above pH 10 (Bucher et al., 1979). pHs were adjusted with hydrochloric acid (HCl) and sodium chloride (NaCl).
8.5 pH effects on human and animal eyes
Swelling and opacities of the cornea, conjunctivitis, pannus and keratoconus were observed after animal eyes were exposed to acids and alkalis. The irritating effect of water depends on the pH level and the buffering capacity of the water and the exposed tissue. In theory, water with low buffering capacity (low concentration of carbonic species) and a pH between 3.5 and 10.5 can be neutralized by lacrimal fluid (McKean and Nagpal, 1991).
Normal eyes of humans (six men) and rabbits (21 rabbits) were exposed to lake water samples (two inland lakes in Ontario: Clearwater Lake, pH 4.5, acid neutralizing capacity of −40 µeq/L; and Red Chalk Lake, pH 6.5, acid neutralizing capacity of 70 µeq/L) for 5 and 15 minutes, respectively. Except for conjunctival congestion, no symptoms or adverse effects were observed on the external eye for any subjects. The authors concluded that lake water having a pH as low as 4.5 is not harmful to the external ocular tissues (Basu et al., 1982, 1984).
Rabbit and human corneas (from donors to the Wisconsin Lions human eye bank) were exposed for 3 hours to a solution of varying pH (3.5–10) composed of salts used as vehicles for intraocular drugs (Gonnering et al., 1979). A significant increase in swelling of rabbit corneas occurred outside of the pH range 6.5–8.5 (P > 0.001). Electron microscopy revealed ultrastructural alterations of the corneal endothelial cells (cytoplasmic swelling and disrupted cellular junctions). No details were provided for the effects of solutions with pH above 8.5 on human corneas. The only information provided on human effects was swelling of the cornea at pH 5.5. The authors stated that the swelling of the cornea in rabbits and humans could have been prevented with the use of a more complete solution (i.e., containing glucose and bicarbonate).
The ocular irritancy of 56 chemicals (liquid or solid form) used in the cosmetic industry was evaluated using albino rabbits (New Zealand strain) exposed for 4 or 23 hours (Guillot et al., 1982a). The substances were instilled into the lower conjunctiva of one eye of the rabbits and observed for 1 hour and 1, 2, 3 and 4 days afterward. The substances’ irritancy (non-irritant, slightly irritant, moderately irritant or severely irritant) was scored on a 1–8 scale based on the severity of erythema and oedema at the treatment site. Substances with pH lower than 2 were all classified as severely irritant; pH 2 to 3, moderately to severely irritant; pH 10 to 11, moderately to severely irritant; and pH 7, generally non-irritant or slightly irritant, except for two substances classified as severely irritant.
Another study looked at the effects of exposure time and different concentrations of acids and alkalis dropped on the corneas of the eyes of New Zealand rabbits (two groups of at least six rabbits per test material; Murphy et al., 1982). Generally, acids (pH 0.1 to 2.7) and alkalis (pH 11.3 to 13.5) produced opacities of the corneas, conjunctivitis, pannus and keratoconus. Acid-caused opacities resulted from coagular necrosis, whereas alkali-caused opacities resulted from liquefaction necrosis. All alkalis produced toxicity above pH 12.8. Severity increased with length of exposure, and weaker acids and bases required longer exposure to produce opacities. The authors stated that other factors probably contribute to irritancy, such as the concentration of the substance, its penetrability and its intrinsic activity. For example, solutions of hydrochloric acid (pH 1.28), citric acid (pH 2.1) and sodium hydroxide (pH 12.8) did not have an effect, whereas phenol (pH 7.7) produced opacities.
Generally, small pH variations have no effect on the eye because of its buffering capacity. The evidence for adverse effects on the eye is not detailed enough to conclude on a safe pH range, although conjunctivitis, swelling and opacities of the corneas tend to occur at extreme values of pH of the tested solutions (outside the range of pH 5–11).
8.6 pH and dental caries
Groeneveld and Arends (1975) suggested that buccal pH influenced the development of dental caries. To test this, 15 extracted human premolars were exposed to a decalcifying agent (hydroxybutylcellulose and lactic acid) in a buffering solution of varying pH (4, 4.5 or 5) for 4, 6, 9 or 11 days. The pH influenced the demineralization and the thickness of the surface layer only slightly. However, the depth of sub-surface lesions increased by a factor of 2 at pH levels between 5 and 4 after 11 days. There was also a marked increase in phosphate loss below pH 3 (Cutress, 1966; de Rooij and Arends, 1983).
Powdered human dental enamel and dentine exposed in vitro to alkaline phosphatase enzyme preparations from Escherichia coli resulted in higher liberation of phosphate by enzymatic hydrolysis of organic constituents at pH 7 (Makinen and Paunio, 1970).
8.7 pH and hair
A man’s head received drops of a pipe anti-clotting agent (product not specified) containing sodium hydroxide at pH 13.5 (Morris, 1952). The following day, loss of hair, pustules and erythematous skin of the affected area occurred, all of which eventually subsided (time frame not mentioned).
A solution of caustic soda or potash with pH above 9.2 has been shown to hydrolyze and decompose disulphide bonds of the cystine of keratin of wool, similar to its effects on human hair and nails in vitro (Chiego and Silver, 1942).
9.0 Assessment
The main direct adverse effect induced by extreme pH values (under 5 and over 11) is an increase in skin and eye irritancy. There is no convincing evidence that pH at the levels found in drinking water can significantly alter the pH of the body. Extreme pH values can produce secondary health effects by changing the solubility and toxicity of certain substances potentially found in drinking water distribution systems. This involves many factors, such as the composition of the piping system and the source water quality, rendering the assessment very complex. These health effects would be addressed in the appropriate guideline technical document.
There are insufficient data available to allow the establishment of a health-based guideline for pH. The main health considerations associated with pH are indirect. Protection of health is achieved through the control of pH for the proper operation of processes for contaminant removal, maintaining water quality, maintaining the integrity of the drinking water distribution system components and effectively and safely implementing the disinfection process.
9.1 International considerations
No recognized organization has established a health-based value for the pH of drinking water. All the regulations and recommendations have set a pH range of 6.5–8.5 based on drinking water disinfection optimization and what was believed to be minimization of corrosion of plumbing components at the time they were developed. The U.S. EPA (1988) listed pH in the National Secondary Drinking Water Regulations (non-mandatory standard) based on aesthetic concerns, noting that drinking water with a low pH could cause a bitter metallic taste, whereas high pH could cause a slippery feel and a soda taste. However, corrosion control knowledge has dramatically advanced in recent years, and regulatory authorities have permitted many utilities to operate above this range to address lead release and disinfection considerations (e.g., chloramine stability). To this end, the U.S. EPA (2013) is currently considering revising its Secondary Maximum Contaminant Level for pH.
WHO (2007) and Australia (NHMRC, 2011) stated that any effect of pH on health is likely to be indirect and related either to increased ingestion of metals from plumbing and pipes or to inadequate disinfection. WHO (2007) listed the optimum pH for water supplies as 6.5–9.5 and also stated that the optimum level will vary, depending on the composition of the water and the materials used in the distribution system.
10.0 Rationale
There is no convincing evidence that pH at the levels found in drinking water can directly affect health. As such, there are no specific health effects on which to base limits for the pH of finished drinking water. pH is an important parameter to monitor and control throughout the treatment and distribution systems, in order to maximize the efficiency of treatment processes while minimizing the formation of DBPs and the leaching of metals from materials.
Current science indicates that the acceptable pH range for finished drinking water should be flexible to allow systems to determine the most appropriate pH for their individual water quality goals. The acceptable pH range of 7.0 to 10.5 for finished drinking water provides utilities the flexibility required to achieve water quality objectives and control contaminant concentrations and corrosion by combined treatment approaches that are appropriate to the materials in the distribution system and premise plumbing.
11.0 References
Aieta, E. and Berg, J. (1986). A review of chlorine dioxide in drinking water treatment. J. Am. Water Works Assoc., 78(6): 62–72.
Amy, G. and Chadik, P. (1983). Cationic polyelectrolytes as primary coagulants for removing trihalomethane precursors. J. Am. Water Works Assoc., 75(10): 527–531.
Amy, G., Westerhoff, P., Minear, R. and Song, R. (1997). Formation and control of brominated ozone by-products. Water Research Foundation, Denver, Colorado.
APHA, AWWA, WEF (1992). Standard methods for the examination of water and wastewater, 18th edition. American Public Health Association, American Water Works Association and Water Environment Federation, Washington, DC.
APHA, AWWA, WEF (1995). Standard methods for the examination of water and wastewater, 19th edition. American Public Health Association, American Water Works Association and Water Environment Federation, Washington, DC.
APHA, AWWA, WEF (1998). Standard methods for the examination of water and wastewater, 20th edition. American Public Health Association, American Water Works Association and Water Environment Federation, Washington, DC.
APHA, AWWA, WEF (2005). Standard methods for the examination of water and wastewater, 21st edition. American Public Health Association, American Water Works Association and Water Environment Federation, Washington, DC
APHA, AWWA, WEF (2011). Standard methods for the examination of water and wastewater, 4500-H+ pH value. American Public Health Association, American Water Works Association and Water Environment Federation, Washington, DC. Available at: www.standardmethods.org/Store/ProductView.cfm?ProductID=185
APHA, AWWA, WEF (2012). Standard methods for the examination of water and wastewater, 22nd edition. American Public Health Association, American Water Works Association and Water Environment Federation, Washington, DC.
Arnett, T.R. (2007). Acid–base regulation of bone metabolism. Int. Congr. Ser., 1297: 255–267. Available at:www.homepages.ucl.ac.uk/~ucgatma/Anat3048/PAPERS%20etc/International%20Congress%20Series%201297,%20255-267%20(2007).pdf
ASTM (1984). D1293-84: Standard test methods for pH of water. ASTM International, West Conshohocken, Pennsylvania.
ASTM (1995). D1293-95: Standard test methods for pH of water. ASTM International, West Conshohocken, Pennsylvania.
Atlas, D., Coombs, J. and Zajicek, O.T. (1982). The corrosion of copper by chlorinated drinking waters. Water Res., 16: 693–698.
Barbeau, B., Huffman, D., Mysore, C., Desjardins, R., Clément, B. and Prévost, M. (2005). Examination of discrete and confounding effect of water quality parameters during the inactivation of MS2 phages and Bacillus subtilis spores with chlorine dioxide. J. Environ. Eng. Sci., 4: 139–151.
Basu, P.K., Avaria, M. and Hasany, S.M. (1982). Effects of acidic lake water on the eye. Can. J. Ophthalmol., 17(2): 74–78.
Basu, P.K., Avaria, M., Cutz, A. and Chipman, M. (1984). Ocular effects of water from acidic lakes: an experimental study. Can. J. Ophthalmol., 19(3): 134–141.
Benarde, M., Israel, B., Olivieri, V. and Grandstorm, M. (1965). Efficiency of chlorine dioxide as bactericide. Appl. Microbiol., 13(5): 776–780.
Berman, D. and Hoff, J. (1984). Inactivation of simian rotavirus SA11 by chlorine, chlorine dioxide, and monochloramine. Appl. Environ. Microbiol., 48(2): 317–323.
Boffardi, B.P. (1988) Lead in drinking water-causes and cures. Public Works, 119(11): 67-70.
Boffardi, B.P. (1990) Minimization of lead corrosion in drinking water. Mater. Perform., 29(8): 45-49.
Bucher, K., Bucher, K.E. and Walz, D. (1979). Irritant actions of unphysiological pH values. A controlled procedure to test for topical irritancy. Agents Actions, 9(1): 124–132.
Buclin, T., Cosma, M., Appenzeller, M., Jacquet, A.F., Decosterd, L.A., Biollaz, J. and Burckhardt, P. (2001). Diet acids and alkalis influence calcium retention in bone. Osteoporos. Int., 12(6): 493–499.
Butler, J.N. and Cogley, D.R. (1998). Ionic equilibrium solubility and pH calculations. John Wiley & Sons, New York, New York.
Carlson, K., Via, S., Bellamy, B. and Carlson, M. (2000). Secondary effects of enhanced coagulation and softening. J. Am. Water Works Assoc., 92(6): 63–75.
Charrois, J.W.A. and Hrudey, S.E. (2007). Breakpoint chlorination and free-chlorine contact time: implications for drinking water N-nitrosodimethylamine concentration. Water Res., 41: 674–682.
Chen, Y., Sproul, O. and Rubin, A. (1985). Inactivation of Naegleria gruberi cysts by chlorine dioxide. Water Res., 19(60): 783–789.
Chiego, B. and Silver, H. (1942). The effect of alkalis on the stability of keratins. J. Invest. Dermatol., 5(95).
Childress, A. and Elimelech, M. (1996). Effect of solution chemistry on the surface of polymeric reverse osmosis and nanofiltration membranes. J. Memb. Sci. 119:253–268.
City of Saskatoon (2012). Typical water quality characteristics. Water and Wastewater Treatment Branch, Saskatoon, Saskatchewan. Available at: www.saskatoon.ca/DEPARTMENTS/Utility%20Services/Water%20and%20Wastewater%20Treatment/Water%20Treatment%20Plant/Treatment%20Process/Pages/WaterQualityDetails.aspx
Clark, R. and Boutin, B. (2001). Controlling disinfection by products and microbial contaminants in drinking water. National Risk Management Research Laboratory, Office of Research and Development, U.S. Environmental Protection Agency, Cincinnati, Ohio 45268. (EPA/600/R-01/110).
Clement, J.A. and Schock, M.R. (1998). Buffer intensity: what it is, and why it’s critical for controlling distribution system water quality. In: Proceedings of the AWWA Water Quality Technology Conference, San Diego, California. American Water Works Association, Denver, Colorado.
Clifford, D.A. (1999). Chapter 9: Ion exchange and inorganic adsorption. In: Water quality and treatment: a handbook of community water supplies, 5th edition. Letterman, R.D. (ed.). American Water Works Association, Denver, CO; McGraw-Hill, New York, New York.
Clifford, D.A., Vijjeswarapu , W. and Subramonian , S. (1988). Evaluating various adsorbents and membranes for removing radium from groundwater. J. Am. Water Works Assoc., 80: 94–104.
Clifford, D., Sorg, T. and Ghurye, G. (2011). Chapter 12: Ion exchange and adsorption of inorganic contaminants. In: Water quality and treatment: a handbook on drinking water, 6th edition. Edzwald, J.K. (ed.). American Water Works Association, Denver, CO; McGraw-Hill, New York, New York.
Cordain, L., Eaton, S.B., Sebastian, A., Mann, N., Lindeberg, S., Watkins, B.A., O’Keefe, J.H. and Brand-Miller, J. (2005). Origins and evolution of the western diet: Health implications for the 21st century. Am. J. Clin. Nutr., 81(2): 341–354.
Crittenden, J.C., Trussell, R.R., Hand, D.W., Howe, K.J. and Tchobanoglous, G. (2012). Water treatment: principles and design, 3rd edition. John Wiley & Sons, Hoboken, New Jersey.
Cutress, T.W. (1966). Effect of sodium fluoride solutions of varying pH on solubility of bovine enamel. Arch. Oral Biol., 11(1): 121–130.
Daniel, P. (1998). Balancing multiple water quality objectives. American Water Works Association Research Foundation, Denver, Colorado. 80235-3098.
de Rooij, J.F. and Arends, J. (1983). Phosphate diffusion in whole bovine enamel. III. pH dependency. Caries Res., 28(7): 575.
Dodrill, D.M. and Edwards, M. (1995). Corrosion control on the basis of utility experience. J. Am. Water Works Assoc., 87(7): 74–85.
Douglas, I., Guthmann, J., Muylwyk, Q. and Snoeyink, V. (2004). Corrosion control in the city of Ottawa—comparison of alternatives and case study for lead reduction in drinking water. In: Proceedings of the 11th Canadian National Drinking Water Conference and 2nd Policy Forum, April 3–6, Calgary, Alberta. Robertson, W. and Brooks, T. (eds.). Canadian Water and Wastewater Association, Ottawa, Ontario.
Douglas, I., Campbell, A. and Muylwyk, Q. (2007). Lead control in soft water: Experience from a Canadian utility. In: Proceedings of the Annual Conference and Exposition, June 2007. American Water Works Association, Denver, Colorado.
Duranceau, S.J. and Taylor, J.S. (2011). Chapter 11: Membranes. In: Water quality and treatment: A handbook on drinking water, 6th edition. Edzwald, J.K. (ed.). American Water Works Association, Denver, Colorado.; McGraw-Hill, New York, New York.
Dye, J.F. (1952). Calculation of effect of temperature on pH, free carbon dioxide, and the three forms of alkalinity. J. Am. Water Works Assoc., 44(4): 356–372.
Edwards, M. and Dudi, A. (2004). Role of chlorine and chloramine in corrosion of lead-bearing plumbing materials. J. Am. Water Works Assoc., 96(10): 69–81.
Edwards, M. and Reiber, S. (1997a). A general framework for corrosion control based on utility experience. American Water Works Association Research Foundation, Denver, Colorado (AwwaRF Report 90712A).
Edwards, M. and Reiber, S.H. (1997b). Predicting Pb and Cu corrosion by-product release using CORRODE software. American Water Works Association Research Foundation, Denver, Colorado (AwwaRF Report 90712B).
Edzwald, J.K. and Tobiason, J.E. (2011). Chapter 3: Chemical principles, source water composition, and watershed protection. In: Water quality and treatment: A handbook on drinking water, 6th edition. Edzwald, J.K. (ed.). American Water Works Association, Denver, Colorado; McGraw-Hill, New York, New York.
Elder, D. and Budd, G. (2011). Chapter 5: Overview of water treatment processes. In: Water quality and treatment: A handbook on drinking water, 6th edition. Edzwald, J.K. (ed.). American Water Works Association, Denver, Colorado; McGraw-Hill, New York, New York.
Farwell, W.R. and Taylor, E.N. (2010). Serum anion gap, bicarbonate and biomarkers of inflammation in healthy individuals in a national survey. Can. Med. Assoc. J., 182(2): 137–141.
Fenton, T.R. and Lyon, A.W. (2011). Milk and acid–base balance: proposed hypothesis versus scientific evidence. J. Am. Coll. Nutr., 30(5 Suppl. 1): 471S–475S.
Ferguson, J.L., von Franqué, O. and Schock, M.R. (1996). Corrosion of copper in potable water systems. In: Internal corrosion of water distribution systems, 2nd edition. American Water Works Association Research Foundation and DVGW Technologiezentrum Wasser, Denver, Colorado, pp. 231–268.
Fleischacker, S. and Randtke, S. (1983). Formation of organic chlorine in public water supplies. J. Am. Water Works Assoc., 75(3): 132–138.
Forsyth, J., Zhou, P., Mao, Q., Asato, S., Mashke, J. and Dodd, M. (2013). Enchanced inactivation of Bacillus subtilis spores during solar photolysis of free available chlorine Environ.. Sci.Technol., 47:12976–12984
Frassetto, L.A., Todd, K.M., Morris, R.C., Jr. and Sebastian, A. (2000). Worldwide incidence of hip fracture in elderly women: Relation to consumption of animal and vegetable foods. J. Gerontol. A Biol. Sci. Med. Sci., 55(10): M585–M592.
Gates, D., Ziglio, G. and Ozekin, K. (2009). State of science of chlorine dioxide in drinking water. Water Research Foundation and Fondazione AMGA, Denver, Colorado 80235.
Goldstein, N. (1968). “KP” dermatitis. J. Occup. Med., 10(8): 423–425.
Gonnering, R., Edelhauser, H.F., Van Horn, D.L. and Durant, W. (1979). The pH tolerance of rabbit and human corneal endothelium. Invest. Ophthalmol. Vis. Sci., 18(4): 373–390.
Gordon, G. (2001). Is all chlorine dioxide created equal? J. Am. Water Works Assoc., 93(4): 163–173.
Gordon, G., Slootmaekers, B., Tachiyashiki, S. and Wood, D., III (1990). Minimizing chlorite ion and chlorate ion in water treated with chlorine dioxide. J. Am. Water Works Assoc., 82(4): 160–165.
Gordon, G., Adam, L. and Bubnis, B. (1995). Minimizing chlorate formation in drinking water when hypochlorite ion is the chlorinating agent. American Water Works Association Research Foundation, Denver, Colorado.
Greater Cincinnati Water Works (2012). 2010 annual report. Greater Cincinnati Water Works, Cincinnati, Ohio. Available at: www.cincinnati-oh.gov/water/linkservid/D146DA6A-B1D7-4099-AD3A66E6D2FCF553/showMeta/0/
Groeneveld, A. and Arends, J. (1975). Influence of pH and demineralization time on mineral content, thickness of surface layer and depth of artificial caries lesions. Caries Res., 9(1): 36–44.
Guillot, J.P., Gonnet, J.F., Clement, C., Caillard, L. and Truhaut, R. (1982a). Evaluation of the ocular-irritation potential of 56 compounds. Food Chem. Toxicol., 20(5): 573–582.
Guillot, J.P., Martini, M.C., Giauffret, J.Y., Gonnet, J.F. and Guyot, J.Y. (1982b). Safety evaluation of some humectants and moisturizers used in co
Haag, W.R. and Hoigné, J. (1983). Ozonation of bromide-containing waters: kinetics of formation of hypobromous acid and bromide. Environ. Sci. Technol., 17: 261–267.
Haas, C.N. (2011). Chapter 17: Chemical disinfection. In: Water quality and treatment: A handbook on drinking water, 6th edition. Edzwald, J.K. (ed.). American Water Works Association, Denver, Colorado. McGraw-Hill, New York, New York.
Hand, D.W., Hokanson, D.R. and Crittenden, J.C. (2011). Chapter 6: Gas–liquid processes: Principles and applications. In: Water quality and treatment: A handbook on drinking water, 6th edition. Edzwald, J.K. (ed.). American Water Works Association, Denver, Colorado; McGraw-Hill, New York, New York.
Hansen, K.S. (1983). Occupational dermatoses in hospital cleaning women. Contact Derm., 9(5): 343–351.
Hassing, J.H., Nater, J.P. and Bleumink, E. (1982). Irritancy of low concentrations of soap and synthetic detergents as measured by skin water loss. Dermatologica, 164(5): 314–321.
Health Canada (1998). Guidelines for Canadian drinking water quality: Guideline technical document—Bromate. Bureau of Chemical Hazards, Health Protection Branch, Ottawa, Ontario. Available at: http://www.healthycanadians.gc.ca/publications/healthy-living-vie-saine/index-eng.php
Health Canada (2006). Guidelines for Canadian drinking water quality: Guideline technical document—Trihalomethanes. Water Quality and Health Bureau, Healthy Environments and Consumer Safety Branch, Ottawa, Ontario. Available at: http://www.healthycanadians.gc.ca/publications/healthy-living-vie-saine/index-eng.php
Health Canada (2008a). Guidelines for Canadian drinking water quality: Guideline technical document—Haloacetic acids. Water, Air and Climate Change Bureau, Healthy Environments and Consumer Safety Branch, Ottawa, Ontario. Available at: http://www.healthycanadians.gc.ca/publications/healthy-living-vie-saine/index-eng.php
Health Canada (2008b).Guidelines for Canadian drinking water quality: Guideline technical document — Chlorite and chlorate. Water, Air and Climate Change Bureau, Healthy Environments and Consumer Safety Branch, Ottawa, Ontario. Available at: http://www.healthycanadians.gc.ca/publications/healthy-living-vie-saine/index-eng.php
Health Canada (2009). Guidance on controlling corrosion in drinking water distribution systems. Water, Air and Climate Change Bureau, Healthy Environments and Consumer Safety Branch, Ottawa, Ontario. Available at: http://www.healthycanadians.gc.ca/publications/healthy-living-vie-saine/index-eng.phpHealth Canada (2011a). Guidelines for Canadian drinking water quality: Guideline technical document — Enteric viruses. Water, Air and Climate Change Bureau, Healthy Environments and Consumer Safety Branch, Health Canada, Ottawa, Ontario. Available at: www.hc-sc.gc.ca/ewh-semt/pubs/water-eau/enteric-enterovirus/index-eng.php
Health Canada (2011b).Guidelines for Canadian drinking water quality: Guideline technical document — N-Nitrosodimethylamine (NDMA). Water, Air and Climate Change Bureau, Healthy Environments and Consumer Safety Branch, Ottawa, Ontario. Available at: www.hc-sc.gc.ca/ewh-semt/pubs/water-eau/ndma/index-eng.php.
Health Canada (2012a). Guidelines for Canadian drinking water quality: Guideline technical document—Enteric protozoa: Giardia and Cryptosporidium. Water, Air and Climate Change Bureau, Healthy Environments and Consumer Safety Branch, Ottawa, Ontario. Available at: www.hc-sc.gc.ca/ewh-semt/pubs/water-eau/protozoa/index-eng.php
Health Canada (2012b). Personal communication from A.-M. Tugulea, Environmental Health, Science and Research Bureau, Health Canada.
Ho, K.T., Kuhn, A., Pelletier, M.C., Hendricks, T.L. and Helmstetter, A. (1999). pH dependent toxicity of five metals to three marine organisms. Environ. Toxicol., 14(2): 235–240.
Hoff, J. (1986). Inactivation of microbial agents by chemical disinfectants. Water Engineering Research Laboratory, Office of Research and Development, U.S. Environmental Protection Agency, Cincinnati, Ohio (EPA/600/2-86/067).
Hong, S. and Elimelech, M. (1997). Chemical and physical aspects on natural organic matter (NOM) fouling of nanofiltration membranes. J. Memb. Sci. 132:159–181
Jain, A. and Loeppert, R.H. (2000). Effect of competing anions on the adsorption of arsenate and arsenite by ferrihydrite. J. Environ. Qual., 29: 1422–1430.
Kaplan, L.J. and Kellum, J.A. (2010). Fluids, pH, ions and electrolytes. Curr. Opin. Crit. Care, 16(4): 323–331.
Karalekas, P.C., Ryan, C.R. and Taylor, F.B. (1983). Control of lead, copper, and iron pipe corrosion in Boston. J. Am. Water Works Assoc., 75(2): 92–95.
Kashinkunti, R.D., Metz, D.H., Hartman, D.J. and DeMarco, J. (1999). How to reduce lead corrosion without increasing iron release in the distribution system. In: Proceedings of the AWWA Water Quality Technology Conference, Tampa Bay, FL. American Water Works Association, Denver, Colorado.
Kirmeyer, G., Friedman, M., Clement, J., Sandvig, A., Noran, P., Martel, K., LeChevallier, M., Volk, C., Anton E., Hiltebrand, D., Dyksen, J. and Chushing, R. (2000). Guidance manual for maintaining distribution system water quality. American Water Works Association Research Foundation, Denver, Colorado.
Kirmeyer, G., Friedman, M., Martel, K., Thompson, G., Sandvig, A., Clement, J. and Frey, M. (2002). Guidance manual for monitoring distribution system water quality. American Water Works Association Research Foundation, Denver, Colorado.
Kirmeyer, G., Martel, K., Thompson, G., Radder, L., Klement, W., LeChevallier, M., Baribeau, H. and Flores, A. (2004). Optimizing chloramine treatment, 2nd edition. American Water Works Association Research Foundation, Denver, Colorado.
Knocke, W., Hamon, J. and Thompson, C. (1988). Soluble manganese removal on oxide-coated filter media. J. Am. Water Works Assoc., 80(12): 65–70.
Knocke, W., Occiano, S. and Huntage, R. (1991). Removal of soluble manganese by oxide-coated filter media: sorption rate and removal mechanism issues. J. Am. Water Works Assoc., 83(8): 64–69.
Kohl, P.M. and Medlar, S.J. (2006). Occurrence of manganese in drinking water and manganese control. American Water Works Association Research Foundation, Denver, Colorado; U.S. Environmental Protection Agency, Washington, DC; IWA Publishing, London, United Kingdom (AwwaRF Report 91147).
Kohlmann, F.J. (2003). What is pH and how is it measured: a technical handbook for industry. Hach Company. Available at: www.hach.com/quick.search-download.search.jsa?keywords=HANDBOOK
Krasner, S. and Amy, G. (1995). Jar-test evaluations of enhanced coagulation. J. Am. Water Works Assoc., 87(10): 93–107.
Krasner, S.W., McGuire, M.J., Jacangelo, J.G., Patania, N.L., Reagan, K.M. and Aieta., E.M. (1989). The occurrence of disinfection by-products in US drinking water. J. Am. Water Works Assoc., 81: 41–53.
Krasner, S., Glaze, W., Weinberg, H., Daniel, P. and Najm, I. (1993). Formation and control of bromate during ozonation of water containing bromide. J. Am. Water Works Assoc., 85(1): 73–81.
Langelier, W.F. (1946). Effect of temperature on the pH of natural waters. J. Am. Water Works Assoc., 38: 179–185.
Langmuir, D. Chrostowski, P., Vigneault, B. and Chaney, R. (2005). Issue paper on the environmental chemistry of metals. U.S. Environmental Protection Agency Risk Assessment Forum. Washington, DC 20460 Contract #68-C-02-060
Larson, T.E. (1975). Corrosion by domestic waters. Illinois State Water Survey, Urbana, Illinois (Bulletin 59).
Larson, T.E. and Henley, L. (1955a). Determination of low alkalinity or acidity in water. Anal. Chem., 27(5): 851–852.
Larson, T.E. and Henley, L. (1955b). Determination of low alkalinity or acidity in water —Correction. Anal. Chem., 27(8): 1286–1286.
Larson, T.E. and Skold, R.V. (1958). Current research on corrosion and tuberculation of cast iron. J. Am. Water Works Assoc., 50(11): 1429–1432.
LeChevallier, M., Lowry, C., Lee, R. and Gibbon, D. (1993). Examining the relationship between iron corrosion and the disinfection of biofilm bacteria. J. Am. Water Works Assoc., 85(7): 111–123.
Lee, R.G., Becker, W.C. and Collins, D.W. (1989). Lead at the tap: sources and control. J. Am. Water Works Assoc., 81(7): 52–62.
Lee, S.H., O’Connor, J.T. and Banerji, S.K. (1980). Biologically mediated corrosion and its effects on water quality in distribution systems. J. Am. Water Works Assoc., 72(11): 636–645.
Leroy, P. (1993). Lead in drinking water—origins; solubility; treatment. J. Water Supply Res. Technol. – Aqua, 42(4): 223–238.
Leroy, P., Schock, M.R., Wagner, I. and Holtschulte, H. (1996). Cement-based materials. In: Internal corrosion of water distribution systems, 2nd edition. American Water Works Association Research Foundation and DVGW Technologiezentrum Wasser, Denver, Colorado. pp. 313–388.
Letterman, R. and Yiacoumi, S. (2011). Chapter 8: Coagulation and flocculation. In: Water quality and treatment: A handbook on drinking water, 6th edition. Edzwald, J.K. (ed.). American Water Works Association, Denver, Colorado.; McGraw-Hill, New York, New York.
Linden, K. and Rosenfeldt, E. (2011). Chapter 18: Ultraviolet light and processes. In: Water quality and treatment: A handbook on drinking water, 6th edition. Edzwald, J.K. (ed.). American Water Works Association, Denver, Colorado.; McGraw-Hill, New York, New York.
Lytle, D.A. and Schock, M.R. (2005). The formation of Pb(IV) oxides in chlorinated water. J. Am. Water Works Assoc., 97(11): 102–114..
Magnuson, M., Kelty, K., Linden, K., Fromme, W., Metz, D. and Kashinkunt, R. (2002). Effect of UV radiation on organic extracted from treated Ohio river water studied through the use of electrospray mass spectrometry. Environ. Sci. Technol., 36: 5252–5260.
Makinen, K.K. and Paunio, I.K. (1970). The pH-dependent liberation of phosphate from human dental enamel and dentine by ammonium sulphate. Acta Chem. Scand., 24(5): 1541–1550.
Malley, J., Shaw, J. and Ropp, J. (1995). Evaluation of by-products produced by treatment of groundwater with ultraviolet irradiation. American Water Works Association Research Foundation, Denver, Colorado.
Marchand, P. and Rabideau, S. (2011). Corrosion control and partial lead service replacement. In: Proceedings of the American Water Works Association Annual Conference and Exhibition, June 12–16, Washington, DC.
Marsh, A.G., Sanchez, T.V., Michelsen, O., Chaffee, F.L. and Fagal, S.M. (1988). Vegetarian lifestyle and bone mineral density. Am. J. Clin. Nutr., 48(3 Suppl.): 837–841.
Massachusetts Water Resources Authority (2010). 90th percentile lead levels for MWRA fully-served communities: 1992–2010. Massachusetts Water Resources Authority, Boston, Massachusetts. Available at: www.mwra.com/watertesting/lead/webgraphs/2010/2010-march-640.jpg
McKean, C.J.P. and Nagpal, N.K. (1991). Ambient water quality criteria for pH. Technical appendix. Water Quality Branch, Water Management Division, Ministry of Environment, Victoria, British Columbia.
McNeill, L.S. and Edwards, M. (2004). Importance of Pb and Cu particulate species for corrosion control. J. Environ. Eng., 130(2): 136–144.
Meenakshi, S. and Maheshwari, R.C. (2006). Fluoride in drinking water and its removal. J. Hazard. Mater., 137(1): 456–463.
Mitch, W.A. and Sedlak, D.L. (2002). Formation of N-nitrosodimethylamine (NDMA) from dimethylamine during chlorination. Environ. Sci. Technol., 36(4): 588–595.
MOE (2009). Guidance document for preparing corrosion control plans for drinking water systems. Ontario Ministry of Environment, Toronto, Ontario. Available at: http://dr6j45jk9xcmk.cloudfront.net/documents/1542/4-1a-19-corrosion-control-en.pdf
Morris, G.E. (1952). Chemical alopecia: a unique case. AMA Arch. Ind. Hyg. Occup. Med., 6(6): 530–531.
Murphy, J.C., Osterberg, R.E., Seabaugh, V.M. and Bierbower, G.W. (1982). Ocular irritancy responses to various pHs of acids and bases with and without irrigation. Toxicology. 23(4):281-91.
National Research Council (2005). Dietary reference intakes for water, potassium, sodium, chloride, and sulfate. The National Academies Press, Washington, DC, pp. 285–324.
Navalon, S., Alvaro, M. and Garcia, H. (2008). Carbohydrates as trihalomethanes precursors. Influence of pH and the presence of Cl− and Br− on trihalomethanes formation potential. Water Res., 42: 3990–4000.
Nawrocki, J. and Andrzejewski, P. (2011). Nitrosamines and water. J. Hazard. Mater., 189(1–2): 1–18.
NHMRC (2011). Australia drinking water quality guidelines. National Health and Medical Research Council, Commonwealth of Australia. Available at: www.nhmrc.gov.au/guidelines-publications/eh52
Nordberg, G.F., Goyer, R.A. and Clarkson, T.W. (1985). Impact of effects of acid precipitation on toxicity of metals. Environ. Health Perspect., 63: 169–180.
Oliphant, R.J. (1983). Summary report on the contamination of potable water by lead from soldered joints. Water Research Centre, Swindon, United Kingdom (External Report 125-E).
Osterberg, R.E., Seabaugh, V.M. and Bierbower, G.W. (1982). Ocular irritancy responses to various pHs of acids and bases with and without irrigation. Toxicology, 23(4): 281–291.
Pisigan, R.A. and Singley E. (1985). Effects of water quality parameters on the corrosion of galvanized steel. U.S. Environmental Protection Agency, Cincinnati, Ohio (Report No. EPA/600/J-85/250).
Pisigan, R.A. and Singley, E. (1987). Influence of buffer capacity, chlorine residual, and flow rate on corrosion of mild steel and copper. J. Am. Water Works Assoc., 79(2): 62–70.
Post, G., Atherhold, T. and Cohn, P. (2011). Chapter 2: Health and aesthetic aspects of drinking water. In: Water quality and treatment: A handbook on drinking water, 6th edition. Edzwald, J.K. (ed.). American Water Works Association, Denver, Colorado.; McGraw-Hill, New York, New York.
Pourmoghaddas, H. and Stevens, P.C. (1995). Relationship between trihalomethanes and haloacetic acids with total organic halogen during chlorination. Water Res., 29: 2059–2062.
Randtke, S. (2011). Chapter 13: Precipitation, coprecipitation and precipitative softening. In: Water quality and treatment: A handbook on drinking water, 6th edition. Edzwald, J.K. (ed.). American Water Works Association, Denver, Colorado.; McGraw-Hill, New York, New York.
Reckhow, D. and Singer, P. (2011). Chapter 19: Formation and control of disinfection by products. In: Water quality and treatment: A handbook on drinking water, 6th edition. Edzwald, J.K. (ed.). American Water Works Association, Denver, Colorado.; McGraw-Hill, New York, New York.
Sarin, P., Clement, J.A., Snoeyink, V.L. and Kriven, W.M. (2003). Iron release from corroded, unlined cast-iron pipe. J. Am. Water Works Assoc., 95(11): 85–96.
Scarpino, P., Berg, G., Chang, S., Dahling, D. and Lucas, M. (1972). A comparative study of the inactivation of viruses in water by chlorine. Wat. Res. 6: 959–965.
Schock, M.R. (1980). Response of lead solubility to dissolved carbonate in drinking water. J. Am. Water Works Assoc., 72(12): 695–704.
Schock, M.R. (1989). Understanding corrosion control strategies for lead. J. Am. Water Works Assoc., 81(7): 88–100.
Schock, M.R. (1990). Internal corrosion and deposition control. In: Water quality and treatment: A handbook on drinking water, 6th edition. Edzwald, J.K. (ed.). American Water Works Association, Denver, Colorado.; McGraw-Hill, New York, New York.
Schock, M. (2013). Personal communication from M.R. Schock. Office of Research and Development, U.S. Environmental Protection Agency.
Schock, M.R., Lytle, D.A. and Clement, J.A. (1995). Effect of pH, DIC, orthophosphate, and sulfate on drinking water cuprosolvency. U.S. Environmental Protection Agency, Cincinnati, Ohio (Report No. EPA/600/R-95/085).
Schock, M.R., Wagner, I. and Oliphant, R.J. (1996). Corrosion and solubility of lead in drinking water. In: Internal corrosion of water distribution systems. 2nd edition. American Water Works Association Research Foundation and DVGW Technologiezentrum Wasser, Denver, Colorado. pp. 131-230.
Schock, M.R., Harmon, S.M., Swertfeger, J. and Lohmann, R. (2001). Tetravalent lead: a hitherto unrecognized control of tap water lead contamination. In: Proceedings of the AWWA Water Quality Technology Conference, November 11–15, Nashville, Tennessee. American Water Works Association, Denver, Colorado.
Schock, M.R., Scheckel, K.G., DeSantis, M. and Gerke, T.L. (2005). Mode of occurrence, treatment and monitoring significance of tetravalent lead. In: Proceedings of the AWWA Water Quality Technology Conference, November 6–10, Québec, Quebec. American Water Works Association, Denver, Colorado.
Schreiber, M. and Mitch, W. (2005). Influence of the order of reagent addition on NDMA formation during chloramination. Environ. Sci. Technol., 39(10): 3811–3818.
Sheiham, I. and Jackson, P.J. (1981). The scientific basis for control of lead in drinking water by water treatment. J. Inst. Water Eng. Sci., 35(6): 491–515.
Siddiqui, M., and Amy, G. (1993). Factors affecting the DBP formation during ozone–bromide reaction. J. Am. Water Works Assoc., 85(1): 63–72.
Sincero, A. and Sincero, G. (2003). Physical and chemical treatment of water and wastewater. IWA Publishing, London, United Kingdom.
Singer, P.C. (ed.) (1999). Formation and control of disinfection by-products in drinking water. American Water Works Association, Denver, Colorado.
Singer, P.C. and Reckhow, D.A. (2011). Chapter 7: Chemical oxidation. In: Water quality and treatment: A handbook on drinking water, 6th edition. Edzwald, J.K. (ed.). American Water Works Association, Denver, Colorado.; McGraw-Hill, New York, New York.
Skadsen, J. (2002). Effectiveness of high pH in controlling nitrification. J. Am. Water Works Assoc., (94)7: 73-83
Snyder, S.A., Stanford, B.D., Pisarenko, A.N., Gordon, G. and Asami, M. (2009). Hypochlorite—an assessment of factors that influence the formation of perchlorate and other contaminants. American Water Works Association and Water Research Foundation, Denver, Colorado. (Project No. 4147).
Song, R., Westerhoff, P., Minear, R. and Amy, G. (1997). Bromate minimization during ozonation. J. Am. Water Works Assoc., 89(6): 69–78.
Sorg, T., Schock, M. and Lytle, D. (1999). Ion exchange softening: effect on metal concentrations. J. Am. Water Works Assoc., 8: 85–97.
Spruit, D. and Malten, K.E. (1968). Estimation of the injury of human skin by alkaline liquids. Berufsdermatosen, 16(1): 11–24.
Stevens, A.A., Moore, L.A. and Miltner, R.J. (1989). Formation and control of non-trihalomethane disinfection by-products. J. Am. Water Works Assoc., 81(8): 54–60.
Stumm, W. (1960). Investigation on the corrosive behavior of waters. J. Sanit. Eng. Div. Proc. Am. Soc. Civil Eng., 86: 27–45.
Stumm, W. and Morgan, J.J. (1969). Chemical aspects of coagulation. J. Am. Water Works Assoc., 54(8): 971–994.
Stumm, W. and Morgan, J.J. (1996). Aquatic chemistry: chemical equilibria and rates in natural waters, 3rd edition. Wiley, New York, New York.
Swenson, E.R. (2001). Metabolic acidosis. Respir. Care, 46(4): 342–353.
Tan, Q.G. and Wang, W.X. (2011). Acute toxicity of cadmium in Daphnia magna under different calcium and pH conditions: Importance of influx rate. Environ. Sci. Technol., 45(5): 1970–1976.
Traina, S.J. and Laperche, V. (1999). Contaminant bioavailability in soils, sediments, and aquatic environments. Proc. Natl. Acad. Sci. U.S.A., 96(7): 3365–3371.
Tucker, K.L., Hannan, M.T., Chen, H., Cupples, L.A., Wilson, P.W. and Kiel, D.P. (1999). Potassium, magnesium, and fruit and vegetable intakes are associated with greater bone mineral density in elderly men and women. Am. J. Clin. Nutr., 69(4): 727–736.
U.S. EPA (1982). Method 150.1. pH—Electrometric. Office of Groundwater and Drinking Water, U.S. Environmental Protection Agency, Washington, DC (EPA 600/4-79-020).
U.S. EPA (1988). National Secondary Drinking Water Regulations. CFR 40 Part 143, 53 FR 37412, September 26. U.S. Environmental Protection Agency, Washington, DC.
U.S. EPA (1992). Lead and Copper Rule guidance manual. U.S. Environmental Protection Agency, Washington, DC (Report No. EPA/811/B-92/002).
U.S. EPA (1999a). Enhanced coagulation and enhanced precipitative softening guidance manual. Office of Water, U.S. Environmental Protection Agency, Washington, DC (EPA 815-R-99-012).
U.S. EPA (1999b). Alternative disinfectants and oxidants guidance manual. Office of Water, U.S. Environmental Protection Agency, Washington, DC (EPA 815-R-99-014).
U.S. EPA (2002). Review of literature on removal of fluoride from drinking water. Draft report. Office of Water, U.S. Environmental Protection Agency, Cincinnati, Ohio.
U.S. EPA (2003). LT1ESWTR disinfection profiling and benchmarking. Technical guidance manual. U.S. Environmental Protection Agency, Washington, DC (Report No. EPA 816-R-03-004).
U.S. EPA (2004). Technology selection and system design: U.S. EPA arsenic removal technology demonstration program round 1. Prepared by L. Wang, W.E. Condit and A.S.C. Chen, Battelle, Columbus, OH, for U.S. Environmental Protection Agency, Washington, DC (EPA/600/R-05/001; nepis.epa.gov/Adobe/PDF/2000D1MP.pdf).
U.S. EPA (2007). Simultaneous compliance guidance manual for the long term 2 and stage 2 DBP rules. Office of Water, U.S. Environmental Protection Agency, Washington, DC (EPA 815-R-07-017).
U.S. EPA (2008). Stage 2 disinfectants and disinfection by-products rule. Operational evaluation guidance manual. Office of Water, U.S. Environmental Protection Agency, Washington, DC (EPA 815-R-08-018).
U.S. EPA (2011). Analytical methods recommended for drinking water monitoring of secondary contaminants. U.S. Environmental Protection Agency Available at: http://water.epa.gov/scitech/drinkingwater/labcert/upload/815b14005.pdf
U.S. EPA (2012). Drinking water treatability database. Office of Research and Development, U.S. Environmental Protection Agency, Cincinnati, Ohio. Available at: http://ofmpub.epa.gov/tdb/pages/general/home.do
U.S. EPA (2013). Personal communication from J. Kempic. Office of Ground Water and Drinking Water. U.S. Environmental Protection Agency.
van Ketel, W.G., Bruynzeel, D.P., Bezemer, P.D. and Stamhuis, H.I. (1984). Toxicity of handcleaners. Dermatologica, 168(2): 94–99.
von Gunten, U. (2003). Ozonation of drinking water: Part II. Disinfection and byproduct formation in presence of bromide, iodide or chlorine. Water Res., 37(7): 1469–1487.
von Gunten, U. and Oliveras, Y. (1998). Advanced oxidation of bromide-containing waters: bromate formation mechanisms. Environ. Sci. Technol., 32(1): 63–70.
ormann, J. and Goedecke, T. (2006). Acid–base homeostasis: latent acidosis as a cause of chronic diseases. Schweiz. Zschr. GanzheitsMedizin, 18(5): 255–266.
Vormann, J. and Remer, T. (2008). Dietary, metabolic, physiologic, and disease-related aspects of acid–base balance: Foreword to the contributions of the Second International Acid–Base Symposium. J. Nutr., 138(2): 413S–414S.
Vrijenhoek, E.M., Childress, A.E., Elimelech, M., Tanaka, T.S. and Beuhler, M.D. (1998). Removing particles and THM precursors by enhanced coagulation. J. Am. Water Works Assoc., 90(4): 139–150.
Wahlberg, J.E. (1984). Skin irritancy from alkaline solutions assessed by laser Doppler flowmetry. Contact Dermatitis, 10(2): 111. doi: 10.1111/j.1600-0536.1984.tb00351.x
Wang, D., Bolton, R., Andrews, S. and Hofmann, R. (2015). Formation of disinfection by products in the ultraviolet/chlorine advanced oxidation processes. Sci. Total Environ. 518–519: 49–57.
Werdenhoff, K. and Singer, P. (1987). Chlorine dioxide effect on THMFP and TOXFP and the formation of inorganic by-products. J. Am. Water Works Assoc., 79(9): 107–113.
HO (2007). pH in drinking-water. Revised background document for development of WHO Guidelines for Drinking-water Quality. World Health Organization, Geneva, Switzerland (WHO/SDE/WSH/07.01/1; www.who.int/water_sanitation_health/dwq/chemicals/ph_revised_2007_clean_version.pdf).
Wilczak, A., Hokanson, D. R., Trussell, R. R., Boozarpour, M. and Degraca, A.F. (2010). Water conditioning for LCR compliance and control of metals release in San Francisco’s water system. J. Am. Water Works Assoc., 102(3): 52–64.
Williams, M.D., Coffey, B.M. and Krasner, S.W. (2003). Evaluation of pH and ammonia for controlling bromate during Cryptosporidium disinfection. J. Am. Water Works Assoc., 95(10): 82–93.
Yanonni, C.C. and Covellone, M.A. (1998). Pipe loop demonstration study of corrosion control alternatives at a pH of 10. J. N. Engl. Water Works Assoc., 112(22): 132–146.
Zhang, Y., Griffin, A. and Edwards, M. (2008). Nitrification in premise plumbing: role of phosphate, pH, and pipe corrosion. Environ. Sci. Technol., 42(12): 4280–4284.
Zhang, Y., Edwards, M., Pinto, A., Love, N., Camper, A., Rahman, M. and Baribeau, H. (2010). Effect of nitrification on corrosion in the distribution system. American Water Works Association Research Foundation and American Water Works Association, Denver, Colorado.
Appendix A: List of acronyms
- CT
- product of residual concentration of disinfectant (C) and disinfectant contact time (T)
- DBP
- disinfection by-product
- DIC
- dissolved inorganic carbon
- EPA
- Environmental Protection Agency (U.S.)
- HAA
- haloacetic acid
- LSI
- Langelier saturation index
- MF
- microfiltration
- MIC
- microbiologically influenced corrosion
- NDMA
- N-nitrosodimethylamine
- NF
- nanofiltration
- NOM
- natural organic matter
- RO
- reverse osmosis
- THM
- trihalomethane
- TOC
- total organic carbon
- UF
- ultrafiltration
- UV
- ultraviolet
- VOC
- volatile organic compound