
Health impacts of air pollution in Canada in 2018
Download in PDF format
(1,259 KB, 53 pages)
Organization: Health Canada
Date published: March 2024
Cat.: H144-51/2018E-PDF
ISBN: 978-0-660-69855-7
Pub.: 230734
On this page
- Summary
- Introduction
- Methods
- Results
- Discussion
- Conclusions
- References
- Appendix A: 2018 to 2020 analysis years
- Appendix B: NO2 land-use regression model for 2020
- Appendix C: Baseline health endpoint rates
- Appendix D: Other health impact estimates
Summary
Over the last few decades, a great deal of scientific evidence attributes a wide range of adverse health effects to ambient (outdoor) air pollution exposure. These effects range in severity from respiratory symptoms to disease and premature death.
Using health and atmospheric science data, it's also possible now to estimate the population health impacts (or burden) of exposure to ambient air pollution. These impacts include premature deaths and non-fatal adverse health effects.
In Canada and internationally, scientific studies and health impact assessments have:
- linked wide-ranging health effects with exposure to air pollutants
- evidence suggests the overall impact is most severe from fine particulate matter (PM2.5), ground-level ozone (O3) and nitrogen dioxide (NO2)
- other pollutants, such as sulphur dioxide and carbon monoxide, are also associated with adverse health effects
- identified air pollution as one of the largest risk factors for premature death and disability
This report is an update to previous reports published by Health Canada on the health impacts of air pollution. The report includes estimates of the health burden for the year 2018 using air pollution exposure estimates from 2017 to 2019. Health burden estimates are based on 3 years of ambient air pollution exposure data to mitigate variations in concentrations from year to year.
The approach for quantitatively estimating the population health impacts of air pollution is well established by international health science organizations. In alignment with accepted approaches, Health Canada estimated:
- exposures to ambient air pollution across Canada
- the associated adverse health impacts in the population and
- the monetized values of these health impacts
This analysis accounts for national demographics, including population counts, age profiles and baseline health status (that is, the incidence of a health endpoint in the population). Health impacts are presented nationally, by province and territory, and by census division. Air pollution is represented by PM2.5, O3 and NO2.
The morbidity and mortality estimates reported in this assessment are based on risk information from epidemiological studies that are relevant to Canada. For example, risk information contributing to the mortality estimates are from Canadian cohort and time-series studies, and from an American cohort. It is important that study populations and exposure levels represent Canadian conditions.
In this analysis, the premature deaths and non-fatal effects due to air pollution reflect exposures to ambient concentrations of PM2.5, O3 and NO2 exclusively. These 3 pollutants were selected because there is robust epidemiological evidence of their adverse health impacts. We also have the ability to estimate the spatial distribution of their ambient concentrations across Canada reliably.
Risks of health effects or endpoints are statistically derived from air pollution health studies. They are the consensus selection of a panel of Health Canada experts, and are Health Canada-endorsed values. The mortality endpoints include all-cause mortality associated with long-term (chronic) exposure to ambient PM2.5 and short-term (acute) exposure to NO2 and annual O3, as well as respiratory mortality associated with chronic exposure to warm-season or summer O3.
In this report, we considered the exposure of people in Canada to above-background levels, which is the difference between ambient concentrations and background concentrations. Background concentrations are equivalent to minimum ambient air pollution levels that are not influenced by human-made emissions, such as those present in remote areas away from human activity. Above-background air pollution mainly consists of human-made (anthropogenic) emissions as well as emissions from natural events, such as wildfires, which influence ambient concentrations. Exposure to air pollutants in indoor environments was not considered.
The focus on above-background air pollution is relevant to air quality management in Canada because policies and regulations to improve air quality generally target human-made emissions. The modelling showed that above-background national average exposures to air pollution in 2017 to 2019 were 5.32 µg/m3 for PM2.5, 7.11 ppb for NO2, 11.16 ppb for annual O3 and 12.39 ppb for summer O3. These averages are weighted by population to account for the geographic distribution of Canada's population.
Health Canada estimates that above-background air pollution in 2018, including air pollution from human sources in North America, contributed to 17,400 premature deaths in Canada. (Note: The analysis year for the health impact estimates is 2018. The average exposure estimates for 2017 to 2019 are applied to the 2018 population data.) Higher health burdens were estimated in the most populated or polluted regions. This includes an estimated 6,500 premature deaths in Ontario, 4,300 in Quebec, 2,400 in British Columbia and 2,100 in Alberta. National morbidity or non-fatal health outcomes included 3.6 million asthma symptom days and 39 million acute respiratory symptom days per year.
The total monetized value of all health impacts that can be attributed to air pollution in 2018 is $146 billion (2020 CAD). Premature deaths associated with air pollution make up 95% ($139 billion in 2020 CAD) of the total monetized impacts.
The 2018 estimate of 17,400 premature deaths represents 47 premature deaths per 100,000 people. Previous estimates published by Health Canada for 2011, 2015 and 2016, which were based on earlier versions of air quality modelling data and tools, are lower and vary between 41 and 42 deaths per 100,000 people.
The increase in 2018 is largely a result of improvements in the ambient PM2.5 air quality modelling and not from worsening air pollution levels. Health Canada redid the analysis of the 2016 air pollution health burden using the more recent model. Our new analysis showed that PM2.5 exposure was higher in 2016 and air pollution health burden estimates totalled 17,700 premature deaths, or 49 premature deaths per 100,000 people. In comparison, the original estimates were 15,300 premature deaths, or 42 premature deaths per 100,000 people.
These findings confirm that air pollution and the associated health burden in Canada have been consistent over the last decade. Compared to our air pollution health burden estimates for the year 2016, the results for 2018 show a decrease in premature deaths equivalent to 2 incidents per 100,000 people.
However, due to data limitations and knowledge gaps, not all health effects associated with exposure to PM2.5, O3 and NO2 reported in the scientific literature can be quantified. Also, other air contaminants contribute to health impacts, but were not considered in this work. For this reason, the full impact of exposure to air pollution in Canada is likely underestimated in this report.
Overall, despite the relatively low levels of air pollutants in Canada compared to some other parts of the world, air pollution impacts the health of the Canadian population.
Introduction
Air pollution is a major contributor to the development of disease and premature death. It also represents the largest environmental risk factor to human health (WHO 2016). Exposure to air pollution increases the risk of dying prematurely from heart disease, stroke and lung cancer. (Note that multiple risk factors are involved in the development or worsening of adverse health effects. While air pollution can contribute to increased risk of health impacts, this does not imply that air pollution is the sole cause. Exposure to air pollution is a contributing risk factor to the development of adverse health effects.)
The current state of health and atmospheric sciences makes it possible to estimate the number of premature deaths and non-fatal adverse health outcomes associated with being exposed to air pollution. Various researchers and organizations have produced both global and individual country estimates of premature deaths and other adverse health outcomes due to air pollution. These include Cohen et al. (2017), the Institute for Health Metrics and Evaluation and the Health Effects Institute (IHME and HEI 2020), and the World Health Organization (WHO 2016). They used information from the peer-reviewed scientific literature to relate population-level pollution exposure (both short- and long-term) to the risk of adverse health outcomes, including premature death and hospital visits. The quantitative relationship between exposure and increased risk of adverse health outcomes is referred to as the concentration-response function (CRF).
According to the Global Burden of Disease (GBD) project, air pollution is the fourth leading mortality risk factor in the world. Worldwide, it was responsible for 12% of deaths in 2019 (or 6.7 million premature deaths) (IHME and HEI 2020). This includes 4.1 million premature deaths from being exposed to ambient PM2.5 alone, which is 62% of total deaths that can be attributed to air pollution.
Canada has relatively good air quality. It is among the top 10 countries with the lowest national ambient PM2.5 exposure levels, at less than 8 µg/m3 in terms of population-weighted PM2.5 concentration (IHME and HEI 2020). However, air pollution continues to have an impact on the health of people in Canada. The GBD analyses (IHME, 2019) indicate that air pollution:
- ranks as the 13th largest mortality risk factor overall in Canada (12 deaths per 100,000 people)
- is the second environmental risk behind non-optimal temperature (high and low temperatures)
Previous estimates of mortality attributed to air pollution in Canada were developed by Health Canada (2017, 2019, 2021), Stieb et al. (2015) and as part of the GBD project (IHME 2019). For example, in our 2016 analysis, Health Canada estimated that 15,300 premature deaths were due to exposure to ambient air pollutants, specifically PM2.5, ground-level O3 and NO2 (Health Canada 2021).
Estimates of fatal and non-fatal outcomes attributed to air pollution will change over time, as estimates of ambient air pollution across Canada improve and we understand better the relationship between exposure to air pollution and the risks of adverse health effects. For example, new regulations can limit the release of air pollutants from certain sources and updated air pollution data and modelling tools can improve our ability to estimate air pollution exposure. Changes in population health and demographics, including the aging population, also influence the number of health outcomes that can be attributed to air pollution exposure.
The most recent data and scientific knowledge were drawn on to provide up-to-date estimates of morbidity and mortality outcomes in Canada due to ambient levels of PM2.5, O3 and NO2 for the 2017 to 2019 period. In this analysis, we provide:
- national-, provincial-, territorial- and census division-level estimates
- monetized estimates of health impacts
The methods described here are comprehensive and appropriate for the Canadian context. Exposure to air pollutants in indoor environments was not considered.
The COVID-19 pandemic and the measures that countries took in early 2020 to limit infections greatly influenced human activities. Drastic reductions in traffic, commercial and industrial activity contributed to a decrease in air pollutant emissions and, in many areas, improved ambient air quality. Studies conducted in Canada suggest that NO2 concentrations, for example, were lower in the months during and following the lockdown compared to historical records (Adams 2020; Fioletov et al. 2022; Griffin et al. 2020; Mashayekhi et al. 2021; Zhao et al. 2022).
In the sensitivity analysis presented in Appendix A, we compare the health burden for the 2017 to 2019 period to the 2018 to 2020 period. The objective of this sensitivity analysis is to evaluate the interannual variability in air pollution estimates, notably the potential influence of COVID-19 measures, on the health burden estimate for the year 2019. The 2018 to 2020 period was not selected for the main analysis owing to uncertainties with the air pollution modelling results in 2020.
Methods
Pollutants included in the estimate
This analysis of the health impacts from air pollution in Canada focuses on PM2.5, O3 and NO2.
Emissions from local, regional, national and international sources directly (primary pollution) and indirectly (secondary pollution) contribute to the presence of these pollutants in the country's ambient air. For example, fuel combustion (on- and off-road vehicles and equipment) and power generation sources (such as coal or natural gas) release particles and nitrogen oxides (NOx) into the air. Combustion also emits organic and other inorganic compounds, which contribute to secondary PM2.5 and O3. Ozone is not emitted directly but formed from precursors such as NOx and volatile organic compounds (VOCs) via secondary reactions in the atmosphere and reactions with sunlight.
Health Canada and international agencies have concluded that PM2.5, O3 and NO2 cause or are likely to cause premature deaths. This is based on evidence from epidemiological studies and reviews (for example, Health Canada 2013, 2016, 2022; US EPA 2019).
These 3 pollutants also account for most population health impacts from air pollution. The scientific evidence of health effects at very low concentrations of these pollutants is robust. There is also no evidence of a no-risk exposure threshold in the population. In other words, any increment in air pollutant concentration is associated with an increased risk of adverse health outcomes.
General information on emissions and ambient concentrations of PM2.5, O3 and NO2 in Canada, as well as the associated adverse health effects, are published elsewhere (ECCC 2018, 2020, 2022; Health Canada 2013, 2016, 2021, 2022).
Estimating population exposure to above-background air pollution
Our current analysis estimates the mortality and morbidity outcomes associated with being exposed to ambient air pollution above background levels. The above-background increment originates from human-made emissions from North America and natural emissions (notably from wildfires). Health impacts from background pollutant concentrations (which include emissions from other natural sources and sources beyond North America) were not included.
Some authors distinguish between baseline (natural and long-range air pollution contributions) and background (natural contributions only) conditions (TFHTAP 2010). However, Health Canada uses the term "background" to represent all contributions other than those from North American human-made emissions or large natural events such as wildfires. This is comparable to the term "North American background" or "policy relevant background" that the US Environmental Protection Agency uses (CRS 2019).
Above-background air pollution is relevant to air quality management in Canada, as policies and regulations for improving air quality generally target human-made emissions. We used models of ambient concentrations of PM2.5, O3 and NO2 to estimate population-level exposures across Canada. These modelled estimates (figures 1 to 3) were generated using ground-level measurements, satellite data, geographic and land-use information, and computer model simulations. Background concentrations were then subtracted to obtain the exposure data included in this analysis.
Background concentrations of air pollution
Background concentrations of PM2.5, O3 and NO2 were previously estimated in collaboration with Environment and Climate Change Canada. This initiative to evaluate concentration measurements at rural and remote monitoring sites in Canada involved both qualitative (expert judgment) and quantitative (data-driven) approaches.
Background concentrations were estimated using 1 of the following 2 methods:
- We separated the data from rural and remote monitoring sites into sectors of different air mass origin by analyzing backward air mass trajectories. We then selected the background concentrations as the monthly or annual average concentrations for the sectors containing no major human-made sources.
- We plotted many years of rural and remote measurement data in a time series and qualitatively selected the lowest values that most represent background air masses.
This resulted in annual average background concentrations for PM2.5 and NO2.
A set of monthly-average background concentrations were derived for O3, for which ambient concentrations have a strongly seasonal cycle. We then combined these monthly averages into summer and annual average concentrations, to be consistent with those used to quantify health risks.
Regional differences in background concentrations are likely, but for this analysis, a single background concentration was applied across Canada for each pollutant. The estimated background concentrations for Canada are as follows:
- 1.8 micrograms per cubic metre (µg/m3) for PM2.5 (annual average)
- 0.15 parts per billion by volume (ppb) for NO2 (annual average)
- 26 ppb for annual O3 (annual average of daily 1 hour maximum) and 28 ppb for summer O3 (May to September average of daily 1 hour maximum)
Above-background air pollution
In this analysis, the above-background air pollution increment serves as the surrogate for population exposure and to estimate health impacts. It represents the difference between ambient and background concentrations.
We relied on spatially resolved estimates of ambient air pollution levels (including both human-made and natural sources) for PM2.5, O3 and NO2. A combination of data sources and methods were used and are described as follows.
Assignment of concentrations to populations
Air pollution concentration estimates for PM2.5, O3 and NO2 were generated and mapped to the Canadian population, using either dissemination area (DA) or postal code information. Ambient concentrations were averaged over 3 years of available data (2017 to 2019) to reduce the influence of interannual variations in concentrations. There are many causes of interannual variability, including regulations targeting air pollutant emissions, fluctuations in economic activity, variations in weather patterns and air pollution events, including wildfires (Matz et al. 2020) and stay-at-home orders(Griffin et al. 2020;; Zangari et al. 2020). A simulation for the 2018 to 2020 period was also conducted as a sensitivity analysis to explore the interannual variability in air pollution estimates on the air pollution burden estimates (refer to Appendix A).
Air pollutant concentrations were estimated for 293 census divisions (CDs). Figures 1 to 3 present maps of population-weighted ambient air pollutant concentrations for annual average PM2.5, annual average 1-hour daily maximum O3, summer average 1-hour daily maximum O3 (May to September) and annual average NO2. The data displayed in these maps represent the estimated geographic distribution of ambient air concentrations from all natural and human-made sources. Canadian background concentrations were then subtracted to estimate exposures to above-background ambient air pollution concentrations. The methods used to estimate air pollutant levels for the 2017 to 2019 periods are detailed in the following subsections.
Fine particulate matter
Annual average PM2.5 concentrations for 2017 to 2019 were estimated by combining multiple satellite-based measurements, chemical transport modelling and ground-based observations (van Donkelaar et al. 2015a, 2019; van Donkelaar and Martin 2022). The Goddard Earth Observing System chemical transport model (GEOS-Chem), using a stretched grid formulation over Canada, related satellite aerosol optical depth (AOD) observations to ground-level PM2.5 total mass concentrations. Ground-based observations from the National Air Pollution Surveillance (NAPS) network were then statistically incorporated (Bindle et al. 2021; van Donkelaar et al. 2015b, 2016; van Donkelaar and Martin 2023).
AOD data were obtained from 3 satellite instruments (Boys et al. 2014; Crouse et al. 2015; Stieb et al. 2015; van Donkelaar et al. 2010, 2013, 2015a, 2021):
- multi-angle imaging spectroradiometer (MISR)
- moderate resolution imaging spectroradiometer (MODIS)
- sea-viewing wide field-of-view sensor (SeaWiFS)
AOD is a vertically integrated measurement of light extinction in the atmosphere. Factors such as the vertical distribution and composition of aerosols, as well as humidity and other meteorological conditions, can influence estimates of ground-level PM2.5 concentrations based on AOD measurements. To account for these factors, AOD values were normalized or adjusted using output from chemical transport models and ground-based observations.
Based on daily average estimates, annual average PM2.5 concentrations were generated as a gridded surface with a spatial resolution of approximately 1 km × 1 km. The grid cell values were then converted to a point dataset and merged with a dataset representing postal code areas. The nearest point was assigned to each postal code. An arithmetic average of postal code-level concentration estimates within each CD was estimated. As the density of postal codes is highly correlated with population, this method is considered a proxy for population-weighting to the CD level.
Figure 1 shows the geographic distribution of population-weighted average PM2.5 concentrations for the years 2017 to 2019. The national population-weighted average ambient PM2.5 concentration is 7.12 µg/m3. Most of the largest urban CDs correspond with PM2.5 concentrations that are equivalent to or greater than the national average. However, the estimates of highest concentration are for central British Columbia and most of Alberta, which reflects the contribution from wildfire smoke to ambient PM2.5.
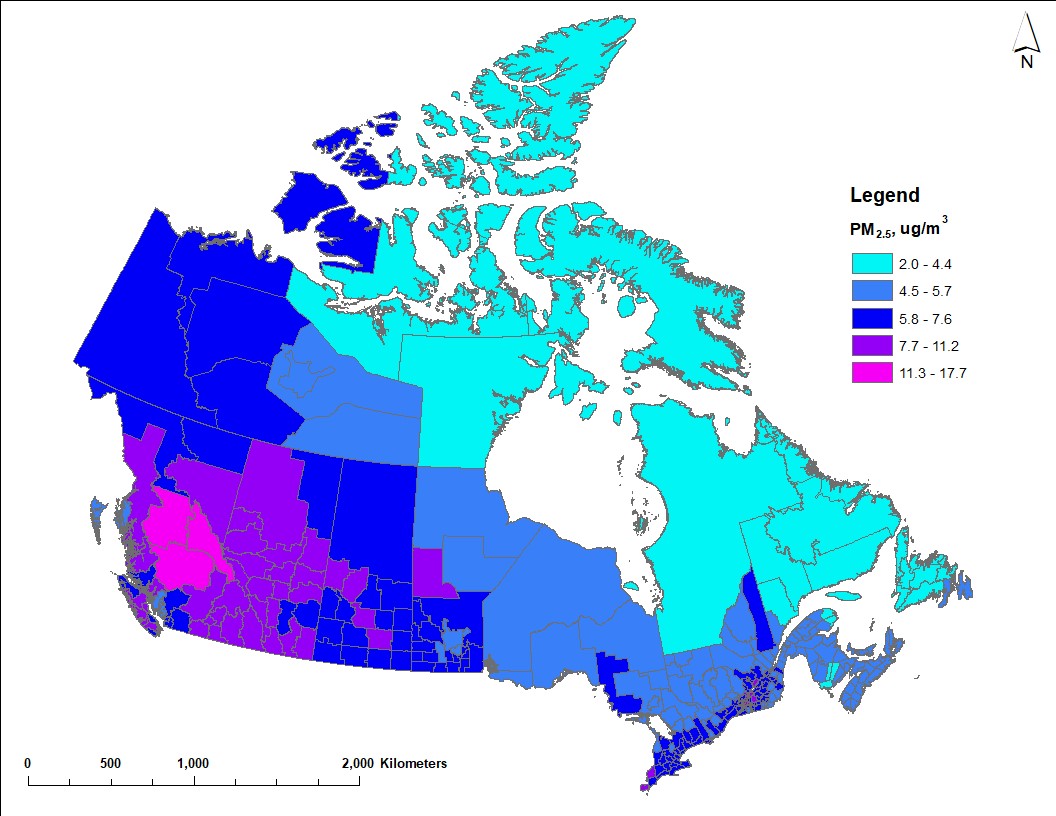
Figure 1 - Text description
Map of Canada showing estimated average PM2.5 concentrations for 2017 to 2019 across census divisions. Concentrations vary from approximately 2 µg/m3 to 18 µg/m3. Higher concentrations (7.7 µg/m3 or more) are estimated in central British Columbia and most of Alberta due to contributions from wildfires. Higher concentrations are also estimated in larger urban regions, such as southern Ontario and Quebec, owing to larger populations and greater economic activity. Lower concentrations (5.7 µg/m3 or less) correspond with census division in northern regions and in Atlantic Canada.
Ozone
Estimates of both the annual O3 and summer O3 (May to September) concentrations were derived from daily 1-hour maximum concentrations for 2017 to 2019 (the highest 1-hour value for each day is considered). Environment and Climate Change Canada produced these estimates using objective analysis, which weighs and combines modelled O3 forecasts with ground-based observations of O3 (Robichaud and Ménard 2014; Kalnay 2003). The modelled O3 forecast was provided by the Global Environmental Multiscale - Modelling Air quality and Chemistry (GEM-MACH) system. This is Environment and Climate Change Canada's operational regional air quality forecast model (Makar et al. 2018; Moran et al. 2010; Whaley et al. 2018). O3 measurements were obtained from the Canadian Air and Precipitation Monitoring Network (CAPMoN) and the Canadian NAPS network.
In objective analysis, the optimal combination of modelled and observed values improves the coverage and accuracy of air pollution patterns (Robichaud et al. 2016). This leads to better estimates of ambient O3 concentrations in areas that lack monitoring data, compared to standard interpolation techniques (such as spatial kriging). Estimates for Canada are available for 2017 to 2019 on a grid point surface with a horizontal resolution of 10 km x 10 km. The gridded estimates were then interpolated to polygons that represent DAs (using a normalized conservative approach). All grid points within and bordering DA polygons were included, wholly or partially, to estimate the average O3 concentration values by DA. These DA concentrations were multiplied by the DA population weight (relative to CD populations) to generate concentrations by CD. The most recent year of Canadian population data available at the DA scale was 2016.
Figure 2 shows the geographic distribution of the annual average (left panel) and the summer average (right panel) of daily 1-hour maximum O3 concentrations for 2017 to 2019. There are higher O3 concentrations for the summer average. The national population-weighted average ambient concentrations are 37.16 ppb for annual O3 and 40.39 ppb for summer O3. However, the geographic distribution of annual and summer O3 concentrations are similar. Higher O3 concentrations are estimated for both averaging periods in southern Alberta and within the Windsor to Quebec City corridor. The sources of emissions (such as on-road transportation, off-road equipment, oil and gas sector) of O3 precursors (for example, NOx, VOCs) and meteorological conditions leading to higher O3 concentrations in these 2 regions are possibly different. Regional contributions from various sources were estimated in a previous report (Health Canada 2023).
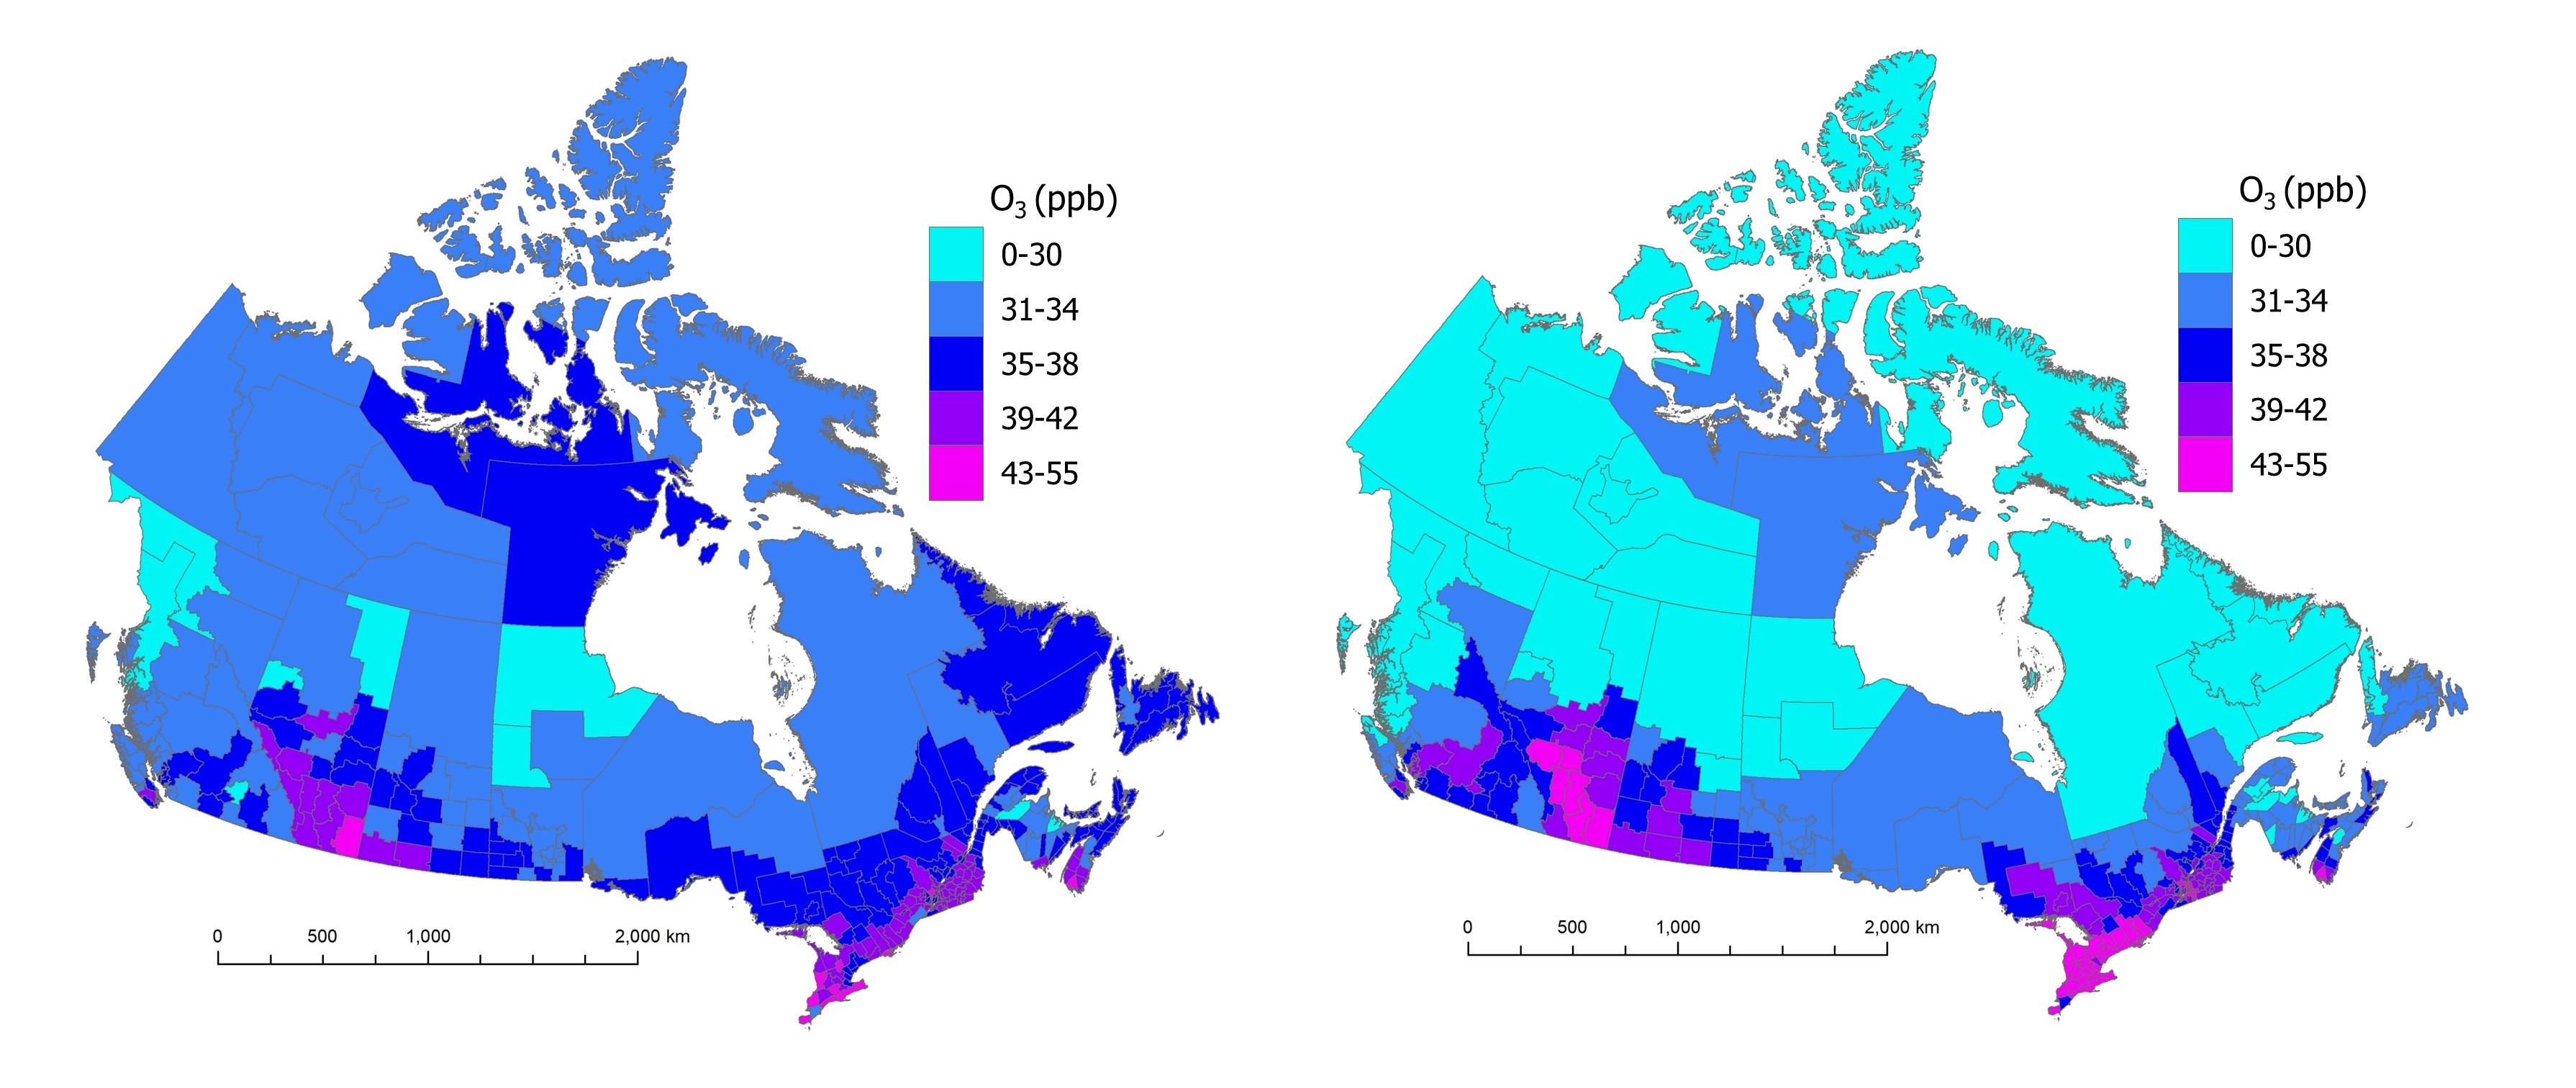
Figure 2 - Text description
Two maps of Canada showing estimated annual and summer average daily maximum O3 concentrations for 2017 to 2019 across census divisions. Annual average O3 estimates vary between 9 and 45 ppb while summer average O3 estimates are between 7 and 55 ppb. For both averaging periods, higher O3 estimates (39 ppb or more) occur in southern Alberta, Saskatchewan, Ontario, Quebec and Nova Scotia. Lower estimates (35 ppb or less) correspond with the northern half of western provinces and the western part of the Northwest Territories.
Nitrogen dioxide
Annual average NO2 concentrations were estimated using a national land-use regression (LUR) model for 2017 to 2019 (Hystad and Larkin 2022a). The LUR model predictors included 3-year annual average NO2 concentrations using NO2 vertical column densities (NASA Earth Observations database) from the ozone monitoring instrument (OMI), at a spatial resolution of 0.1° × 0.1°, as well as land use and meteorological descriptors (Boersma et al. 2011; Hystad et al. 2011; Lamsal et al. 2008). In addition to the OMI data, the model predictors included:
- temperature
- railways within 750 m
- industrial use within 200 m
- population density within 20 km
- highways and expressways within 250 m
- the normalized difference vegetation index (NDVI) within 250 m
The NO2 estimates were developed on a high-resolution grid (30 m) to best capture the fine spatial gradients in NO2 concentrations. The performance of the LUR model was assessed by comparing predicted and observed NO2 concentrations. Observations corresponded with the 3-year annual average NO2 data from the NAPS network for 2017 to 2019 (180 monitoring stations for 2017 and 2018, 181 stations for 2019). For the 2019 model, a coefficient of determination (R2) of 64% was reported between the NO2 model results and the corresponding NAPS data at the national level, with a root mean squared error (RMSE) of 2.22 ppb (Hystad and Larkin 2022a,b). The performance compares to the annual models for 2016 to 2018, with R2 ranging from 61% to 67% and RMSE of 2.13 ppb to 2.41 ppb.
The 2017 to 2019 annual average NO2 estimates were applied to dissemination block (DB) centroids (or nearest valid location) based on 2016 census geographies and population densities. Estimates are available for 489,676 DBs. DB estimates ranged from 0 to 19.7 ppb, with a mean of 5.4 ppb (5.4 ppb in 2017 and 2018, 5.3 ppb in 2019). The DB results were used to calculate population-weighted concentrations for each CD.
Figure 3 shows the distribution of annual average NO2 concentrations, averaged over 2017 to 2019. The national population-weighted average ambient concentration is 7.26 ppb for NO2. Higher NO2 concentrations are estimated in southwestern British Columbia, around the Calgary to Edmonton corridor and the oil sands region in Alberta, in southern Saskatchewan and along the Windsor to Quebec City corridor in Ontario and Quebec. In general, the transportation and oil and gas sectors are considerable contributors to ambient NOX emissions (ECCC 2022).

Figure 3 - Text description
Map of Canada showing annual average NO2 concentrations for 2017 to 2019 across census divisions. Annual average NO2 estimates vary between 0.4 and 12.2 ppb. Higher NO2 estimates (5.2 ppb or more) generally correspond with the larger urban regions or centres in Canada, including the Lower Fraser Basin, the Calgary to Edmonton corridor, Regina, Winnipeg and the Windsor to Quebec City corridor. Lower concentrations (3.5 ppb or less) are estimated in the northern part of most provinces and the territories.
Estimating premature deaths and non-fatal outcomes from air pollution
This analysis used Health Canada's Air Quality Benefits Assessment Tool (AQBAT) to link population-level above-background air pollution exposures to health outcomes (Judek et al. 2019). The AQBAT model estimates the number of premature deaths and other health outcomes associated with specified changes in air pollution concentrations across geographic areas (such as CDs) in Canada for a single year. Outcomes can be aggregated to provincial, territorial and national estimates, as done here.
Information on health effects for PM2.5, O3 and NO2 are included in the form of CRFs. These estimate the relationship between exposure to an air pollutant and health outcomes for a given endpoint, such as asthma symptoms, chronic bronchitis and death. Pollutant-specific CRFs for individual adverse health outcomes are statistically derived from a single study or a meta-analysis of multiple studies. As they are the consensus selection of a panel of Health Canada experts, they are Health Canada-endorsed values. Previous studies (Crouse et al. 2012; Health Canada 2021; Judek et al. 2019; Shin et al. 2013; Stieb et al. 2015) contain background information on the CRFs used in this report and the analyses undertaken to produce the estimates within AQBAT.
Table 1 presents the pollutants and their associated health effects considered in this analysis. Health endpoints (related to acute or chronic exposure), the associated CRFs and the applicable population group(s) (such as age-specific groups) are predefined in AQBAT. In this analysis, short-term exposure contributes to effects that occur within a few days of an increase in ambient air pollution (acute health effects). Long-term exposure refers to exposures averaged over the years before disease developed or death occurred (chronic health effects). Health outcomes are considered to have no threshold for effect (are assumed to occur at all levels of exposure) in this analysis. This is consistent with Health Canada's conclusions after evaluating the scientific literature on each of these pollutants (Health Canada 2013, 2016, 2022).
Population-level premature deaths were estimated using the following CRFs and health endpoints:
- non-accidental causes of death associated with long-term exposure to PM2.5 from a Canadian cohort (Crouse et al. 2012)
- non-accidental causes of deaths associated with short-term exposure to NO2 and O3 from a Canadian time-series analysis (Burnett et al. 2004)
- death from respiratory causes associated with long-term exposure to summer O3 from an American cohort (Jerrett et al. 2009)
Note: In our 2017 and 2019 publications on the health impacts of air pollution in Canada, we refer to non-accidental causes of death as "internal" causes of death.
| PollutantFootnote a | Averaging period | Health endpoint | Causality determinationFootnote d | Health Canada reference |
|---|---|---|---|---|
| NO2 | 24 h | Acute exposure mortalityFootnote bFootnote c | Likely causal | 2016 |
| O3 | 1-h maximum | Acute exposure mortalityFootnote b | Likely causal | 2013 |
| Summer O3 | 1-h maximum | Acute respiratory symptom days | Causal | 2013 |
| Asthma symptom days | Causal | 2013 | ||
| Chronic exposure respiratory mortality | Suggestive | 2013 | ||
| Minor restricted activity days | Causal | 2013 | ||
| Respiratory emergency room visits | Causal | 2013 | ||
| Respiratory hospital admissions | Causal | 2013 | ||
| PM2.5 | 24 h | Acute respiratory symptom days | Causal | 2022 |
| Adult chronic bronchitis cases | Suggestive | 2013 | ||
| Asthma symptom days | Causal | 2022 | ||
| Cardiac emergency room visits | Causal | 2022 | ||
| Cardiac hospital admissions | Causal | 2022 | ||
| Child acute bronchitis episodes | Causal | 2013 | ||
| Chronic exposure mortality | Causal | 2022 | ||
| Respiratory emergency room visits | Causal | 2022 | ||
| Respiratory hospital admissions | Causal | 2022 | ||
| Restricted activity days | Causal | 2013 | ||
| AQBAT: Air Quality Benefits Assessment Tool; NO2: nitrogen dioxide; O3: ozone; PM2.5: fine particulate matter or particulate matter with a diameter of 2.5 µm or less. | ||||
|
||||
CRF values for premature deaths are shown in Table 2. The table also summarizes methodological considerations for the current health impact assessment. The summary includes a list of fatal and non-fatal health effects associated with each air pollutant, data sources for estimating exposures to air pollution and national population-weighted average exposure estimates. Information on CRFs for all health endpoints were published previously (Health Canada 2021, Appendix B).
CRFs can be input as a distribution function in the AQBAT calculations, to account for inherent uncertainty in the CRF estimates. Monte Carlo simulations employing 10,000 iterations propagate this uncertainty in the CRFs. The model generates a central estimate of the most likely health impacts equivalent to the median of the output distribution, as well as low- and high-end estimates equivalent to the 2.5 and 97.5 percentiles of the output distribution.
| PM2.5 | NO2 | Annual O3 | Summer O3 | |
|---|---|---|---|---|
| Health effects | ||||
Cause of death and exposure type |
AllFootnote a – chronic |
AllFootnote a – acute |
AllFootnote a – acute |
Respiratory – chronic |
| % increase per change (key reference) |
10% per 10 µg/m3 |
1.5% per 20 ppb |
1.7% per 20 ppb |
8.2% per 20 ppb |
| Morbidity outcomes | Acute respiratory symptom days, adult chronic bronchitis cases, asthma symptom days, cardiac ER visits, cardiac HA, child acute bronchitis episodes, respiratory ER visits, respiratory HA, restricted activity days | None | None | Acute respiratory symptom days, asthma symptom days, minor restricted activity days, respiratory ER visits, respiratory HA |
| National exposure estimates | ||||
| Years of exposure data | 2017 to 2019 | 2017 to 2019 | 2017 to 2019 | |
| Type of exposure data (key reference) | Satellite observations, ground observations (NAPS) and chemical transport models (GEOS-Chem) (van Donkelaar and Martin 2022) | Satellite observations, ground observations (NAPS), geographic data (such as land use, distance to roadways) (Hystad and Larkin 2022a,b) | Objective analysis of ground observations (NAPS) and chemical transport model (GEM-MACH) (Robichaud and Ménard 2014) Annual and summer (May to September) averages |
|
| Average ambient concentrationFootnote b | 7.12 µg/m3 | 7.26 ppb | 37.16 ppb | 40.39 ppb |
| Background concentration | 1.8 µg/m3 | 0.15 ppb | 26 ppb | 28 ppb |
| Average above-background air pollution concentrationFootnote b | 5.32 µg/m3 | 7.11 ppb | 11.16 ppb | 12.39 ppb |
| ER: emergency room; GEM-MACH: Global Environmental Multiscale - Modelling air quality and Chemistry; GEOS-Chem: Goddard Earth Observing System chemical transport model; HA: hospital admissions; µg/m3: micrograms per cubic metre; NAPS: National Air Pollutant Surveillance network; ppb: parts per billion by volume. | ||||
|
||||
Baseline health endpoint rates
Baseline health endpoint rates are a measure of cases of a given endpoint relative to a population during a specific period. They are generally associated with many factors, such as age, gender, race, education, income, environment and lifestyle.
Baseline health endpoint rates are estimated through detection, observation and formal means of reporting (such as death certificates, hospital admission records) based on data provided by Statistics Canada (Judek et al. 2019; David Stieb personal communications 2023) or epidemiological studies (Abbey et al. 1995; Hoek et al. 2012; Krupnick et al. 1990; Ostro 1987; Osto and Rothschild 1989; Weinmayr et al. 2010). They are expressed in annual events per million people.
Baseline health endpoint rates for each of the health endpoints considered are needed to estimate the count of health outcomes associated with a change in pollutant concentration. They are pre-defined in AQBAT as a model parameter.
The 2018 national, provincial and territorial baseline rates for health endpoints associated with PM2.5, O3 and NO2 in the current version of AQBAT are summarized in Appendix C. The AQBAT model package includes the full list of baseline rates and are available by emailing hc.air.sc@canada.ca.
Annual baseline health endpoint rates are assigned to specific populations that correspond to those examined in the underlying epidemiologic studies. For example, the restricted activity days endpoint is assigned to 94% of people 20 years of age and older (non-asthmatics). Exposure to air pollutants typically has a minor influence on the baseline health endpoint rates. Additional details and references on the process of deriving baseline rates have previously been published (Judek et al. 2019; Stieb et al. 2015).
Baseline cause- and age-specific mortality rates are derived from counts of mortality obtained for each CD. Rates are averaged over the 3 most recent years of available data to improve stability and projected for future years (Judek et al. 2019; Stieb et al. 2015). For each morbidity and mortality health endpoint in AQBAT, a data file contains estimated annual events per million specified people for every geographic area, age group, scenario year and population projection. A single baseline rate is applied across the country in the absence of geographically resolved data for some health endpoints:
- acute respiratory symptom days
- asthma symptom days
- child acute bronchitis episodes
- adult chronic bronchitis cases
- restricted activity days
- minor restricted activity days
Estimates by age group
AQBAT includes CD-specific baseline mortality rates to estimate population health impacts. Since baseline mortality rates vary by age group and population characteristics vary across CDs, each CD has a specific baseline mortality rate representing its population. As expected, the baseline rate of mortality per million people increases with age, such that a greater fraction of the health burden affects the older population (Table 3). Also, CDs with older populations can be associated with higher baseline mortality rates than CDs with younger populations.
AQBAT calculations account for age-specific mortality rates, but age-specific outcomes are not a regular output for the model.
For the current assessment, AQBAT was modified to generate results for 7 age groups (in years): 25+, 30+, 40+, 50+, 60+, 65+ and all ages. The selected endpoints include chronic exposure mortality, acute exposure mortality and chronic exposure respiratory mortality. Table 3 shows the national population data and baseline mortality rates by age group and endpoint.
| Age group, in years | Population | Mortality rate, per million people | ||
|---|---|---|---|---|
| Chronic all-cause | Acute all-cause | Chronic respiratory | ||
| ≥ 25 | 26,536,768 | 9,790 | 9,790 | n/a |
| ≥ 30 | 23,977,351 | 10,800 | 10,800 | 1,080 |
| ≥ 40 | 18,924,957 | 13,600 | 13,600 | 1,360 |
| ≥ 50 | 14,113,375 | 17,900 | 17,900 | 1,800 |
| ≥ 60 | 8,830,834 | 26,700 | 26,700 | 2,790 |
| ≥ 65 | 6,389,283 | 33,900 | 33,900 | 3,650 |
| All agesFootnote a | 36,940,652 | 9,780 | 7,030 | 700 |
|
||||
Of note, the CRFs in AQBAT are not age-dependent. Only the baseline rates are. Further, the CRFs for mortality endpoints are applied nationally (same CRFs across all regions and populations).
Estimating the monetary value of health outcomes from air pollution
In AQBAT, each health endpoint is assigned a monetary value based on the willingness of individuals to pay for a reduction in risk of an adverse health outcome. The potential social, economic and public welfare consequences of a health endpoint are considered, including medical costs, reduced workplace productivity, pain and suffering, and values associated with changes in mortality risk. Values are typically derived from surveys, accounting or economic data.
Expressing impacts in Canadian dollars provides a common metric across health endpoints to estimate the overall benefits or damages (which helps to inform air quality management strategies). The sum indicates the benefits or damages to society resulting from reduced or increased risks to health.
The valuation estimates used in the model, along with references to the studies from which they are derived, are provided in Table 4. Endpoint valuations are included in AQBAT as a distribution of possible values with a defined distribution form (normal, discrete, or triangular) and set of parameters (such as minimum and maximum values). Temporal adjustments to the modelled monetized values are possible using Statistics Canada's consumer price index (Judek et al. 2019; Statistics Canada annual). In the current analysis, the currency year 2020 (2020 CAD) was used.
As shown in Table 4, the mortality valuation is considerably higher than any other health endpoint. For the purposes of policy analysis, the recommended central estimate of an avoided premature death is $6.5 million (2007 CAD) based on a review of Canadian studies by Chestnut and De Civita (2009). The underlying data indicate that the average person in Canada would be willing to pay about $65 to reduce the risk of premature death by 1 out of 100,000 people. The aggregate willingness to pay (WTP) of 100,000 people ($65 each) is equivalent to the value of 1 avoided premature death. The uncertainty in this estimate is addressed by a recommended low value of $3.5 million and a high value of $9.5 million (2007 CAD; Table 4).
These low and high values provide a reasonable range of WTP but should not be considered as lower and upper bounds (Chestnut and De Civita 2009). The values are not equivalent to the economic worth of an identified person's life, but rather an aggregate of the willingness of individuals to pay for small changes in risk. (Note: Empirical studies of WTP for mortality risk reductions provide estimates of the average monetary amount that individuals are willing to pay for small reductions in premature mortality. WTP values may vary for the same amount of risk reduction in different contexts and for different individuals. WTP can exceed the value of the financial impact on an individual associated with the change in risk.)
After adjusting for the consumer price index, the value used for an avoided premature death in 2020 CAD is $8 million.
| Endpoint (reference) | Currency year (as per reference) | Source type | FormFootnote a | Parameter 1 (prob.) | Parameter 2 (prob.) | Parameter 3 (prob.) |
|---|---|---|---|---|---|---|
Mortality (Chestnut and De Civita 2009) |
2007 | WTP/WR | Discrete | $3,500,000 (25%) |
$6,500,000 (50%) |
$9,500,000 (25%) |
Acute respiratory symptom days (Stieb et al. 2002) |
1997 | WTP | Normal | $13 | $7 | n/a |
Adult chronic bronchitis cases Krupnick and Cropper 1992; (Viscusi et al. 1991) |
1996 | WTP | Discrete | $175,000 (33%) |
$266,000 (34%) |
$465,000 (33%) |
Asthma symptom days (Stieb et al. 2002) |
1997 | WTP | Triangular | $7 | $28 | $120 |
Cardiac emergency room visitsFootnote b (Stieb et al. 2002) |
1997 | WTP | Normal | $4,400 | $590 | n/a |
Child acute bronchitis episodes (Krupnick and Cropper 1989) |
1996 | WTP | Discrete | $150 (33%) |
$310 (34%) |
$460 (33%) |
Elderly cardiac hospital admissions (Stieb et al. 2002) |
1997 | WTP | Normal | $5,200 | $610 | n/a |
Minor restricted activity days (Stieb et al. 2002) |
1997 | WTP | Normal | $22 | $9 | n/a |
Respiratory emergency room visitsFootnote b (Stieb et al. 2002) |
1997 | WTP | Normal | $2,000 | $210 | n/a |
Restricted activity days (Stieb et al. 2002) |
1997 | WTP | Normal | $48 | $18 | n/a |
Adapted from Judek et al. (2019). n/a: not applicable; prob.: probability of value being selected in the analysis; WR: wage risk; WTP: willingness to pay. |
||||||
|
||||||
Results
Table 5 presents the premature mortality estimates associated with PM2.5, O3 and NO2 air pollution for national, provincial and territorial geographies. Metrics in Table 5 include number of incidences and normalized values per 100,000 people. We used these metrics to compare health impact estimates across regions of different population sizes. All results represent the health impacts that can be attributed to above-background concentrations (refer to the Methods section).
Nationally, the total estimated premature deaths that can be attributed to above-background PM2.5, O3 and NO2 air pollution in 2018 is 17,400 (based on air pollutant concentrations from 2017 to 2019) or 47 premature deaths per 100,000 people.
The population health impacts of PM2.5, O3 and NO2 on the Canadian population in 2018 are estimated as follows:
- Chronic exposure to PM2.5 air pollution contributed to 4.8% of all-cause non-accidental deaths among people over the age of 25
- equivalent to 12,500 deaths per year or 34 deaths per 100,000 people
- Acute exposure to NO2 air pollution contributed to 0.5% of all-cause non-accidental deaths among people of all ages
- equivalent to 1,300 deaths per year or 3 deaths per 100,000 people
- Acute exposure to annual O3 air pollution contributed to 0.9% of all-cause non-accidental deaths among people of all ages
- equivalent to 2,400 deaths per year or 7 deaths per 100,000 people
- Chronic exposure to summer O3 air pollution contributed to 4.6% of respiratory-related deaths among people over the age of 30
- equivalent to 1,200 deaths per year or 3 deaths per 100,000 people
Note: Values for individual pollutants may not match totals because of rounding. Also, premature deaths per 100,000 people were estimated using total population counts.
The monetized value of the 17,400 premature deaths associated with air pollution is $139 billion (2020 CAD). (Note: Health Canada recognizes the possibility of overlap or double counting of endpoints. This is addressed in a previous report (Health Canada 2021).)
The results show large variations in premature deaths across geographic regions (Table 5). Higher mortality counts for Ontario, Quebec, British Columbia and Alberta reflect the greater populations and the higher air pollution levels modelled in these provinces (figures 1 to 3). Reported premature deaths per 100,000 people indicate that air pollution mortality risks are highest in Quebec and British Columbia, and lowest in Nunavut and the Northwest Territories. Results at the CD level are discussed further on.
| Region – population | Counts of premature deathsFootnote a | Monetized value(2020 CAD) × $1,000,000Footnote a | |||||
|---|---|---|---|---|---|---|---|
| Pollutant | per 100,000 | ||||||
| NO2 | PM2.5 | O3Footnote b | O3Footnote c | AllFootnote d | AllFootnote d | AllFootnote d | |
| Canada – 36,940,652 | 1,300 | 12,500 | 1,200 | 2,400 | 17,400 | 47 | 139,000 |
| Ontario – 14,273,238 | 570 | 4,300 | 560 | 1,100 | 6,500 | 46 | 52,200 |
| Quebec – 8,474,849 | 320 | 3,000 | 300 | 640 | 4,300 | 50 | 34,200 |
| British Columbia – 4,757,150 | 170 | 1,900 | 120 | 230 | 2,400 | 51 | 19,300 |
| Alberta – 4,464,715 | 120 | 1,700 | 120 | 240 | 2,100 | 48 | 17,100 |
| Manitoba – 1,337,062 | 37 | 470 | 15 | 53 | 570 | 43 | 4,600 |
| Saskatchewan – 1,129,316 | 28 | 430 | 27 | 59 | 540 | 48 | 4,300 |
| Nova Scotia – 950,428 | 21 | 270 | 23 | 77 | 390 | 41 | 3,100 |
| New Brunswick – 762,477 | 16 | 190 | 12 | 48 | 270 | 35 | 2,100 |
| Newfoundland and Labrador – 517,537 | 10 | 120 | 8 | 40 | 170 | 34 | 1,400 |
| Prince Edward Island – 153,031 | 3 | 42 | 3 | 11 | 59 | 39 | 470 |
| Yukon – 36,962 | 0 | 9 | 0 | 1 | 11 | 28 | 84 |
| Northwest Territories – 45,319 | 0 | 7 | 0 | 1 | 8 | 18 | 65 |
| Nunavut – 38,567 | 0 | 1 | 0 | 1 | 3 | 7 | 22 |
|
|||||||
The 2.5 and 97.5 percentiles reported in Table 6 representing the low- and high-range estimates are generally within a factor of 2 to 3 of the central estimates. The estimates for minor restricted activity days have a broader range owing to the associated CRF (Judek et al. 2019). Details on each of the CRF parameters have been published previously (Appendix B, Health Canada 2021).
| Health endpoint | Pollutant | CountFootnote a (2.5/97.5 percentile) | Monetized value (2020 CAD) × $1,000,000Footnote a (2.5/97.5 percentile) |
|---|---|---|---|
| Mortality | |||
| Acute exposure | NO2 | 1,300 (480/2,100) | 10,300 (2,900/21,500) |
| O3 | 2,400 (1,700/3,200) | 19,500 (8,300/34,500) | |
| Chronic exposure – respiratory | Summer O3Footnote b | 1,200 (400/1,900) | 9,500 (2,500/19,900) |
| Chronic exposure | PM2.5 | 12,500 (6,500/18,200) | 99,800 (38,300/187,000) |
| Total mortalityFootnote c | All pollutants | 17,400 (9,100/25,400) | 139,000 (52,100/263,000) |
| Morbidity | |||
| Acute respiratory symptom days | Summer O3 | 8,850,000 (239,000/17,400,000) | 160 (0/260) |
| PM2.5 | 30,600,000 (0/61,700,000) | 280 (0/1,100) | |
| Adult chronic bronchitis cases | PM2.5 | 11,400 (100/21,800) | 5,300 (180/13,100) |
| Asthma symptom days | Summer O3 | 938,000 (0/2,600,000) | 74 (0/410) |
| PM2.5 | 2,650,000 (561,000/4,690,000) | 210 (13/740) | |
| Cardiac emergency room visits | PM2.5 | 1,400 (740/2,000) | 9 (5/15) |
| Cardiac hospital admissionsFootnote d | PM2.5 | 1,100 (560/1,500) | n/a |
| Child acute bronchitis episodes | PM2.5 | 51,800 (0/113,000) | 25 (0/68) |
| Minor restricted activity days | O3 summer | 741,000 (0/8,490,000) | 25 (0/330) |
| Respiratory emergency room visits | O3 summer | 3,800 (510/7,100) | 12 (1/22) |
| PM2.5 | 3,900 (2,600/5,200) | 12 (7/16) | |
| Respiratory hospital admissions | O3 summer | 760 (70/1,400) | n/a |
| PM2.5 | 760 (500/1,000) | n/a | |
| Restricted activity days | PM2.5 | 16,500,000 (10,100,000/22,700,000) | 1,200 (300/2,300) |
| Total morbidityFootnote c | All pollutants | n/a | 7,300 (510/18,400) |
| n/a: not applicable. | |||
|
|||
Figure 4 shows variations in premature death rates per 100,000 people for CDs across Canada. Five groups were created to categorize normalized mortality rates that can be attributed to air pollution exposure. Groups 1 and 2 are associated with rates that are lower than the national average of 47 premature deaths per 100,000 (group 3). Groups 4 and 5 are associated with higher-than-average rates.
Specifically:
- Group 1 corresponds to rates up to the 10th percentile (27 premature deaths or less per 100,000 people)
- Group 2 corresponds to rates between the 10th and 40th percentiles (28 to 42 premature deaths per 100,000 people)
- Group 3 corresponds to rates between the 40th and 60th percentiles (43 to 50 premature deaths per 100,000 people)
- Group 4 corresponds to rates between the 60th and 90th percentiles (51 to 69 premature deaths per 100,000 people)
- Group 5 corresponds to rates equivalent or greater than the 90th percentile (70 premature deaths or more per 100,000 people)
Note: Percentiles are rounded to the nearest integer.
The geographic distribution of mortality rates per 100,000 people reflects the distribution of air pollution concentrations (figures 1 to 3), with CDs in groups 4 and 5 corresponding with regions of higher air pollution.
The results show that population size alone does not determine the rate of premature deaths, because some of the highest rates are observed outside of urban centres. While highly populated CDs are generally linked to higher estimates of premature deaths in absolute terms, it does not necessarily translate to higher death rates per 100,000 people. Appendix D lists the results for the most populous CDs in Canada (Table D1), with rates ranging from 28 in Peel, Ontario (CD3521) to 58 in Hamilton, Ontario (CD3525). Rates are 43 per 100,000 people in Toronto, 57 per 100,000 people in Montreal and 36 per 100,000 people in the Vancouver area.
Overall, it is suggested to consider both the absolute and relative estimates of premature deaths when interpreting the results from this analysis, especially for low-population CDs.
The CDs with higher rates of premature deaths correspond with a few distinct regions in Figure 4, including the southern part of British Columbia, central Alberta, southern Saskatchewan and the Windsor to Quebec City corridor. These CDs generally have moderate to large populations (about 30,000 to 200,000 per CD). CDs with the highest rates of premature deaths per 100,000 people are also listed in Table D2.
The results in British Columbia CDs align with the distribution of PM2.5 concentrations (Figure 1). The contribution from PM2.5-related deaths is generally greater than 80% of all deaths in those CDs (data not shown). Previous analyses indicate that wildfires are an important contributor to air pollution in central and southern British Columbia, including the Cariboo, Okanagan-Similkameen and Thompson-Nicola CDs (Matz et al. 2020).
By comparison, CDs with higher rates in the Windsor to Quebec City corridor show contributions from PM2.5-related deaths that are between 50% and 80% of all deaths. Exposure to O3 pollution also contributes greatly (20% to 35%) to overall premature deaths in these CDs.
The CDs with lower rates of premature deaths (Table D3) correspond with rural, northern or remote areas, including sparsely populated CDs in Nunavut, the Northwest Territories, and Labrador. Further, many of the CDs with lower rates of premature deaths from air pollution are characterized by younger populations than CDs with higher rates. For example, the 65 years and older population represents 10% or less of the total population in many of the CDs with lower rates, whereas the same age group represents 20% or more of the total population in CDs with higher rates. A detailed analysis of results by age groups follows.
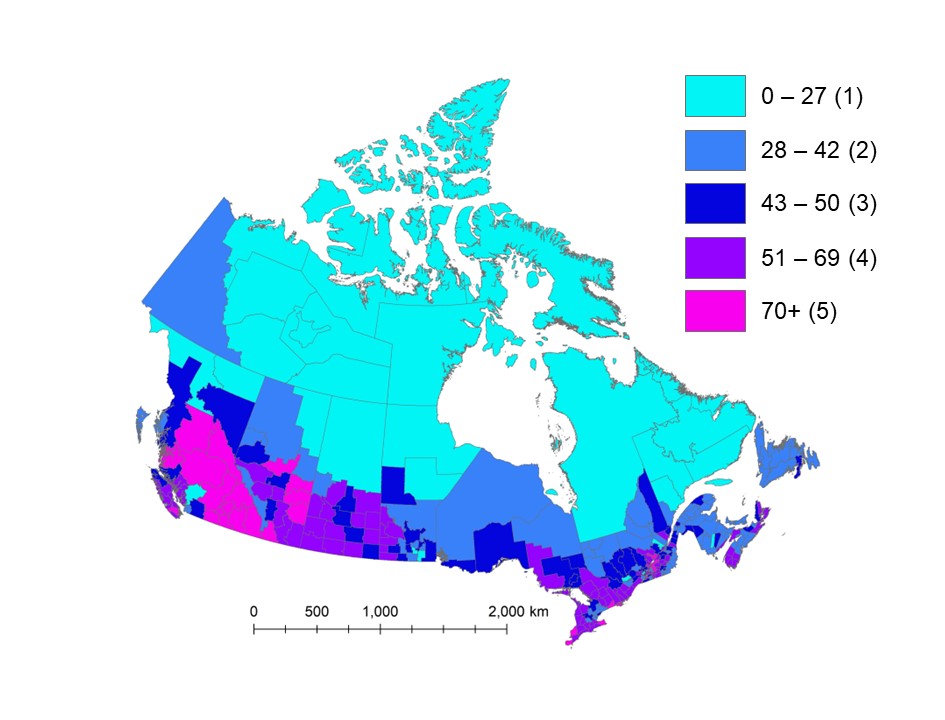
Figure 4 - Text description
Map of Canada showing premature deaths per 100,000 people associated with exposure to PM2.5, O3 and NO2 air pollution across census divisions in 2018. Estimates are classified in 5 groups of variable range. The central group includes the national average of 47 premature deaths per 100,000 people. Census divisions with higher estimates of premature deaths per 100,000 people (49 or more) correspond with larger urban centres and economic corridors as well as areas impacted by wildfires such as central British Columbia and in central and southern Alberta and Saskatchewan. Lower estimates (42 premature deaths per 100,000 people or less) generally correspond with the northern part of provinces and most of the territories.
Note: National average is 47 premature deaths per 100,000 people. Group 1 = 28 CDs; Group 2 = 87 CDs; Group 3 = 60 CDs; Group 4 = 88 CDs; Group 5 = 30 CDs.
The total monetized impact associated with air pollution in Canada in 2018 is about $146 billion (2020 CAD). This is largely driven by premature deaths, which represent $139 billion (2020 CAD) in annual impacts, or 95% of the overall monetized health burden. Although non-fatal impacts have lower monetary value ($7.3 billion (2020 CAD)) than premature deaths in 2018, they impact a large number of people and represent an important health burden for the Canadian population.
Mortality results by age group
AQBAT was modified for the current analysis to estimate premature deaths for 7 age groups. A similar analysis by age group for morbidity endpoints was not conducted.
National results are shown in Table 7. Overall, the results indicate that 84% of the air pollution mortality burden affects people aged 65 years and older. This reflects the age-variable baseline health risks across the population in Canada. The age groups younger than 50 years account for less than 3% of total premature deaths associated with exposure to air pollution. By mortality endpoint, the fraction of premature deaths associated with the 65 years and over age group varies between 83% and 91% (Table 8). The summer O3 chronic exposure respiratory mortality endpoint applies to people aged 30 years and older.
| Age group years | Population | All pollutants count (2.5/97.5 percentile)Footnote a | Percent of premature deaths by age groupFootnote b |
|---|---|---|---|
| 25 to 29 | 2,559,417 | 34 (18/50) | 0.2 |
| 30 to 39 | 5,052,394 | 120 (63/170) | 0.7 |
| 40 to 49 | 4,811,582 | 340 (180/500) | 1.9 |
| 50 to 59 | 5,282,541 | 1,100 (570/1,600) | 6.1 |
| 60 to 64 | 2,441,551 | 1,300 (670/1,800) | 7.3 |
| 65 and older | 6,389,283 | 14,600 (7,600/21,300) | 83.8 |
| All ages | 36,940,652 | 17,400 (9,100/25,400) | 100 |
|
|||
| Age group years | Chronic exposure mortality – PM2.5 | Chronic exposure respiratory mortality – summer O3 | Acute exposure mortality – NO2 | Acute exposure mortality – O3 |
|---|---|---|---|---|
| 25 to 29 | 0.2 | n/a | 0.2 | 0.2 |
| 30 to 39 | 0.7 | 0.3 | 0.7 | 0.7 |
| 40 to 49 | 2.0 | 0.9 | 2.0 | 2.0 |
| 50 to 59 | 6.4 | 2.9 | 6.4 | 6.3 |
| 60 to 64 | 7.4 | 5.0 | 7.2 | 7.4 |
| > 65 | 83.2 | 90.9 | 83.5 | 83.4 |
| All (counts) | 12,500 | 1,200 | 1,300 | 2,400 |
| n/a: not applicable. | ||||
Based on central estimates of AQBAT simulations; percentages rounded to 1 decimal.
Discussion
Canada's air pollution levels are low compared to those of other developed nations. However, recent Canadian studies indicate that air pollution increases the risk of mortality even at low ambient concentrations (Crouse et al. 2015; Pinault et al. 2017; Pappin et al. 2019; Weichenthal et al. 2022). Health Canada estimates that 17,400 deaths can be attributed to ambient air pollution in Canada in 2018. This corresponds to 47 deaths per 100,000 people annually. The monetary value of mortality and morbidity health outcomes associated with air pollution is about $143 billion annually (2020 CAD).
Canada's air quality levels
These estimates reflect the contributions from human sources of emissions in North America to Canada's ambient concentrations of PM2.5, O3 and NO2, and from natural events such as wildfires. In this analysis, we used air pollution data from 2017 to 2019 for PM2.5, O3 and NO2. To estimate the above-background component of ambient air pollution, we subtracted Canadian background concentrations from these 3-year average exposure surfaces. This approach was taken because above-background air pollution, which includes human-made emissions, is the subject of air quality management measures.
The provincial results (Table 5) indicate that Ontario and Quebec have the largest health impacts from air pollution in terms of premature deaths. About 62% of the total Canadian population resides in these 2 provinces. As well, some of the highest air pollution levels in Canada are found in the southern regions of Ontario and Quebec, which include the highly populated and industrialized Windsor to Quebec City corridor (encompassing the Greater Toronto and Hamilton area and Greater Montreal). British Columbia, Quebec and Alberta have the highest rates of premature deaths per 100,000 people. These rates account for the concordance between air pollution exposure, demographic characteristics (for example, population size and age distribution) and health data (for example, baseline health endpoint rates) across regions.
At the CD level (tables D1 to D3, Appendix D), results show that higher rates of premature deaths reflect a combination of demographic characteristics and environmental factors, including higher pollution levels. For example, several of the CDs with the highest rates of premature deaths per 100,000 people (Table D2) correspond with areas impacted by wildfire smoke in Canada (Matz et al. 2020), notably in British Columbia. Wildfire smoke also impacts other regions, including Alberta, Saskatchewan, Manitoba and the Northwest Territories.
In addition, baseline health endpoint rates integrate various health and demographic variables, notably age distribution. In general, CDs with older populations have higher baseline health endpoint rates and thus are associated with higher rates of health outcomes for a given air pollution increment.
In each CD, several factors influence the risks associated with exposure to air pollution and thus the rates of health outcomes per 100,000 people.
Age group impacts
AQBAT was modified for the current analysis to generate mortality burden estimates for different age groups.
The results for premature deaths by age group show that individuals impacted the most by air pollution are people aged 65 and older, which account for 83% to 91% of the estimated premature deaths. AQBAT includes age-specific mortality rates that generally increase with age (for instance, older age groups have higher baseline incidence of mortality than younger age groups).
The increasing mortality rates with age are independent of exposure to air pollution and the CRFs. The magnitude of the air pollutant concentrations (exposure levels) influences the overall health burden, but has no influence on the distribution of impacts with age. As noted previously, the same CRF applies equally to all relevant age groups in AQBAT. Age-specific CRFs are not defined in AQBAT and are not readily available in the literature.
Regional variations in the distribution of impacts across the population are driven by variations in age-specific baseline health incidence rates and the age structure of the population across CDs.
An analysis by age group was not conducted for morbidity endpoints. In general, a similar distribution of health impacts by age group is expected for morbidity endpoints that apply to the same target population as the mortality endpoints (for instance, all ages or 25 years of age and older). However, the results may not be indicative for morbidity endpoints that apply to distinct populations, including asthma symptoms days, child acute bronchitis episodes and adult chronic bronchitis cases.
Sensitivity and complementary analyses
This section presents sensitivity and complementary analyses on how environmental, demographic and population health variables influence health burden estimates.
Baseline health endpoint rates
Baseline mortality incidence rates vary by scenario year and can influence the estimate of premature deaths from air pollution (Stieb et al. 2023).
In Canada, the aging population generally corresponds with increased mortality incidence rates, such that even with a consistent level of air pollution, higher estimates of premature deaths are expected for later scenario years.
To put the results for the 2018 modelling year in context with results from our previous health burden report (Health Canada 2021), we conducted a sensitivity analysis. This involved varying the air pollution scenario years and the baseline incidence mortality rate years (Table 9). (Note: Population counts reflect the year selected for baseline mortality rates and increase over time.)
Our analysis shows that the results are sensitive to the baseline health endpoint rates. For the scenarios tested, about 740 more premature deaths (4% difference) were estimated nationally using 2018 baseline health endpoint rates compared to 2016 baseline health endpoint rates. This is equivalent to about 1 additional death per 100,000 people. In comparison, the population increased by 2.0% between 2016 and 2018. Premature deaths increase by about 210 premature deaths when using the 2019 baseline health endpoint rates (Table 9).
| Air pollution scenario year | Baseline incidence rate year | Premature deaths | Rate per 100,000 people |
|---|---|---|---|
| 2018 | 2016 | 16,600 | 46 |
| 2018 | 17,400 | 47 | |
| 2019 | 17,600 | 47 |
Based on our previous publication (Health Canada 2021) and the current analysis, the results indicate that the increase in the number of premature deaths between 2016 and 2018 is partly attributed to variations in baseline health endpoint rates. About 4% of premature deaths are due to higher baseline rates and a larger population between 2016 and 2018. However, as demonstrated in our sensitivity analysis of ambient PM2.5 modelling that follows, most of the increase in health burden between 2016 and 2018 is associated with model versions and higher air quality modelling estimates for PM2.5 concentrations.
Ambient PM2.5 modelling
The modelling approach for estimating ambient PM2.5 concentrations in the current analysis is comparable to previous health burden analyses (Heath Canada 2017, 2019, 2021). It relies on GEOS-Chem, satellite retrievals, ground-based measurements and algorithms. Improvements in available data, algorithms and modelling techniques can lead to variations in air pollution estimates. Thus, comparisons across analysis years or model versions need to account for inherent variabilities. For example, data sources can be expanded, such as using multiple satellite retrievals, and new algorithms for aerosol-size distribution properties can be developed and used (for example, Brauer et al. 2022 and references within this source). Comparisons across analysis years that rely on different model versions thus need to account for these factors.
Canadian monitoring data help to put into context the estimates from the current analysis and to evaluate the increased exposure estimates. Environment and Climate Change Canada's 2023 Canadian Sustainability Indicators report includes an analysis of ambient PM2.5 concentration measures at monitoring stations across Canada. As the analysis relies only on monitoring data collected at 145 monitoring stations, it does not compare directly to the modelling estimates covering all of Canada in the current report. However, the analysis does indicate measured trends in air pollution levels. The report indicates that average ambient PM2.5 concentrations in 2015 to 2017 and 2017 to 2019 were identical, at 6.8 µg/m3 (Table A.2 in ECCC 2023a).
Annual fluctuations, such as higher concentrations in 2018, are attributed in part to wildfire activity in western Canada (ECCC 2023a). British Columbia, the Prairies and northern Ontario were impacted the most by wildfire activity. Also, variations in weather conditions and changes in the quantity of emissions from various sources can potentially influence average PM2.5 concentrations.
As noted in Table 10, the modelled ambient PM2.5 concentrations in the 2017 to 2019 report are about 1 µg/m3 higher than estimates for the 2015 to 2017 report (Health Canada 2021).
| Exposure periodFootnote a | Population (year) | NO2 | Annual O3 | Summer O3 | PM2.5 | Total deaths | |||||
|---|---|---|---|---|---|---|---|---|---|---|---|
| pwe (ppb) | count | pwe (ppb) | count | pwe (ppb) | count | pwe (µg/m3) | count | count | per 100,000 | ||
| 2014 to 2017Footnote b | 36,229,449 (2016) | 7.2 | 1,300 | 13.2 | 2,800 | 14.4 | 1,300 | 4.3 | 10,000 | 15,300 | 42 |
| 2017 to 2019Footnote c | 36,940,652 (2018) | 7.11 | 1,300 | 11.16 | 2,400 | 12.39 | 1,200 | 5.32 | 12,500 | 17,400 | 47 |
| pwe: population-weighted exposure. | |||||||||||
|
|||||||||||
The model version for the original 2015 to 2017 exposure estimates was V4.NA.02, while the exposure estimates for 2017 to 2019 are based on version V5.NA.02.2. The changes applied to the newer model version improved the overall agreement with ground-based observations in North America and in Canada specifically. Changes involved adding variables that represent relative humidity, boundary layer height, geo-coordinates, elevation, and urban and water land types at simulation and sub-simulation grid resolution. Weighting conditions of ground-based monitoring data were also modified to include more monitors.
To test the influence of recent model developments on PM2.5 estimates, we used the same model version as the current analysis (V5.NA.02.2) to estimate the national population-weighted average PM2.5 concentrations for the 2015 to 2017 period. In addition, we also used the same version of AQBAT with updated baseline mortality rates for better comparisons. National results are summarized in Table 11.
| Air pollution scenario year | Model version | National average concentration – PM2.5 | Premature deaths – PM2.5Footnote c | Premature deaths – all pollutantsFootnote c | |
|---|---|---|---|---|---|
| Counts | Counts | per 100,000 people | |||
| 2016 | V4.NA.02Footnote a | 6.14 µg/m3 | 9,800 | 15,000 | 42 |
| V5.NA.02.2Footnote b | 7.32 µg/m3 | 12,400 | 17,700 | 49 | |
| 2018 | V5.NA.02.2Footnote b | 7.12 µg/m3 | 12,500 | 17,400 | 47 |
|
|||||
The results in Table 11 show the influence of the model version on ambient PM2.5 pollution estimates. The 2016 national average concentration with the more recent V5.NA.02.2 version is 7.32 µg/m3, 20% or 1.18 µg/m3 higher than the original 2016 estimate of 6.14 µg/m3. The resulting premature death estimate in 2016 reaches 17,700 annually with the V5.NA.02.2 version, which is 17% or 2,600 higher than the original estimate (15,000 premature deaths). This is comparable and slightly higher than the 2018 estimate with the same model version (17,400 premature deaths).
Regionally, larger relative differences between model versions for the year 2016 occur in the Atlantic provinces (53% to 125% difference) as well as in the territories (93% to 195% difference), likely owing to the lower concentration values in those regions. In absolute terms, the V5.NA.02.2 version leads to about 1,800 additional premature deaths in Alberta, British Columbia, Ontario and Quebec alone (70% of the total difference in premature deaths).
A comparison of the 2016 and 2018 estimates using only the V5.NA.02.2 version yields consistent results, with regional differences about 13% or less (except for the territories). These findings underline the importance of model versions. They also highlight:
- the importance of methodological changes and improvements on estimates of population exposure and health burden
- the limitations of comparing estimates from different Health Canada reports that use different methodologies
- how comparisons across health burden analyses are sensitive to the selection of data and tools
As we have demonstrated, comparisons across air pollution periods should be based on the same modelling tools and datasets, to control for endogenous model variables and algorithms.
Background or counterfactual concentrations
Background concentrations used in the current analysis are based on investigations of air pollution levels at remote monitoring stations. These concentrations are intended to represent minimal air pollution associated with both natural and non-North American sources. They account for local and regional sources, as well as pollution originating from sources farther away (intercontinental).
In this analysis, the estimated annual average background concentrations for Canada were 1.8 µg/m3 for PM2.5, 0.15 ppb for NO2 and 26 ppb for O3 (based on daily 1-hour maximum). The estimated summer O3 average background concentration was 28 ppb (May to September average based on daily 1-hour maximum). A single value is used nationally and for each pollutant.
Using consistent national values for estimating the air pollution health burden makes direct comparisons across regions, over time and across analyses possible as variability in the counterfactual concentrations is controlled. (Note: In air pollution health analyses, a counterfactual concentration is an alternative concentration used for comparing scenarios.)
This approach, however, introduces uncertainties. For example, background concentrations are likely to exhibit spatial variability across Canada and in time. As well, land cover, vegetation and climate conditions, even in regions not impacted by human activity, likely influence ambient air pollution levels. Further, seasonal and monthly variations in background conditions are also expected owing to normal photochemical and meteorological processes.
While background concentrations are low, evidence from large cohort studies of outdoor air pollution and mortality in Canada and elsewhere suggest there are significant health risks at very low exposure concentrations, with no apparent thresholds for adverse health effects.
In this section, we compared background concentrations used in our analyses to background values used in published Canadian cohort studies or estimated in analyses of Canadian ambient air monitoring data for O3, PM2.5 and NO2. Our goal was to evaluate the sensitivity of the health burden estimates to the counterfactual air pollutant concentrations, not to identify the most appropriate value.
Ozone
Environment and Climate Change Canada analyzed O3 data collected between 2002 and 2021 at 49 non-urban locations from the NAPS and CAPMoN networks (ECCC 2023b). These locations have low populations and share similar geography and land use. Most of the sites selected for the analysis were in central and northern Alberta and southern Ontario and Quebec, upwind and downwind of the larger urban areas.
Although the background sites were not necessarily located in remote areas, they were outside larger urban centres. Thus, it's likely that the O3 concentrations at these sites represent normal non-urban ambient exposure conditions. Some of the sites, especially those in southern Ontario and Quebec, are expected to be impacted by air pollution originating from the United States.
Analyses of 8-hour average daily maximum values over the 2002 to 2021 period, by season, are summarized in Table 12.
Analysis of the distribution of measurements across the non-urban stations indicates that mean, median, and spring and summer 10th percentile O3 concentrations are greater than the 26 ppb annual background value used in our health burden analyses. Temporally, the highest daily maximum 8-hour average values most often occur in April, May and June. The summer O3 background value of 28 ppb used by Health Canada roughly corresponds with the 10th percentile values for the months of July, August and September, but is much lower than the 10th percentile values in May (~38 ppb) and June (~35 ppb).
| Season | Mean | Median | 10th perc.Footnote a | 90th perc.Footnote a |
|---|---|---|---|---|
| Winter | 32.5 | 33.5 | 28 | 36 |
| Spring | 43.6 | 43.3 | 40 | 48 |
| Summer | 36.2 | 34.5 | 30 | 43 |
| Fall | 29.2 | 28.6 | 25 | 35 |
|
||||
Of note, the background values in this health burden assessment reflect 1-hour maximum daily values and are not directly comparable. Maximum 8-hour average values are expected to be lower than maximum hourly values. (Note: Previous studies indicate that interconversion between different averaging time metrics of O3 introduces uncertainty. The use of ratios, for example for converting 1-hour daily maximum values to 8-hour average daily maximum values, could differ geospatially, by temperature and by season (Anderson and Bell 2010; Lange 2018)). Comparisons should be interpreted accordingly.
Overall, the annual and summer 10th percentiles of observed O3 concentrations are approximately 5 to 8 ppb higher than the background values used in the current analysis. Some of our previous analyses in AQBAT indicate that an exposure increment of 8 ppb in annual O3 results in about 1,700 premature deaths annually in Canada, while the same increment in summer O3 results in 760 premature deaths. These are equivalent to 71% and 63% of the estimated health burden attributable to O3 and summer O3, respectively, in this report. Regional (eastern and western) differences would also be expected.
Nitrogen dioxide
Detailed published analyses of background NO2 concentrations in Canada were not identified. A preliminary analysis of NAPS NO2 data for 2017 to 2019 (Government of Canada 2023) shows that several monitoring stations are associated with minimum daily mean values less than 1 ppb. (Note that NO2 concentrations are indicated as 0.) Daily mean values are also less than 1 ppb up to the 50th percentile for several monitoring stations. On a monthly basis, minimum values are less than 1 ppb from March to October and reach 1 ppb from November to December. A direct comparison with the 0.15 ppb background concentration used in our current analysis is not possible. However, recent ambient NO2 concentrations in Canada suggest that annual background concentrations could be less than 1 ppb.
Our previous analyses in AQBAT indicate that a 0.5 ppb NO2 exposure increment corresponds with about 95 premature deaths annually in Canada. This is equivalent to a 7% difference compared to the NO2 health burden estimated for the 2017 to 2019 period.
Fine particulate matter
The Canadian Smog Assessment Report (Government of Canada 2013) summarizes an analysis based on 1996 to 2005 data from 7 NAPS sites that were not influenced by urban or industrial emissions.
The analysis used 6-hour average PM2.5 concentrations and backward air trajectories, targeting air masses with the lowest concentrations during that period. (An annual average of 6-hour average concentrations is expected to be similar to the annual average of 24-hour average concentrations.) The range of the 6-hour average concentrations across stations was 1.2 to 4.2 µg/m3, with an overall median of 3.2 µg/m3. (Note: In the Canadian Smog Assessment Report, baseline refers to values derived from monitoring data that are minimally influenced by human-made or natural emissions within North America. This is equivalent to background concentrations used in this report.)
Canadian cohort studies investigating PM2.5 air pollution risks have reported lower exposure concentrations between 2.4 and 3.0 µg/m3. For example, in a study by Burnett et al. (2018), a counterfactual concentration of 2.4 µg/m3 was indicated as the lowest observed concentration across 41 cohorts globally to estimate mortality associated with long-term exposure to ambient PM2.5. Similar counterfactual PM2.5 concentrations have been reported for various Canadian cohorts (for example, Cakmak et al. 2018; Pinault et al. 2016; Weichenthal et al. 2022; WHO 2021).
Compared to lower exposure concentrations between 2.4 and 3.2 µg/m3, the background concentration value of 1.8 µg/m3 used in this analysis is 0.8 to 1.4 µg/m3 lower. Previous simulations with AQBAT indicate that:
- a PM2.5 increment of 1 µg/m3 represents about 2,400 premature deaths nationally
- every 0.5 µg/m3 increment represents about 1,200 premature deaths nationally
Overall, background values used in our health burden analyses are lower than observations made over the last 2 decades at remote NAPS stations. The background concentrations used in our analyses of air pollution are also lower than counterfactual concentrations used by international organizations, such as the WHO or the IHME for the GBD analyses (for example, theoretical minimum risk exposure level by Cohen et al. 2017), and in most epidemiological studies.
As noted, using higher background concentrations could lower the health burden estimates for premature death by thousands. This underlines the importance of considering counterfactual concentrations in the air pollution health burden analysis.
The background concentration values used in this report and previous Health Canada reports are identical. Any comparison across health burden analyses needs to account for background values. Doing so will ensure that any comparisons made are relevant, as background values have a direct impact on estimates of exposure and on the 'true' magnitude of the health burden. Additional analyses will help determine the most appropriate background concentrations.
Influence of COVID-19 lockdown conditions
The main analysis for the current report targets the 2017 to 2019 period.
In 2020, economic and social restrictions (such as stay-at-home orders) were adopted in Canada to manage risks associated with COVID-19. The evidence currently suggests that air pollution in 2020 differed from previous years (Adams 2020; Fioletov et al. 2022; Griffin et al. 2020; Mashayekhi et al. 2021; Zhao et al. 2022). Studies conducted in Canada showed that NO2 concentrations, for example, were lower in the months following the lockdown compared to historical records (Fioletov et al. 2022; Griffin et al. 2020; Zhao et al. 2022).
In our sensitivity analysis on the influence of 2020 on health burden estimates, we compared the health burden for the 2017 to 2019 period with the 2018 to 2020 period. This was the most recent 3-year period of air pollution data available at the time of this analysis. The results of the 2018 to 2020 period analysis are discussed in Appendix A.
Comparisons to previous health burden analyses by Health Canada
Compared to the previous analysis by Health Canada (Table 10), the mortality health burden of air pollution in Canada for 2018 represents an increase of 14%: from 15,300 in 2016 to 17,400 in 2018. The change in the number of premature deaths between analyses depends on the following:
- estimates of exposure to air pollution across Canada
- estimates of the risk of health effects from exposure to air pollutants
- demographic data, including population counts, age profiles and baseline health status
The population-weighted concentrations (above-background) in this analysis are consistent with or slightly less than previous reports for NO2, O3 and summer O3. (Although the national average estimates are comparable, regional variability is possible.) Estimates are summarized in Table 10. By contrast, an increase of about 1 µg/m3 is noted for PM2.5 in this analysis.
Variations in air pollution exposure estimates across analyses can reflect increases or decreases in ambient concentrations. However, the most likely source of the higher PM2.5 concentrations in this analysis is a methodological shift in exposure modelling to improve estimates. Complementary analyses showed that the variation in PM2.5 exposure estimate is related mainly to modifications in the modelling since the 2015 to 2017 analysis. Refer to the previous Sensitivity and complementary analyses section.
The air pollution estimates suggest that the geographic distribution of air pollution in Canada has not changed substantially across analysis years. The highest air pollution estimates are reported in the same CDs (those associated with the southern regions of British Columbia and Alberta) and in areas along the Windsor to Quebec City corridor.
The risk estimates for the various health outcomes, represented by CRFs, were consistent between this analysis and that of previous reports. As such, they are not considered a source of variation across the estimates. The 2018 Canadian population increased by about 711,200 people (2%) over 2016. This suggests that population growth has a fairly small influence on the estimated increase in health burden.
Health burden estimates also depend on baseline health endpoint rates, which depend on population health characteristics. For example, an aging population would be associated with higher baseline health endpoint rates. The current version of AQBAT includes baseline health endpoint rates that are specific to the modelling year. Sensitivity analyses that looked at the influence of the baseline health endpoint rates on health burden estimates are discussed previously in this section. They showed that baseline health endpoint rates increased between 2016 and 2018, such that the same exposure concentration would lead to a higher health burden in 2018.
Comparisons to other health burden analyses for Canada
Other studies have estimated the impact of air pollution on the Canadian population, most notably using the approaches developed under the IHME's Global Burden of Disease (GBD) project.
Overall, Canada has low levels of air pollution and relatively few air pollution-related deaths compared to other countries. The GBD analysis estimated 4,409 premature deaths from exposure to O3 and PM2.5 in Canada for the year 2018. This is equivalent to 12 premature deaths per 100,000 people. GBD estimates for 2016 and 2019 are 4,154 and 4,405 premature deaths, respectively. These are also equivalent to 12 premature deaths per 100,000 people.
The GBD estimates of premature mortality in Canada are consistently lower than Health Canada's estimate for the same year. However, the average air pollution estimates used for the GBD analyses are similar to Heath Canada's estimates and are unlikely the cause of the discrepancies. For example, the GBD national average PM2.5 concentrations for the 2017 to 2019 period is about 7.15 µg/m3. This compares to the 7.12 µg/m3 value used in this analysis for the same period.
Differences between analyses are partly associated with the CRFs considered in the analyses. For example, in the current analysis, the PM2.5 CRF for all-cause mortality from the Canadian study by Crouse et al. (2012) was used. The GBD analysis used an amalgam of several international studies, 5 specific causes of mortality and a somewhat different approach for classifying mortality effects.
As well, while both the Health Canada and GBD approaches incorporate mortality effects for O3, the specific causes of death or CRFs are different and lead to different estimates. Moreover, in Canadian analyses of the health impacts of air pollution, NO2 exposure contributes to 1,300 premature deaths annually. The GBD approach does not include NO2. This demonstrates the influence of the CRF and underlines the importance of selecting the most scientifically relevant CRFs for the Canadian population.
Our analysis uses Canadian analyses of background concentrations that are considerably lower than the counterfactual scenario in the GBD analysis (theoretical minimum risk exposure level (Cohen et al. 2017)). This results in additional differences. For example, previous simulations with AQBAT indicate that a national average PM2.5 increment of 1 µg/m3 represents about 2,400 premature deaths annually.
Lastly, as a comparison, GBD estimates for the United States predicted about 60,000 premature deaths from PM2.5 and O3 in 2019. This figure is considerably lower than published country-specific estimates, which show about 120,000 premature deaths from PM2.5 and O3 (Davidson et al. 2020; Thakrar et al. 2020).
Conclusions
An established database of international epidemiological studies and toxicological investigations recognizes that air pollution is a leading risk factor for premature deaths. Health Canada's own comprehensive risk assessments (2013, 2016, 2022) show that exposures to PM2.5, O3 and NO2 pose the large risks and exert the largest population health impacts in Canada among ambient air pollutants.
Our current analysis estimates and monetizes mortality and morbidity impacts associated with above-background ambient air pollutant levels in Canada. These levels correspond to the fraction of air pollution that is generally targeted by air quality management measures.
Health Canada estimates that exposure to air pollution from PM2.5, O3 and NO2 contributed to 17,400 premature deaths in Canada in 2018, equal to 47 premature deaths per 100,000 people. Non-fatal health outcomes that can be attributed to air pollution included 35 million acute respiratory symptom days, 2.7 million asthma symptom days and 8,100 emergency room visits annually. The monetized value of adverse air pollution health impacts is $146 billion (2020 CAD) in 2018. Although air pollution affects the health of people in all regions of the country, the largest impacts are seen in the provinces with the most population and the highest air pollution levels. These are Ontario, Quebec, British Columbia and Alberta.
Most of the mortality burden estimated by Health Canada is attributed to PM2.5 (72%). O3 and NO2 account for 21% and 11%, respectively. As well, both O3 and PM2.5 are associated with non-fatal health impacts. While exposure to NO2 is associated with several important respiratory effects (Heath Canada 2016), there are currently no CRFs in AQBAT for NO2 and morbidity outcomes.
Analyses by age group indicate that 83% to 91% of the air pollution mortality burden affects people 65 years and older. This is in line with the population baseline health risks for older people in Canada. The development of age-specific CRFs and geography-specific CRFs, if justified based on the state of science, could expand opportunities to investigate issues related to age, geographic region and air pollution risks and burden.
The estimate of 17,400 premature deaths or 47 premature deaths per 100,000 people in 2018 is higher than our previously published estimates. Previous estimates varied from 41 to 42 premature deaths per 100,000 people (Health Canada 2017, 2019, 2021). A comparison of 2018 population-weighted exposure concentrations with the previous 2016 estimate (using air pollution data from 2015 to 2017) showed that PM2.5 levels increased by 1 µg/m3 in 2018, resulting in additional premature deaths. Complementary analyses showed that increased PM2.5 levels can be attributed to methodological updates to the air quality model used to estimate PM2.5 exposure, specifically the use of the V5.NA.02.2 version.
A re-analysis of 2015 to 2017 PM2.5 data using the V5.NA.02.2 version as a sensitivity analysis led to increased population-weighted ambient air concentrations over the original model version, by approximately 1.2 µg/m3. AQBAT simulations using the re-analysis results in 17,700 premature deaths, or 49 premature deaths per 100,000 people annually (in 2016). The findings with a single model version show that the health burden associated with air pollution in Canada in 2018 was slightly lower than in 2016.
While people in Canada benefit from relatively good air quality, air pollution continues to have an impact on human health.
The data and methods (for example, background concentrations, CRFs) used in the current analysis incorporate up-to-date science, data and knowledge on the health effects of air pollution in Canada. Furthermore, the evidence suggests that air pollution may be associated with other adverse health outcomes that we did not consider. There are also other air pollutants that are responsible for adverse health effects. For all these reasons, the population health outcomes outlined in this analysis probably underestimate the adverse health impacts of air pollution in Canada.
Changes in health impact estimates are to be expected following each update by Health Canada. Variations or discrepancies between estimates may occur owing to the following changes in:
- valuation estimates
- population demographics
- concentration-response relationships
- the baseline rates of adverse outcomes in Canada
- data or methods to assess population exposure to air pollutants
Sensitivity analyses, such as the one discussed in this report, can be used to explore the influence of different factors. It may also be possible to re-estimate the health impacts for years included in previous analyses to ensure that estimates are based on internally consistent methods and data.
References
- Abbey DE, Lebowitz MD, Mills PK, Petersen FF, Beeson L, Burchette RJ. 1995. Long term ambient concentrations of particulates and oxidants and development of chronic disease in a cohort of nonsmoking California residents. Inhal Toxicol 7(1): 19–34.
- Adams MD. 2020. Air pollution in Ontario, Canada during the COVID-19 State of Emergency. Sci total Environ 742: 140516.
- Anderson GB; Bell ML. 2010. Does one size fit all? The suitability of standard ozone exposure metric conversion ratios and implications for epidemiology. J Expo Sci Environ Epidemiol 20(1): 2–11.
- Bindle L, Martin RV, Cooper MJ, Lundgren EW, Eastham SD, Auer BM, Clune TL, Weng H, Lin J, Murray LT, Meng J, Keller CA, Putman WM, Pawson S, Jacob DJ. 2021. Grid-stretching capability for the GEOS-Chem 13.0.0 atmospheric chemistry model. Geosci Model Dev 14: 5977–5997.
- Boersma KF, Eskes HJ, Dirksen RJ, van der A RJ, Veefkind JP, Stammes P, Huijnen V, Kleipool QL, Sneep M, Claas J, Leitão J, Richter A, Brunner D. 2011. An improved retrieval of tropospheric NO2 columns from the Ozone Monitoring Instrument. Atmos Meas Tech 4: 1905–1928.
- Boys B, Martin RV, Van Donkelaar A, MacDonell R, Hsu NC, Cooper MJ, Yantosca RM, Lu Z, Streets DG, Zhang Q, Wang SW. 2014. Fifteen-year global time series of satellite-derived fine particulate matter. Environ Sci Technol 48 : 11109–11118.
- Brauer M, Brook JR, Christidis T, Chu Y, Crouse DL, Erickson A, et al. 2022. Mortality–Air Pollution Associations in Low Exposure Environments (MAPLE): Phase 2. Research Report 212. Boston, MA: Health Effects Institute. 119 pp.
- Burnett RT, Stieb D, Brook JR, Cakmak S, Dales R, Raizenne M, Vincent R, Dann T. 2004. Associations between short-term changes in nitrogen dioxide and mortality in Canadian cities. Arch Environ Health 59(5): 228–36.
- Burnett R, Chen H, Szyszkowicz M et al. 2018. Global estimates of mortality associated with long-term exposure to outdoor fine particulate matter. Proceedings of the National Academy of Sciences 115 (38): 9592–9597.
- Cakmak S, Hebbern C, Pinault L, Lavigne E, Vanos J, Crouse DL et al. 2018. Associations between long-term PM2.5 and ozone exposure and mortality in the Canadian Census Health and Environment Cohort (CANCHEC), by spatial synoptic classification zone. Environ Int 111: 200–211.
- Chestnut LG, De Civita P. 2009. Economic valuation of mortality risk reduction: review and recommendations for policy and regulatory analysis. Prepared for the Government of Canada Policy Research Initiative. PRI Project – Regulatory strategy.
- Cohen AJ, Brauer M, Burnett R, Anderson HR, Frostad J, Estep K, Feigin V et al. 2017. Estimates and 25-year trends of the global burden of disease attributable to ambient air pollution: an analysis of data from the Global Burden of Diseases Study 2015. The Lancet 389(10082): 1907–1918.
- Crouse DL, Peters PA, van Donkelaar A, Goldberg MS, Villeneuve PJ, Brion O, Khan S, Atari DO, Jerrett M, Pope CA, Brauer M, Brook JR, Martin RV, Stieb D, Burnett RT. 2012. Risk of nonaccidental and cardiovascular mortality in relation to long-term exposure to low concentrations of fine particulate matter: a Canadian national-level cohort study. Environ Health Perspect 120(5): 708–714.
- Crouse DL, Peters PA, Hystad P, Brook JR, van Donkelaar A, Martin RV, Villeneuve PJ, Jerrett M, Goldberg MS, Pope CA, Brauer M, Brook RD, Robichaud A, Menard R, Burnett RT. 2015. Ambient PM2.5, O3, and NO2 exposures and associations with mortality over 16 years of follow-up in the Canadian Census Health and Environment Cohort (CanCHEC). Environ Health Perspect 123(11): 1180–1186.
- [CRS] Congressional Research Service. 2019. Background ozone: challenges in science and policy. Prepared for Members and Committees of Congress. R45482. 18 pp. https://fas.org/sgp/crs/misc/R45482.pdf
- Davidson K, Fann N, Zawacki M, Fulcher C, Baker KR. 2020. The recent and future health burden of the U.S. mobile sector apportioned by source. Environ Res Lett: 075009.
- [ECCC] Environment and Climate Change Canada. 2018. Canadian Environmental Sustainability Indicators – Air quality. Cat. EN4-144/57-2018E-PDF. Available at: www.canada.ca/en/environment-climate-change/services/environmental-indicators/air-quality.html
- ECCC. 2020. Canada's air pollutant emissions inventory report – 1990–2018. Cat. En81-30E-PDF. 96 pp.
- ECCC. 2022. Canada's air pollutant emissions inventory report – 1990–2020. Cat. En81-30E-PDF. 111 pp.
- ECCC. 2023a. Canadian Environmental Sustainability Indicators – Air quality. Cat. En4-144/57-2023E-PDF. 149 pp.
- ECCC. 2023b. O3 trends at rural background stations. February 2023. Produced by the NAPS Data Management Unit, ECCC, for the Air Sectors Health Assessment Section of Health Canada. [internal report].
- Fioletov V, McLinden CA, Griffin D, Krotkov N, Liu F, Eskes H. 2022. Quantifying urban, industrial, and background changes in NO2 during the COVID-19 lockdown period based on TROPOMI satellite observations. Atmos Chem Phys 22: 4201–4236.
- Government of Canada. 2013. Canadian smog science assessment. Volume 1: Atmospheric science and environmental/economic impacts. Cat. EN88-5/1-2012E. 1039 pp.
- Government of Canada. 2023. National Air Pollution Surveillance (NASP) Program. Available at: https://donnees-data.ec.gc.ca/data/air/monitor/national-air-pollution-surveillance-naps-program/Data-Donnees/?lang=en (accessed September 14, 2023).
- Griffin D, McLinden C, Racine J, Moran M, Fioletov V, Pavlovic R, Eskes H. 2020. Assessing the impact of Corona-virus-19 on nitrogen dioxide levels over southern Ontario, Canada. Remote Sens 12(24): 4112.
- Health Canada. 2013. Canadian smog science assessment – Volume 2: Health Effects. Air Health Sciences Division. Cat. En88-5/2-2013E-PDF. 533 pp.
- Health Canada. 2016. Human health risk assessment for ambient nitrogen dioxide. Water and air quality Bureau, Safe Environments Directorate. Cat. H144-31/2016E-PDF. 288 pp.
- Health Canada. 2017. Health impacts of air pollution in Canada – An estimate or premature mortalities. Government of Canada. ISBN 978-0-660-23740-4. 13 pp.
- Health Canada. 2019. Health impacts of air pollution in Canada – Estimate of morbidity and premature mortality outcomes – 2019 report. Government of Canada. ISBN 978-0-660-31165-4. 38 pp.
- Health Canada. 2021. Health impacts of air pollution in Canada – Estimate of premature deaths and nonfatal outcomes – 2021 report. Government of Canada. ISBN 978-0-660-37331-7. 56 pp.
- Health Canada. 2022. Canadian health science assessment for fine particulate matter (PM2.5). Government of Canada. ISBN 978-0-660-41742-4. 120 pp.
- Health Canada. 2023. Health impacts of air pollution from transportation, industry and residential sources in Canada. Government of Canada. ISBN 978-0-660-46335-3. 123 pp.
- Hoek G, Pattenden S, Willers S, Antova T, Fabianova E, Braun-Fahrländer C, et al. 2012. PM10 and children's respiratory symptoms and lung function in the PATY study. Eur Respir J 40(3): 538–47.
- Hystad P, Larkin P. 2022a. Updated Canadian NO2 land use regression model for 2019 and predictions of Canadian NO2 concentrations. Prepared for Health Canada. 15 pp.
- Hystad P, Larkin P. 2022b. Updated Canadian NO2 land use regression model for 2020 and predictions of Canadian NO2 concentrations. Prepared for Health Canada. 18 pp.
- Hystad P, Setton E, Cervantes A, Poplawski K, Deschenes S, Brauer M, van Donkelaar A, Lamsal L, Martin R, Jerrett M, Demers P. 2011. Creating national air pollution models for population exposure assessment in Canada. Environ Health Perspect 119: 1123–1129.
- [IHME and HEI] Institute for Health Metrics and Evaluation and Health Effects Institute. 2020. State of Global Air/2020. A special report on global exposure to air pollution and its health impacts. Health Effects Institute, Boston, MA. 28 pp. www.stateofglobalair.org/
- [IHME and HEI] Institute for Health Metrics and Evaluation. 2019. GBD Compare – 2019. https://vizhub.healthdata.org/gbd-compare/
- Jerrett M, Burnett RT, Pope CA III, Ito K, Thurston G, Krewski D, Shi Y, Calle E, Thun M. 2009. Long-term ozone exposure and mortality. N Engl J Med 360(11): 1085–1095.
- Judek S, Stieb D, Xi G, Jovic B, Edwards B. 2019. Air Quality Benefits Assessment Tool (AQBAT) – User Guide – Version 3. Healthy Environments and Consumer Safety Branch, Health Canada. 205 pp.
- Kalnay E. 2003. Atmospheric Modeling, Data Assimilation and Predictability: New York: Cambridge University Press.
- Krupnick AJ, Cropper ML. 1989. Valuing chronic morbidity damages: medical costs, labor market effects and individual valuations. Final report to Office of Policy Analysis, US Environmental Protection Agency. 269 pp.
- Krupnick AJ, Harrington W, Ostro B. 1990. Ambient ozone and acute health effects: Evidence from daily data. J Environ Econ Manage 18(1): 1–18.
- Krupnick AJ, Cropper ML. 1992. The effect of information on health risk valuations. J Risk Uncertain 5: 29–48.
- Lamsal LN, Martin RV, van Donkelaar A, Steinbacher M, Celarier EA, Bucsela E, et al. 2008. Ground-level nitrogen dioxide concentrations inferred from the satellite-borne Ozone Monitoring Instrument. J Geophys Res Atmos 113: D16308.
- Lange SS. 2018. Comparing apples to oranges: interpreting ozone concentrations from observational studies in the context of the United States ozone regulatory standard. Sci Tot Environ 644: 1547–1556.
- Makar P, Akingunola A, Aherne J, Cole A, Aklilu Y, Zhang J, Wong I, Hayden K, Li S, Kirk J, Scott K, Moran M, Robichaud A, Cathcart H, Baratzedah P, Pabla B, Cheung P, Zheng Q, Jeffries DS. 2018. Estimates of exceedances of critical loads for acidifying deposition in Alberta and Saskatchewan. Atmos Chem Phys 18: 9897–9927.
- Mashayekhi R, Pavlovic R, Racine J, Moran MD, Manseau PM, Duhamel A, Katal A, Miville J, Niemi D, Peng SJ, Sassi M, Griffin D, McLinden CA. 2021. Isolating the impact of COVID-19 lockdown measures on urban air quality in Canada. Air Qual Atmos Health. https://doi.org/10.1007/s11869-021-01039-1
- Matz CJ, Egyed M, Guoliang X, Racine J, Pavlovic R, Rittmaster R, Henderson SB, Stieb DM. 2020. Health impact analysis of PM2.5 from wildfire smoke in Canada (2013–2015, 2017–2018). Sci Total Environ 725: 138506.
- Moran MD, Ménard S, Talbot D, Huang P, Makar PA, Gong W, Landry H, Gravel S, Gong S, Crevier L-P, Kallaur A, Sassi M. 2010. Particulate-matter forecasting with GEM-MACH15, a new Canadian air-quality forecast model. Air pollution modelling and its application XX, edited by Steyn DG and Rao, ST, Springer, Dordrecht. Pp. 289–292.
- Ostro BD. 1987. Air pollution and morbidity revisited: A specification test. J Environ Econ Manage 14(1): 87–98.
- Ostro BD, Rothschild S. 1989. Air pollution and acute respiratory morbidity: An observational study of multiple pollutants. Environ Res 50(2): 238–47.
- Pappin AJ, Christidis T, Pinault LL, Crouse DL, Brook JR, Erickson A, Hystad P, Li C, Martin RV, Meng J, Weichenthal S, van Donkelaar A, Tjepkema M, Brauer M, Burnett RT. 2019. Examining the shape of the association between low levels of fine particulate matter and mortality across three cycles of the Canadian Census Health and Environment Cohort. Environ Health Perspect 127(10): 107008.
- Pinault L, Tjepkema M, Crouse DL, Weichenthal S, van Donkelaar A, Martin RV et al. 2016. Risk estimates of mortality attributed to low concentrations of ambient fine particulate matter in the Canadian Community Health Survey cohort. Environ Health 15: 18.
- Pinault LL, Weichenthal S, Crouse DL, Brauer M, Erickson A, van Donkelaar A, Martin RV, Hystad P, Chen H, Finès P, Brook JR, Tjepkema M, Burnett RT. 2017. Associations between fine particulate matter and mortality in the 2001 Canadian Census Health and Environment Cohort. Environmental Research 159: 406–415.
- Robichaud A, Ménard R. 2014. Multi-year objective analyses of warm season ground-level ozone and PM2.5 over North America using real-time observations and the Canadian operational air quality models. Atmos Chem Phys 14(4): 1769–1800.
- Robichaud A, Ménard R, Zaïtseva Y, Anselmo D. 2016. Multi-pollutant surface objective analyses and mapping of air quality health index over North America. Air Qual Atmos Health 9:743–759.
- Shin HH, Cohen A, Pope CA III, Ezzati M, Lim SS, Hubbell B, et al. 2013. Critical issues in combining disparate sources of information to estimate the Global Burden of Disease attributable to ambient fine particulate matter exposure. Working paper prepared for: Methods for Research Synthesis: A Cross-Disciplinary Workshop. Cambridge (MA): Harvard Center for Risk Analysis. www.hsph.harvard.edu/wp-content/uploads/sites/1273/2013/09/Shin-et-al.-Sept-2013.pdf
- Statistics Canada. Annual. Table 18-10-0005-01 – Consumer Price Index, annual average, not seasonally adjusted. www150.statcan.gc.ca/t1/tbl1/en/tv.action?pid=1810000501
- Stieb DM, De Civita P, Johnson FR, Manary M, Anis A, Beveridge RC, Judek S. 2002. Economic evaluation of the benefits of reducing acute cardiorespiratory morbidity associated with air pollution. Environ Health 1: 1–13.
- Stieb DM, Judek S, van Donkelaar A, Martin RV, Brand K, Shin HH, Burnett RT, Smith-Doiron M. 2015. Estimated public health impact of changes in fine particle air pollution in Canada, 2000–2011. Can J Public Health 106(6): 362–368.
- Stieb DM, Smith-Doiron M, Quick M, Christidis T, Xi G, Miles RM, Van Donkelaar A, Martin RV, Hystad P, Tjepkema M. 2023. Inequality in the distribution of air pollution attributable mortality within Canadian cities. Geo Health 7: e2023GH000816.
- [TFHTAP] Task Force on Hemispheric Transport of Air Pollution. 2010. Hemispheric transport of air pollution 2010 – Part A: Ozone and particulate matter. Air Pollution Studies No. 17. Editors: Dentener F, Keating T & Akimoto H. Economic Commission for Europe. 304 pp. http://www.htap.org
- Thakrar SK, Balasubramanian S, Adams PJ, Azevedo IML, Muller NZ, Pandis SN, Polasky S, Pope CA, Robinson AL, Apte JS, Tessum CW, Marshall JD, Hill JD. 2020. Reducing mortality from air pollution in the United States by targeting specific emission sources. Environ Sci Technol Letters 7(9): 639–645.
- [US EPA] United States Environmental Protection Agency. 2019. Integrated science assessment for particulate matter. Office of Research and Development. 1967 pp. Available online at: https://cfpub.epa.gov/ncea/isa/recordisplay.cfm?deid=347534#tab-3
- van Donkelaar A, Martin RV, Brauer M, Kahn R, Levy R, Verduzco C, Villeneuve PJ. 2010. Global estimates of ambient fine particulate matter concentrations from satellite-based aerosol optical depth: development and application. Environ Health Perspect 118: 847–855.
- Van Donkelaar A, Martin RV, Spurr RJD, Drury E, Remer LA, Levy RC, Wang J. 2013. Optimal estimation for global ground-level fine particulate matter concentrations. J Geophys Res 118: 5621–5636.
- Van Donkelaar A, Martin RV, Brauer M, Boys BL. 2015a. Use of satellite observations for long-term exposure assessment of global concentrations of fine particulate matter. Environ Health Perspect 123(2): 135–143.
- Van Donkelaar A, Martin RV, Spurr RJ, Burnett RT. 2015b. High-resolution satellite-derived PM2.5 from optimal estimation and geographically weighted regression over North America. Environ Sci Technol 49: 10482–10491.
- Van Donkelaar A, Martin RV, Brauer M, Hsu NC, Kahn RA, Levy RC, Lyapustin A, Sayer AM, Winker DM. 2016. Estimates of fine particulate matter using a combined geophysical statistical method with information from satellites, models, and monitors. Environ Sci Technol 50 (7): 3762−3772.
- Van Donkelaar A, Martin RV, Burnett RT. 2019. Regional estimates of chemical composition of fine particulate matter using a combined geoscience-statistical method with information from satellites, models, and monitors. Environ Sci Technol 53: 2595–2611.
- Van Donkelaar A, Hammer MS, Bindle L, Brauer M, Brook JR, Garay MJ, Hsu NC, Kalashnikova OV, Kahn RA, Lee C, Levy RC, Lyapustin A, Sayer AM, Martin RV. 2021. Monthly global estimates of fine particulate matter and their uncertainty. Environ Sci Technol 55: 15287–15300.
- Van Donkelaar A, Martin RV. 2022. Development of temporally and spatially resolved, satellite-based PM2.5 estimates for Canada – Bi-weekly and annual PM2.5 mass and component concentrations 2000-2020. Deliverable report, August 30, 2022, for Health Canada. 17 pp.
- van Donkelaar A, Martin RV. 2023. Development of temporally and spatially resolved, satellite-based PM2.5 estimates for Canada – Bi-weekly and annual PM2.5 mass and component concentrations 2000-2020. Deliverable report, February 15, 2023, for Health Canada. 17 pp.
- Viscusi WK, Magat WA, Huber J. 1991. Pricing environmental health risks: survey assessments of risk–risk and risk–dollar trade-offs for chronic bronchitis. J Environ Econ Manage 21(1): 32–51.
- Weichenthal S, Pinault L, Christidis T, Burnett RT, Brook JR, Chu Y, Crouse DL, Erickson AC, Hystad P, Li C, Martin RV, Meng J, Pappin AJ, Tjepkema M, van Donkelaar A, Weagle CL, Brauer M. 2022. How low can you go? Air pollution affects mortality at very low levels. Sci Adv 8: eabo3381.
- Weinmayr G, Romeo E, De Sario M, Weiland SK, Forastiere F. 2010. Short-term effects of PM10 and NO2 on respiratory health among children with asthma or asthma-like symptoms: a systematic review and meta-analysis. Environ Health Perspect 118(4): 449–57.
- Whaley C, Makar PA, Shephard MW, Zhang L, Zhang J, Zheng Q, Akingunola A, Wentworth GR, Murphy JG, Kharol SK, Cady-Pereira KE. 2018. Contributions of natural and anthropogenic sources to ambient ammonia in the Athabasca Oil Sands and north-western Canada. Atmos Chem Phys 18: 2011–2034.
- [WHO] World Health Organization. 2016. Ambient air pollution: a global assessment of exposure and burden of disease. Geneva www.who.int/phe/publications/air-pollution-global-assessment/en/
- WHO. 2021. WHO global air quality guidelines: particulate matter (PM2.5 and PM10), ozone, nitrogen dioxide, sulfur dioxide and carbon monoxide. Geneva https://apps.who.int/iris/handle/10665/345329. 300 pp.
- Zangari S, Hill DT, Charette AT, Mirowsky JE. 2020. Air quality changes in New York City during the COVID-19 pandemic. Sci Total Environ 742: 140496.
- Zhao X, Fioletov V, Alwarda R, Su Y, Griffin D, Weaver D, Strong K, Cede A, Hanisco T, Tiefengraber M, McLinden C, Eskes H, Davies J, Ogyu A, Sit R, Abboud I, Lee SC. 2022. Tropospheric and surface nitrogen dioxide changes in the Greater Toronto Area during the first two years f the COVID-19 pandemic. Remote Sens 14: 1625.
Appendix A: 2018 to 2020 analysis years
This appendix shows the results for the 2018 to 2020 period, which may be compared with the analysis for 2017 to 2019, to evaluate the influence of interannual variability in air pollution estimates. The year 2020 was characterized by several months under COVID-19 pandemic restrictions, including fewer economic and social activities, which influenced ambient air pollution levels (Adams 2020; Fioletov et al. 2022; Griffin et al. 2020; Mashayekhi et al. 2021; Zhao et al. 2022). The 2020 modelled concentrations for O3 and PM2.5 originate from the same model versions used for the 2017 to 2019 period. The 2020 NO2 modelled concentrations for the 2018 to 2020 sensitivity analysis are from an updated LUR model by Hystad and Larkin (2022b), which is outlined in Appendix B.
Table A1 presents estimates of premature deaths and their monetized values associated with PM2.5, O3 and NO2 air pollution for national, provincial and territorial regions. The AQBAT modelling year is 2019. All results represent the health impacts that are attributed to above-background concentrations (outlined in the Methods section).
| Region—population | Counts of premature deathsFootnote a | Monetized value (2020 CAD) × $1,000,000Footnote a | |||||
|---|---|---|---|---|---|---|---|
| Pollutant | per 100,000 | ||||||
| NO2 | PM2.5 | O3Footnote b | O3Footnote c | AllFootnote d | AllFootnote d | AllFootnote d | |
| Canada – 37,294,965 | 1,200 | 12,100 | 1,100 | 2,400 | 16,900 | 45 | 135,000 |
| Ontario – 14,420,182 | 550 | 4,300 | 550 | 1,000 | 6,500 | 45 | 52,000 |
| Quebec – 8,537,005 | 300 | 2,900 | 310Footnote * | 640Footnote * | 4,200 | 49 | 34,000 |
| British Columbia – 4,790,023 | 170 | 1,900 | 100 | 210 | 2,300 | 49 | 19,000 |
| Alberta – 4,554,885 | 120Footnote * | 1,600 | 110 | 240 | 2,000 | 44 | 16,000 |
| Manitoba – 1,351,922 | 37Footnote * | 420 | 12 | 43 | 520 | 38 | 4,100 |
| Saskatchewan – 1,133,397 | 28 | 370 | 23 | 57 | 480 | 42 | 3,800 |
| Nova Scotia – 952,007 | 21 | 250 | 23 | 79Footnote * | 370 | 39 | 3,000 |
| New Brunswick – 763,492 | 15 | 180 | 11 | 46 | 250 | 33 | 2,000 |
| Newfoundland and Labrador – 515,655 | 10Footnote * | 110 | 7 | 40 | 170 | 33 | 1,400 |
| Prince Edward Island – 154,594 | 3 | 38 | 3 | 10 | 53 | 34 | 420 |
| Yukon – 37,012 | 0 | 9 | 0 | 1 | 10 | 28 | 84 |
| Northwest Territories – 45,639 | 0 | 5 | 0 | 1 | 6 | 14 | 50 |
| Nunavut – 39,152 | 0 | 1 | 0 | 1 | 2 | 6 | 20 |
Footnotes
|
|||||||
The estimated population health impacts of PM2.5, O3 and NO2 on people in Canada were as follows (values for individual pollutants may not match total because of rounding):
- Chronic exposure to PM2.5 air pollution contributed to 4.6% of all-cause nonaccidental deaths among people over 25 years of age.
- equivalent to 12,100 deaths per year or 32 deaths per 100,000 people (premature deaths per 100,000 people estimated using total population counts)
- Acute exposure to NO2 air pollution contributed to 0.5% of all-cause nonaccidental deaths among people of all ages.
- equivalent to 1,200 deaths per year or 3 deaths per 100,000 people
- Acute exposure to annual O3 contributed to 0.9% of all-cause nonaccidental deaths among people of all ages.
- equivalent to 2,400 deaths per year or 6 deaths per 100,000 people
- Chronic exposure to summer O3 contributed to 4.6% of respiratory-related deaths among people over 30 years of age.
- equivalent to 1,100 deaths per year or 3 deaths per 100,000 people
National estimates for all health endpoints, both fatal and non-fatal, are provided in Table A2. The 2.5 and 97.5 percentiles represent the low- and high-range estimates.
| Health endpoint | Pollutant | CountFootnote a (2.5/97.5 percentile) | Monetized value (2020 CAD) × $1,000,000Footnote a (2.5/97.5 percentile) |
|---|---|---|---|
| Mortality | |||
| Acute exposure | NO2 | 1,200 (460/2,100) | 9,900 (2,800/20,800) |
| O3 | 2,400 (1,700/3,200) | 19,200 (8,200/34,000) | |
| Chronic exposure – respiratory | Summer O3Footnote b | 1,100 (400/1,900) | 9,200 (2,500/19,300) |
| Chronic exposure | PM2.5 | 12,100 (6,300/17,600) | 96,800 (37,100/181,200) |
| Total mortalityFootnote c | All pollutants | 16,900 (8,800/24,700) | 135,000 (50,600/255,000) |
| Morbidity | |||
| Acute respiratory symptom days | Summer O3 | 8,670,000 (234,000/17,000,000) | 160 (0/240) |
| PM2.5 | 29,540,000 (0/59,440,000) | 270 (0/1,100) | |
| Adult chronic bronchitis cases | PM2.5 | 11,000 (96/21,200) | 5,100 (0/12,800) |
| Asthma symptom days | Summer O3 | 916,000 (0/2,540,000) | 72 (0/400) |
| PM2.5 | 2,550,000 (539,000/4,520,000) | 200 (11/710) | |
| Cardiac emergency room visits | PM2.5 | 1,400 (720/2,000) | 9 (5/14) |
| Cardiac hospital admissionsFootnote d | PM2.5 | 1,000 (550/1,500) | n/a |
| Child acute bronchitis episodes | PM2.5 | 49,800 (0/109,000) | 24 (0/65) |
| Minor restricted activity days | O3 summer | 726,000 (0/8,320,000) | 24 (0/330) |
| Respiratory emergency room visits | O3 summer | 3,800 (510/7,000) | 12 (1/22) |
| PM2.5 | 3,800 (2,500/5,000) | 11 (7/16) | |
| Respiratory hospital admissions | O3 summer | 760 (69/1,400) | n/a |
| PM2.5 | 740 (490/1,000) | n/a | |
| Restricted activity days | PM2.5 | 15,900,000 (9,710,000/21,910,000) | 1,200 (290/2,200) |
| Total morbidityFootnote c | All pollutants | n/a | 7,100 (320/17,900) |
| n/a: not applicable. | |||
|
|||
The total monetized value of health impacts from air pollution in Canada is about $142 billion in 2019 (2020 CAD). This is largely driven by premature deaths, which represent $135 billion (2020 CAD) or 95% of the overall monetized health burden. Although non-fatal endpoints have a lower monetary value ($7.1 billion annually [2020 CAD]) than premature deaths, air pollution-related morbidity impacts affect a large number of people and remain a health burden for the Canadian population.
In 2019, air pollution health impacts included 16,900 premature deaths, equivalent to 45 premature deaths per 100,000 people (Table A1). The change in concentration estimates between 3-year periods is associated with 500 less premature deaths annually compared to 2018 (Table A3). This is equivalent to $4.0 billion (2020 CAD).
Analysis of the 2018 to 2020 period showed slightly reduced ambient air pollution for PM2.5, O3 and NO2 compared to the 2017 to 2019 period (Table A3). This resulted in a lower health burden estimate (16,900 premature deaths, or 45 premature deaths per 100,000 people). Accounting for population growth, this represents a 3% decrease in the health burden between 2019 and 2018. The change in population-weighted PM2.5 exposure concentration had the most influence on health burden estimates (decrease of 380 premature deaths) compared to NO2 (decrease of 46 premature deaths) and O3 (decrease of 71 premature deaths).
Differences in premature deaths between the 2 analyses are not distributed evenly across Canada. In absolute terms, the largest differences are in Alberta, Quebec, British Columbia, Saskatchewan and Ontario, with corresponding decreases of 120, 92, 66, 63 and 59 premature deaths (not shown).
Reductions in premature deaths associated with ambient PM2.5 concentrations contribute to 75% or more of the improvements nationally and in most provinces. By contrast, reductions in premature deaths in Ontario and British Columbia are mostly linked to ambient NO2 and O3, respectively. The shaded cells in Table A3 show instances of increased health burden in 2019 compared to 2018. (Note: increases limited to 9 premature deaths or less).
Of note, the 2 analysis periods share 2 of the 3 years of air pollution data used for estimating exposures in 2018 and 2019. The 2 analyses also share 2 years of baseline mortality data (see Methods). The difference in health burden is essentially linked to the difference in ambient concentrations and baseline mortality rates between 2017 and 2020.
Nationally, ambient air pollutant concentration estimates for the 2018 to 2020 period are between 2% and 5% lower than the 2017 to 2019 period for all pollutants (tables A3 and A4).
Regionally (Table A4), the largest decreases in ambient PM2.5 concentrations (10% to 35%) between periods are generally in the Prairies and the northern regions. Differences in British Columbia, Ontario and Quebec are within 3%. Differences in annual and summer average O3 concentrations vary in magnitude and direction across regions, with the lowest in Ontario and Quebec and the highest in northern regions, Manitoba and British Columbia. NO2 concentrations decrease by up to 5% in most regions, although large relative increases (14% to 24%) are estimated in the northern regions.
As noted in the discussion on wildfires, several factors can influence estimates of average ambient concentrations (either measured or modelled).
| Exposure period | Population (year) | NO2 | Annual O3 | Summer O3 | PM2.5 | All pollutants | |||||
|---|---|---|---|---|---|---|---|---|---|---|---|
| pwe (ppb) | count | pwe (ppb) | count | pwe (ppb) | count | pwe (µg/m3) | count | count | per 100,000 | ||
| 2017 to 2019 | 36,940,652 | 7.11 | 1,300 | 11.16 | 2,400 | 12.39 | 1,200 | 5.32 | 12,500 | 17,400 | 47 |
| 2018 to 2020 | 37,294,965 | 6.79 | 1,200 | 10.89 | 2,400 | 12.02 | 1,100 | 5.08 | 12,100 | 16,900 | 45 |
| Relative change, in % | 2.0 | -4.5 | -3.7 | -2.4 | -1.4 | -3.0 | -3.3 | -4.5 | -3.2 | -2.5 | -3.4 |
| ppb: parts er billion per volume; pwe: population-weighted exposure. | |||||||||||
|
|||||||||||
| Region | PM2.5 | Summer O3 | O3 | NO2 |
|---|---|---|---|---|
| Difference, in % | ||||
| Canada | -5 | -3 | -2 | -4 |
| Ontario | -2 | 0 | -2 | -6 |
| Quebec | -4 | 4 | 2 | -5 |
| British Columbia | -3 | -18 | -11 | -3 |
| Alberta | -11 | -11 | -4 | -3 |
| Manitoba | -11 | -21 | -19 | 1 |
| Saskatchewan | -15 | -10 | -7 | -3 |
| Nova Scotia | -9 | 5 | 2 | -2 |
| New Brunswick | -6 | -10 | -3 | -6 |
| Newfoundland and Labrador | -4 | -15 | -4 | 6 |
| Prince Edward Island | -10 | -6 | -11 | -4 |
| Yukon | -1 | -27 | -2 | 21 |
| Northwest Territories | -31 | -30 | -15 | 14 |
| Nunavut | -36 | 13 | 0 | 24 |
Negative values indicate a decrease between 2017 to 2019 and 2018 to 2020. Positive values indicate an increase.
Figure A1 shows estimates of premature death rates per 100,000 people for CDs across Canada in 2019. Five groups were created to categorize normalized mortality rates attributable to air pollution exposure in 2019. Groups 1 and 2 are associated with rates that are lower than the national average of 45 premature deaths per 100,000 (group 3). Groups 4 and 5 are associated with higher-than-average rates.
Specifically:
- Group 1 corresponds to rates up to the 10th percentile
- 25 premature deaths or less per 100,000 people
- Group 2 corresponds to rates between the 10th and 40th percentiles
- 26 to 40 premature deaths per 100,000 people
- Group 3 corresponds to rates between the 40th and 60th percentiles
- 41 to 48 premature deaths per 100,000 people
- Group 4 corresponds to rates between the 60th and 90th percentiles
- 49 to 65 premature deaths per 100,000 people
- Group 5 corresponds to rates equivalent to or greater than the 90th percentile
- 66 premature deaths or more per 100,000 people
Note: Percentiles are rounded to the nearest integer.
The geographic distribution of normalized mortality rates in 2019 generally reflects the distribution of air pollution concentrations (not shown) and is comparable to the main 2018 analysis in this report (Figure 4). Differences in the range of values per group make direct comparisons with Figure 4 of the main analysis impossible. However, the geographic distribution of CDs with higher or lower than average rates of premature deaths per 100,000 people is consistent.
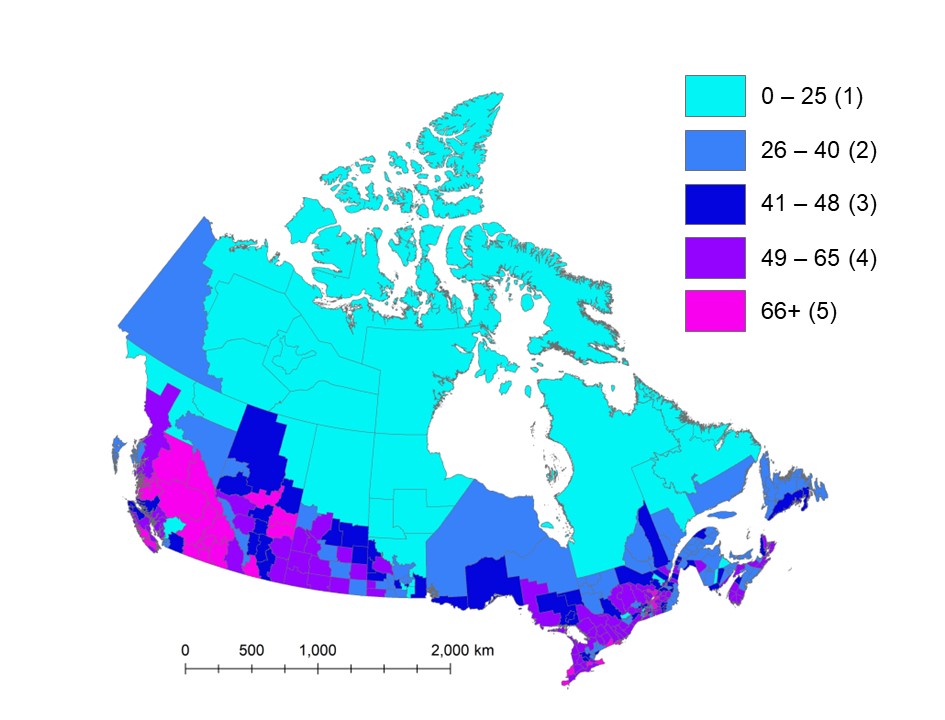
Figure A1 - Text description
Map of Canada showing premature deaths per 100,000 people associated with exposure to PM2.5, O3 and NO2 air pollution across census divisions in 2019. Estimates are classified in 5 groups of variable range. The central group includes the national average of 45 premature deaths per 100,000 people. Census divisions with higher estimates of premature deaths per 100,000 people (49 or more) correspond with larger urban centres and economic corridors, as well as areas impacted by wildfires such as central British Columbia and in central and southern Alberta and Saskatchewan. Lower estimates (42 premature deaths per 100,000 people or less) generally correspond with the northern part of provinces and most of the territories.
Notes: National average is 45 premature deaths per 100,000 people. Group 1 = 30 CDs; Group 2 = 84 CDs; Group 3 = 56 CDs; Group 4 = 93 CDs; Group 5 = 30 CDs.
A comparison of more populous CDs (Table D1, Appendix D) shows that the rates of premature deaths per 100,000 people are fairly consistent (rate differences are often less than 2) between the 2 analysis periods. There are higher differences (rate differences of 3 to 5) for urban centres in Alberta and Manitoba. The largest changes are for urban centres in the Prairies, which were also possibly influenced by wildfire smoke episodes (ECCC 2023a; Matz et al. 2020). In urban centres beyond the Prairies, where COVID-19 restrictions had considerable impact on traffic-related air pollution, very little change is observed.
The CDs with the highest rates of premature deaths (Table D2) between the 2 analysis periods show large differences, particularly in British Columbia (BC). For example, the rate of premature deaths per 100,000 people in Cariboo, BC, varied from 138 in 2018 to 114 in 2019. The rate for Okanagan-Similkameen varied from 110 to 100 per 100,000 people. In contrast, the rates for CDs in Ontario and Quebec, such as Prince Edward and Joliette, differ only by 2 between periods.
The CDs showing the greatest differences between the 2018 and 2019 health burden results (on the basis of premature deaths per 100,000 people) are listed in Table A5. The results indicate that differences were largest in non-urban CDs in western and Prairie provinces. The differences were mostly associated with variation in PM2.5-related deaths.
The CDs with the lowest rates of premature deaths per 100,000 people (Table D3) between the 2 analysis periods are consistent (rate differences less than 2) and correspond with rural or remote areas. Overall, the geographic distribution of the health burden is comparable, as shown in figures 4 (main report) and A1.
Studies have shown that COVID-19 restrictions impacted ambient NO2 concentrations, but had minimal influence on PM2.5 concentrations (Fioletov et al. 2022; Griffin et al. 2020; Mashayekhi et al. 2021; Zhao et al. 2022). These findings suggest the differences between air pollution periods are likely linked to sources independent of COVID-19 restrictions, notably wildfire smoke. In fact, many of the CDs in Table A5 correspond with regions or CDs most impacted by wildfire smoke (for example, Matz et al. 2020).
The results suggest that factors other than COVID-19 can greatly influence air pollution exposure and health burden estimates. Based on the location of CDs most impacted by air pollution and variations between the 2018 and 2019 analyses, a reduction in wildfire smoke is likely responsible for part of the decrease in health burden.
| Census division name (identifier) | Difference in premature deaths per 100,000 peopleFootnote a | |
|---|---|---|
| PM2.5 | All pollutants | |
| BC – Cariboo (CD5941) | 23 | 24 |
| MB – Division No. 21 (CD4621) | 19 | 20 |
| MB – Division No. 20 (CD4620) | 13 | 14 |
| BC – Thompson-Nicola (CD5933) | 12 | 13 |
| BC – East Kootenay (CD5901) | 12 | 13 |
| AB – Division No. 3 (CD4803) | 12 | 12 |
| BC – Kootenay Boundary (CD5905) | 8 | 11 |
| MB – Division No. 16 (CD4616) | 10 | 11 |
| SK – Division No. 7 (CD4707) | 9 | 10 |
| BC – Okanagan-Similkameen (CD5907) | 8 | 10 |
| SK – Division No. 14 (CD4714) | 8 | 9 |
|
||
Current evidence suggests that air pollution in 2020 differed from previous years. In light of Canadian studies that looked at the impact of COVID-19 restrictions on ambient air pollution in Canada, the current findings are inconclusive regarding their influence on the decrease in PM2.5 and the overall health burden. Other sources, such as wildfire smoke emissions, possibly contributed to decreased ambient PM2.5 concentrations. Additional analyses and data up to 2022 are needed to shed light on the role of COVID-19 restrictions and other sources of air pollutant emissions.
Appendix B: NO2 land-use regression model for 2020
Annual average NO2 concentrations were estimated using a national land-use regression (LUR) model for 2018 to 2020 (Hystad and Larkin 2022a,b). Updates to the LUR model for 2020 were required to account for changes and disruptions in the source of the NO2 tropospheric column measurements.
Starting in 2020, measurements from the TROPOspheric Monitoring Instrument (TROPOMI) onboard the Copernicus Sentinel-5 Precursor satellite replace the previous OMI measurements. The spatial resolution of TROPOMI (3.5 km × 3.5 km) is finer than the spatial resolution of OMI (13 km × 24 km). Tests were conducted to assess the influence of the change in satellite data on NO2 estimates and consistency with previous models (Hystad and Larkin 2022b).
The model developers also kept the same traffic predictor variable coefficients and buffers as previous years. This approach is designed to maintain consistency in methodology, model structure and spatial patterns of model predictions for all model years (previous and future). The model variables are the normalized difference vegetation index (NDVI), population density, railways, temperature, industrial use, and highways and expressways.
The LUR model performance was assessed by comparing predicted and observed NO2 concentrations. Observations for 2020 consist of annual average NO2 data from 191 NAPS monitoring stations in Canada. The R2 for the model using TROPOMI and model predictors from the previous 2019 LUR model reached 0.65, with a RMSE of 1.93 ppb (Hystad and Larkin 2022b). The performance of the 2020 model is slightly improved compared to the 2016 to 2019 annual models (R2 of 61% to 67% and RMSE of 2.13 to 2.41 ppb) (Hystad and Larkin 2022a,b).
The 2020 annual average NO2 estimates are applied to dissemination block (DB) centroids (or nearest valid location). Estimates are available for 489,676 DBs (2016 Census). DB estimates ranged from 0 to 17.9 ppb, with a mean of 4.6 ppb (5.4 ppb in 2018, 5.3 ppb in 2019). The DB results were used to calculate population-weighted concentrations for each CD.
Figure B1 shows the geographic distribution of 3-year (2018 to 2020) annual average NO2 concentrations. The national population-weighted average NO2 ambient concentration for 2018 to 2020 is 6.94 ppb, which is lower than the 2017 to 2019 estimate of 7.26 ppb.
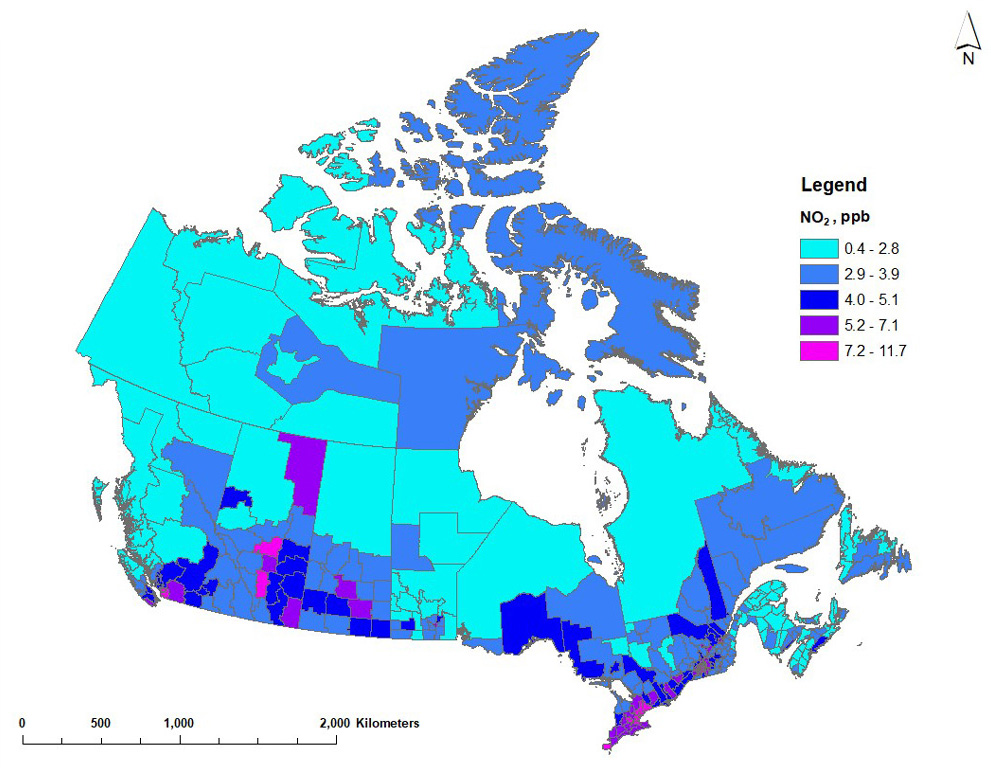
Figure B1 - Text description
Map of Canada showing annual average NO2 concentrations for 2017 to 2019 across census divisions. Annual average NO2 estimates vary between 0.4 and 12.2 ppb. Higher NO2 estimates (5.2 ppb or more) generally correspond with the larger urban regions or centres in Canada, including the Lower Fraser Basin, the Calgary to Edmonton corridor, Saskatoon, Regina and the Windsor to Quebec City corridor. The oil sands region in northeast Alberta also shows higher NO2 concentrations. Lower concentrations (3.5 ppb or less) are estimated in the northern part of central and western provinces, throughout Atlantic Canada and in the territories.
Appendix C: Baseline health endpoint rates
| Endpoint | Acute exposure mortalityFootnote a | Acute respiratory symptom days | Adult chronic bronchitis cases | Asthma symptom days | Cardiac emergency room visits | Child acute bronchitis episodes | Chronic exposure mortalityFootnote b | Chronic exposure respiratory mortalityFootnote c | Minor restricted activity days | Respiratory emergency room visits | Restricted activity days |
|---|---|---|---|---|---|---|---|---|---|---|---|
| Population age group, in years | All | NA 5 to 19; adults | 25+ | Asthmatic 5 to 19 | All | 5 to 19 | 25+ | 30+ | NA 5 to 19; adults | All | NA 5 to 19; adults |
| Canada | 7,08 | 64,000,000 | 6,400 | 73,000,000 | 10,300 | 186,000 | 9,730 | 1,070 | 8,000,000 | 26,700 | 19,000,000 |
| Newfoundland and Labrador | 9,430 | 64,000,000 | 6,400 | 73,000,000 | 14,300 | 186,000 | 12,400 | 1,280 | 8,000,000 | 36,000 | 19,000,000 |
| Prince Edward Island | 8,440 | 64,000,000 | 6,400 | 73,000,000 | 15,400 | 186,000 | 11,700 | 1,470 | 8,000,000 | 40,900 | 19,000,000 |
| Nova Scotia | 9,460 | 64,000,000 | 6,400 | 73,000,000 | 13,000 | 186,000 | 12,600 | 1,370 | 8,000,000 | 30,200 | 19,000,000 |
| New Brunswick | 9,300 | 64,000,000 | 6,400 | 73,000,000 | 16,800 | 186,000 | 12,320 | 1,320 | 8,000,000 | 40,500 | 19,000,000 |
| Quebec | 7,520 | 64,000,000 | 6,400 | 73,000,000 | 11,700 | 186,000 | 10,200 | 1,190 | 8,000,000 | 32,700 | 19,000,000 |
| Ontario | 6,860 | 64,000,000 | 6,400 | 73,000,000 | 9,820 | 186,000 | 9,500 | 988 | 8,000,000 | 22,500 | 19,000,000 |
| Manitoba | 7,600 | 64,000,000 | 6,400 | 73,000,000 | 9,910 | 186,000 | 11000 | 1,150 | 8,000,000 | 26,600 | 19,000,000 |
| Saskatchewan | 7,590 | 64,000,000 | 6,400 | 73,000,000 | 11,400 | 186,000 | 10,900 | 1,220 | 8,000,000 | 40,600 | 19,000,000 |
| Alberta | 5,410 | 64,000,000 | 6,400 | 73,000,000 | 7,320 | 186,000 | 7,760 | 867 | 8,000,000 | 23,300 | 19,000,000 |
| British Columbia | 7,170 | 64,000,000 | 6,400 | 73,000,000 | 9,530 | 186,000 | 9,590 | 1,060 | 8,000,000 | 23,800 | 19,000,000 |
| Yukon | 6,080 | 64,000,000 | 6,400 | 73,000,000 | 11,400 | 186,000 | 8,390 | 849 | 8,000,000 | 30,600 | 19,000,000 |
| Northwest Territories | 4,480 | 64,000,000 | 6,400 | 73,000,000 | 8,880 | 186,000 | 6,680 | 1,020 | 8,000,000 | 45,400 | 19,000,000 |
| Nunavut | 3,890 | 64,000,000 | 6,400 | 73,000,000 | 4,460 | 186,000 | 6,210 | 1,480 | 8,000,000 | 68,900 | 19,000,000 |
| NA: nonasthmatic. | |||||||||||
|
|||||||||||
Notes for interpreting the values: Baseline health endpoint rates can vary among provinces or territories or a single value may apply for Canada (where more geographically precise values are unavailable). Values over 1 million indicate that the number of incidences per year for each individual is greater than 1. For example, each asthmatic child aged 5 to 19 is associated, on average, with 73 asthma symptom days per year. Thus, the annual baseline rate per 1 million people for the target population is 73 million asthma days.
Appendix D: Other health impact estimates
| Province - CD name (identifier) | Population | Deaths per 100,000 | Population | Deaths per 100,000 |
|---|---|---|---|---|
| 2018 | 2019 | |||
| ON – Toronto (CD3520) | 2,925,349 | 43 | 2,955,348 | 42 |
| BC – Greater Vancouver (CD5915) | 2,535,948 | 36 | 2,550,702 | 37 |
| QC – Montreal (CD2466) | 2,049,056 | 57 | 2,062,928 | 54 |
| AB – Division No. 6 (CD4806) | 1,642,274 | 46 | 1,675,087 | 42 |
| AB – Division No. 11 (CD4811) | 1,493,305 | 46 | 1,523,178 | 44 |
| ON – Peel (CD3521) | 1,482,936 | 28 | 1,496,209 | 28 |
| ON – York (CD3519) | 1,176,125 | 31 | 1,187,077 | 31 |
| ON – Ottawa (CD3506) | 989,196 | 38 | 998,948 | 37 |
| MB – Division No. 11 (CD4611) | 745,863 | 47 | 754,083 | 42 |
| ON – Durham (CD3518) | 681,961 | 38 | 688,193 | 37 |
| QC – Québec (CD2423) | 596,491 | 55 | 600,998 | 54 |
| ON – Halton (CD3524) | 577,169 | 36 | 582,715 | 35 |
| ON – Hamilton (CD3525) | 576,109 | 58 | 582,095 | 56 |
| ON – Waterloo (CD3530) | 560,487 | 42 | 565,905 | 41 |
| ON – Simcoe (CD3543) | 503,174 | 49 | 508,416 | 48 |
| AB: Alberta; BC: British Columbia; MB: Manitoba; ON: Ontario; QC: Quebec. | ||||
| Province - CD name (identifier) | Population | Deaths per 100,000 | Province - CD name (identifier) | Population | Deaths per 100,000 |
|---|---|---|---|---|---|
| 2018 | 2019 | ||||
| BC – Cariboo (CD5941) | 62,691 | 138 | BC - Cariboo (CD5941) | 63,195 | 114 |
| BC – Okanagan-Similkameen (CD5907) | 83,304 | 110 | BC – Okanagan-Similkameen (CD5907) | 84,281 | 100 |
| BC – Kootenay Boundary (CD5905) | 31,086 | 107 | BC – Kootenay Boundary (CD5905) | 31,395 | 96 |
| BC – Fraser-Fort George (CD5953) | 93,503 | 91 | QC – Shawinigan (CD2436) | 51,118 | 90 |
| QC – Shawinigan (CD2436) | 50,632 | 90 | BC – Fraser-Fort George (CD5953) | 94,039 | 85 |
| BC – Thompson-Nicola (CD5933) | 134,115 | 84 | BC – Bulkley-Nechako (CD5951) | 40,159 | 83 |
| QC – Pierre-de-Saurel (CD2453) | 52,725 | 84 | QC – Pierre-de-Saurel (CD2453) | 53,220 | 82 |
| ON – Lambton (CD3538) | 134,695 | 82 | ON – Lambton (CD3538) | 136,327 | 80 |
| BC – Bulkley-Nechako (CD5951) | 39,909 | 82 | QC – Joliette (CD2461) | 69,298 | 79 |
| BC – Central Kootenay (CD5903) | 60,611 | 82 | BC – Central Kootenay (CD5903) | 61,184 | 79 |
| BC – North Okanagan (CD5937) | 86,763 | 81 | QC – Nicolet-Yamaska (CD2450) | 23,781 | 78 |
| QC – Joliette (CD2461) | 68,705 | 80 | ON – Prince Edward (CD3513) | 26,828 | 78 |
| AB – Division No. 3 (CD4803) | 44,219 | 80 | AB – Division No. 13 (CD4813) | 76,961 | 77 |
| BC – Columbia-Shuswap (CD5939) | 52,061 | 78 | BC – North Okanagan (CD5937) | 87,578 | 76 |
| ON – Prince Edward (CD3513) | 26,440 | 78 | QC – Francheville (CD2437) | 74 | |
| AB: Alberta, BC: British Columbia, ON: Ontario and QC: Quebec. | |||||
| Province - CD name (identifier) | Population | Deaths per 100,000 | Province - CD name (identifier) | Population | Deaths per 100,000 |
|---|---|---|---|---|---|
| 2018 | 2019 | ||||
| NL – Division No. 10 (CD1010) | 24,167 | 6 | NU – Baffin (CD6204) | 20,712 | 6 |
| NU – Baffin (CD6204) | 20,403 | 7 | NL – Division No. 10 (CD1010) | 23,951 | 6 |
| NU – Keewatin (CD6205) | 11,226 | 7 | NU – Kitikmeot (CD6208) | 7,044 | 6 |
| NU – Kitikmeot (CD6208) | 6,938 | 9 | NU – Keewatin (CD6205) | 11,396 | 7 |
| AB – Division No. 16 (CD4816) | 84,124 | 9 | AB – Division No. 16 (CD4816) | 85,457 | 10 |
| QC – Nord-du-Québec (CD2499) | 45,644 | 11 | NT – Region 3 (CD6103) | 2,953 | 10 |
| QC – La Jacques-Cartier (CD2422) | 42,396 | 13 | MB – Division No. 23 (CD4623) | 9,882 | 10 |
| NT – Region 3 (CD6103) | 2,927 | 13 | QC – Nord-du-Québec (CD2499) | 45,887 | 11 |
| NL – Division No. 11 (CD1011) | 2,584 | 14 | NT – Region 6 (CD6106) | 21,838 | 12 |
| MB – Division No. 10 (CD4610) | 12,279 | 14 | QC – La Jacques-Cartier (CD2422) | 42,641 | 13 |
| MB – Division No. 23 (CD4623) | 9,789 | 16 | NL – Division No. 11 (CD1011) | 2,558 | 13 |
| NT – Region 6 (CD6106) | 21,722 | 17 | MB – Division No. 10 (CD4610) | 12,408 | 15 |
| NT – Region 4 (CD6104) | 3,591 | 18 | MB – Division No. 22 (CD4622) | 45,803 | 15 |
| NT – Region 2 (CD6102) | 2,486 | 19 | NT – Region 1 (CD6101) | 7,205 | 15 |
| NT – Region 5 (CD6105) | 7,445 | 19 | SK – Division No. 18 (CD4718) | 39,792 | 15 |
| AB: Alberta; BC: British Columbia; MB: Manitoba; NL: Newfoundland and Labrador; NT: Northwest Territories; NU: Nunavut; ON: Ontario; QC: Quebec. | |||||