
Heat-related morbidity and mortality in Canada
Download in PDF format
(1.22 MB, 28 pages)
Organization: Health Canada
Published: 2025-07-14
Cat. : H129-171/2025E-PDF
ISBN : 978-0-660-77411-4
Pub. : 250071
A national-level examination of heat-related illnesses and deaths from environmental heat exposure
Table of contents
- Acknowledgements
- Context
- Methods
- Results
- How many people in Canada are hospitalized or visit the emergency department with a heat-related illness each year?
- Age, sex and heat-related hospitalizations and emergency department visits
- What types of heat-related illness were most common?
- How many people in Canada die from heat exposure each year?
- Age, sex and heat-related death
- Discussion
- Conclusion
- Related links
- Appendix
- References
Acknowledgements
Health Canada gratefully acknowledges the following people for the development of this document: Jessica Sutinen and Victor Gallant.
The Climate Change and Health Office at Health Canada gratefully acknowledges the contribution of the following people in providing a review of this bulletin: Dr. Ray Bustinza, Dr. Heejune Chang, Dr. Hong Chen, Melissa Gorman, Dr. Jessie Hamon, Dr. Chris Hebbern, Dr. Matthew Hodge, Olatunbosun Ibukun, Dr. JinHee Kim, Dr. Michael Lee, Gregory Richardson, Lubna Salman, Rebecca Stranberg and Carolyn Tateishi.
Context
Canada is experiencing warming at twice the rate of the global average due to climate change. The intensity and frequency of heat events in Canada are projected to increase in the future also because of climate change Reference 1. However, extreme heat already impacts the health of people living in Canada—the unprecedented extreme heat event in western North America in 2021 resulted in 619 heat-related deaths in British Columbia Reference 2 and several thousand visit emergency departments across the country every summer for heat-related concerns (see Results section). Future heat-related mortality in Canada is projected to increase due to climate change, potentially by as much as 10.7% by 2090 Reference 3. To quantify and contextualize these impacts, a national picture of current and past heat-related morbidity and mortality is needed.
No pan-Canadian picture of heat-related morbidity and mortality presently exists. Smaller, regional quantifications of the burden of annual heat-related illness and death have been calculated Reference 2Reference 4Reference 5. However, they are inconsistently available across space and time and do not constitute a comprehensive national-level understanding. To help fill this gap, this bulletin describes the burden of heat-related morbidity and mortality in Canada over the last 20 (morbidity) and 40 years (mortality) using nationally-available health administrative datasets. By sharing the available heat-related health data in Canada, this bulletin provides baseline measurements against which future data can be compared following changes in climate, demographics, policy direction and implementation of intervention strategies.
What is heat-related morbidity and mortality?
Heat-related morbidity and mortality refer to illness or death caused by heat exposure. Such adverse health outcomes occur when core body temperature rises and the body is unable to effectively dissipate heat. While this can cause mild heat-related illnesses such as heat cramps, if the core temperature remains elevated, this may exacerbate underlying health conditions and/or heatstroke may develop, potentially leading to permanent disability or death.
Heat-related illnesses are conditions, ranging from mild (for example, heat cramps) to severe (for example, heatstroke), that are caused by exposure to heat. They are measurable in health data by a set of diagnostic codes that identifies them as health outcomes of external heat exposure (see Appendix Table A1). Exposure to heat can cause adverse health effects beyond heat-related illnesses, like cardiac arrest or acute kidney failure, but because these health outcomes can have many different causes, they are not as easily measured using health data.
Heat exposure can also result in death by heatstroke or by the exacerbation of underlying conditions like cardiovascular disease. It is difficult to capture the burden of heat-related mortality, particularly when death was caused by heat acting on an existing health condition.
Due to the challenges of capturing heat-related morbidity and mortality in Canada, this bulletin focuses on heat-related illnesses (see Appendix Table A1) and deaths with an underlying (primary) cause of exposure to excessive heat.
In Canada, heat-related morbidity and mortality occur during the warmer months of the year, usually between May and September. As Canada’s climate continues to change, it is projected that the warmer period of the year will lengthen and there will be more frequent, intense and severe extreme heat events Reference 1. Without intervention, climate change is expected to result in more heat-related illnesses and deaths among people in Canada Reference 3.
This bulletin frequently references the effects that the extreme heat events in eastern Canada in 2018 (June 28 to July 6) Reference 6Reference 7 and in western Canada in 2021 (June 25 to July 2) Reference 8 had on the data presented in this bulletin. Although extreme heat events occur across Canada in many different regions each summer, these 2 events are highlighted because of their significant impact on health—as they noticeably influenced national-level morbidity and mortality rates—and because they occurred relatively recently. It is beyond the scope of this bulletin to identify each extreme heat event in Canada in the last 20 to 40 years and examine their individual impacts on national-level morbidity and mortality rates.
Methods
This bulletin employed a retrospective, population-based descriptive analysis of health administrative data to describe the burden of heat-related morbidity and mortality in Canada between 2004 to 2023 (morbidity [excluding QuebecFootnote a]) and 1981 to 2022 (mortality).
Data sources
To capture the national scope of heat-related morbidity and mortality, this analysis used 3 nationally-available health administrative datasets.Footnote b 2 clinical administrative datasets—Discharge Abstract Database (DAD) and National Ambulatory Care Reporting System (NACRS)—were used to identify records that included a diagnosis of heat-related illness during hospitalizationsFootnote c and emergency department (ED) visits, respectively. The Canadian Vital Statistics Death Database (CVSD), an administrative survey that collects demographic and cause of death information, provided records of heat-related deaths.
Records in DAD, NACRS and CVSD were identified using diagnosis codes from International Statistical Classification of Diseases, Injuries, and Causes of Death, Ninth Revision (ICD-9)Footnote d and International Statistical Classification of Diseases and Related Health Problems, Tenth Revision, Canada (ICD-10-CA) (for information on the data sources used and the data they provided, see Appendix Table A2; for the list of ICD-9 and ICD-10-CA diagnosis codes used to identify records, see Appendix Table A1). Access to DAD and NACRS data was provided through Health Canada’s Health Data and Analysis Dissemination Division (HDAD), with data available from 2004 (NACRS) and 2005 (DAD). HDAD provided access to CVSD records from 1981 to 1999 and from 2000 to 2022, CVSD data were used from the Statistics Canada website Reference 9.Footnote e
Morbidity inclusion and exclusion criteria
Inclusion and exclusion criteria for heat-related morbidity were based on those used for the “Heat-Related Illnesses” indicator published by the United States Environmental Protection Agency Reference 10 and were adapted for use in the Canadian context based on data availability. Inclusion criteria (see below) allowed for the identification of as many records with a heat-related illness as possible between May and September (Canada’s warmer months of the year).
Clinical and demographic data contained in the hospital discharge and ED visit records and used in this analysis, included: clinical diagnoses (ICD-10-CA)—all fields, age, sex and date of hospital discharge or ED visit. A hospital discharge or ED visit record was included in the analysis if:
- 1 or more diagnoses (including discharge diagnoses for ED visits) in the record contained an ICD-10-CA T67 series code or external cause of injury code X30 (Appendix Table A1), and
- the hospital admission date or ED visit date of registration occurred between May 1 and September 30
A hospital discharge or ED visit record was excluded from the analysis if:
- data for clinical diagnosis, age, sex, or date of admission or ED visit were missing
- the ICD-10-CA external cause of injury code for exposure to excessive heat of man-made origin (W92) was recorded
- it occurred within 2 weeks of a previous record (with a diagnosis of a heat-related illness) for the same patient
- NACRS data only—the visit was not an emergency department visit (for example, day surgery)
Mortality inclusion and exclusion criteria
Inclusion and exclusion criteria for heat-related mortality were based on those used by the United States Environmental Protection Agency’s “Heat-Related Deaths” indicator and adapted for use in the Canadian context based on data availability Reference 11. Records were included if the cause of death was exposure to excessive heat (Appendix Table A1), but due to data limitations, the period of death could not be restricted to May-September. More specifically, available data were limited to: cause of death (ICD-9, ICD-10-CA) (contributing cause of death data were not accessible), year of death, age and sex. Records were excluded if they were missing data in any of these fields.
Crude rate calculation
The rates presented in this bulletin are crude rates. Annual crude rates of cumulative incidence were calculated per million population for heat-related hospitalizations and deaths, and per 100,000 ED visits for heat-related ED visits. National-level population denominators sourced from Statistics Canada were used for hospitalizations and deaths Reference 12, which are fully captured across the country by DADFootnote f and CVSD. ED visit denominators were derived from the total number of ED visits reported to NACRS because ED visits are not consistently captured across Canadian provinces and territories; therefore, ED visit rates were calculated using a denominator derived from the total number of ED visits occurring between May 1 and September 30 of the calendar years in this analysis.Footnote g Statistical analysis was conducted with SAS®9 software.
Results
How many people in Canada are hospitalized or visit the emergency department with a heat-related illness each year?
Between 2005 and 2023, there were 3,753 hospitalizations with at least 1 diagnosis of a heat-related illness (Figure 1).Footnote h Annual rates varied over the reporting period and ranged between 3.0 and 32.2 hospitalizations per million population. Averaged over the reporting period, there were 7.1 hospitalizations per million population annually (5.7 hospitalizations per million population annually if 2021, the year of the extreme heat event in western Canada, is excluded). Compared to the average annual rate for the reporting period, annual rates increased by 21.1% in 2018 (8.6 hospitalizations per million population) and by 367.6% in 2021 (32.2 hospitalizations per million population), both years during which extreme heat events occurred (that is, the 2018 eastern Canada extreme heat event and the 2021 extreme heat event in western Canada).
Figure 1: Counts and rates of hospitalizations with a diagnosed heat-related illness (per million population), overall and by sex, Canada, 2005 to 2023
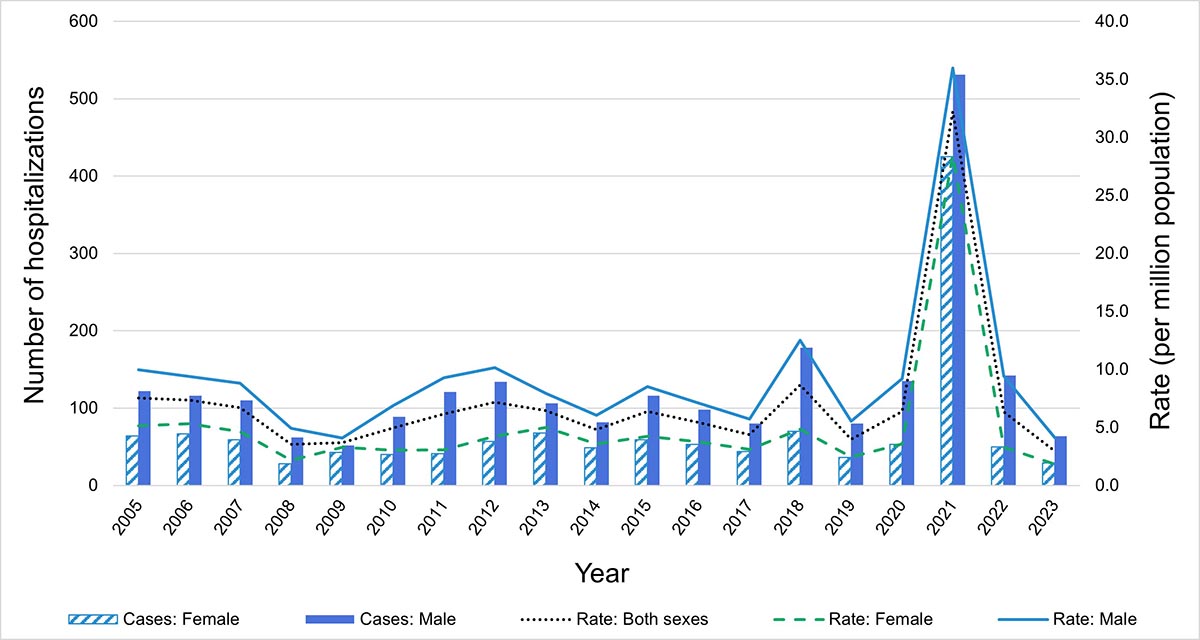
Data from Quebec not included.
Data source: Discharge Abstract Database, 2005 to 2023.
Figure 1: Text description
| Year | 2005 | 2006 | 2007 | 2008 | 2009 | 2010 | 2011 | 2012 | 2013 | 2014 | 2015 | 2016 | 2017 | 2018 | 2019 | 2020 | 2021 | 2022 | 2023 |
|---|---|---|---|---|---|---|---|---|---|---|---|---|---|---|---|---|---|---|---|
| Rate: Both sexes | 7.5 | 7.3 | 6.7 | 3.5 | 3.7 | 4.9 | 6.2 | 7.2 | 6.5 | 4.8 | 6.4 | 5.4 | 4.4 | 8.6 | 4.0 | 6.4 | 32.2 | 6.3 | 3.0 |
| Cases: Female | 64 | 67 | 59 | 28 | 43 | 40 | 41 | 57 | 68 | 49 | 59 | 53 | 44 | 70 | 36 | 53 | 425 | 50 | 29 |
| Rate: Female | 5.1 | 5.3 | 4.6 | 2.2 | 3.3 | 3.0 | 3.1 | 4.2 | 5.0 | 3.6 | 4.2 | 3.8 | 3.1 | 4.8 | 2.5 | 3.6 | 28.5 | 3.3 | 1.9 |
| Cases: Male | 122 | 116 | 110 | 62 | 52 | 89 | 121 | 134 | 106 | 82 | 116 | 98 | 80 | 178 | 80 | 135 | 531 | 142 | 64 |
| Rate: Male | 10.0 | 9.4 | 8.8 | 4.9 | 4.1 | 6.9 | 9.3 | 10.1 | 7.9 | 6.1 | 8.5 | 7.1 | 5.7 | 12.5 | 5.5 | 9.2 | 36.0 | 9.4 | 4.1 |
There were 38,398 ED visits with at least 1 diagnosis of a heat-related illness between 2004 and 2023 (Figure 2).Footnote h Annual rates of heat-related ED visits per 100,000 ED visits varied over time, ranging between 25.1 and 81.3, with an average annual rate for the reporting period of 48.1 (46.3 heat-related ED visits per 100,000 ED visits annually if 2021, the year of the extreme heat event in western Canada, is excluded). Noticeable increases in counts and rates occurred in 2018 and 2021, when rates increased by 38.7% and 69.0% to 66.7 and 81.3 heat-related ED visits per 100,000 ED visits, respectively, compared to the average annual rate for the reporting period. Both 2018 and 2021 were years in which extreme heat events occurred (the eastern Canada heat event and the extreme heat event in western Canada, respectively).
There was a noticeable increase in counts and rates of heat-related ED visits over time, particularly from 2010 onwards. This was due to variations in the volume of provincial and territorial ED visit data submitted to NACRS each year (see Limitations section). Importantly, only a few provincial and territorial health authorities have mandates that require submission of all ED visit data to NACRS. Ontario and Alberta, 2 of Canada’s most populous provinces, fully submit ED visit data and therefore strongly influence national-level rates.
Figure 2: Counts and rates of emergency department visits with a diagnosed heat-related illness (per 100,000 ED visits), overall and by sex, Canada, 2004 to 2023
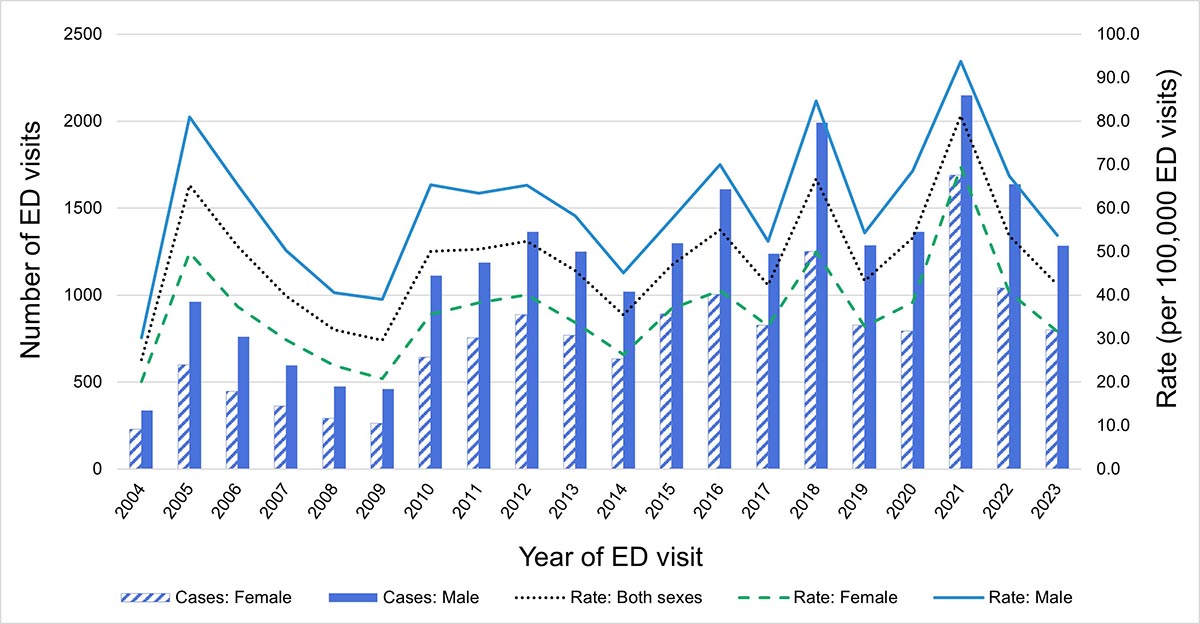
Data from Newfoundland and Labrador, New Brunswick, Quebec, Nunavut and Northwest Territories not available.
Data source: National Ambulatory Care Reporting System, 2004 to 2023.
Figure 2: Text description
| Year | 2004 | 2005 | 2006 | 2007 | 2008 | 2009 | 2010 | 2011 | 2012 | 2013 | 2014 | 2015 | 2016 | 2017 | 2018 | 2019 | 2020 | 2021 | 2022 | 2023 |
|---|---|---|---|---|---|---|---|---|---|---|---|---|---|---|---|---|---|---|---|---|
| Rate: Both sexes | 25.1 | 65.3 | 51.2 | 39.8 | 32.0 | 29.6 | 50.1 | 50.5 | 52.3 | 45.6 | 35.4 | 46.8 | 55.0 | 42.3 | 66.7 | 43.2 | 53.2 | 81.3 | 53.7 | 42.4 |
| Cases: Female | 229 | 599 | 447 | 363 | 292 | 262 | 643 | 756 | 887 | 770 | 634 | 892 | 1005 | 827 | 1252 | 827 | 794 | 1691 | 1040 | 802 |
| Rate: Female | 20.1 | 49.8 | 37.4 | 29.7 | 23.8 | 20.8 | 35.6 | 38.2 | 40.1 | 33.7 | 26.3 | 36.9 | 41.0 | 32.9 | 49.9 | 32.8 | 38.3 | 69.5 | 40.6 | 31.7 |
| Cases: Male | 337 | 962 | 762 | 595 | 476 | 460 | 1113 | 1188 | 1363 | 1251 | 1021 | 1298 | 1609 | 1239 | 1991 | 1287 | 1363 | 2149 | 1639 | 1283 |
| Rate: Male | 30.2 | 81.0 | 65.4 | 50.2 | 40.6 | 39.0 | 65.4 | 63.4 | 65.3 | 58.2 | 45.1 | 57.5 | 70.0 | 52.4 | 84.6 | 54.4 | 68.6 | 93.8 | 67.4 | 53.7 |
Age, sex and heat-related hospitalizations and emergency department visits
Annual rates of hospitalization with a heat-related diagnosis were highest in individuals aged 80 years and older, with average annual rates for the reporting period ranging from 0.2Footnote i (under 2 years) to 44.6 per million population (80 years and older) (Figure 3). With few exceptions, males had higher annual hospitalization rates than females in age groups where individuals were older than 12 years. Sex-based differences in average annual rates for the reporting period across age groups increased with age and ranged from 0.4 (2 to 12 years) to 17.7 (80 years and older) more male hospitalizations each year per million population. While male hospitalization rates consistently increased with age, steady increases of female rates only occurred between older age groups (45 to 64 years, 65 to 79 years and 80 years and older).
Annual rates of ED visits with a heat-related diagnosis were highest in individuals between the ages of 19 to 24 years, with average annual rates for the reporting period increasing from 18.6 (under 2 years) to 70.8 per 100,000 ED visits (19 to 24 years) and then decreasing with older age (37.0 and 37.8 ED visits per 100,000 ED visits, 65 to 79 years and 80 years and older, respectively) (Figure 4). Annual rates for males were consistently higher than those for females in age groups 19 to 24 years, 25 to 44 years, 45 to 64 years and 65 to 79 years. Sex-based differences in average annual rates for the reporting period were highest in the age groups 19 to 24 years and 25 to 44 years (39.8 and 40.1 more male ED visits per year per 100,000 ED visits, respectively). Although the highest rates for males were between the ages of 19 to 24 years (average annual rate for the reporting period: 92.0 ED visits per 100,000 ED visits), the highest rates for females were in the age group 13 to 18 years, with an average annual rate for the reporting period of 62.3 ED visits per 100,000 ED visits.
Figure 3: Rates of hospitalizations with a diagnosed heat-related illness (per million population), by sex and age group, Canada, 2005 to 2023. Axis range differs for age groups 65 to 79 and 80 years and older

Figure 3a: Text description
| Sex | 2005 | 2006 | 2007 | 2008 | 2009 | 2010 | 2011 | 2012 | 2013 | 2014 | 2015 | 2016 | 2017 | 2018 | 2019 | 2020 | 2021 | 2022 | 2023 |
|---|---|---|---|---|---|---|---|---|---|---|---|---|---|---|---|---|---|---|---|
| Female | 1.9 | 1.9 | 3.2 | 1.3 | 3.9 | 1.9 | 0.6 | 1.9 | 5.0 | 2.5 | 4.3 | 1.8 | 3.0 | 3.6 | 1.8 | 3.5 | 1.2 | 0.6 | 1.2 |
| Male | 5.5 | 2.4 | 1.8 | 3.1 | 1.9 | 1.2 | 6.7 | 2.4 | 3.0 | 4.8 | 4.1 | 1.7 | 1.7 | 4.5 | 1.1 | 0.0 | 2.8 | 3.9 | 0.5 |

Figure 3b: Text description
| Sex | 2005 | 2006 | 2007 | 2008 | 2009 | 2010 | 2011 | 2012 | 2013 | 2014 | 2015 | 2016 | 2017 | 2018 | 2019 | 2020 | 2021 | 2022 | 2023 |
|---|---|---|---|---|---|---|---|---|---|---|---|---|---|---|---|---|---|---|---|
| Female | 3.0 | 6.0 | 3.0 | 4.0 | 2.0 | 1.0 | 3.1 | 3.1 | 1.1 | 3.2 | 4.3 | 6.5 | 3.2 | 0.0 | 2.1 | 3.2 | 3.2 | 1.0 | 0.0 |
| Male | 5.7 | 3.8 | 7.6 | 6.7 | 2.9 | 3.8 | 5.8 | 5.9 | 4.0 | 4.0 | 5.1 | 4.1 | 4.1 | 11.2 | 1.0 | 2.0 | 2.0 | 2.9 | 1.9 |
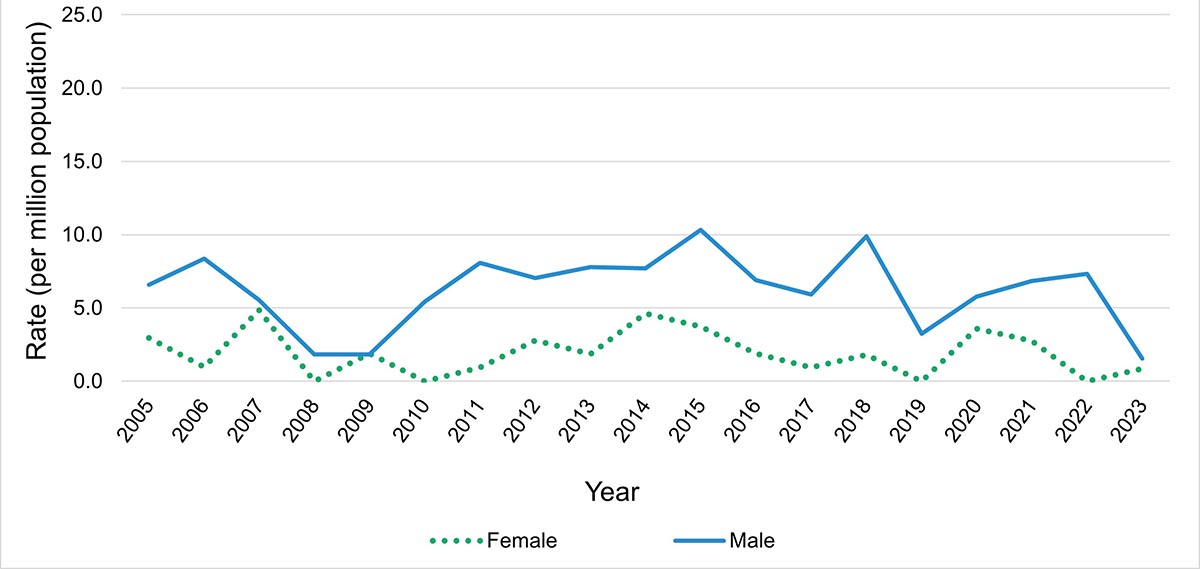
Figure 3c: Text description
| Sex | 2005 | 2006 | 2007 | 2008 | 2009 | 2010 | 2011 | 2012 | 2013 | 2014 | 2015 | 2016 | 2017 | 2018 | 2019 | 2020 | 2021 | 2022 | 2023 |
|---|---|---|---|---|---|---|---|---|---|---|---|---|---|---|---|---|---|---|---|
| Female | 3.0 | 1.0 | 4.8 | 0.0 | 1.9 | 0.0 | 0.9 | 2.8 | 1.8 | 4.6 | 3.7 | 1.9 | 0.9 | 1.8 | 0.0 | 3.6 | 2.8 | 0.0 | 0.8 |
| Male | 6.6 | 8.4 | 5.5 | 1.8 | 1.8 | 5.4 | 8.1 | 7.0 | 7.8 | 7.7 | 10.3 | 6.9 | 5.9 | 9.9 | 3.2 | 5.8 | 6.8 | 7.3 | 1.5 |
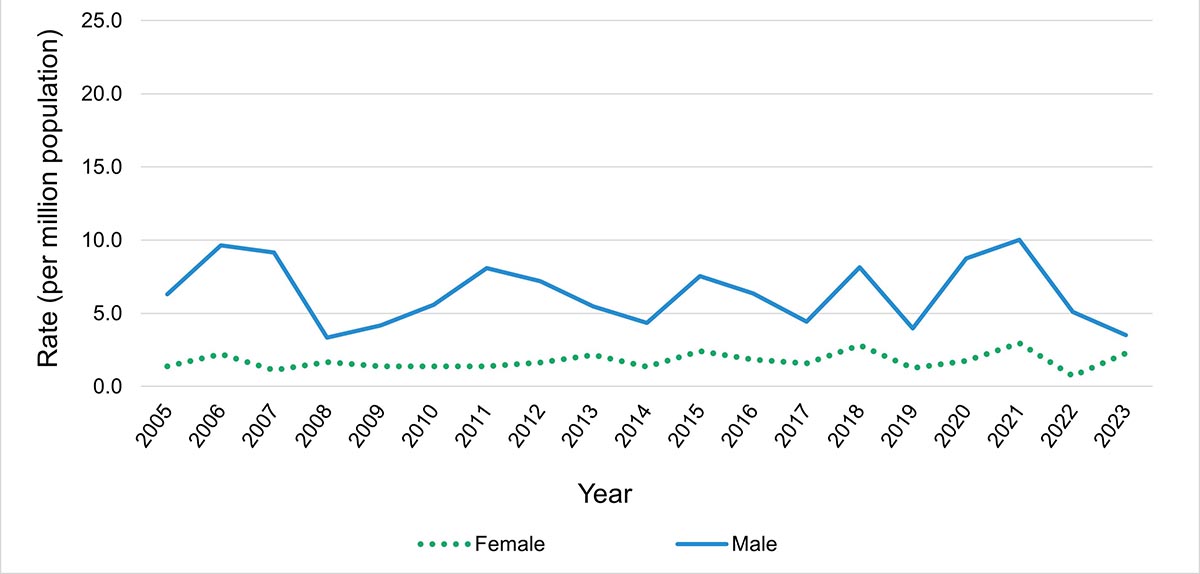
Figure 3d: Text description
| Sex | 2005 | 2006 | 2007 | 2008 | 2009 | 2010 | 2011 | 2012 | 2013 | 2014 | 2015 | 2016 | 2017 | 2018 | 2019 | 2020 | 2021 | 2022 | 2023 |
|---|---|---|---|---|---|---|---|---|---|---|---|---|---|---|---|---|---|---|---|
| Female | 1.4 | 2.2 | 1.1 | 1.7 | 1.4 | 1.4 | 1.4 | 1.6 | 2.2 | 1.3 | 2.4 | 1.8 | 1.6 | 2.8 | 1.3 | 1.7 | 3.0 | 0.7 | 2.3 |
| Male | 6.3 | 9.7 | 9.1 | 3.3 | 4.2 | 5.6 | 8.1 | 7.2 | 5.5 | 4.3 | 7.5 | 6.4 | 4.4 | 8.2 | 4.0 | 8.7 | 10.0 | 5.1 | 3.5 |
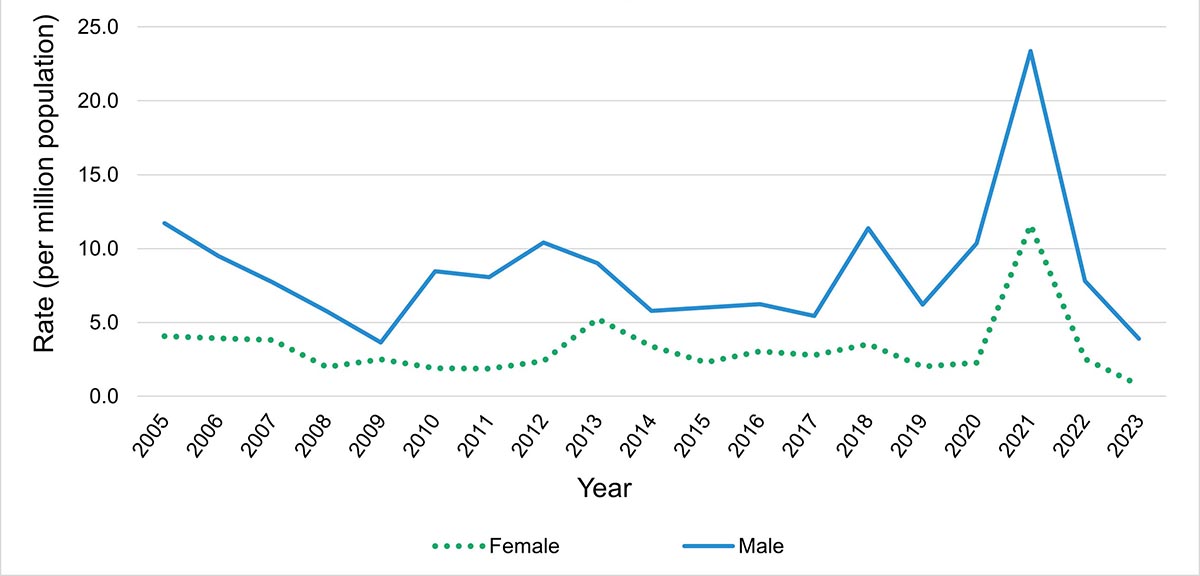
Figure 3e: Text description
| Sex | 2005 | 2006 | 2007 | 2008 | 2009 | 2010 | 2011 | 2012 | 2013 | 2014 | 2015 | 2016 | 2017 | 2018 | 2019 | 2020 | 2021 | 2022 | 2023 |
|---|---|---|---|---|---|---|---|---|---|---|---|---|---|---|---|---|---|---|---|
| Female | 4.1 | 3.9 | 3.8 | 2.0 | 2.5 | 1.9 | 1.9 | 2.4 | 5.2 | 3.4 | 2.3 | 3.1 | 2.8 | 3.5 | 2.0 | 2.3 | 11.6 | 2.5 | 0.8 |
| Male | 11.7 | 9.5 | 7.7 | 5.8 | 3.6 | 8.5 | 8.1 | 10.4 | 9.0 | 5.8 | 6.0 | 6.2 | 5.4 | 11.4 | 6.2 | 10.3 | 23.4 | 7.8 | 3.9 |

Figure 3f: Text description
| Sex | 2005 | 2006 | 2007 | 2008 | 2009 | 2010 | 2011 | 2012 | 2013 | 2014 | 2015 | 2016 | 2017 | 2018 | 2019 | 2020 | 2021 | 2022 | 2023 |
|---|---|---|---|---|---|---|---|---|---|---|---|---|---|---|---|---|---|---|---|
| Female | 14.5 | 6.4 | 12.5 | 1.5 | 3.7 | 6.6 | 7.1 | 7.5 | 8.5 | 6.3 | 6.6 | 5.8 | 5.0 | 8.6 | 3.1 | 4.9 | 61.3 | 6.4 | 2.2 |
| Male | 23.0 | 24.4 | 14.1 | 8.6 | 7.5 | 17.1 | 17.3 | 22.5 | 12.9 | 4.8 | 16.5 | 12.1 | 7.9 | 23.4 | 10.7 | 14.0 | 92.8 | 21.0 | 7.2 |
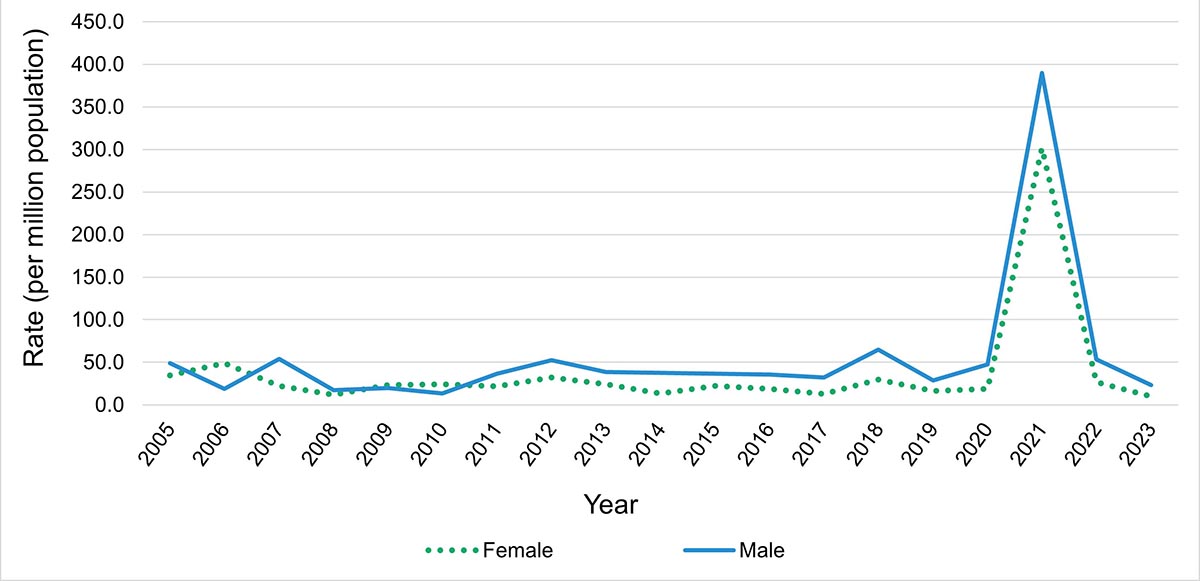
Figure 3g: Text description
| Sex | 2005 | 2006 | 2007 | 2008 | 2009 | 2010 | 2011 | 2012 | 2013 | 2014 | 2015 | 2016 | 2017 | 2018 | 2019 | 2020 | 2021 | 2022 | 2023 |
|---|---|---|---|---|---|---|---|---|---|---|---|---|---|---|---|---|---|---|---|
| Female | 34.5 | 49.1 | 22.3 | 11.7 | 23.0 | 24.0 | 22.0 | 32.3 | 24.2 | 13.4 | 22.2 | 18.9 | 12.9 | 29.5 | 16.5 | 18.8 | 301.8 | 26.9 | 9.9 |
| Male | 49.0 | 18.7 | 54.2 | 17.4 | 19.6 | 13.5 | 36.4 | 52.5 | 38.7 | 37.6 | 36.6 | 35.4 | 32.3 | 65.0 | 28.5 | 47.4 | 390.0 | 53.6 | 23.0 |
Data from Quebec not included.
Data source: Discharge Abstract Database, 2005 to 2023.
Note: There were fewer than 5 (n=5) hospitalizations for individuals under the age of 2 years between 2005 and 2023; graph not displayed. Additionally, the axis range differs for the graphs for ages 65 to 79 years and 80 years and older for display purposes due to much higher rates in these age groups.
Figure 4: Rates of emergency department visits with a diagnosed heat-related illness (per 100,000 ED visits), by sex and age group, Canada, 2004 to 2023
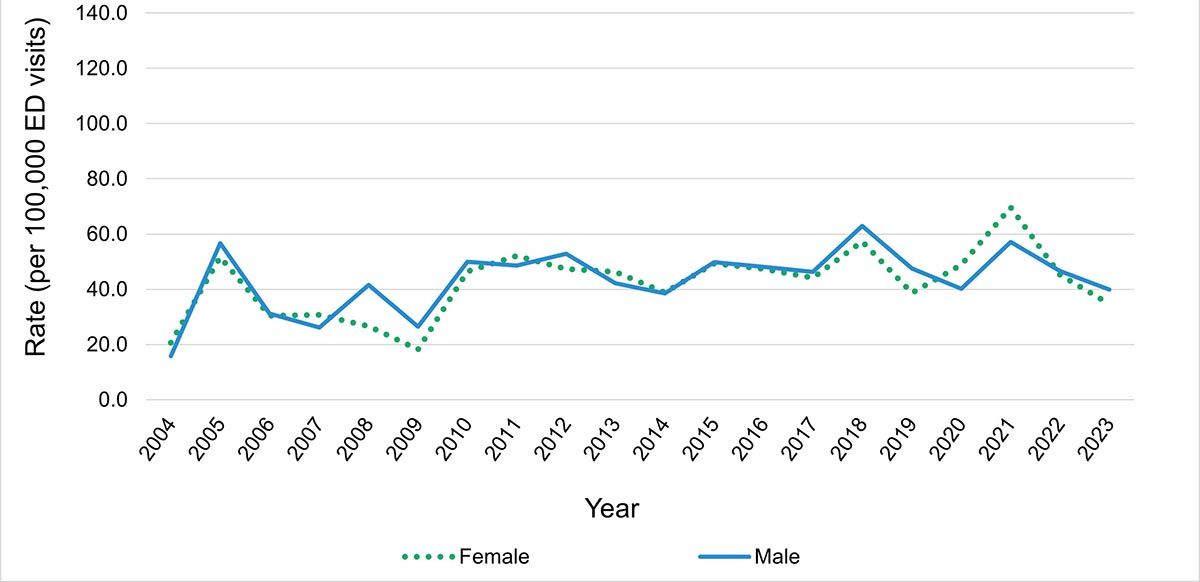
Figure 4a: Text description
| Sex | 2004 | 2005 | 2006 | 2007 | 2008 | 2009 | 2010 | 2011 | 2012 | 2013 | 2014 | 2015 | 2016 | 2017 | 2018 | 2019 | 2020 | 2021 | 2022 | 2023 |
|---|---|---|---|---|---|---|---|---|---|---|---|---|---|---|---|---|---|---|---|---|
| Female | 20.6 | 51.6 | 30.4 | 30.8 | 26.6 | 18.2 | 46.5 | 52.0 | 47.4 | 46.3 | 38.8 | 49.3 | 47.4 | 44.1 | 57.3 | 38.6 | 48.8 | 69.6 | 45.1 | 34.6 |
| Male | 15.7 | 56.6 | 31.1 | 26.2 | 41.5 | 26.4 | 49.9 | 48.5 | 52.8 | 42.2 | 38.5 | 49.7 | 48.1 | 46.3 | 62.9 | 47.5 | 40.2 | 57.1 | 46.5 | 39.9 |
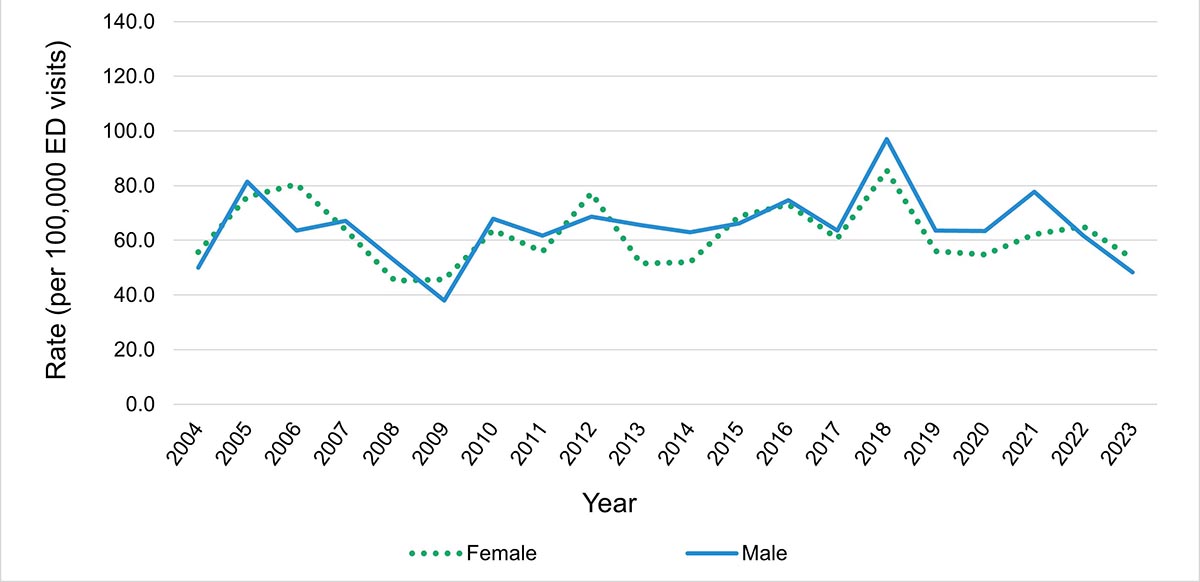
Figure 4b: Text description
| Sex | 2004 | 2005 | 2006 | 2007 | 2008 | 2009 | 2010 | 2011 | 2012 | 2013 | 2014 | 2015 | 2016 | 2017 | 2018 | 2019 | 2020 | 2021 | 2022 | 2023 |
|---|---|---|---|---|---|---|---|---|---|---|---|---|---|---|---|---|---|---|---|---|
| Female | 55.6 | 75.8 | 80.5 | 63.9 | 45.2 | 45.6 | 63.6 | 55.8 | 77.2 | 51.5 | 52.0 | 68.8 | 73.1 | 60.6 | 85.6 | 56.0 | 54.8 | 62.2 | 65.1 | 53.3 |
| Male | 49.9 | 81.5 | 63.5 | 67.1 | 52.4 | 38.0 | 67.8 | 61.6 | 68.6 | 65.6 | 62.9 | 66.1 | 74.6 | 63.5 | 97.0 | 63.5 | 63.3 | 77.7 | 61.7 | 48.3 |
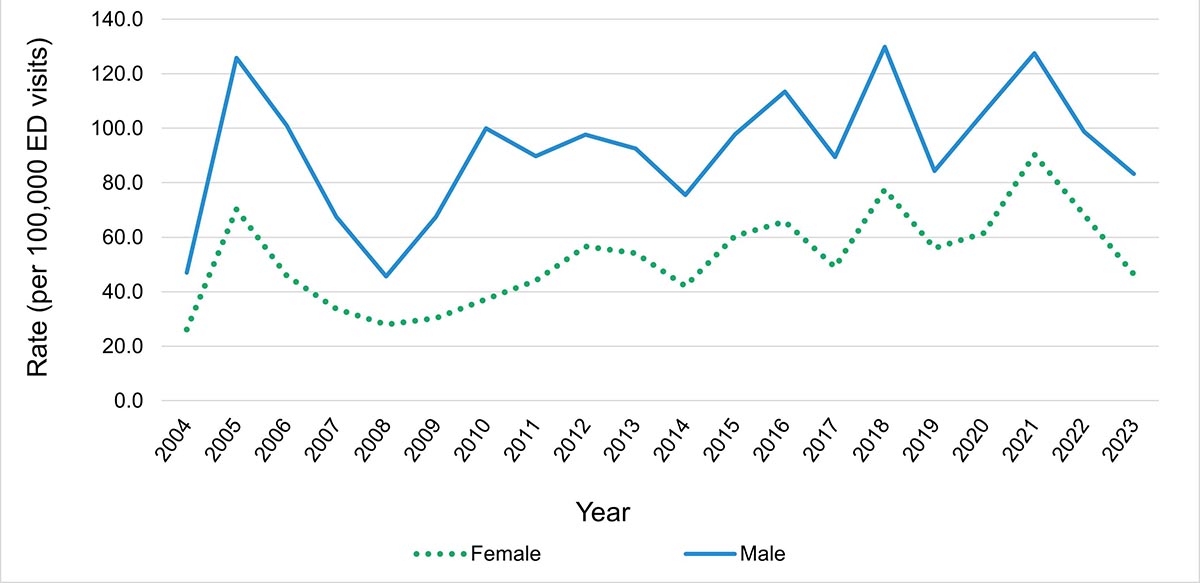
Figure 4c: Text description
| Sex | 2004 | 2005 | 2006 | 2007 | 2008 | 2009 | 2010 | 2011 | 2012 | 2013 | 2014 | 2015 | 2016 | 2017 | 2018 | 2019 | 2020 | 2021 | 2022 | 2023 |
|---|---|---|---|---|---|---|---|---|---|---|---|---|---|---|---|---|---|---|---|---|
| Female | 26.1 | 70.2 | 45.9 | 33.7 | 27.9 | 30.3 | 37.3 | 44.1 | 56.6 | 54.1 | 42.0 | 60.4 | 65.8 | 49.0 | 77.5 | 56.0 | 61.5 | 90.4 | 68.2 | 46.5 |
| Male | 47.1 | 125.8 | 101.0 | 67.5 | 45.6 | 67.4 | 100.0 | 89.7 | 97.6 | 92.5 | 75.4 | 97.8 | 113.4 | 89.5 | 129.9 | 84.3 | 106.0 | 127.5 | 98.7 | 83.2 |
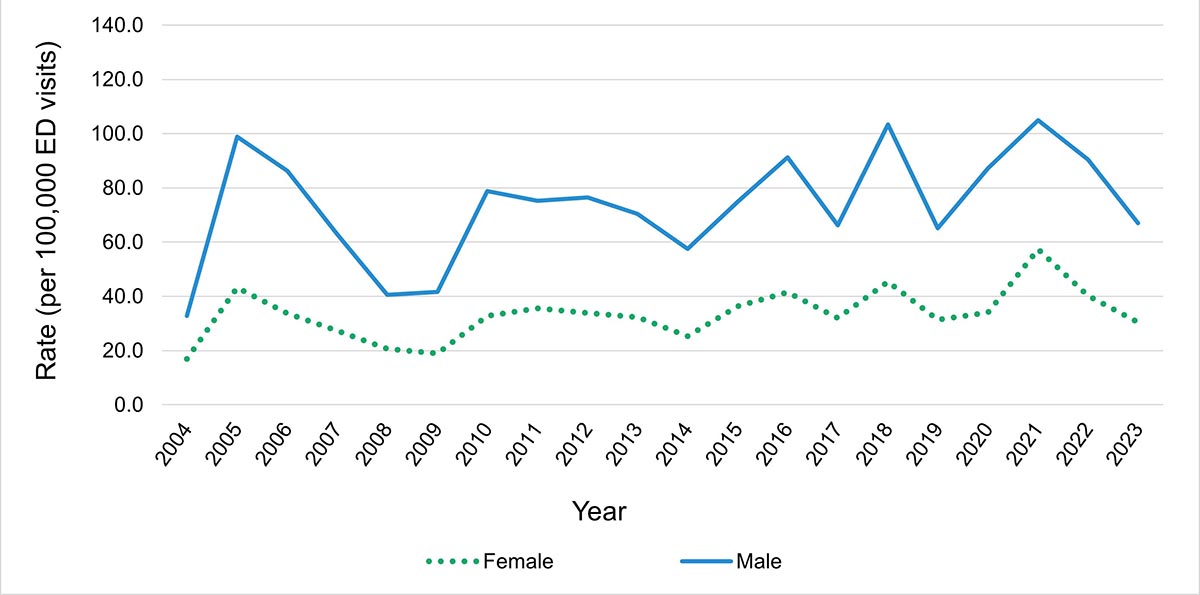
Figure 4d: Text description
| Sex | 2004 | 2005 | 2006 | 2007 | 2008 | 2009 | 2010 | 2011 | 2012 | 2013 | 2014 | 2015 | 2016 | 2017 | 2018 | 2019 | 2020 | 2021 | 2022 | 2023 |
|---|---|---|---|---|---|---|---|---|---|---|---|---|---|---|---|---|---|---|---|---|
| Female | 16.9 | 43.1 | 33.7 | 27.3 | 20.6 | 19.0 | 32.7 | 35.6 | 33.9 | 32.3 | 25.3 | 36.4 | 41.5 | 32.0 | 45.4 | 31.4 | 34.0 | 57.4 | 40.2 | 30.5 |
| Male | 32.7 | 98.8 | 86.2 | 63.0 | 40.5 | 41.6 | 78.7 | 75.3 | 76.4 | 70.4 | 57.5 | 74.9 | 91.3 | 66.2 | 103.4 | 65.0 | 87.2 | 104.9 | 90.4 | 66.9 |
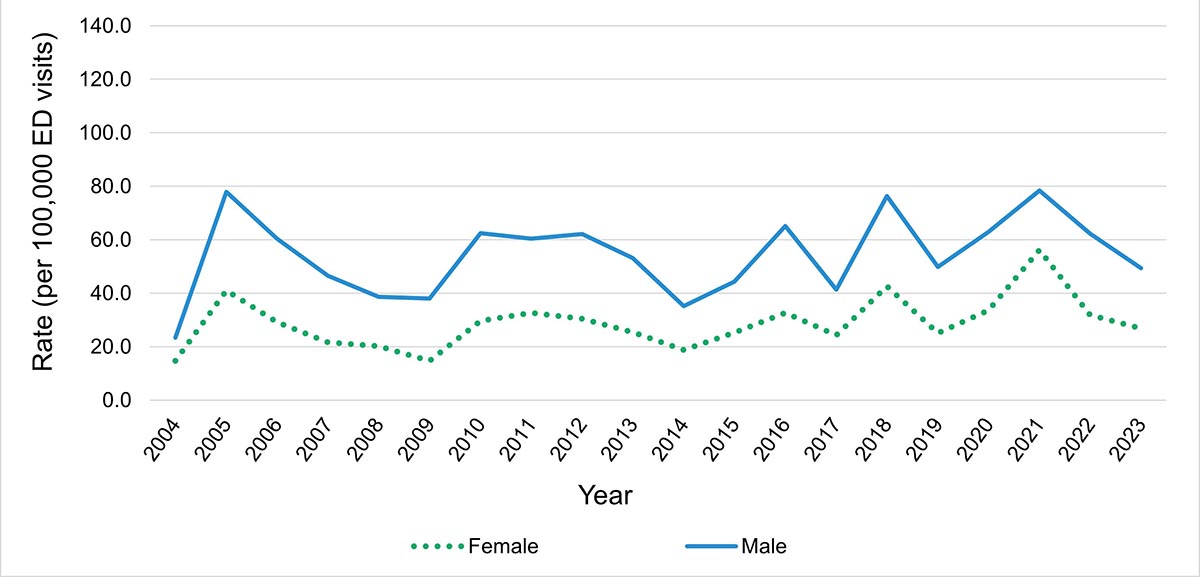
Figure 4e: Text description
| Sex | 2004 | 2005 | 2006 | 2007 | 2008 | 2009 | 2010 | 2011 | 2012 | 2013 | 2014 | 2015 | 2016 | 2017 | 2018 | 2019 | 2020 | 2021 | 2022 | 2023 |
|---|---|---|---|---|---|---|---|---|---|---|---|---|---|---|---|---|---|---|---|---|
| Female | 14.7 | 41.1 | 29.2 | 21.6 | 20.2 | 14.7 | 29.7 | 32.7 | 30.5 | 25.4 | 18.8 | 25.2 | 32.7 | 24.3 | 42.5 | 25.0 | 33.6 | 56.2 | 31.9 | 26.8 |
| Male | 23.4 | 77.9 | 60.4 | 46.5 | 38.6 | 38.0 | 62.4 | 60.4 | 62.1 | 53.2 | 35.2 | 44.2 | 65.1 | 41.3 | 76.3 | 49.8 | 62.9 | 78.4 | 62.3 | 49.4 |
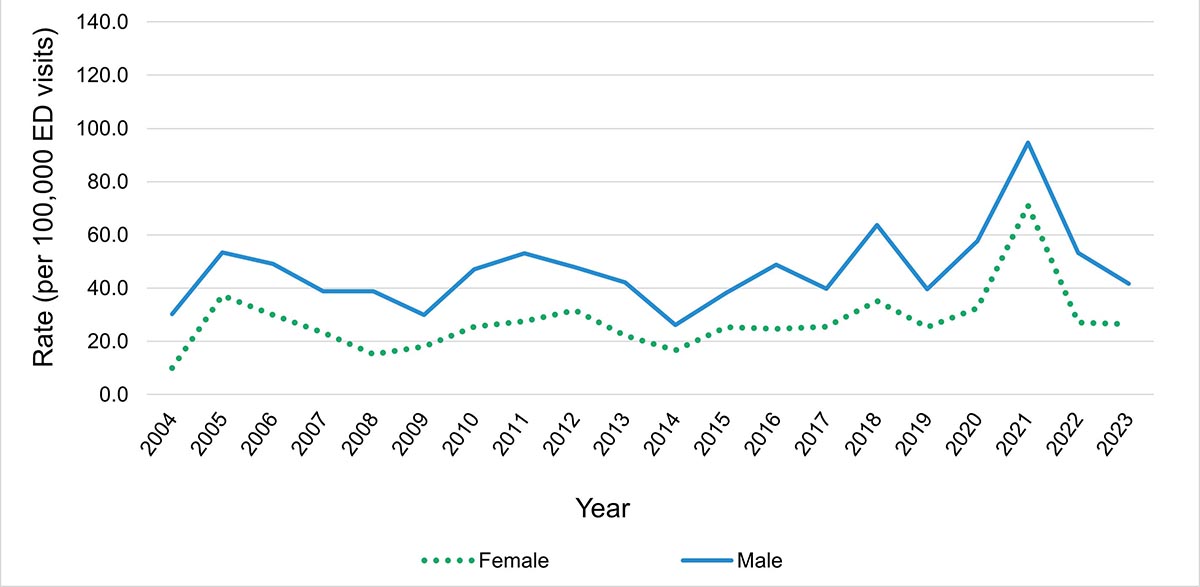
Figure 4f: Text description
| Sex | 2004 | 2005 | 2006 | 2007 | 2008 | 2009 | 2010 | 2011 | 2012 | 2013 | 2014 | 2015 | 2016 | 2017 | 2018 | 2019 | 2020 | 2021 | 2022 | 2023 |
|---|---|---|---|---|---|---|---|---|---|---|---|---|---|---|---|---|---|---|---|---|
| Female | 9.9 | 37.2 | 29.9 | 23.3 | 15.2 | 18.1 | 25.4 | 27.5 | 31.7 | 22.2 | 16.7 | 25.3 | 24.7 | 25.6 | 35.2 | 25.4 | 32.4 | 71.0 | 27.1 | 26.5 |
| Male | 30.3 | 53.4 | 49.1 | 38.8 | 38.7 | 30.0 | 47.1 | 53.1 | 47.9 | 42.2 | 26.1 | 38.2 | 48.8 | 39.8 | 63.7 | 39.5 | 57.7 | 94.6 | 53.2 | 41.6 |

Figure 4g: Text description
| Sex | 2004 | 2005 | 2006 | 2007 | 2008 | 2009 | 2010 | 2011 | 2012 | 2013 | 2014 | 2015 | 2016 | 2017 | 2018 | 2019 | 2020 | 2021 | 2022 | 2023 |
|---|---|---|---|---|---|---|---|---|---|---|---|---|---|---|---|---|---|---|---|---|
| Female | 15.8 | 60.2 | 40.0 | 29.2 | 27.1 | 16.0 | 34.2 | 36.8 | 36.7 | 23.3 | 8.8 | 21.1 | 27.6 | 17.8 | 42.4 | 22.1 | 32.5 | 122.6 | 33.2 | 24.5 |
| Male | 19.9 | 51.5 | 52.5 | 37.9 | 26.4 | 36.8 | 34.8 | 42.0 | 42.4 | 38.2 | 25.0 | 32.5 | 38.0 | 24.3 | 64.8 | 35.0 | 41.3 | 131.5 | 49.2 | 47.6 |
Data from Newfoundland and Labrador, New Brunswick, Quebec, Nunavut and Northwest Territories not available.
Data source: National Ambulatory Care Reporting System, 2004 to 2023.
Note: There were fewer than 5 (n=5) ED visits annually for individuals under the age of 2 years between 2004 and 2023; graph not displayed.
What types of heat-related illness were most common?
There were 3,571 diagnoses of a heat-related illness (ICD-10-CA T67.0-T67.9), whether as the most responsible diagnosisFootnote j and/or in a subsequent diagnosis position, made during hospitalizations between 2005 and 2023 (Figure 5). Heatstroke was the most frequently diagnosed heat-related illness, accounting for 52.3% (n=1,866) of heat-related diagnoses during this period, followed by heat exhaustion (39.1%, n=1,398). In over half of the hospitalizations where a heat-related illness was diagnosed, the heat-related illness was recorded as the most responsible diagnosis (56.5%, n=2,119).
Figure 5: Number of heat-related diagnoses recorded in hospitalization records, Canada, 2005 to 2023

Data from Quebec not included.
Data source: Discharge Abstract Database, 2005 to 2023.
Includes only T67.0-T67.9 diagnoses. Does not include counts of external cause of injury code X30.
* Other and unspecified effects of heat and light include diagnosis codes T67.8-T67.9.
** Heat exhaustion includes diagnosis codes T67.3-T67.5.
Figure 5: Text description
| Heat-related illnesses | Most responsible Diagnosis | Other diagnosis |
|---|---|---|
| Heatstroke | 1124 | 742 |
| Heat exhaustionFigure 5 Footnote ** | 807 | 591 |
| Heat syncope | 110 | 46 |
| Other and unspecified effects of heat and lightFigure 5 Footnote * | 60 | 62 |
| Heat fatigue, cramp, or oedema | 18 | 11 |
|
||
Between 2004 and 2023, there were 36,121 diagnoses of heat-related illness (ICD-10-CA T67.0-T67.9) made in emergency departments, whether as the main problemFootnote k and/or in a subsequent diagnosis position, or as a discharge diagnosis (Figure 6). The most frequently diagnosed heat-related illness was heat exhaustion, which accounted for 54.2% (n=19,590) of heat-related diagnoses during this period. Heatstroke was the second most frequently diagnosed heat-related illness (28.6%, n=10,345). In ED visit records where a heat-related illness was diagnosed, the heat-related illness was recorded as the most responsible diagnosis in the majority of records (80.1%, n=28,924).
Figure 6: Number of heat-related diagnoses recorded in emergency department records, Canada, 2004 to 2023

Data from Newfoundland and Labrador, New Brunswick, Quebec, Nunavut and Northwest Territories not available.
Data source: National Ambulatory Care Reporting System, 2004 to 2023.
Includes only T67.0-T67.9 diagnoses. Does not include counts of external cause of injury code X30.
* Other and unspecified effects of heat and light include diagnosis codes T67.8-T67.9.
** Heat exhaustion includes diagnosis codes T67.3-T67.5.
Figure 6: Text description
| Heat-related illnesses | Main problem | Other problem |
|---|---|---|
| Heat exhaustionFigure 6 Footnote ** | 15160 | 3436 |
| Heatstroke | 5896 | 3847 |
| Other and unspecified effects of heat and lightFigure 6 Footnote * | 2360 | 1347 |
| Heat syncope | 956 | 233 |
| Heat fatigue, cramp, or oedema | 732 | 164 |
|
||
How many people in Canada die from heat exposure each year?
There were 916 recorded deaths caused by exposure to extreme heat in Canada between 1981 and 2022 (Figure 7). There were no heat-related deaths recorded in 1982. Two-thirds (66.3%, n=607) of recorded heat-related deaths since 1981 have occurred since 2016, with 35.8% (n=328) occurring in 2021, the year of the extreme heat event in western Canada.Footnote l The average annual rate of heat-related deaths per million population between 1981 and 2022 was 0.6 (0.4 heat-related deaths per million population if 2021, the year of the extreme heat event in western Canada, is excluded). The rate of 8.6 deaths per million population in 2021 represents a 1,333.3% increase over the average annual rate for the reporting period. Male counts and rates of death were generally higher than those for females, with an average annual difference of 4.3 more deaths (count) and 0.3 more deaths per million population (rate) for males.
Figure 7: Counts and rates of heat-related deaths (per million population), overall and by sex, Canada, 1981 to 2022

Data for Yukon not available as of 2017.
Data sources: Canadian Vital Statistics Death Database, 1981 to 1999 (Health Canada access), 2000 to 2022 (accessed from Statistics Canada Table 13-10-0156-01).
Includes only underlying (primary) causes of death recorded as X30.
Note: For data between 1981 and 1999, where there were fewer than 5 (n<5) female or male deaths per year, counts and rates were suppressed for both sexes and for females and males combined.
Figure 7: Text description
| Year | 1981 | 1982 | 1983 | 1984 | 1985 | 1986 | 1987 | 1988 | 1989 | 1990 | 1991 | 1992 | 1993 | 1994 | 1995 | 1996 | 1997 | 1998 | 1999 | 2000 | 2001 | 2002 | 2003 | 2004 | 2005 | 2006 | 2007 | 2008 | 2009 | 2010 | 2011 | 2012 | 2013 | 2014 | 2015 | 2016 | 2017 | 2018 | 2019 | 2020 | 2021 | 2022 |
|---|---|---|---|---|---|---|---|---|---|---|---|---|---|---|---|---|---|---|---|---|---|---|---|---|---|---|---|---|---|---|---|---|---|---|---|---|---|---|---|---|---|---|
| Rate: Both sexes | 0.0 | 0.0 | 0.0 | 0.0 | 0.0 | 0.3 | 0.3 | 0.7 | 0.0 | 0.2 | 0.0 | 0.0 | 0.0 | 0.6 | 0.3 | 0.0 | 0.0 | 0.2 | 0.2 | 0.1 | 0.5 | 1.0 | 0.3 | 0.1 | 0.4 | 0.4 | 0.1 | 0.1 | 0.1 | 1.4 | 0.5 | 0.3 | 0.4 | 0.2 | 0.2 | 0.1 | 0.1 | 4.3 | 0.7 | 1.4 | 8.6 | 0.8 |
| Cases: Female | 0 | 0 | 0 | 0 | 0 | 0 | 0 | 10 | 0 | 0 | 0 | 0 | 0 | 10 | 0 | 0 | 0 | 0 | 0 | 0 | 9 | 14 | 2 | 1 | 5 | 4 | 1 | 0 | 1 | 18 | 5 | 0 | 3 | 3 | 2 | 2 | 0 | 65 | 6 | 17 | 153 | 14 |
| Rate: Female | 0.0 | 0.0 | 0.0 | 0.0 | 0.0 | 0.0 | 0.0 | 0.7 | 0.0 | 0.0 | 0.0 | 0.0 | 0.0 | 0.7 | 0.0 | 0.0 | 0.0 | 0.0 | 0.0 | 0.0 | 0.6 | 0.9 | 0.1 | 0.1 | 0.3 | 0.2 | 0.1 | 0.0 | 0.1 | 1.0 | 0.3 | 0.0 | 0.2 | 0.2 | 0.1 | 0.1 | 0.0 | 3.5 | 0.3 | 0.9 | 8.0 | 0.7 |
| Cases: Male | 0 | 0 | 0 | 0 | 0 | 0 | 0 | 9 | 0 | 0 | 0 | 0 | 0 | 7 | 0 | 0 | 0 | 0 | 0 | 3 | 8 | 18 | 9 | 3 | 8 | 10 | 3 | 2 | 3 | 30 | 11 | 9 | 11 | 4 | 6 | 2 | 3 | 95 | 22 | 37 | 175 | 16 |
| Rate: Male | 0.0 | 0.0 | 0.0 | 0.0 | 0.0 | 0.0 | 0.0 | 0.7 | 0.0 | 0.0 | 0.0 | 0.0 | 0.0 | 0.5 | 0.0 | 0.0 | 0.0 | 0.0 | 0.0 | 0.2 | 0.5 | 1.2 | 0.6 | 0.2 | 0.5 | 0.6 | 0.2 | 0.1 | 0.2 | 1.8 | 0.6 | 0.5 | 0.6 | 0.2 | 0.3 | 0.1 | 0.2 | 5.2 | 1.2 | 2.0 | 9.2 | 0.8 |
Age, sex and heat-related death
Over 85% of all heat-related deaths between 1981 and 2022 occurred in individuals aged 45 years and older, with individuals 80 years and older accounting for about 30% of all heat-related deaths (Figure 8). Generally, in age groups including individuals older than 24 years and younger than 80 years, there were noticeably more male deaths than female deaths; in age groups including individuals aged 25 to 44 years and 45 to 64 years, males accounted for 84.5% (n=71) and 71.0% (n=181) of deaths, respectively. Females accounted for more heat-related deaths only in individuals aged 80 years and older (57.1%, n=153).
Individuals 80 years and older had the highest average annual mortality rate over the reporting period (4.8 deaths per million population), followed by those aged 65 to 79 years (1.5 deaths per million population) (Figure 9). Age groups with individuals younger than 65 years had average annual rates of death per million population over the reporting period of: 0.1 (under 1 year)Footnote m, 0.3 (1 to 4 years), 0.0 (5 to 14 years), 0.1 (15 to 24 years), 0.2 (24 to 44 years) and 0.7 (45 to 64 years).
When examining sex and age, annual rates of death per million population averaged over the reporting period were the same or similar for females and males younger than 45 years (under 1 year: 0.1, both sexes; 1 to 4 years: 0.3, both sexes; 0 deaths in individuals aged 5 to 14 years; 15 to 24 years: 0.0 for females, 0.1 for males; 25 to 44 years: 0.1 for females, 0.3 for males). There were noticeably higher annual rates for males compared to females in older age groups (Figure 10). Rates per million population averaged over the reporting period (1981 to 2022) were: 45 to 64 years: 0.4 for females, 1.0 for males; 65 to 79 years: 1.2 for females, 1.7 for males; 80 years and older: 4.5 for females, 5.3 for males.
Figure 8: Counts of heat-related deaths, by sex and age group, Canada, 1981 to 2022
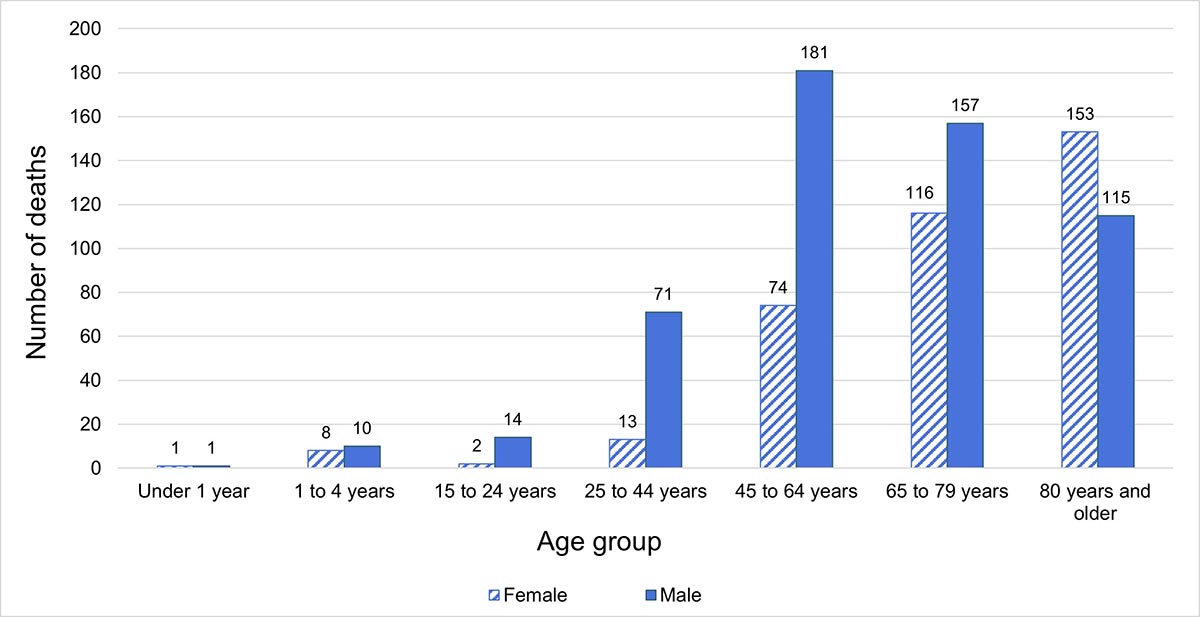
Data for Yukon not available as of 2017.
Data sources: Canadian Vital Statistics Death Database, 1981 to 1999 (Health Canada access), 2000 to 2022 (accessed from Statistics Canada Table 13-10-0156-01).
Includes only underlying (primary) causes of death recorded as X30.
Notes: Due to data limitations, the age groupings used in the morbidity and mortality analyses differ as follows: morbidity (under 2 years, 2 to 12 years, 13 to 18 years, 19 to 24 years); mortality (under 1 year, 1 to 4 years, 5 to 14 years, 15 to 24 years). There were 0 deaths in individuals aged 5 to 14 years (age group not displayed in graph).
Figure 8: Text description
| Age group | Female | Male |
|---|---|---|
| Under 1 year | 1 | 1 |
| 1 to 4 years | 8 | 10 |
| 15 to 24 years | 2 | 14 |
| 25 to 44 years | 13 | 71 |
| 45 to 64 years | 74 | 181 |
| 65 to 79 years | 116 | 157 |
| 80 years and older | 153 | 115 |
Figure 9: Rates of heat-related deaths (per million population), by age group, Canada, 1981 to 2022

Data for Yukon not available as of 2017.
Data sources: Canadian Vital Statistics Death Database, 1981 to 1999 (Health Canada access), 2000 to 2022 (accessed from Statistics Canada Table 13-10-0156-01).
Includes only underlying (primary) causes of death recorded as X30.
Notes: Due to data limitations, the age groupings used in the morbidity and mortality analyses differ as follows: morbidity (under 2 years, 2 to 12 years, 13 to 18 years, 19 to 24 years); mortality (under 1 year, 1 to 4 years, 5 to 14 years, 15 to 24 years). For data between 1981 and 1999, where there were fewer than 5 (n<5) female or male deaths per year, counts and rates were suppressed for both sexes and for females and males combined.
There were 0 deaths in individuals aged 5 to 14 years (age group not displayed in graph).
Figure 9: Text description
| Year | 1981 | 1982 | 1983 | 1984 | 1985 | 1986 | 1987 | 1988 | 1989 | 1990 | 1991 | 1992 | 1993 | 1994 | 1995 | 1996 | 1997 | 1998 | 1999 | 2000 | 2001 | 2002 | 2003 | 2004 | 2005 | 2006 | 2007 | 2008 | 2009 | 2010 | 2011 | 2012 | 2013 | 2014 | 2015 | 2016 | 2017 | 2018 | 2019 | 2020 | 2021 | 2022 |
|---|---|---|---|---|---|---|---|---|---|---|---|---|---|---|---|---|---|---|---|---|---|---|---|---|---|---|---|---|---|---|---|---|---|---|---|---|---|---|---|---|---|---|
| Under 1 year | 0.0 | 0.0 | 0.0 | 0.0 | 0.0 | 0.0 | 0.0 | 0.0 | 0.0 | 0.0 | 0.0 | 0.0 | 0.0 | 0.0 | 0.0 | 0.0 | 0.0 | 0.0 | 0.0 | 0.0 | 0.0 | 0.0 | 0.0 | 0.0 | 0.0 | 0.0 | 0.0 | 0.0 | 0.0 | 0.0 | 0.0 | 0.0 | 0.0 | 0.0 | 0.0 | 2.6 | 0.0 | 2.7 | 0.0 | 0.0 | 0.0 | 0.0 |
| 1 to 4 years | 0.0 | 0.0 | 0.0 | 0.0 | 0.0 | 0.0 | 0.0 | 0.0 | 0.0 | 0.0 | 0.0 | 0.0 | 0.0 | 0.0 | 0.0 | 0.0 | 0.0 | 0.0 | 0.0 | 0.0 | 0.0 | 0.0 | 0.7 | 0.7 | 0.0 | 0.0 | 0.7 | 0.7 | 0.0 | 0.0 | 0.0 | 0.0 | 1.3 | 0.6 | 0.6 | 0.0 | 0.6 | 1.3 | 0.0 | 0.0 | 0.0 | 1.3 |
| 5 to 14 years | 0.0 | 0.0 | 0.0 | 0.0 | 0.0 | 0.0 | 0.0 | 0.0 | 0.0 | 0.0 | 0.0 | 0.0 | 0.0 | 0.0 | 0.0 | 0.0 | 0.0 | 0.0 | 0.0 | 0.0 | 0.0 | 0.0 | 0.0 | 0.0 | 0.0 | 0.0 | 0.0 | 0.0 | 0.0 | 0.0 | 0.0 | 0.0 | 0.0 | 0.0 | 0.0 | 0.0 | 0.0 | 0.0 | 0.0 | 0.0 | 0.0 | 0.0 |
| 15 to 24 years | 0.0 | 0.0 | 0.0 | 0.0 | 0.0 | 0.0 | 0.0 | 0.0 | 0.0 | 0.0 | 0.0 | 0.0 | 0.0 | 0.0 | 0.0 | 0.0 | 0.0 | 0.0 | 0.0 | 0.0 | 0.0 | 0.2 | 0.5 | 0.0 | 0.0 | 0.0 | 0.0 | 0.0 | 0.0 | 0.2 | 0.0 | 0.0 | 0.0 | 0.2 | 0.0 | 0.0 | 0.0 | 0.0 | 0.2 | 0.0 | 0.4 | 0.0 |
| 25 to 44 years | 0.0 | 0.0 | 0.0 | 0.0 | 0.0 | 0.0 | 0.0 | 0.0 | 0.0 | 0.0 | 0.0 | 0.0 | 0.0 | 0.0 | 0.0 | 0.0 | 0.0 | 0.0 | 0.0 | 0.1 | 0.4 | 0.4 | 0.2 | 0.0 | 0.4 | 0.2 | 0.1 | 0.0 | 0.1 | 0.3 | 0.3 | 0.3 | 0.3 | 0.1 | 0.3 | 0.2 | 0.2 | 1.0 | 0.2 | 0.3 | 1.1 | 0.0 |
| 45 to 64 years | 0.0 | 0.0 | 0.0 | 0.0 | 0.0 | 0.0 | 0.0 | 1.0 | 0.0 | 0.0 | 0.0 | 0.0 | 0.0 | 0.0 | 0.0 | 0.0 | 0.0 | 0.0 | 0.0 | 0.1 | 0.5 | 1.3 | 0.1 | 0.2 | 0.4 | 0.6 | 0.2 | 0.1 | 0.2 | 1.7 | 0.2 | 0.3 | 0.4 | 0.3 | 0.4 | 0.0 | 0.0 | 6.0 | 1.1 | 2.3 | 6.0 | 1.2 |
| 65 to 79 years | 0.0 | 0.0 | 0.0 | 0.0 | 0.0 | 0.0 | 0.0 | 2.1 | 0.0 | 0.0 | 0.0 | 0.0 | 0.0 | 0.0 | 0.0 | 0.0 | 0.0 | 0.0 | 0.0 | 0.0 | 1.0 | 2.7 | 1.0 | 0.3 | 1.3 | 1.3 | 0.0 | 0.0 | 0.3 | 4.6 | 0.8 | 0.0 | 0.8 | 0.2 | 0.0 | 0.2 | 0.0 | 10.9 | 1.0 | 3.3 | 23.2 | 1.6 |
| 80 years and older | 0.0 | 0.0 | 0.0 | 0.0 | 0.0 | 0.0 | 0.0 | 15.2 | 0.0 | 0.0 | 0.0 | 0.0 | 0.0 | 10.7 | 0.0 | 0.0 | 0.0 | 0.0 | 0.0 | 1.1 | 6.4 | 9.1 | 1.9 | 0.0 | 1.8 | 2.6 | 0.0 | 0.0 | 0.0 | 9.2 | 5.9 | 2.2 | 1.4 | 0.0 | 0.0 | 0.0 | 0.0 | 21.6 | 5.6 | 6.7 | 75.8 | 4.0 |
Figure 10: Rates of heat-related deaths (per million population), by sex and selected age groups, Canada, 2000 to 2022. Axis range differs for each age group presented

Figure 10a: Text description
| Sex | 2000 | 2001 | 2002 | 2003 | 2004 | 2005 | 2006 | 2007 | 2008 | 2009 | 2010 | 2011 | 2012 | 2013 | 2014 | 2015 | 2016 | 2017 | 2018 | 2019 | 2020 | 2021 | 2022 |
|---|---|---|---|---|---|---|---|---|---|---|---|---|---|---|---|---|---|---|---|---|---|---|---|
| Female | 0.0 | 0.0 | 0.0 | 0.2 | 0.0 | 0.0 | 0.0 | 0.0 | 0.0 | 0.0 | 0.0 | 0.0 | 0.0 | 0.2 | 0.0 | 0.0 | 0.2 | 0.0 | 0.0 | 0.2 | 0.2 | 0.8 | 0.0 |
| Male | 0.2 | 0.8 | 0.8 | 0.2 | 0.0 | 0.8 | 0.4 | 0.2 | 0.0 | 0.2 | 0.6 | 0.6 | 0.6 | 0.4 | 0.2 | 0.6 | 0.2 | 0.4 | 2.0 | 0.2 | 0.4 | 1.5 | 0.0 |

Figure 10b: Text description
| Sex | 2000 | 2001 | 2002 | 2003 | 2004 | 2005 | 2006 | 2007 | 2008 | 2009 | 2010 | 2011 | 2012 | 2013 | 2014 | 2015 | 2016 | 2017 | 2018 | 2019 | 2020 | 2021 | 2022 |
|---|---|---|---|---|---|---|---|---|---|---|---|---|---|---|---|---|---|---|---|---|---|---|---|
| Female | 0.0 | 0.5 | 0.8 | 0.0 | 0.2 | 0.0 | 0.0 | 0.2 | 0.0 | 0.2 | 0.8 | 0.0 | 0.0 | 0.0 | 0.2 | 0.2 | 0.0 | 0.0 | 3.7 | 0.4 | 1.2 | 4.5 | 1.2 |
| Male | 0.3 | 0.5 | 1.8 | 0.3 | 0.2 | 0.7 | 1.2 | 0.2 | 0.2 | 0.2 | 2.5 | 0.4 | 0.6 | 0.8 | 0.4 | 0.6 | 0.0 | 0.0 | 8.3 | 1.8 | 3.4 | 7.6 | 1.2 |
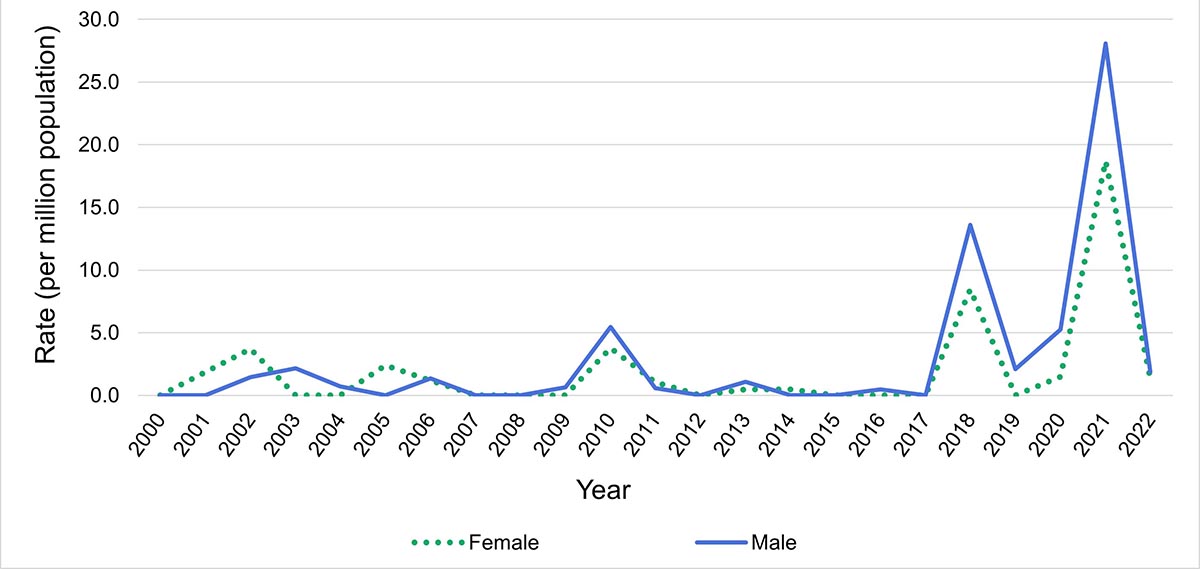
Figure 10c: Text description
| Sex | 2000 | 2001 | 2002 | 2003 | 2004 | 2005 | 2006 | 2007 | 2008 | 2009 | 2010 | 2011 | 2012 | 2013 | 2014 | 2015 | 2016 | 2017 | 2018 | 2019 | 2020 | 2021 | 2022 |
|---|---|---|---|---|---|---|---|---|---|---|---|---|---|---|---|---|---|---|---|---|---|---|---|
| Female | 0.0 | 1.9 | 3.7 | 0.0 | 0.0 | 2.4 | 1.2 | 0.0 | 0.0 | 0.0 | 3.8 | 1.1 | 0.0 | 0.5 | 0.5 | 0.0 | 0.0 | 0.0 | 8.5 | 0.0 | 1.5 | 18.7 | 1.4 |
| Male | 0.0 | 0.0 | 1.5 | 2.1 | 0.7 | 0.0 | 1.4 | 0.0 | 0.0 | 0.6 | 5.5 | 0.6 | 0.0 | 1.1 | 0.0 | 0.0 | 0.5 | 0.0 | 13.6 | 2.1 | 5.3 | 28.1 | 1.9 |
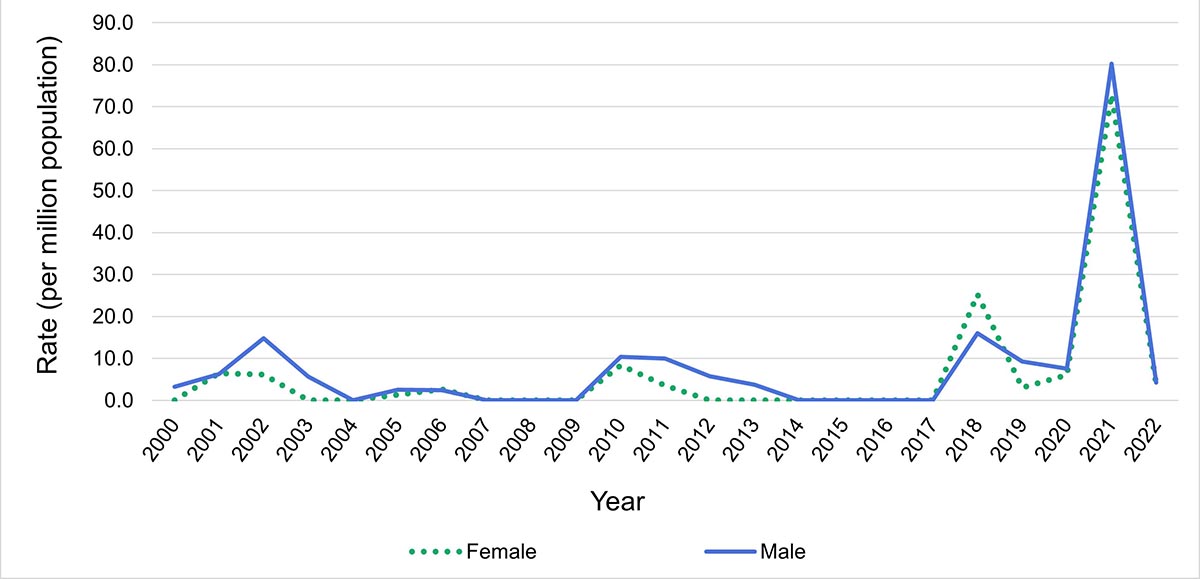
Figure 10d: Text description
| Sex | 2000 | 2001 | 2002 | 2003 | 2004 | 2005 | 2006 | 2007 | 2008 | 2009 | 2010 | 2011 | 2012 | 2013 | 2014 | 2015 | 2016 | 2017 | 2018 | 2019 | 2020 | 2021 | 2022 |
|---|---|---|---|---|---|---|---|---|---|---|---|---|---|---|---|---|---|---|---|---|---|---|---|
| Female | 0.0 | 6.4 | 6.2 | 0.0 | 0.0 | 1.4 | 2.7 | 0.0 | 0.0 | 0.0 | 8.4 | 3.5 | 0.0 | 0.0 | 0.0 | 0.0 | 0.0 | 0.0 | 25.3 | 3.1 | 6.1 | 72.9 | 3.8 |
| Male | 3.3 | 6.2 | 14.8 | 5.6 | 0.0 | 2.6 | 2.4 | 0.0 | 0.0 | 0.0 | 10.4 | 10.0 | 5.8 | 3.7 | 0.0 | 0.0 | 0.0 | 0.0 | 16.0 | 9.3 | 7.6 | 80.2 | 4.2 |
Data for Yukon not available as of 2017.
Data source: 2000 to 2022 (accessed from Statistics Canada Table 13-10-0156-01).
Includes only underlying (primary) causes of death recorded as X30.
Notes: Due to data limitations, annual rates pre-2000 were suppressed due to annual counts of heat-related deaths of fewer than 5 (n<5). For this reason, rates displaying both sex and age were limited to age groups with larger annual counts (that is, 25 to 44 years, 45 to 64 years, 65 to 79 years and 80 years and older).
Due to data limitations, the age groupings used in the morbidity and mortality analyses differ as follows: morbidity (under 2 years, 2 to 12 years, 13 to 18 years, 19 to 24 years); mortality (under 1 year, 1 to 4 years, 5 to 14 years, 15 to 24 years).
The axis range differs for these graphs for display purposes.
Discussion
What do national data on heat morbidity and mortality tell us?
This analysis used nationally-available health administrative data to track heat-related health impacts retrospectively. While the data are not collected specifically for surveillance purposes, they do offer a relatively comprehensive pan-Canadian perspective.
The number of annual heat-related deaths has increased noticeably in the last decade. These comparatively larger mortality counts coincide with years in which there were record-breaking extreme heat events, which have been occurring with greater frequency and severity than in previous decades. Over the 42 years included in the reporting period (1981 to 2022), two-thirds of recorded heat-related deaths have occurred in the last 7 years (n=607).
National-level morbidity rates were affected by the severe heat events occurring in 2018 and 2021. Annual rates in 2018 increased by 21.1% (hospitalization) and 38.7% (ED visit) and in 2021 by 367.6% (hospitalization) and 69.0% (ED visit) over reporting period averages. It should be noted that ED visit data is not consistently submitted by all provinces and territories.
Rates of severe heat-related health outcomes (that is, hospitalization and death) were highest in individuals 80 years and older, while ED visit rates were highest in adolescents and young adults (13 to 18 years, 19 to 24 years). Annual male morbidity rates were generally higher than female rates for individuals under the age of 13 years while, with few exceptions, annual male rates in age groups with individuals aged 13 years and older were consistently higher than those for females (particularly between the ages of 19 and 44 years [ED visits] and for those 80 years and older [hospitalizations]). Mortality rates for males were higher than those for females in older age groups, with the most noticeable difference between sex-based rates in individuals aged 80 years and older.
Heatstroke and heat exhaustion were the most frequently diagnosed heat-related illnesses.Footnote n Heatstroke was the most common heat-related diagnosis made during hospitalizations (52.3% [n=1 866]), while heat exhaustion accounted for 54.2% (n=19,590) of heat-related diagnoses during emergency department visits.
Limitations of using health administrative data for heat-related health surveillance
Using health administrative data to describe the burden of heat morbidity and mortality in Canada has several limitations. The challenges in this bulletin included using data collected for administrative rather than surveillance purposes, issues with data accessibility and consistency, delays in data availability and potential underreporting. These factors impact the development of a comprehensive national picture of heat-related illness and death.
Although health administrative datasets were selected to inform this analysis, their data is intended for clinical administrative purposes, not for surveillance. Therefore, these datasets include very little data on the cause(s) of the conditions diagnosed in the records. While the morbidity datasets have record fields for detailing the circumstances of injury or illness, they are not mandatory to complete. Furthermore, it was often not possible to link an exposure to excessive natural heat (captured for this analysis by ICD-10-CA code X30) to a non-heat specific diagnosis, especially if there was more than 1 diagnosis recorded. Therefore, this analysis did not capture conditions caused by heat exposure but not recorded as a T67 diagnosis (for example, ICD-10-CA code R55—syncope [fainting]). For example, if a record included a diagnosis of syncope and nausea as well as exposure information (ICD-10-CA code X30), it was not specified which diagnosis was related to the exposure code.
Several of the limitations were related to data accessibility. Firstly, in capturing heat-related morbidity, the analysis was limited to hospitalization and ED visit records. Individuals seeking medical care for heat-related illness from health care providers such as family doctors or walk-in clinics were not captured in this analysis. Secondly, due to the nature of data sharing agreements between the federal government and the province of Quebec, it was not possible to access Quebec hospital discharge and ED visit data. Lastly, there were restrictions on the level of detail in the data that could be published in this bulletin—several annual mortality rates and counts with small numbers were suppressed to ensure the confidentiality of personal health information, and limits on data disaggregation resulted in different age groupings for morbidity and mortality data.
Consistency of data coverage across time and space were limitations for the analysis of hospital discharge and ED visit data. Submission of ED visit data to NACRS varied annually across provinces and territories by record completeness and volume—that is, some provinces and territories submitted all ED visit data, some submitted a subset (from a limited number of facilities and/or partial patient records) and others did not submit any data. Importantly, Ontario submits all ED visit data to NACRS; its large population and large submission volume mean that it strongly influences trends in national data, particularly because many other provinces and territories do not submit or only partially submit data to NACRS. Additionally, NACRS provincial and territorial reporting timelines since 2004 were inconsistent, with some provinces and territories recently beginning submission of ED visit data and others no longer reporting. Incomplete coverage of ED visit data across all provinces and territories precluded the use of population denominators for rate calculation. As a result, the ED visit ‘rate’ is not a true rate as its denominator is derived from the total number of ED visits across the country, not the population at risk.
Timeliness (how quickly data is collected, reported and made available) was a limitation for the analysis of both morbidity and mortality data. Morbidity data were available a few months after collection but were subject to modification until May of the following calendar year while provinces and territories finalized data submissions. Mortality data were available following a delay of over a year after their collection. Mortality data were also subject to retroactive modification. For example, the discrepancy between CVSD mortality counts and those published by the British Columbia Coroners Service for 2021 can be explained by the ongoing submission of coroners’ certificates of death to British Columbia Vital Statistics Reference 13. The national data cannot be updated until the provincial data is submitted.
Underreporting presents a significant challenge in quantifying the burden of heat-related deaths in Canada, partly because it is difficult to determine whether extreme heat was a causal or contributing factor in these deaths. Heat-related deaths that occur among individuals with preexisting disease (for example, heart, lung disease) are usually attributed to the underlying medical condition. Cases where the individual is found deceased before medical intervention also precludes the ability to observe signs and symptoms of hyperthermia; and after death, many hyperthermia autopsy findings associated with heat exposure do not clearly indicate hyperthermia. Thus, a determination of hyperthermia as a cause or contributing factor to death is often based on the investigation of the scene and circumstances of death. These factors contribute to issues with accuracy and comparability of heat-related mortality data Reference 14Reference 15Reference 16Reference 17.
Conclusion
Using nationally-available health administrative data allowed for the development of a pan-Canadian picture of heat-related morbidity and mortality in Canada. While there are limitations to using these data sources, this bulletin demonstrates that the number of heat-related deaths in Canada has increased over the last decade compared to the 30 years preceding it. Furthermore, there were more heat-related deaths, hospitalizations and ED visits during years with extreme heat events. Older individuals and males were also found to more frequently experience severe health outcomes (that is, hospitalization and death). As Canada’s climate continues warming and extreme heat events become more frequent and severe, the likelihood of adverse heat-related health outcomes will continue to rise without targeted intervention or adaptation strategies Reference 3.
The threat of heat-related mortality and morbidity is increasing, making a comprehensive, consistent and continually-updated national picture of heat-related deaths and illnesses a valuable tool for understanding the impacts of climate change and adaptation strategies on the health of people living in Canada. Improvements to data quality, accessibility, availability and timeliness would allow for a more comprehensive picture of heat-related morbidity and mortality to better understand impacts and inform adaptation actions.
Disclaimer
Parts of this material are based on data and information compiled and provided by the Canadian Institute for Health Information (CIHI). However, the analyses, conclusions, opinions and statements expressed herein are those of the authors and not necessarily those of CIHI.
Related links
- Learn about what Health Canada is doing to protect the health of people living in Canada from extreme heat: Extreme heat events
- Heat-related illnesses and sunburns - Canadian Hospitals Injury Reporting and Prevention Program (CHIRPP): data blog
Appendix
Table A1. ICD-9 and ICD-10-CA codes used to identify heat-related morbidity and mortality records
| (ICD-9 and ICD-10-CA) | 1981 to 2022 |
|---|---|
| ICD-9 | Used for records 1981 to 1999 |
| 900 | Exposure to excessive heat due to weather conditions |
| 900.9 | Exposure to excessive heat of unknown originFootnote o |
| ICD-10-CA | Used for records 2000 to 2022 |
| X30 | Exposure to excessive natural heat |
| (ICD-10-CA) | 2004/05 to 2023 |
|---|---|
| X30 | Exposure to excessive natural heat |
| T67 Code Series | Effects of heat and light |
| T67.0 | Heatstroke and sunstroke |
| T67.1 | Heat syncope |
| T67.2 | Heat cramp |
| T67.3 | Heat exhaustion, anhidrotic |
| T67.4 | Heat exhaustion due to salt depletion |
| T67.5 | Heat exhaustion, unspecified |
| T67.6 | Heat fatigue, transient |
| T67.7 | Heat oedema |
| T67.8 | Other effects of heat and light |
| T67.9 | Effect of heat and light, unspecified |
Table A2. Information on the data sources used in this analysis
| Database/Table Name | Data Steward and/or Data Holder | Data Type | Available Years of Data | Access |
|---|---|---|---|---|
| Discharge Abstract Database (DAD) | Canadian Institute for Health Information (CIHI) | Hospital discharges | 2005 to 2023 | Health Canada— Health Data Analysis and Dissemination Division (HDAD) |
| National Ambulatory Care Reporting System (NACRS) | Canadian Institute for Health Information (CIHI) | ED visits | 2004 to 2023 | Health Canada— Health Data Analysis and Dissemination Division (HDAD) |
| Canadian Vital Statistics Death Database (CVSD) | Statistics Canada | Mortality records | 1981 to 1999 | Health Canada— Health Data Analysis and Dissemination Division (HDAD) |
| Deaths, by cause, Chapter XX: External causes of morbidity and mortality(V01 to Y89) | Statistics Canada | Mortality records | 2000 to 2022 | Statistics Canada website Reference 9 |
| Population estimates on July 1, by age and sex | Statistics Canada | Population denominators | 1981 to 2022 | Statistics Canada website Reference 12 |
References
- Reference 1
-
Zhang X, Flato G, Kirchmeier-Young M, Vincent L, Wan H, Wang X, et al. Changes in temperature and precipitation across Canada. In: Bush E and Lemmen DS, editor. Canada’s changing climate report. Ottawa: Government of Canada; 2019. p. 112–193.
- Reference 2
-
British Columbia Coroners Extreme heat and human mortality: a review of heat-related deaths in B.C. in summer 2021. Victoria: British Columbia Coroners Service; 2021. Available from: www2.gov.bc.ca/assets/gov/birth-adoption-death-marriage-and-divorce/deaths/coroners-service/ death-review-panel/extreme_heat_death_review_panel_report.pdf
- Reference 3
-
Hebbern C, Gosselin P, Chen K, Chen H, Cakmak S, MacDonald M, et Future temperature-related excess mortality under climate change and population aging scenarios in Canada. Can J Public Health. 2023 Oct; 114(5):726–736. doi: 10.17269/s41997-023-00782-5
- Reference 4
-
Santé Montréal. Vague de chaleur: été 2018 à Montréal: enquête épidémiologique. Montreal: Gouvernement du Quebec; Available from: https://numerique.banq.qc.ca/patrimoine/ details/52327/3737294?docref=irDjexzzxNV8AspydEw39w
- Reference 5
-
Public Health Ontario health profile: extreme weather—the fallout after the storm. Toronto: Public Health Ontario; 2015. Available from: www.publichealthontario.ca/-/media/Documents/O/2014/ ohp-extreme-weather.pdf?rev=f81cf05528844f47ba2b06d0450ffcbc&sc_lang=en
- Reference 6
-
Lebel G, Lamothe F, Dubé M, Bustinza Surveillance des impacts des vagues de chaleur extrême sur la santé au Québec à l’été 2018. Québec: Institut national de santé du Québec; 2019. Available from: www.inspq.qc.ca/publications/surveillance-impacts-vagues-chaleur-extreme-sur-sante-quebec-l-ete-2018
- Reference 7
-
Public Health Environmental scan: heat alert and response systems (HARS). Toronto: Public Health Ontario; 2023. Available from: www.publichealthontario.ca/-/media/Documents/H/2023/ heat-alert-response-systems-hars.pdf?rev=d5e50256f88d4669b95093eaa156c58b&sc_lang=en
- Reference 8
-
White RH, Anderson S, Booth JF, Braich G, Draeger C, Fei C, et The unprecedented Pacific Northwest heatwave of June 2021. Nat Commun. 2023 Feb;14(727). doi: 10.1038/s41467-023-36289-3
- Reference 9
-
Statistics Table 13-10-0156-01: Deaths, by cause, chapter XX: external causes of morbidity and mortality (V01 to Y89) [cited 2023 Dec 15]. Available from: https://www150.statcan.gc.ca/t1/tbl1/en/ tv.action?pid=1310015601
- Reference 10
-
United States Environmental Protection Technical documentation: heat-related illnesses. Washington: United States Environmental Protection Agency; 2016. Available from: www.epa.gov/sites/default/files/2021-03/documents/heat-illness_tech-doc.pdf
- Reference 11
-
United States Environmental Protection Agency. Technical documentation: heat-related deaths. Washington: United States Environmental Protection Agency; Available from: www.epa.gov/sites/default/files/2021-04/documents/heat-deaths_tech-doc.pdf
- Reference 12
-
Statistics Table 17-10-0005-01: Population estimates on July 1, by age and sex [cited 2023 Nov 22]. Available from: https://www150.statcan.gc.ca/t1/tbl1/en/tv.action?pid=1710000501
- Reference 13
-
Lee MJ, McLean KE, Kuo M, Richardson GRA, Henderson Chronic diseases associated with mortality in British Columbia, Canada during the 2021 western North America extreme heat event. GeoHealth. 2023 Mar; 7(3). doi: 10.1029/2022GH000729
- Reference 14
-
Henderson SB, Lamothe F, Yao J, Plante C, Donaldson S, Stranberg R, et Improving attribution of extreme heat deaths through interagency cooperation. Can J Public Health. 2022 Aug;113:698–702. doi: 10.17269/s41997-022-00672-2
- Reference 15
-
Bowes M, Strang R, Huyer Use of data from death investigation systems to support community health and prevent premature deaths in Canada. CMAJ. 2024 Apr;196(15). doi: 10.1503/cmaj.231386
- Reference 16
-
Kelsall D, Bowes No standards: medicolegal investigation of deaths. CMAJ. 2016 Feb;188(3). doi: 10.1503/cmaj.160041
- Reference 17
-
Yoon L, Richardson GRA, Gorman M. Reflections on a century of extreme heat event-related mortality reporting in Geohealth. 2024 Feb;8(2). doi: 10.1029/2023GH000895
Footnotes
- Footnote a
-
Quebec hospital discharge and emergency department visit data were not accessible for this analysis.
- Footnote b
-
Note that while hospital discharge and death datasets used in this analysis have complete record coverage across Canada, some provinces and territories do not submit, or only partially submit, ED visit records to the National Ambulatory Care Reporting System (NACRS). This affects the national-level rates presented in this bulletin.
- Footnote c
-
This bulletin uses the term ‘hospitalizations’ to refer to inpatient stays for heat-related illnesses, based on hospital discharge records.
- Footnote d
-
Prior to 2000, the CVSD used the ICD-9 classification system. In 2000, the ICD-10-CA classification system was implemented.
- Footnote e
-
Statistics Canada online Table 13-10-0156-01 provided mortality data from 2000-2022 because Health Canada access did not extend past 2015. The year 2000 is the first year data is available for Table 13-10-0156-01 [9].
- Footnote f
-
Quebec hospital discharge data not included.
- Footnote g
-
ED visit denominators were records of ED visits (for example, not day surgeries) occurring between May 1 and September 30.
- Footnote h
-
Includes records with ICD-10-CA T67 series and/or X30 diagnosis codes.
- Footnote i
-
There were fewer than 5 (n=5) hospitalizations with a heat-related diagnosis in individuals under 2 years of age between 2005 and 2023.
- Footnote j
-
Diagnosis or condition that can be described as being most responsible for the patient’s stay in hospital (from Canadian Institute for Health Information. Assigning Diagnosis Types to DAD Abstracts [job aid]. Ottawa, ON: CIHI; 2022).
- Footnote k
-
ICD-10-CA code that describes the most clinically significant diagnosis, condition, problem or circumstance for the client’s visit (from Canadian Institute for Health Information. NACRS Data Elements, 2023 to 2024. Ottawa, ON: CIHI; 2023).
- Footnote l
-
The discrepancy between the number of heat-related deaths that occurred during the 2021 extreme heat event in western Canada that were reported by the British Columbia Coroners Service and the number of deaths available in national datasets is discussed below in the ‘Limitations’ section.
- Footnote m
-
Note that due to data limitations, the age groupings used in the morbidity and mortality analyses differ as follows: morbidity (under 2 years, 2 to 12 years, 13 to 18 years, 19 to 24 years); mortality (under 1 year, 1 to 4 years, 5 to 14 years, 15 to 24 years).
- Footnote n
-
ICD-10-CA T67 series diagnoses only
- Footnote o
-
Although this diagnostic code is not specific to natural heat exposure, it was included to create a definition for heat death identification that would capture as many potential heat deaths due to environmental heat exposure as possible, particularly in older data (1981–1999), due to the limited information available