
Supervised Consumption Sites Pandemic Impact Survey: Results at a glance
On this page
Context
Addressing the complex issue of harms caused by the ongoing toxic drug supply and overdose crisis requires various approaches. One of the key approaches identified by the Canadian Drugs and Substances Strategy is the provision of services that support a continuum of care, including treatment, harm reduction and recovery options for people who use drugsFootnote 1. These services can help people reduce their substance use as well as the likelihood of substance use-related harms. Supervised consumption sites (SCS) are an important component of this approach. SCS provide a safe, clean space for people to bring their own drugs to use in the presence of trained staff, while also providing access to important health and social services, including substance use treatment for those who are ready. SCS help to:
- prevent overdose deaths
- facilitate entry into drug treatment, as well as health and social services
- reduce the risk of transmission of bloodborne pathogens
- reduce the burden on hospitals and emergency department visits
The COVID-19 pandemic, including public health measures implemented to stop the spread of COVID-19, had an impact on the availability and accessibility of health care services, including harm reduction services such as SCSFootnote 2. Furthermore, the pandemic may have led to changes in substance use behaviours and environments that increased risk for SCS clients. These factors include increased substance use as a means of coping, decreased access to social support networks, changes to drug supply, and increased use aloneFootnote 3.
In order to better understand the potential ongoing impacts of the COVID-19 pandemic on federally-exempted SCS, Health Canada conducted the Supervised Consumption Sites Pandemic Impact Survey.
This report contains a summary of the results of this survey, including impacts on services delivered, substance use behaviors, and mood of clients and staff as described by SCS operators, from the onset of pandemic-related public health measures in early 2020 until September 2022.
Evaluation approach
The survey was conducted in three cycles. The data collection for cycle 1 occurred between July and August of 2020 and the participants were asked to respond to the survey based on their perceptions since the implementation of widespread public health measures in their province. The data collection for cycle 2 occurred between April and June of 2021 based on sites' perception since September 1, 2020. For cycle 3, data was collected between July and September of 2022 and was based on sites' perception since September 1, 2021 (Table 1).
| Cycle 1 | Cycle 2 | Cycle 3 | |
|---|---|---|---|
| Data collection period | July to August, 2020 | April to June, 2021 | July to September, 2022 |
| Period of focus | Since implementation of widespread public health measures | Since September 1, 2020 | Since September 1, 2021 |
The surveys focused on:
- the impacts of the pandemic on service delivery
- the impacts of the pandemic on substance use behaviors among clients
- changes in everyday practices at the sites to adapt to the pandemic
- the impacts of the pandemic on SCS clients and staff
Evaluation methodology
The questionnaire was administered virtually and had 20 questions in cycle 1 and 26 questions in cycles 2 and 3. The surveys were sent by email to site operators, and the survey would take approximately 10 to 15 minutes to complete. Most questions were multiple choice with a few open-ended questions. Each site's supervisor was responsible for filling out and submitting the survey. Only one completed survey per site was accepted during each survey cycle. Surveys were excluded if less than half of the questions were completed.
Findings
Survey responses and service provision
The overall response rate across cycles ranged from 68% to 73%, with site supervisors from 27 out of 37 SCS having completed the survey in cycle 1, 25 out of 37 completed surveys returned in cycle 2, and 27 out of 39 completed surveys returned in the final cycle. One respondent in cycle 2 did not complete the entire questionnaire but was retained in the analysis as they had answered more than half of the questionnaire.
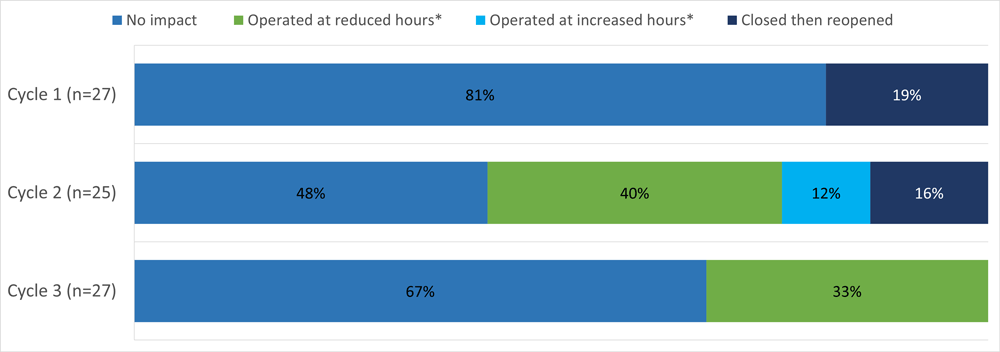
Overall, most sites that responded to the surveys indicated that they continued to provide services since the implementation of widespread public health measures in their provinces in response to the COVID-19 pandemic (Figure 1). Out of 27 sites in cycle 1 (since the implementation of restrictions to August 2020), 81% remained open and 19% closed temporarily then reopened. None of the sites had to close permanently in any of the cycles. Beginning in cycle 2, questions were added around impacts on operating hours. Many sites reported operating at reduced hours: 40% in cycle 2 (September 2020 to June, 2021) and 33% in cycle 3 (September 2021 to September, 2022).
Text description
| Response | Cycle 1 (n=27) July to August, 2020 |
Cycle 2 (n=25) April to June, 2021 |
Cycle 3 (n=27) July to September, 2022 |
|---|---|---|---|
| No impact | 81% | 48% | 67% |
| Operated at reduced hoursFootnote * | n/a | 40% | 33% |
| Operated at increased hoursFootnote * | n/a | 12% | 0% |
| Closed then reopened | 19% | 16% | 0% |
Question: How has the COVID-19 pandemic impacted your site's operations? Notes: Not available (n/a) – Data were not collected in the survey cycle. Footnotes
|
|||
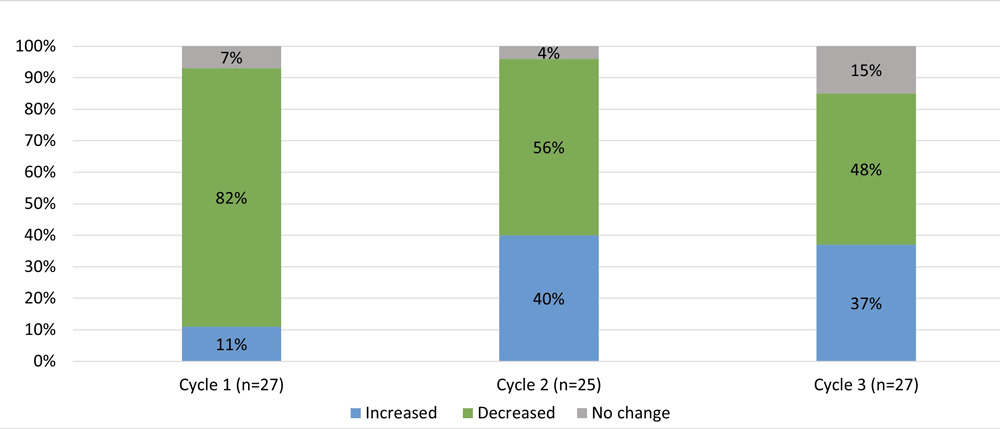
Most sites (82%) reported decreases in the number of visits following the initial implementation of widespread public health measures in cycle 1 (Figure 2). However, after September 2020, sites had a more mixed experience, with some sites reporting a decrease in client visits compared to the previous cycle (56% in cycle 2 and 48% in cycle 3), and some noticing an increase in client visits (40% in cycle 2 and 37% in cycle 3). Participants in cycle 3 identified some potential reasons for the shifts in service utilization, including lockdowns and the necessity for staff to isolate in the event of illness. Responders also noted that the reassignment of staff to support the pandemic response resulted in a reduced workforce available for supervised consumption sites.
Text description
| Response | Cycle 1 (n=27) July to August, 2020 |
Cycle 2 (n=25) April to June, 2021 |
Cycle 3 (n=27) July to September, 2022 |
|---|---|---|---|
| Increased | 11% | 40% | 37% |
| Decreased | 82% | 56% | 48% |
| No change | 7% | 4% | 15% |
Question: Have you noticed a change in the number of visits to your site? |
|||
Substance use
For each survey cycle, a large majority of respondents reported a change in substance use behaviours at their site (23 (85%) in cycle 1, 20 (80%) in cycle 2 and 18 (67%) in cycle 3). Among those sites, some of the most frequently reported changes were related to potentially harmful substance use behaviours. Most sites (61%) observed more dangerous drug use practices among clients in cycle 1 (for example, injecting drugs that are normally inhaled due to COVID-19 fears), whereas this observation was less common among sites from September 2020 onwards (30% in cycle 2 and 37% in cycle 3). However, the proportion of sites reporting more frequent drug use among their clients remained consistently high throughout all three cycles (48%, 45% and 48% in cycles 1, 2 and 3, respectively). Many sites reported seeing an increase in different substances being used among their clients. This observation was particularly common during cycle 2 (70%) but was also present among a number of sites in cycle 1 (44%) and cycle 3 (37%) (Figure 3).

Text description
| Response | Cycle 1 (n=23) July to August, 2020 |
Cycle 2 (n=20) April to June, 2021 |
Cycle 3 (n=18) July to September, 2022 |
|---|---|---|---|
| More frequent use | 48% | 45% | 48% |
| More dangerous drug use practices | 61% | 30% | 37% |
| Use of different substances than normal | 44% | 70% | 37% |
Question: Have you noticed any changes in substance use behaviours among your clients? What changes have you observed? |
|||
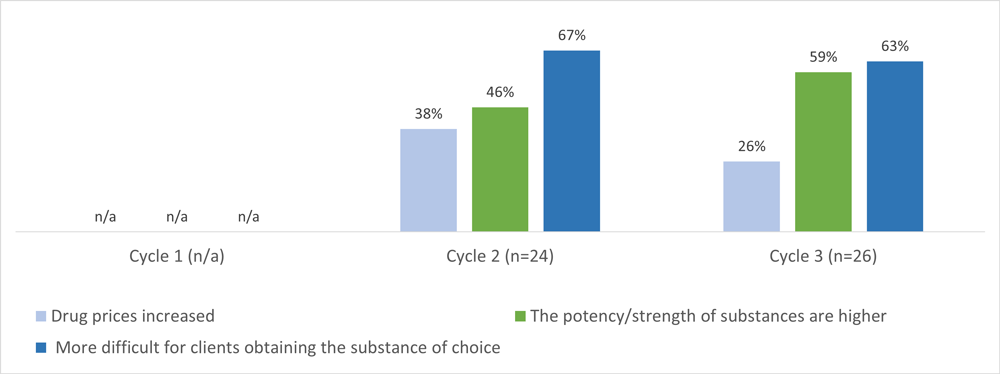
Virtually all sites reported changes in the drug supply from September 2020 onwards (24 (96%) in cycle 2 and 26 (96%) in cycle 3). A majority of these sites (67% and 63% in cycles 2 and 3, respectively) reported client concerns around difficulty obtaining their substance of choice (Figure 4). Other notable changes of concern in the drug supply included an increase in potency or strength of substances compared to the previous cycle (46% in cycle 2 and 59% in cycle 3). Questions about changes in drug supply were not included in cycle 1.
Text description
| Response | Cycle 1 (n/a) July to August, 2020 |
Cycle 2 (n=24) April to June, 2021 |
Cycle 3 (n=26) July to September, 2022 |
|---|---|---|---|
| Drug prices increased | n/a | 38% | 26% |
| The potency/strength of substances are higher | n/a | 46% | 59% |
| More difficult for clients obtaining the substance of choice | n/a | 67% | 63% |
Question: Have your clients expressed any concerns over changes to the supply of drugs on the market? What have your clients expressed? Notes: Not available (n/a) – Data were not collected in the survey cycle. |
|||
The majority of sites reported a shift in drug use patterns by drug type: 16 (59%) in cycle 1, 16 (64%) in cycle 2 and 14 (52%) in cycle 3. Of these, 63% of the sites reported an increase in stimulant use in cycle 1, followed by a decrease in number of sites reporting stimulant use (44% in cycle 2 and 50% in cycle 3). The proportion of sites reporting an increase in opioid use was 56% in cycle 1 and 38% in cycle 2. During cycle 3, 71% of the sites reported seeing more opioids being used at their sites. Beginning in cycle 2, a question was added on changes in use of benzodiazepines. It was immediately apparent that use of this class of drug was an emerging concern. In cycle 2 and 3, 75% and 86% of sites, respectively, indicated an increased use of benzodiazepines (Figure 5).

Text description
| Response | Cycle 1 (n=16) July to August, 2020 |
Cycle 2 (n=16) April to June, 2021 |
Cycle 3 (n=14) July to September, 2022 |
|---|---|---|---|
| Increase in opioid use | 56% | 38% | 71% |
| Increase in stimulant use | 63% | 44% | 50% |
| Increase in benzodiazepine use | n/a | 75% | 86% |
Question: Have you noticed a change in the types of substances used at your site? What changes have you observed? Notes: Not available (n/a) – Data were not collected in the survey cycle. |
|||
Overdoses, emergency response and service referrals
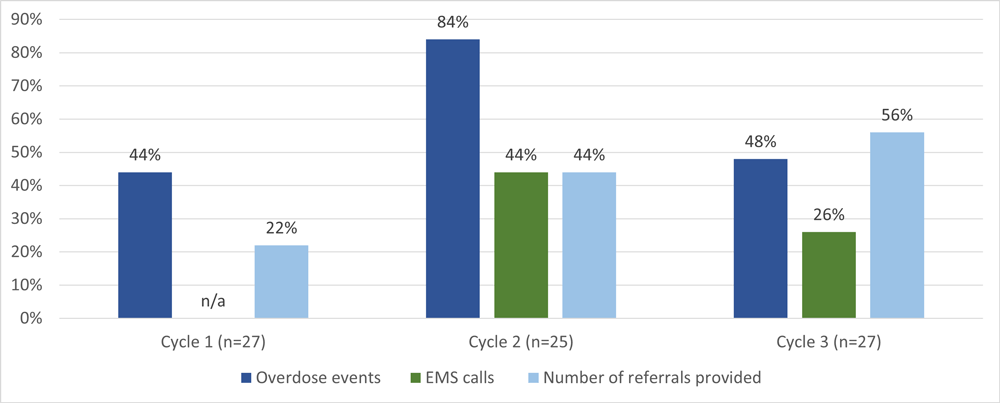
Most sites reported an increase in overdose events at SCS throughout the reporting period (Figure 6). This was particularly notable in cycle 2 where 84% of sites reported an increase in overdose events compared to the previous cycle. A large number of sites also reported an increase in overdoses in cycle 1 (44%) and cycle 3 (48%). Data from the Supervised consumption sites dashboard show trends in reporting of overdose events which appear to confirm these perceptions. A sustained increase in overdose events was observed from July 2020 to November 2021 (approximately the period covered by cycle 2), whereas overdoses declined between December 2021 and August 2022 to rise again beginning in September 2022 (cycle 3 period).
Approximately 44% of sites reported an increase in calls to emergency medical services (EMS) in cycle 2, compared to 26% in cycle 3. The question about EMS service calls was not included in cycle 1.
As the survey period progressed, there was an increasing proportion of sites providing referrals. In cycle 1, 22% of sites reported an increase in referrals for services such as mental health services, housing/shelter, food security, opioid agonist therapy and prescription of safer supply, compared to 44% in cycle 2 and 56% in cycle 3.
Text description
| Response | Cycle 1 (n=27) July to August, 2020 |
Cycle 2 (n=25) April to June, 2021 |
Cycle 3 (n=27) July to September, 2022 |
|---|---|---|---|
| Overdose events | 44% | 84% | 48% |
| EMS calls | n/a | 44% | 26% |
| Number of referrals provided | 22% | 44% | 56% |
Question: Have you noticed any change in the rate of overdoses, EMS services (ambulance/ paramedics), and referrals you have provided at your site? Yes, an increase Notes: Not available (n/a) – Data were not collected in the survey cycle. |
|||
Impact on the mood of clients and staff
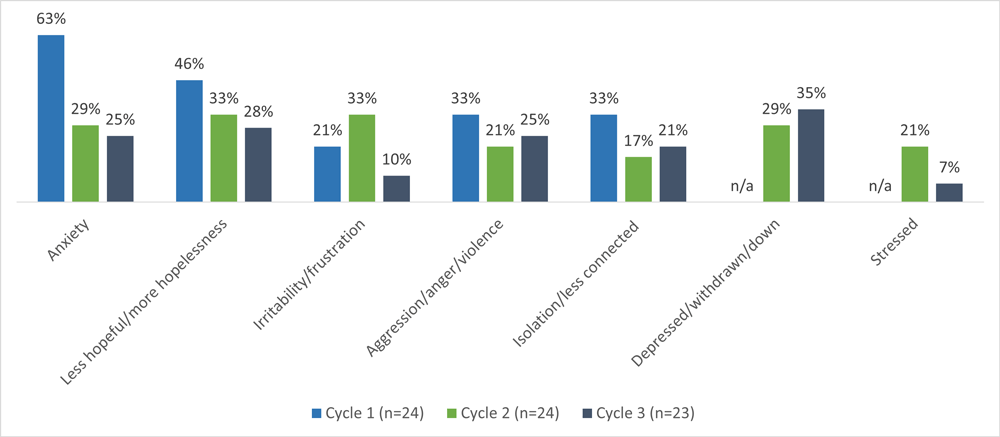
Virtually all sites reported that their clients experienced an overall mood change throughout the survey period: 24 (89%) in cycle 1, 24 (100%) in cycle 2 and 23 (85%) in cycle 3. Of these, anxiety (63%) was particularly prevalent in cycle 1. A sense of hopelessness was a common mood change observed in clients through each cycle (46%, 33% and 28% for cycles 1, 2 and 3, respectively) (Figure 7). During the second and third cycles, the proportion of sites reporting feelings such as depression and social withdrawal among their clients were 29% and 35%, respectively (Figure 7). This question was not included in cycle 1.
Text description
| Response | Cycle 1 (n=24) July to August, 2020 |
Cycle 2 (n=24) April to June, 2021 |
Cycle 3 (n=23) July to September, 2022 |
|---|---|---|---|
| Anxiety | 63% | 29% | 25% |
| Less hopeful/more hopelessness | 46% | 33% | 28% |
| Irritability/frustration | 21% | 33% | 10% |
| Aggression/anger/violence | 33% | 21% | 25% |
| Isolation/less connected | 33% | 17% | 21% |
| Depressed/withdrawn/down | n/a | 29% | 35% |
| Stressed | n/a | 21% | 7% |
Question: Have you noticed a change in the overall mood of your clients? Describe in a few words how your clients' mood has changed. Notes: Not available (n/a) – Data were not collected in the survey cycle. |
|||
Across all cycles, a large majority of respondents reported a noticeable change in the overall mood of their SCS colleagues: 93% in cycle 1, 100% in cycle 2 and 78% in cycle 3. In cycle 1, 32% of sites described increased burnout, fatigue and low morale as the most common mood changes, 28% reported concern for clients and 20% reported fear/anxiety of contracting COVID-19. In the next two cycles, even more sites reported higher levels of burnout among SCS staff (50% in cycle 2 and 57% in cycle 3). In the open-ended responses of cycle 3, sites shared that fatigue stemming from the pandemic and the drug toxicity crisis, in addition to a rise in fatalities among peers and clients, significantly contributed to a shift in the mood of both clients and staff. High turnover rates and navigating infection prevention and control measures were also mentioned as additional factors negatively affecting the mood of SCS staff.
Changes in site staffing and pandemic procedures
Throughout the survey cycle periods, although many sites reported having had the resources needed to provide services under normal circumstances (63% in cycle 1, 58% in cycle 2 and 59% in cycle 3), this nevertheless indicates that a number of sites did encounter resource limitations. Maintaining staffing was a key limitation reported, with staff illness and quarantine being the most common reasons for sites being unable to maintain staffing levels. During cycles 2 and 3, 100% and 96% of the sites, respectively, reported having access to adequate amounts of personal protective equipment, compared to 79% of sites during cycle 1.
Drug checking services are an effective harm reduction tool to better inform people who use drugs on what they are consuming. In cycle 1, 4 respondents out of a total of 18 (22%) indicating that their site was exempted by Health Canada to provide drug checking services, reported having to temporarily suspend the provision of this service, while only 1 respondent in each of cycles 2 and 3 (out of 14 and 16 sites exempted for drug checking, respectively) reported this suspension of drug checking services.
Despite the temporary closure of some sites, reduced hours of operation and disruptions in services such as drug checking, more than 50% of sites in cycles 2 and 3 reported engaging in new activities to reach clients who could not visit the site in person. The most common outreach activities reported by the sites included creating partnerships with community-based organizations, engaging with participants to get recommendations on how to reach other people who use drugs, distributing information about sites in harm reduction kits, and advocating for more resources such as paramedics to assist with overdose responses in areas surrounding the sites.
Limitations
This study has some important limitations:
- Approximately 30% of federally-exempted sites opted not to participate which may affect the generalizability of our findings to all federally exempted SCS
- The survey did not involve following sites over time, which may limit our ability to track changes and trends within individual sites
- The questions in our survey were adapted across different phases of the pandemic, which may affect the comparability of responses across cycles
- Responses reflect the opinions and experiences of SCS staff members chosen to complete the survey and may not reflect the views of other staff members or clients
Conclusion
Supervised consumption sites are an important part of Health Canada's response to the ongoing overdose crisis and provide relevant data on the behaviours of people who use drugs in Canada. The COVID-19 pandemic had a negative impact on SCS services and substance use behaviors and related-harms among people who use drugs, as well as SCS staff to a substantial degree. In spite of these considerable challenges, SCS were able for the most part to remain open and operational, while many SCS engaged in new activities to reach clients.
These findings can help guide our efforts to address the complex challenges of substance use and access to harm reduction services in Canada, particularly over periods of crisis such as pandemics and major public health restrictions. Moreover, these results provide insights that support the Canadian Drugs and Substance Strategy guiding principles around compassionate, equitable, collaborative and comprehensive care.
References
- Footnote 1
-
Government of Canada. (2023). Canadian Drugs and Substance Strategy: Overview. Retrieved from https://www.canada.ca/en/health-canada/services/substance-use/canadian-drugs-substances-strategy.html
- Footnote 2
-
Government of Canada. (2020). Chief Public Health Officer of Canada's Report on the State of Public Health in Canada 2020. Retrieved from https://www.canada.ca/en/public-health/corporate/publications/chief-public-health-officer-reports-state-public-health-canada/from-risk-resilience-equity-approach-covid-19.html#a2.3
- Footnote 3
-
Canadian Centre on Substance Use and Addiction. (2020). Impacts of the COVID-19 Pandemic on Substance Use Treatment Capacity in Canada. Retrieved from https://www.ccsa.ca/sites/default/files/2020-12/CCSA-COVID-19-Impacts-Pandemic-Substance-Use-Treatment-Capacity-Canada-2020-en.pdf