
Traffic-Related Air Pollution: A Systematic Review-Based Human Health Risk Assessment of Mortality
Download the alternative format
(PDF format, 6 MB, 150 pages)
Organization: Health Canada
Published: 2025-03-18
Health Canada – 2025
Acknowledgements
This risk assessment was reviewed by the following external scientific experts:
Dan Crouse, M.Sc., Ph.D. (Health Effects Institute)
Stéphane Buteau, Ph.D. (Université de Montréal)
Table of contents
- List of tables
- List of figures
- List of abbreviations
- Executive summary
- Chapter 1. Introduction
- Chapter 2. Methodology
- Chapter 3. Literature review and evaluation
- Chapter 4. Risk characterization and evaluation of causality
- Chapter 5. Conclusion
- References
- Appendix. Study details by exposure metric
- A.1. Study details for mortality by long-term exposure to NO2
- A.2. Study details for mortality by long-term exposure to NOx
- A.3. Study details for mortality by long-term exposure to NO
- A.4. Study details for mortality by long-term exposure to PM2.5
- A.5. Study details for mortality by long-term exposure to EC, PM2.5 absorbance, and BC
- A.6. Study details for mortality by long-term exposure to PM10 and PMcoarse
- A.7. Study details for mortality by long-term exposure to benzene
- A.8. Study details for mortality by long-term exposure to CO
- A.9. Study details for mortality by long-term exposure to traffic proximity
- A.10. Study details for mortality by long-term exposure to traffic density
List of tables
- Table 1.1. Summary of mortality outcomes associated with TRAP exposure and conclusions from HEI (2010, 2022)
- Table 1.2. Summary of health outcomes and classification of causal associations from Health Canada (2020; 2022c)
- Table 2.1. Conversion factors for units in meta-analysis
- Table 2.2. Weight of evidence for determination of causality (derived from US EPA 2015)
- Table 3.1. Number of articles included in the risk assessment per publication date and exposure metric for each cause of mortality
- Table 3.2. General study characteristics by geographical location and year of publication for long-term exposure to TRAP
- Table 3.3. RoB assessment
List of figures
- Figure 2.1. Study selection process for the scoping review and the systematic review-based assessment on mortality
- Figure 3.1. Association between all-cause mortality and long-term exposure to NO2 in the general population
- Figure 3.2. Association between all-cause mortality and long-term exposure to NOx in the general population
- Figure 3.3. Association between all-cause mortality and long-term exposure to PM2.5 in the general population
- Figure 3.4. Association between all-cause mortality and long-term exposure to EC in the general population
- Figure 3.5. Association between all-cause mortality and long-term exposure to PM10 in the general population
- Figure 3.6. Forest plot of risk estimates for long-term exposure to traffic proximity and all-cause mortality in the general population
- Figure 3.7. Forest plot of risk estimates for long-term exposure to traffic proximity and all-cause mortality in patient populations
- Figure 3.8. Forest plot of risk estimates for long-term exposure to traffic density and all-cause mortality in the general population
- Figure 3.9. Association between CSD mortality and long-term exposure to NO2 in the general population
- Figure 3.10. Association between CHD and long-term exposure to NO2 in the general population
- Figure 3.11. Association between CBVD mortality and long-term exposure to NO2 in the general population
- Figure 3.12. Association between CHD mortality and long-term exposure to NOx in the general population
- Figure 3.13. Association between CBVD mortality and long-term exposure to NOx in the general population
- Figure 3.14. Association between CSD mortality and long-term exposure to PM2.5 in the general population
- Figure 3.15. Association between CHD mortality and long-term exposure to PM2.5 in the general population
- Figure 3.16. Association between CBVD mortality (including stroke) and long-term exposure to PM2.5 in the general population
- Figure 3.17. Association between CHD mortality and long-term exposure to EC in the general population
- Figure 3.18. Association between CBVD mortality (including stroke) and long-term exposure to EC in the general population
- Figure 3.19. Forest plot of risk estimates for long-term exposure to traffic proximity and CSD mortality in the general population
- Figure 3.20. Forest plot of risk estimates for long-term exposure to traffic proximity and CHD and CBVD mortality in the general population
- Figure 3.21. Forest plot of risk estimates for long-term exposure to traffic density and CSD and CHD mortality in the general population
- Figure 3.22. Association between respiratory mortality and long-term exposure to NO2 in the general population
- Figure 3.23. Association between respiratory mortality and long-term exposure to NOx in the general population
- Figure 3.24. Association between respiratory mortality and long-term exposure to PM2.5 in the general population
- Figure 3.25. Forest plot of risk estimates for long-term exposure to traffic proximity and respiratory mortality in the general population
- Figure 3.26. Forest plot of risk estimates for long-term exposure to traffic density and respiratory mortality in the general population
- Figure 4.1. Forest plot of pooled risk estimates for exposure to TRAP and risk of all-cause mortality in the general population; n represents the number of studies included in the meta-analysis, and I2 the heterogeneity
- Figure 4.2. Forest plot of pooled risk estimates for exposure to TRAP and risk of circulatory mortality in the general population; n represents the number of studies included in the meta-analysis, and I2 the heterogeneity
- Figure 4.3. Forest plot of pooled risk estimates for exposure to TRAP and risk of respiratory mortality in the general population; n represents the number of studies included in the meta-analysis, and I2 the heterogeneity
List of abbreviations
- ACE
- acute coronary event
- ACS-CPSII
- American Cancer Society – Cancer Prevention Survey II
- BC
- black carbon
- BS
- black smoke
- CAD
- Canadian dollar
- CanCHEC
- Canadian Census Health and Environment Cohort
- CBVD
- cerebrovascular disease
- CCME
- Canadian Council of Ministers of the Environment
- CHD
- coronary heart disease
- CI
- confidence interval
- CO
- carbon monoxide
- COPD
- chronic obstructive pulmonary disease
- CPD
- cardiopulmonary disease
- CSD
- circulatory system disease
- DE
- diesel exhaust
- EC
- elemental carbon
- ESCAPE
- European Study of Cohorts for Air Pollution Effects
- GIS
- geographic information system
- HEI
- Health Effects Institute
- HF
- heart failure
- HR
- hazard ratio
- HRV
- heart rate variability
- ICD
- International Classification of Disease
- IHD
- ischemic heart disease
- LUR
- land-use regression
- MI
- myocardial infarction
- NA
- not available
- NHS
- Nurses' Health Study
- NLCS
- Netherlands Cohort Study on Diet and Cancer
- NO
- nitric oxide
- NO2
- nitrogen dioxide
- NOx
- nitrogen oxide
- O3
- ozone
- OR(s)
- odds ratio(s)
- PAH
- polycyclic aromatic hydrocarbon
- PM
- particulate matter
- PM2.5
- particulate matter with a diameter less than 2.5 micrometres
- PM2.5 abs
- PM2.5 absorbance
- PM10
- particulate matter with a diameter less than 10 micrometres
- RE
- risk estimate
- REVEAL-HBV
- Risk Evaluation of Viral Load Elevation and Associated Liver Disease / Cancer Hepatitis B Virus
- RoB
- risk of bias
- ROS
- reactive oxygen species
- RR(s)
- relative risk(s)
- SALIA
- Study on the influence of air pollution on lung function, inflammation and ageing
- SES
- socio-economic status
- SIDIAP
- Sistema d'Informació pel Desenvolupament de la Investigació en Atenció Primària
- SR-MA
- systematic review – meta-analysis
- TRAP
- traffic-related air pollution
- UFPs
- ultrafine particles
- UK
- United Kingdom
- USA
- United States of America
- US EPA
- United States Environmental Protection Agency
- VOC
- volatile organic compound
- WHO
- World Health Organization
Executive summary
Traffic-related air pollution (TRAP) is the contribution of on-road vehicles to air pollution. It is a mixture of vehicle exhausts, secondary air pollutants formed in the atmosphere from vehicle emissions, evaporative emissions from vehicles, and other non-combustion emissions (e.g., road dust, brake wear, and tire wear). TRAP is of particular concern in urban areas and near highways, where concentrations are the most elevated. Health Canada has estimated that approximately 4 out of 10 Canadians live within 250 m of a high-traffic roadway and that TRAP is responsible for 1,200 premature deaths per year in Canada, which has an estimated annual monetized value of $9 billion (CAD 2015) for this health outcome alone (Health Canada, 2022a, b).
Health Canada has previously evaluated the association between exposure to TRAP and asthma, allergy, lung function, and selected cancer types (Health Canada, 2020, 2022c). The objective of this risk assessment is to evaluate the association of mortality with TRAP exposure. This will inform and support programs and policies designed to mitigate exposure to, and the health impacts of, TRAP in Canada.
For this risk assessment, the epidemiological literature (from January 1, 2000 to July 11, 2022) regarding the associations between TRAP exposure and mortality was evaluated using systematic review techniques, including meta-analysis. Sixty-four primary articles were included in the risk assessment following a librarian-assisted search and screening process. From this evaluation, a weight of evidence approach was used to determine the causal role of TRAP exposure in mortality from all causes, circulatory mortality and some subtypes, as well as respiratory mortality and some subtypes. This weight of evidence included 1) the quantitative analysis of TRAP pollutant concentrations, 2) the qualitative analysis of TRAP pollutants for which meta-analysis could not be conducted, and 3) the qualitative evidence based on various metrics of proximity to traffic and road networks. In addition, mechanistic evidence gathered from risk assessments of TRAP and relevant primary literature was considered to assess the biological plausibility of these associations and to support the determinations of causality. The biological evidence supports a role for TRAP exposure in cellular and tissue dysfunction, including oxidative stress and inflammation, and enhancement of disease progression, which can ultimately lead to mortality.
Based on the overall weight of evidence, it is concluded that:
- there is sufficient evidence of a causal relationship between long-term exposure to TRAP and all-cause mortality;
- there is sufficient evidence that the relationship between long-term TRAP exposure and mortality from circulatory system disease (CSD) is likely to be causal;
- there is sufficient evidence that the relationship between long-term TRAP exposure and mortality from coronary heart disease (CHD) is likely to be causal;
- the evidence is suggestive of, but not sufficient to infer, a causal relationship between long-term TRAP exposure and mortality from respiratory disease;
- the evidence is suggestive of, but not sufficient to infer, a causal relationship between long-term TRAP exposure and mortality from chronic obstructive pulmonary disease;
- there is inadequate evidence to infer a causal relationship between long-term TRAP exposure and mortality from cerebrovascular disease (CBVD).
The size of the evidence base varied considerably depending on the specific cause of mortality evaluated and this is reflected in the causality conclusions. The causality conclusions for all-cause mortality, CSD mortality, and CHD mortality were each founded on a large evidence base and consistency in the meta-analyses. In contrast, a causal relationship could not be determined for CBVD mortality as a result of the limited evidence base and the lack of consistency in the meta-analyses. Additionally, only a limited number of studies were conducted on other causes of mortality such as heart failure and myocardial infarction, and on populations that may be disproportionately impacted, including patient populations.
Additional research and analyses to address the identified data gaps would be useful to further characterize and understand the role of TRAP exposure in mortality. Identification of populations that may be disproportionately impacted by TRAP exposure could also be used to develop targeted policies or programs that would reduce or mitigate their risks. As such, these conclusions may be updated and expanded in the future to include other specific causes of mortality and/or sub-populations.
Chapter 1. Introduction
1.1 Background
As a source of air pollution, traffic-related air pollution (TRAP) is ubiquitous and predominates in urban areas. TRAP refers to the mixture of vehicle exhausts, secondary air pollutants formed in the atmosphere from vehicle emissions, evaporative emissions from vehicles, and other non-combustion emissions (e.g., road dust, brake wear, and tire wear). Approximately 4 out of 10 Canadians live within 250 m of a high-traffic roadway (e.g., expressways, highways, arterial roads, and major roads), an area that is associated with a higher risk of exposure to TRAP (Health Canada, 2022a). Health Canada has also estimated that 1,200 premature deaths per year are attributable to TRAP based on contributions from on-road vehicle emissions to particulate matter with a median mass aerodynamic diameter less than 2.5 micrometres (PM2.5), nitrogen dioxide (NO2), and ozone (O3) ambient concentrations in Canada (Health Canada, 2022b). This analysis also estimated that TRAP contributed to 2.7 million acute respiratory symptom days, 1.1 million restricted activity days, and 210,000 asthma symptom days per year in Canada. The total annual monetizedFootnote 1 value of this health burden was estimated at $9.5 billion (CAD 2015), with $9 billion associated with premature deaths. As such, the study of the health effects and health burden of TRAP is an active field of research in Canada and around the world.
Exposure to TRAP is particularly challenging to study because of its high spatial and temporal variability, the lack of a unique marker for this source, and differences in vehicle fleet composition over space and time (Khreis and Nieuwenhuijsen, 2017). Two broad categories of surrogates have been widely used in the TRAP literature to assess the contribution of traffic emissions to ambient air pollution: (1) concentrations of individual traffic-related pollutants such as NO2, nitrogen oxide (NOx), PM2.5, PM with a median mass aerodynamic diameter less than 10 micrometres (PM10), and elemental carbon (EC); and (2) measures based on traffic and road network infrastructure such as distance to the nearest road and traffic density (Health Effects Institute [HEI] Panel on the Health Effects of Traffic-Related Air Pollution, 2010, 2022). A brief summary of how these surrogates specifically relate to TRAP follows:
- NOx is primarily emitted from combustion sources and is made up of nitric oxide (NO) and NO2. Vehicle emissions are predominantly NO which is rapidly converted to NO2 (HEI, 2010; Health Canada, 2016a). In urban areas, traffic is often the primary source of NOx in the atmosphere and the main contributor to the variability in NOx levels (Hamra et al., 2015). NO2 is considered to be the most direct measure of TRAP exposure as local traffic sources contribute up to 80% of the ambient NO2 in urban settings (Khreis and Nieuwenhuijsen, 2017). Given the availability of ambient NO2 measurements, it is the most commonly used surrogate to estimate TRAP exposure.
- Particulate matter (PM) is a complex mixture of small liquid and solid particles and is associated with many sources, including vehicle emissions and traffic. PM is categorized based on size: PM10; PMcoarse (PM > 2.5 µm and < 10 µm in aerodynamic diameter); PM2.5; and ultrafine particles (UFPs) (PM ≤ 0.1 µm in aerodynamic diameter). PM10, PMcoarse, and PM2.5 are typically measured based on mass concentration (i.e., µg/m3) while UFPs are commonly reported as a number concentration. With respect to TRAP, PM is an important pollutant in the mixture as local traffic is responsible for 9% to 53% of urban PM10, and 9% to 66% of urban PM2.5 (Khreis and Nieuwenhuijsen, 2017). Additionally, some components of PM are commonly used as surrogates of TRAP, including EC, black carbon (BC), black smoke (BS), and PM2.5 absorbance (PM2.5 abs). These carbonaceous pollutants are indicators of diesel exhaust (DE) emissions, especially in cities, and are defined by the techniques used for measurement rather than fundamental differences in chemical properties (HEI, 2022).
- Anthropogenic carbon monoxide (CO) is primarily formed by the incomplete combustion of carbon-containing fuels. On-road vehicles are a notable contributor to total emissions of CO in Canada with contributions of 28% according to the 2015 Canadian emissions inventory (Health Canada, 2022b).
- Benzene is a naturally occurring constituent of crude oil and is formed through the incomplete combustion of organic materials (Canada, 1993). Concentrations of benzene tend to be higher in vehicles and at urban roadsides, with levels decreasing as distance from the source increases (e.g., levels decreasing from roadside to urban areas to rural areas) (CCME, 2012; HEI, 2010).
- Compared with the use of specific air pollutants, measures based on traffic and road network parameters such as distance to roadway and traffic density, are specific to traffic sources and are simple and cost-effective to obtain (Khreis and Nieuwenhuijsen, 2017). However, these metrics may not account for the volume of traffic or the types of vehicles (e.g., proportion of cars and trucks) making up the traffic, which are key determinants for the relative concentrations of pollutants in the TRAP mixture. These metrics may also represent more than air pollution (e.g., noise) and can vary substantially between studies (e.g., differing distances to roadways; different road classifications), limiting the ability to readily compare and contrast the results.
In 2010, the HEI published a critical review of the literature on emissions, exposure, and health effects of TRAP (HEI, 2010). With respect to health effects, the epidemiological literature was evaluated to infer the presence of causal associations between TRAP exposure and health outcomes. In support of that evaluation, the toxicological literature was reviewed to identify any biological mechanism(s) for the purposes of understanding the role of traffic emissions in the effects observed in the epidemiological studies. The HEI review classified the causal associations between exposure to TRAP and a number of health outcomes. As the result of the growing database on the health effects related to TRAP exposure and the significant advances in regulations and vehicular technology, HEI published a Special Report in 2022 focusing on the systematic review of the epidemiological evidence regarding the associations between long-term exposure to TRAP and selected adverse health outcomes (HEI, 2022). The Panel evaluated the confidence in the quality of the body of evidence and assessed the level of confidence in the presence of an association between long-term TRAP exposure and selected outcomes, rather than assessing causality. A summary of the mortality outcomes evaluated as well as the conclusions from the two HEI reports (2010, 2022) is provided in Table 1.1.
| Mortality outcome | Classification of causal association (HEI, 2010) | Overall confidence in the evidence (HEI, 2022) |
|---|---|---|
| All-cause mortality | Suggestive but not sufficient | High |
| Cardiovascular mortality Circulatory mortality |
Suggestive but not sufficient — |
— High |
| IHD mortality | NA | High |
| Stroke mortality | NA | Low to moderate |
| Respiratory mortality | NA | Moderate |
| COPD mortality | NA | Low |
|
COPD: chronic obstructive pulmonary disease; IHD: ischemic heart disease; NA: not available
|
||
Using an umbrella review-based approach, Health Canada has evaluated the association between TRAP and asthma, allergy, and lung function (Health Canada, 2020), and the association between TRAP and selected cancer types (Health Canada, 2022c). The conclusions of these assessments are provided in Table 1.2. This current report focuses on TRAP exposure and the risk of mortality.
| Health outcome | Classification of causal association |
|---|---|
| Asthma incidence (children) | Causal relationship |
| Asthma prevalence (children) | Causal relationship |
| Asthma incidence (adults) | Inadequate to infer a causal relationship |
| Asthma prevalence (adults) | Suggestive of, but not sufficient to infer, a causal relationship |
| Lung function | Likely to be a causal relationship |
| Allergic sensitization and allergic responses | Suggestive of, but not sufficient to infer, a causal relationship |
| Lung cancer (adults) | Causal relationship |
| Breast cancer (adults) | Suggestive of, but not sufficient to infer, a causal relationship |
| Childhood leukemia | Likely to be a causal relationship |
1.2 Objectives and approach
The objective of this risk assessment is to use systematic review techniques, including meta-analysis, in the evaluation of the epidemiological literature regarding the associations between exposure to TRAP and mortality. A weight of evidence approach was used to determine the causal role of TRAP in mortality, including mortality from all causes, circulatory mortality and some subtypes, and respiratory mortality and some subtypes. Additionally, mechanistic evidence gathered from recent risk assessments of TRAP and recent primary literature was considered to assess the biological plausibility of the associations identified in the review of the epidemiological evidence and to support the determinations of causality.
This risk assessment document is organized as follows:
- Chapter 1 provides background information and describes the objectives and approach;
- Chapter 2 describes the methodology undertaken for this risk assessment in detail;
- Chapter 3 presents the evidence from the included epidemiological primary articles and data analysis;
- Chapter 4 critically evaluates the evidence from Chapter 3 and presents biological evidence to support the findings from the epidemiological studies for determination of causality;
- Chapter 5 presents the conclusions and identifies key uncertainties and gaps.
A supporting document is also available upon request. This document includes the refined search strategy for the literature update, the Risk of Bias (RoB) guidelines used for the assessment of cohort studies, additional quantitative analyses of the epidemiological studies, and tabular summaries of the biological evidence.
Chapter 2. Methodology
In this chapter, the methodology for this risk assessment is described in detail. Section 2.1 summarizes the process used to identify the relevant epidemiological literature relating to TRAP exposure and adverse health outcomes, including the scoping review, the TRAP and traffic exposure framework, and the subsequent literature search updates specific to mortality endpoints considered in this risk assessment. Section 2.2 details the screening, data extraction, RoB assessment, and data analysis. Section 2.3 describes how the biological evidence related to TRAP and the health endpoints of interest were used to assess biological plausibility. Lastly, section 2.4 presents the criteria used to determine the level of causality in the weight of evidence approach.
2.1 Identification of relevant literature
2.1.1 Scoping review
As a first step, a scoping reviewFootnote 2 of the epidemiological literature on the human health effects of TRAP was conducted (Matz et al., 2019). The primary research question for this scoping review was as follows: "What is the current body of scientific literature regarding the association between TRAP exposure and adverse human health endpoints, including effects on various systems (respiratory, circulatory, immunological, reproductive/developmental, and nervous), as well as other health endpoints such as cancer and mortality?". The scoping review included primary epidemiological research articles and some review types (as described below) that were published in peer-reviewed journals and address the scoping review objectives. The observational study designs that were included were case-control, cohort, cross-sectional, panel, ecological, time-series, and case-crossover designs. Biological studies were included only if human subjects were involved in the study (i.e., controlled human exposure studies). Review types included in the scoping review were systematic reviews, meta-analyses, scoping reviews, and critical reviews that included an evaluation of causal association. With respect to TRAP and traffic exposure metrics, the inclusion criteria were adapted from the critical review of TRAP by the HEI (2010). These criteria allowed the reviewers to identify the studies that were TRAP- or traffic-centric from a larger body of general air pollution studies. Exposure metrics meeting the inclusion criteria were distance to roadways; measures of traffic density; modelling (e.g., land-use regression [LUR] and dispersion) that estimated traffic-specific exposure; traffic-based source apportionment; occupations characterized by traffic exposure (e.g., taxi drivers and truckers); subjects in locations characterized by level of traffic exposure (e.g., high- vs. low-exposure sites); and monitoring of TRAP-related pollutants (e.g., NO2 and BC) when the measurements could be reasonably related to traffic sources (e.g., roadway-specific monitoring). To target TRAP-related exposures, studies that characterized exposure based on proximity to gas stations or service stations were excluded from the scoping review.
The literature searches were conducted by a Health Canada librarian in two databases, Ovid Embase and Ovid MEDLINE, and covered the period from January 1, 2000, to April 4, 2018. The detailed search strategy and inclusion criteria are described in Matz et al. (2019). The references identified from the literature search were screened independently by two reviewers for eligibility, first by title and abstract and then by full text; disagreements were resolved by consensus. To generate the evidence map, data extraction included study design parameters and human health outcomes. Descriptive summary tables were developed to provide a high-level summary of the number and types of articles evaluating the different types of health effects and cross-tabulations by study design parameters. The entire review process was managed using DistillerSR (DistillerSR Inc., Ottawa, ON).
From the scoping review, the association between TRAP exposure and mortality was identified as a candidate for a human health risk assessment, as a relatively large body of primary literature was identified in the evidence map. In addition, mortality is the most severe health outcome, so it is important to understand the causes and associated risks for the population.
2.1.2 Framework for traffic and TRAP exposure assessment
HEI published a protocol for a systematic review and meta-analysis of the selected health effects of long-term exposure to TRAP (HEI, 2019) to support its updated assessment of TRAP (2022). This protocol included an updated exposure framework for the evaluation of the health effects of TRAP in epidemiological studies. This framework retained the fundamental concepts of the 2010 HEI report while refining the criteria for identifying studies in which the exposure contrast(s) of TRAP pollutant(s) were primarily due to traffic sources. This refinement aided in the identification and selection of TRAP-specific studies from the larger body of air pollution research (i.e., studies of ambient air pollution considering all sources). Additionally, the HEI protocol indicated that studies of occupational exposure to TRAP (e.g., in taxi drivers and truckers) had not been considered useful in HEI's 2010 report and that these studies would be difficult to combine with ambient exposure studies; and that, as a result, occupational exposures were not considered in scope for HEI's updated report on TRAP (HEI, 2019, 2022).
For the present risk assessment of TRAP exposure and mortality, the primary studies identified from the scoping review and literature search updates were also assessed for inclusion or exclusion based on the updated HEI exposure framework. The details of the exposure assessment framework developed by HEI are described in detail in their TRAP review documents (HEI, 2010, 2019, 2022) and the key concepts are summarized in this section.
For any urban area, the overall air quality is a composition of:
- the regional background air pollutants entering the city;
- the urban background air pollutants dispersed from primary emissions sources, which includes traffic and other sources, and associated secondary air pollutants of these sources; and
- the direct contribution from local traffic sources (e.g., hot spots).
In urban areas, TRAP emissions are greater in areas with higher levels of traffic, and the increased levels of TRAP pollutants in these areas are readily attributed to the roadway network and traffic volumes. For this near-roadway environment, factors such as traffic volume, fleet composition, fuel source, and driving behaviour are the main determinants of traffic emissions. Diurnal patterns of pollutant concentrations are observable corresponding with traffic volumes (e.g., morning and evening peaks associated with rush-hour traffic). Additionally, as the distance from roadways increases, concentrations of the primary TRAP pollutants (e.g., CO, NO, EC, UFPs) decrease. As the primary traffic emissions are dispersed from the near-road environment, they mix with other pollutants and are subject to the same chemical and physical processes as pollutants from other sources, and eventually become a part of the overall urban background.
Given this complexity of urban air quality, three strategies were considered in combination to identify studies in which the exposure contrast(s) of TRAP pollutant(s) were primarily due to traffic sources:
- the pollutant(s) or traffic metric(s);
- the spatial scale; and
- the exposure assessment method and its spatial resolution.
First, as there is no pollutant unique to TRAP, certain pollutants were considered to represent traffic sources better than others (e.g., NO2 vs. polycyclic aromatic hydrocarbons [PAHs]). For pollutants with regional contributions from other sources (e.g., PM2.5, PMcoarse, and PM10), the exposure contrasts within an urban setting (i.e., within-city contrasts) were considered to be largely attributable to traffic sources, as the regional component is largely constant across large areas. Additionally, if the evidence for an association with a health endpoint was for PM but not for other pollutants with greater TRAP specificity, such as NO2 or EC, the confidence in the association with TRAP was lowered. Measures of traffic based on road network infrastructure (e.g., distance to roadway or traffic density) were considered to be highly specific markers of variations in traffic exposure, though indirect measures of TRAP exposure.
Second, the spatial scale of a study is an important element of evaluating the specificity of the exposure contrast(s) for TRAP. Spatial scales were defined as regional (>50 km), urban (5 km to 50 km), neighbourhood (1 km to 5 km), and local (<1 km). At the regional and urban scales, it is difficult to isolate the contrasts in TRAP compared with the contrasts due to all sources. In comparison, exposure contrasts at the neighbourhood and local scales were considered relevant to TRAP. As such, studies that used within-city comparisons were included. However, studies that relied on between-city comparisons and studies that considered very large geographical areas (e.g., nationwide or statewide studies) were excluded due to lack of specificity for TRAP compared with other sources – the exposure contrast being considered mostly attributable to regional differences in all sources, and not attributable to differences in traffic.
Third, the spatial resolution of the exposure assessment method was evaluated to select the studies in which the exposure contrasts were due to within-city variations in traffic at the local to neighbourhood scale. Thus, the required resolution of the air pollutant exposure surface was ≤5 km (i.e., 5 x 5 km grid or smaller) corresponding to the upper range of the neighbourhood scale. For indirect measures of TRAP, based on road network infrastructure, the required resolution was ≤1 km (i.e., ≤1 km from a major roadway or highway), corresponding to the upper range of the local scale. Additionally, the required spatial resolution of the address data (e.g., exact address, detailed postal code, census blocks) of the study participants was determined to be 5 km for air pollutants and 100 m for indirect exposure metrics.
2.1.3 Literature search update and handsearching
For this risk assessment, literature search updates using a refined search strategy with the scope limited to studies of mortality, were conducted by a Health Canada librarian using two databases, Ovid Embase and Ovid Medline, on October 16, 2020 and July 11, 2022. This refined search strategy is provided in section 1 of the supporting documentation. The primary studies identified through the literature search updates were assessed for inclusion using the same criteria and method as employed in the scoping review (Matz et al., 2019) and with the updated HEI exposure framework (HEI, 2019). The screening and selection of relevant primary studies from the literature search updates were managed using DistillerSR (DistillerSR Inc., Ottawa, ON).
To supplement the literature searches, the references from two recent systematic review–meta-analyses (SR-MAs) of long-term exposure to NO2 and mortality (Huangfu and Atkinson, 2020; Stieb et al., 2021) and one recent SR-MA of long-term exposure to PM2.5 (Chen and Hoek, 2020) were handsearched. Two of these three SR-MAs (Huanfu and Atkinson, 2020; Chen and Hoek, 2020) had been conducted to inform air quality guidelines developed by the World Health Organization (WHO, 2021).
2.2 Screening, data extraction, risk of bias assessment, and data analysis
2.2.1 Screening and data extraction
All studies identified from the scoping review (n = 110), literature search updates (n = 902), and handsearching (n = 14) were screened based on the exposure assessment framework identified in section 2.1.2 and for evaluation of mortality as a health endpoint. For mortality, both all-cause and cause-specific mortality were considered. For this assessment, all-cause mortality referred to the total number of deaths (i.e., death from all causes) as well as deaths that were not the result of an accident or suicide (i.e., non-accidental or natural). Lung cancer mortality was excluded as the association between TRAP exposure and lung cancer in adults was previously assessed by Health Canada (2022c) and determined to have a causal relationship. Title and abstract screening and full-text screening were performed in duplicate; any discrepancies were resolved by consensus and/or consultation with a third reviewer. As a result, 64 primary articles were included in the risk assessment. None of the studies evaluating short-term exposure to TRAP pollutants met the criteria for traffic specificity as per the exposure framework described in section 2.1.2 (e.g., exposures were assigned at the city level).
The study selection process is depicted in Figure 2.1.
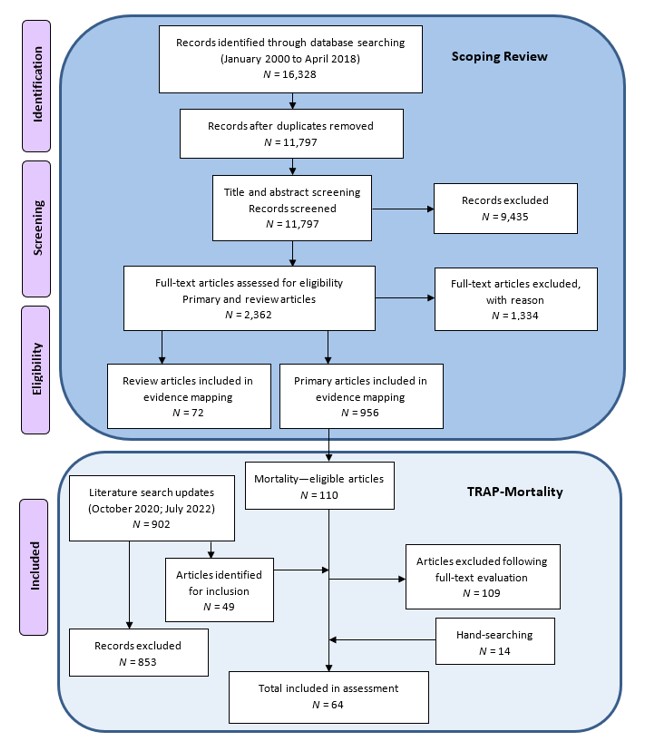
Figure 2.1: Text description
Figure 2.1 depicts the flow of information through the different phases of a systematic review and maps out the number of records identified, included, and/or excluded at each phase. For the scoping review: 16,328 records were identified through database searching, of which 11,797 records remained after the duplicates were removed. 11,797 records were then screened for title and abstract screening, at which point 9,435 records were excluded and the full-text of 2,362 primary and review articles were assessed for eligibility. Of these full-text articles, 1,334 were excluded with reason leaving 956 primary articles and 72 review articles in the evidence map. For the TRAP – Mortality assessment: 110 of the 956 primary articles were eligible for mortality and 49 of the 902 primary articles identified during literature search updates were eligible for inclusion. These literature search updates were conducted in October 2020 and July 2022. Full-text evaluation of the 159 articles resulted in the exclusion of 109 articles and an additional 14 articles were identified from secondary searches, leaving 64 articles in the assessment.
For each study, several domains of data were extracted: bibliographic information; study period and location; study size and demographics; pollutant or exposure metric, exposure assessment method, spatial scale, and exposure distribution; cause of death and International Classification of Disease (ICD) codes (if available); model covariates (including potential confounders); and risk estimates (REs) including 95% confidence intervals (CIs) and pollutant increments. Full cohort analyses were selected over case-cohort analyses. Data extraction was completed by two reviewers with partial duplication of approximately 30% of the included studies; any discrepancies were resolved by consensus and/or consultation with a third reviewer.
2.2.2 Risk of bias assessment
As an important element of the systematic review process, a RoB assessment was conducted to assess the validity of included studies and to establish transparency in the evidence synthesis of results (Higgins et al., 2011). The RoB assessment tool employed for this risk assessment was based on the criteria proposed by Lam et al. (2016) in a systematic review and meta-analysis on air pollution and autism spectrum disorder, and was utilized in Stieb et al. (2021) and Health Canada (2022d) with minor modifications. The definitions and guidelines for the RoB tool for the assessment of cohort studies are presented in section 2 of the supporting documentation. The RoB at the study level was evaluated for the following domains: selection bias and generalizability, exposure assessment with regards to modelling and monitoring, confounding, outcome assessment, completeness of outcome data, selective outcome reporting, conflict of interest, and other sources of bias. With respect to the confounding domain, age, sex, smoking, and individual- or area-level socio-economic status (SES) were chosen a priori as critical potential confounders. The same RoB guidelines were used to evaluate case-control studies, with the exception of the selection bias domain, where professional judgment was used. Two reviewers assessed the RoB for each study and discrepancies between the assessments of the two reviewers were resolved by consensus and consultation with a third reviewer when necessary.
2.2.3 Data analysis
Data analysis was performed separately for each individual exposure-outcome pair (e.g., NO2 – all-cause mortality). The exposure candidates included NO2, NOx, NO, PM2.5, PM10, EC, benzene, CO, traffic proximity, and traffic density. The outcome candidates consisted of all-cause mortality, circulatory mortality and its specific causes, and respiratory mortality and its specific causes. For each exposure-outcome pair, the most appropriate RE (i.e., derived using the most appropriate statistical model and/or identified as the primary findings by the study authors) was selected from each study, and if two or more studies provided REs for the same cohort, only one study from the same cohort was selected for the analysis. The term risk estimate (RE) is used in this report to encompass each risk ratio measure identified by individual studies when referring to them collectively in the meta-analysis.
Statistical significance of the REs was assessed based on the 95% CI. A RE was considered significant if the CI did not include 1.0 (i.e., the null association) and borderline significant if, for REs greater than 1, the lower 95% confidence limit was 0.9 to 1.0, inclusively, or, for REs less than 1, the upper confidence limit was 1.0 to 1.1, inclusively.
Data analysis was undertaken quantitatively where possible, or qualitatively when quantitative analysis could not be performed. Pollutant-outcome pairs with a minimum number of REs (n = 4) were quantitatively analyzed, and pollutant-outcome pairs that did not meet the minimum number of REs were described qualitatively. Traffic and roadway infrastructure metrics (i.e., traffic proximity and traffic density) were analyzed qualitatively, as there is insufficient consistency and standardization in these metrics to allow for quantitative synthesis.
Quantitative analysis: meta-analysis
Meta-analysis was performed for traffic pollutant–outcome pairs that had a minimum of four REs available, similar to other published systematic reviews with meta-analysis in the field (Khreis et al., 2017). Only REs based on single-pollutant models that could be recalculated on a standardized scale (i.e., continuous, but not dichotomous or log-transformed results) were eligible to be included in the meta-analysis. REs from multipollutant models were not retained as the focus was on the TRAP mixture and not its individual components. Of note, for most of the studies, the analyses were conducted using single-pollutant models. Like HEI (2022), Health Canada determined that due to a high degree of heterogeneity between the general population and patient populations, studies from these two population groups would not be pooled together and are presented separately.
Meta-analysis was conducted in R version 4.1.2 (R Core Team, 2021) using the metafor package (Viechtbauer, 2010). For each exposure-outcome pair, the study-specific REs were pooled using the random-effects modelling approach. The random-effects approach was chosen over the fixed-effects approach as it allows generalization of the conclusions beyond the particular set of studies included in the analysis. The models were fitted using Restricted Maximum Likelihood. Hazard ratios (HRs), relative risks (RRs), and odds ratios (ORs) were all eligible for pooling in the same meta-analysis, given that the outcome of interest is common but the effect size is relatively small (Davies et al., 1998), in line with what has been done in previous meta-analyses (Khreis et al., 2017; HEI, 2022). Conversion factors for pollutants to be converted to µg/m3 were based on those presented in HEI (2022) and are outlined in Table 2.1. For all pollutants except EC, the pooled REs were converted to an increment of 10 µg/m3 of pollutant. The pooled REs for EC were converted to an increment of 1 µg/m3 of pollutant. Heterogeneity was evaluated using the I2 statistic, which represents the percent of total variance attributable to heterogeneity. Values of 0%–40%, 30%–60%, 50%–90%, and 75%–100% correspond to the following categories: might not be important, may represent moderate heterogeneity, may represent substantial heterogeneity, and may represent considerable heterogeneity, respectively (Higgins et al., 2022).
| Pollutant | Conversion | FactorFootnote a |
|---|---|---|
| NO2 | ppb to µg/m3 | 1.88 |
| NO | ppb to µg/m3 | 1.23 |
| NOx | ppb to µg/m3 | 1.55 |
| CO | ppm to mg/m3 | 1.15 |
| BC | µg/m3 to µg/m3 EC | 1.25 |
| BS | µg/m3 to µg/m3 EC | 0.11 |
| PM2.5 abs | 10-5/m to µg/m3 EC | 1.1 |
|
||
Meta-analysis can only be performed on unique cohorts (Higgins et al., 2022). Therefore, the rationales for selecting the most appropriate RE for inclusion into the meta-analysis were as follows:
- If two or more studies provided REs on the same cohort, the study with the cohort that had the longest length of follow-up, largest sample size, and greater overall completeness of data necessary to perform a meta-analysis (e.g., RE, 95% CI) was selected for inclusion in the meta-analysis.
- If one study presented REs based on multiple exposure assignments (e.g., at baseline, average, last year in study), the RE calculated using a moving average, with longer ranging averages preferred, was selected. Moving averages are often chosen to stabilize REs (van Donkelaar et al., 2015).
- If one study presented REs based on multiple methods of exposure measurement (e.g., LUR model, dispersion model), REs based on LUR models were chosen over dispersion models for better representation of TRAP (de Hoogh et al., 2014).
Additional analyses were conducted to ascertain the robustness of results of the main meta-analysis, specifically subgroup analyses, sensitivity analyses, and tests for influence and publication bias. First, subgroup analysis was conducted based on exposure assessment methodology (e.g., LUR or dispersion modelling). The LUR model subgroup analysis also included an exposure assessment using hybrid models (i.e., assessment methods that combined more than one modelling technique such as a dispersion model with a chemical transport model) as they were deemed sufficiently similar for the purposes of meta-analysis. Subgroup analysis by geographical region was not conducted due to an insufficient number of Canadian or North American studies. Second, sensitivity analyses were performed to identify whether studies with high RoB were influencing the results; only studies with low or probably low ratings for RoB in the exposure assessment and confounding domains were included. Finally, the influence of individual studies on the overall pooled RE was examined using leave-one-out analysis. Evidence of the potential effect of publication bias was investigated by identifying asymmetry in funnel plots, performing Begg's rank correlation and Egger's regression tests, and using the trim-and-fill method.
2.3 Biological evidence
An evaluation of biological evidence was conducted to assess the biological plausibility of the associations between TRAP exposure and mortality. The studies included in the evaluation of the biological evidence typically consider short-term exposures and are designed to detect subtle changes in biomarkers which are relatable to long-term health effects observed in the epidemiological literature. For efficiency, this evaluation was non-exhaustive and built on existing reviews of TRAP by Health Canada (2020, 2022c) and HEI (2010, 2022). In addition, a search of the primary literature from the past 10 years (i.e., 2013–2022) was conducted to identify the most relevant recent studies. This literature search focused on human and experimental animal studies that evaluated real-world TRAP exposures, as these provide the most direct evidence of the associated biological effects. Controlled exposure studies of vehicle exhaust (i.e., DE) were also included as they were considered to represent an important component of the total TRAP mixture and the study design addressed some of the confounding associated with panel study design (e.g., differences in noise between exposure locations). The literature review centred on health effects associated with the circulatory and respiratory systems, as these were determined to be the most relevant for this risk assessment, and they comprised a majority of the biological evidence literature.
2.4 Determination of causality
The quantitative estimates of TRAP pollutant concentrations were considered to provide the highest level of evidence, while the qualitative analysis of the metrics of traffic and the road network infrastructure and of TRAP pollutants for which quantitative analysis was not undertaken provided support in the evidence base for the determination of causality. The biological evidence was used to support the associations observed in the epidemiological literature as well as to support a determination of causality.
In the weight of evidence approach used in this assessment to determine the causal role of TRAP in the development of specific health effects, consideration is given to a number of criteria, including those of causal inference developed by Bradford Hill (1965). The criteria, widely used in reviews of epidemiological literature and considered collectively in the weight of evidence evaluation, are as follows:
- Biological plausibility: there is a plausible mechanism between the exposure and the effect;
- Temporal sequence: the exposure precedes the health outcome;
- Consistency of the association: the association is reported by different researchers, for different study designs, in different populations, etc.;
- Coherence: evidence from toxicological studies, controlled human exposure studies, and epidemiological studies of various types provides support for the effects observed and potential modes of action;
- Biological gradient: there is evidence of an exposure-response relationship;
- Strength of the association: the greater the magnitude of the RE, the less likely that the relationship is due to uncontrolled residual confounding; and
- Robustness of the association: the associations are robust to model specifications and adjustment for potential confounders such as weather, temporal trends, and co-occurring pollutants.
These criteria are used to inform a conclusion as to whether the relationship between TRAP exposure and a health effect is causal, likely to be causal, suggestive of a causal relationship, inadequate to infer a causal relationship, or not likely to be causal. The definitions of each of these determinations of causality are derived from the United States Environmental Protection Agency (US EPA, 2015) and are provided in Table 2.2. Health Canada has previously used this causality framework in the risk assessments of DE (2016b); NO2 (2016b); gasoline exhaust (2017); TRAP and asthma, allergy, and lung function (Health Canada, 2020); and TRAP and selected cancer types (Health Canada, 2022c).
| Relationship | Description |
|---|---|
| Causal relationship | Evidence is sufficient to conclude that there is a causal relationship with relevant pollutant exposures (e.g., doses or exposures generally within one to two orders of magnitude of recent concentrations). That is, the pollutant has been shown to result in health effects in studies in which chance, confounding, and other biases could be ruled out with reasonable confidence. For example: (1) controlled human exposure studies that demonstrate consistent effects, or (2) observational studies that cannot be explained by plausible alternatives or that are supported by other lines of evidence (e.g., animal studies or mode of action information). Generally, the determination is based on multiple high-quality studies conducted by multiple research groups. |
| Likely to be a causal relationship | Evidence is sufficient to conclude that a causal relationship is likely to exist with relevant pollutant exposures. That is, the pollutant has been shown to result in health effects in studies where results are not explained by chance, confounding, and other biases, but uncertainties remain in the evidence overall. For example: (1) observational studies show association, but co-pollutant exposures are difficult to address and/or other lines of evidence (controlled human exposure, animal, or mode of action information) are limited or inconsistent; or (2) animal toxicological evidence from multiple studies from different laboratories demonstrates effects, but limited or no human data are available. Generally, the determination is based on multiple high-quality studies. |
| Suggestive of, but not sufficient to infer, a causal relationship | Evidence is suggestive of a causal relationship with relevant pollutant exposures but is limited because chance, confounding, and other biases cannot be ruled out. For example: (1) when the body of evidence is relatively small, at least one high-quality epidemiologic study shows an association with a given health outcome and/or at least one high-quality toxicological study shows effects relevant to humans in animal species; or (2) when the body of evidence is relatively large, evidence from studies of varying quality is generally supportive but not entirely consistent, and there may be coherence across lines of evidence (e.g., animal studies or mode of action information) to support the determination. |
| Inadequate to infer a causal relationship | Evidence is inadequate to determine that a causal relationship exists with relevant pollutant exposures. The available studies are of insufficient quantity, quality, consistency, or statistical power to permit a conclusion regarding the presence or absence of an effect. |
| Not likely to be a causal relationship | Evidence indicates there is no causal relationship with relevant pollutant exposures. Several adequate studies, covering the full range of levels of exposure that human beings are known to encounter and considering at-risk populations and life stages, are mutually consistent in not showing an effect at any level of exposure. |
Chapter 3. Literature review and evaluation
3.1 Characteristics of the included articles
Overall, 64 primary articles were included in the risk assessment (details are provided in section 2.2.1); all were long-term exposure studies. Most of these articles used a cohort study design (n = 62); the remaining two articles were case-control studies (Rosenlund et al., 2006, 2009).
The most frequently examined cause of death was all-cause (including natural and non-accidental) followed by circulatory and respiratory (Table 3.1). Other causes of mortality evaluated in more than one article included various types of cancer other than lung cancer (n = 6), a proportion of overall mortality (i.e., overall mortality not including certain specific causes of mortality; n = 6), diabetes (n = 3), digestive system diseases (n = 3), and endocrine disorders (n = 2). Table 3.1 provides a breakdown of the 64 articles included in the analysis with the type of exposure metric measured for each of the causes of mortality reported.
| Cause of mortality | Number of primary articles | Publication date from 2013–2022 | TRAP pollutant | Traffic and road network infrastructure |
|---|---|---|---|---|
| All-cause | 47 | 29 | 31 | 20 |
| Circulatory | 41 | 22 | 27 | 19 |
| Respiratory | 20 | 13 | 15 | 7 |
| Other | 14 | 6 | 7 | 8 |
|
||||
For all-cause, circulatory, and respiratory mortality, the majority of the articles identified were relatively recent with a publication date after 2012. TRAP pollutants were more commonly used than traffic and the road network infrastructure to assess TRAP exposure in articles investigating all-cause, circulatory, and respiratory mortality.
General study characteristics of the 64 primary articles are provided in Table 3.2. An overall synthesis of these articles is presented in this section followed by a more in-depth evaluation by cause of mortality in the subsequent sections of this chapter. Overall, the cohort studies were conducted in Canada (n = 10), the United States of America (USA) (n = 12), Europe (n = 30), Asia (n = 8), and Australia (n = 2), while the case-control studies were conducted in Europe (n = 2). The studies were mostly based on the general population, with the exception of 16 articles that pertained to studies with various patient populations, a combination of general and patient populations, or patient populations for only certain mortality outcomes. Diverse exposure assessment methods were used to assess long-term exposure to TRAP and mortality, including modelling such as LUR (n = 22), dispersion (n = 13), and hybrid or other models (n = 7), as well as traffic and road network infrastructure metrics (n = 32). The most frequently assessed TRAP pollutants were NO2 (n = 28), PM2.5 (n = 20), PM10 (n = 13), and NOx (n = 13). A number of other pollutants attributed to TRAP were also used to evaluate exposure in a limited number of articles; they include BC (n = 6), NO (n = 5), PM2.5 abs (n = 6), PMcoarse (n = 4), CO (n = 2), EC (n = 1), and benzene (n = 1). Although UFPs are a key marker for TRAP, no studies were identified for this pollutant. With regards to traffic and the road network infrastructure, traffic proximity (n = 26) was the most commonly used metric, followed by traffic density (n = 13).
| First author and year | CohortFootnote a (Study period) | Study location | Study population | TRAP pollutant/ metric | Exposure assessment method | Cause of deathFootnote b |
|---|---|---|---|---|---|---|
| Canada | ||||||
| Finkelstein 2004 | (1992–2001) | Hamilton, ON | Patient | Traffic proximity | Traffic and road network infrastructure | A |
| Finkelstein 2005 | (1985–1999) | Hamilton, ON | Patient | Traffic proximity | Traffic and road network infrastructure | C, R |
| Jerrett 2009 | (1992–2002) | Toronto, ON | Patient | NO2 (all), traffic proximity (A, C, O) | LUR model, traffic and road network infrastructure | A, C, R, O |
| Gan 2010 | (1994–2002) | Vancouver, BC | General | Traffic proximity | Traffic and road network infrastructure | C |
| Gan 2011 | (1994–2002) | Vancouver, BC | General | NO, NO2, PM2.5, BC | LUR model | C |
| Chen 2013 | Ontario Tax Cohort (1982–2004) | Toronto, Hamilton, Windsor, ON | General | NO2, traffic proximity | LUR model, traffic and road network infrastructure | C |
| Gan 2013 | (1999–2002) | Metropolitan Vancouver, BC | General | NO, NO2, PM2.5, BC | LUR model | R |
| Villeneuve 2013 | Ontario Tax Cohort (1982–2004) | Toronto, ON | General | NO2, benzene | LUR model | A, C, R, O |
| Crouse 2015 | Canadian Census Health and Environment Cohort (CanCHEC) 1991 (1991–2006) | 10 cities (Edmonton, Hamilton, London, Montreal, Sarnia, Toronto, Vancouver, Victoria, Windsor, Winnipeg) | General | NO2 | LUR model | A, C, R |
| Cakmak 2019 | CanCHEC 1991 (1991–2011) | Canada | General | Traffic proximity | Traffic and road network infrastructure | A, C, R, O |
| USA | ||||||
| Jerrett 2005 | American Cancer Society – Cancer Prevention Survey II (ACS-CPSII) (1982–2002) | Los Angeles, CA | General | PM2.5 | Hybrid or other models | A, C, O |
| Medina-Ramón 2008 | Worcester Heart Failure Study (2000–2005) | Worcester, MA | Patient | Traffic proximity, traffic density | Traffic and road network infrastructure | A |
| Krewski 2009 | ACS-CPSII (1982–2000) | New York City, NY Los Angeles, CA | General | PM2.5 | LUR model | A, C, O |
| von Klot 2009 | Worcester Heart Attack Study (1995–2005) | Worcester metropolitan area, MA | Patient | EC | LUR model | A |
| Hart 2013 | Nurses' Health Study (NHS) (1990–2008) | All 50 states | General | Traffic proximity | Traffic and road network infrastructure | A |
| Wilker 2013 | (1999–2012) | Boston, MA | Patient | Traffic proximity | Traffic and road network infrastructure | A |
| Hart 2014 | NHS (1986–2012) | All 50 states | General | Traffic proximity | Traffic and road network infrastructure | C |
| Blount 2017 | (2000–2012) | California | Patient | Traffic density | Traffic and road network infrastructure | A |
| Alexeeff 2018 | Kaiser Permanente Northern California (2010–2015) | Oakland, CA | General | NO, NO2, BC | Hybrid or other models | C |
| Kulick 2018 | The Northern Manhattan Study (1993–2016) | Northern Manhattan, NY | General | Traffic proximity | Traffic and road network infrastructure | A, C |
| DuPré 2019 | NHS and NHS II (1988–2008) | NHS: 11 states NHSII: 14 states | General | Traffic proximity | Traffic and road network infrastructure | O |
| Villanueva 2021 | (1996–2016) | California | General | Traffic proximity | Traffic and road network infrastructure | O |
| Europe | ||||||
| Hoek 2002 | Netherlands Cohort Study on Diet and Cancer (NLCS) (1986–1994) | Netherlands | General | Traffic proximity | Traffic and road network infrastructure | A, C, O |
| Nafstad 2004 | (1972–1998) | Oslo, Norway | General | NOx | Dispersion model | A, C, R |
| Gehring 2006 | Study on the influence of air pollution on lung function, inflammation and ageing (SALIA) (1985–2003) | North Rhine–Westphalia, Germany | General | Traffic proximity | Traffic and road network infrastructure | A, C, O |
| Rosenlund 2006 | Case-control (1992–1994) | Stockholm, Sweden | General | NO2, PM10, CO | Dispersion model | C |
| Naess 2007 | (1992–1998) | Oslo, Norway | General | NO2 (C, R), PM10 (C, R), PM2.5 (all) | Dispersion model | A, C, R |
| Rosenlund 2008 | (1998– 2005 [A]; 1998–2000 [C]) | Rome, Italy | Patient (A), General (C) | NO2 | LUR model | A, C |
| Beelen 2008 | NLCS-AIR Study (1987–1996) | Netherlands | General | Traffic proximity, traffic density | Traffic and road network infrastructure | A, C, R, O |
| Beelen 2009 | NLCS (1987–1996) | Netherlands | General | Traffic proximity, traffic density | Traffic and road network infrastructure | C |
| Brunekreef 2009 | NLCS-AIR Study (1986–1996; followed from 1987–1996) | Netherlands | General | Traffic proximity, traffic density | Traffic and road network infrastructure | A, C, R, O |
| Rosenlund 2009 | Case-control (1985–1996) | Stockholm, Sweden | General | NO2, PM10, CO | Dispersion model | C |
| Huss 2010 | Swiss National Cohort (2000–2005) | Switzerland | General | Traffic proximity | Traffic and road network infrastructure | C |
| Maheswaran 2010 | (1995–2006) | London, United Kingdom (UK) | Patient | NO2, PM10 | Hybrid or other models | A |
| Nawrot 2011 | (1997–2009) | Leuven, Belgium | Patient | Traffic proximity | Traffic and road network infrastructure | A |
| Cesaroni 2012 | Rome Longitudinal Study (2001–2006) | Rome, Italy | General | NO2 | LUR model | A |
| Raaschou-Nielsen 2012 | Diet, Cancer and Health cohort study (1993–2009) | Copenhagen and Aarhus, Denmark | General | NO2, traffic proximity, traffic density | Hybrid or other models, traffic and road network infrastructure | A, C |
| Carey 2013 | Clinical Practice Research Datalink (2003–2007) | England | General | NO2, PM2.5, PM10 | Dispersion Model | A, C, R |
| Cesaroni 2013 | Rome Longitudinal Study (2001–2010) | Rome, Italy | General | NO2, PM2.5, traffic proximity, traffic density | LUR model, dispersion model, traffic and road network infrastructure | A, C, R |
| Heinrich 2013 | SALIA (1985–2008) | North Rhine-Westphalia, Germany | General | Traffic proximity | Traffic and road network infrastructure | A, C, R |
| Beelen 2014a | European Study of Cohorts for Air Pollution Effects (ESCAPE) (earliest 1985; follow-up range from 6.3 to 18.6 y) | 13 countries | General | NO2, NOx, PM2.5, PM2.5 abs, PM10, PMcoarse, traffic density | LUR model, traffic and road network infrastructure | A |
| Beelen 2014b | ESCAPE (earliest 1985; follow-up range from 6.3 to 18.6 y) | 13 countries | General | NO2, NOx, PM2.5, PM2.5 abs, PM10, PMcoarse, traffic density | LUR model, traffic and road network infrastructure | C |
| Dimakopoulou 2014 | ESCAPE (earliest 1985; follow-up range from 6.3 to 18.6 y) | 11 countries | General | NO2, NOx, PM2.5, PM2.5 abs, PM10, PMcoarse, traffic density | LUR model, traffic and road network infrastructure | R |
| Goeminne 2014 | (2006–2013) | Leuven, Belgium | Patient | Traffic proximity, traffic density | Traffic and road network infrastructure | A |
| Stockfelt 2015 | Multifactor Primary Prevention Study (1973–2007) | Gothenburg, Sweden | General | NOx | Dispersion model | A, C, R |
| Desikan 2016 | (2005–2012) | London, UK | Patient | NO, NO2, NOx, PM2.5, PM10, PMcoarse | Dispersion model | A |
| Tonne 2016 | (2003–2010) | Greater London, UK | Patient | NO2, NOx, PM2.5 (exhaust and non exhaust), PM10 (exhaust and non exhaust), traffic density | Dispersion model, traffic and road network infrastructure | A |
| Badaloni 2017 | Rome Longitudinal Study (2001–2010) | Rome, Italy | General | PM2.5, PM2.5 abs, PM10 | LUR model | A, C |
| Ruttens 2017 | (1987–2013) | 10 countries | Patient | Traffic proximity | Traffic and road network infrastructure | A |
| Nieuwenhuijsen 2018 | Sistema d'Informació pel Desenvolupament de la Investigació en Atenció Primària (SIDIAP) (2010–2014) | Barcelona, Spain | General | NO2, PM2.5, PM2.5 abs, PM10 | LUR model | A |
| Bauleo 2019 | (1996–2013) | Civitavecchia, Italy | General | NOx | Dispersion model | A, C, R, O |
| Andersson 2020 | Primary Prevention Study cohort (1970–2011) | Gothenburg, Sweden | General | NOx | Dispersion model | A, C |
| So 2020 | Danish Nurse Cohort (1993–2013) | Denmark (capital region only) | General | PM2.5 | Hybrid or other models | A |
| Carlsen 2022 | Malmo Diet and Cancer cohort (1991–1996) | Malmo, Sweden | General | NOx, PM2.5, PM10, BC | Dispersion model | C |
| Asia | ||||||
| Yorifuji 2010 | Shizuoka elderly cohort (1999–2006) | Shizuoka, Japan | General | NO2 | LUR model | A, C, R, O |
| Yorifuji 2013 | Shizuoka elderly cohort (1999–2009) | Shizuoka, Japan | General | NO2 | LUR model | A, C, R |
| Barratt 2018 | Hong Kong Elderly Health Services (1998–2011) | Hong Kong, China | General | NO, NO2, PM2.5, BC | LUR model | A, C, R |
| Yang 2018 | Hong Kong Elderly Health Services (2001–2011) | Hong Kong, China | General | NO2, PM2.5, BC | LUR model | A, C, R |
| Cohen 2019 | (2004–2017) | Israel | Patient | NOx | LUR model, hybrid or other models, dispersion model | A, O |
| Cohen 2021 | (1992–2018) | Israel | General and patient | NOx | LUR model | A |
| Pan 2021 | Risk Evaluation of Viral Load Elevation and Associated Liver Disease/ Cancer Hepatitis B Virus (REVEAL-HBV) (2000–2014) | Taipei and Pingtung, Taiwan | General | Traffic density | Traffic and road network infrastructure | C |
| Hadley 2022 | Golestan Cohort Study (2004–2008) | Golestan province, Iran | General | Traffic proximity | Traffic and road network infrastructure | A, C |
| Australia | ||||||
| Dirgawati 2019 | Health in Men Study (1996–2012) | Perth, Western Australia | General | NO2, NOx, PM2.5, PM2.5 abs | LUR model | A, C |
| Hanigan 2019 | 45 and Up Study (2006–2015) | Sydney | General | NO2, PM2.5 | Hybrid or other models | A |
Abbreviations: LUR: land-use regression
|
||||||
As indicated in section 2.2.2 of this risk assessment, an RoB assessment was conducted to evaluate the validity of the included studies and establish transparency in the evidence synthesis of the results. The RoB ratings (where a higher rating signifies a greater risk of a bias in that domain) for the individual studies are summarized in Table 3.3. Outcome assessment and selective outcome reporting were the most uniformly low RoB domains. Risk of conflict of interest was rated low or probably low for all studies. Completeness of outcome data was also rated low or probably low with the exception of three studies with a probably high rating, which was largely attributed to shorter lengths of follow-up (< 4 years or median follow-up of 5.5 years). Similarly, risk of selection bias was mostly rated low or probably low with the exception of four studies that had a probably high rating. This probably high rating was attributed to a low response rate, recruitment, and retention of selective participants (i.e., self-selection for enrolment of a preventive service), loss to follow-up specific to certain demographics (e.g., older, current smokers, diabetes, financially non-capable, and more polluted area), or inconsistencies in the selection process across the cohorts. RoB from exposure assessment was rated probably low for most studies, but four studies rated probably high or high in this domain. The latter was largely attributable to a lack of data on residential mobility or time-activity patterns and issues with spatial and/or temporal accuracy of exposure estimates. Among the domains evaluated, the confounding domain showed the most variability between low, probably low, and probably high RoB. For the confounding domain, a probably high RoB rating was mostly from lack of account for smoking, and one study did not account for SES. One study was rated high for RoB in the confounding domain as it provided only unadjusted REs.
| Reference | Selection bias | Exposure assessment | Confounding | Outcome assessment | Completeness of outcome data | Selective outcome reporting | Conflict of interest | Other |
|---|---|---|---|---|---|---|---|---|
| Hoek et al., 2002 | 2 | 3 | 1 | 1 | 2 | 1 | 1 | 1 |
| Finkelstein et al., 2004 | 2 | 2 | 3 | 1 | 2 | 1 | 2 | 1 |
| Nafstad et al., 2004 | 2 | 1 | 1 | 1 | 1 | 1 | 1 | 1 |
| Finkelstein et al., 2005 | 2 | 4 | 3 | 1 | 2 | 1 | 1 | 1 |
| Jerrett et al., 2005 | 2 | 2 | 1 | 2 | 1 | 1 | 2 | 1 |
| Gehring et al., 2006 | 2 | 2 | 1 | 1 | 1 | 1 | 2 | 1 |
| Rosenlund et al., 2006Footnote a | 2 | 2 | 1 | 1 | 1 | 1 | 2 | 1 |
| Naess et al., 2007 | 1 | 2 | 3 | 1 | 1 | 1 | 1 | 1 |
| Beelen et al., 2008 | 1 | 2 | 2 for full cohort 1 for case-cohort |
1 | 1 | 1 | 1 | 1 |
| Medina-Ramón et al., 2008 | 1 | 2 | 1 | 1 | 1 | 1 | 1 | 1 |
| Rosenlund et al., 2008 | 1 | 2 | 3 | 1 | 1 | 1 | 2 | 1 |
| Beelen et al., 2009 | 2 | 3 | 1 | 1 | 1 | 1 | 1 | 1 |
| Brunekreef et al., 2009 | 2 | 1 | 1 | 1 | 1 | 1 | 1 | 1 |
| Jerrett et al., 2009 | 1 | 1 | 1 | 1 | 2 | 1 | 1 | 1 |
| Krewski et al., 2009 (LA and NYC) | 2 | 2 | 1 | 1 | 2 | 1 | 1 | 1 |
| Rosenlund et al., 2009Footnote a | 2 | 2 | 3 | 1 | 1 | 1 | 2 | 1 |
| von Klot et al., 2009 | 1 | 2 | 2 | 1 | 1 | 1 | 2 | 1 |
| Gan et al., 2010 | 1 | 1 | 3 | 1 | 1 | 1 | 2 | 1 |
| Huss et al., 2010 | 1 | 2 | 3 | 1 | 1 | 1 | 1 | 1 |
| Maheswaran et al., 2010 | 2 | 1 | 1 | 1 | 1 | 1 | 1 | 1 |
| Yorifuji et al., 2010 | 3 | 2 | 1 | 1 | 1 | 1 | 1 | 1 |
| Gan et al., 2011 | 1 | 1 | 3 | 1 | 3 | 1 | 1 | 1 |
| Nawrot et al., 2011 | 2 | 2 | 1 | 2 | 2 | 1 | 1 | 1 |
| Cesaroni et al., 2012 | 1 | 2 | 3 | 1 | 1 | 1 | 1 | 1 |
| Raaschou-Nielsen et al., 2012 | 2 | 1 | 1 | 1 | 1 | 1 | 1 | 1 |
| Carey et al., 2013 | 1 | 2 | 1 | 1 | 1 | 1 | 1 | 1 |
| Cesaroni et al., 2013 | 1 | 1 | 3 | 1 | 1 | 1 | 1 | 1 |
| Chen et al., 2013 | 1 | 1 | 1 | 1 | 1 | 1 | 1 | 1 |
| Gan et al., 2013 | 1 | 1 | 3 | 1 | 2 | 1 | 2 | 1 |
| Hart et al., 2013 | 2 | 2 | 1 | 1 | 1 | 1 | 1 | 1 |
| Heinrich et al., 2013 | 2 | 2 | 1 | 1 | 1 | 1 | 1 | 1 |
| Villeneuve et al., 2013 | 1 | 2 | 3 for NO2 1 for benzene |
1 | 1 | 1 | 1 | 1 |
| Wilker et al., 2013 | 1 | 2 | 1 | 1 | 1 | 1 | 1 | 1 |
| Yorifuji et al., 2013 | 3 | 1 | 1 | 1 | 1 | 1 | 1 | 1 |
| Beelen et al., 2014a | 2 | 2 | 1 | 1 | 2 | 1 | 1 | 1 |
| Beelen et al., 2014b | 2 | 2 | 1 | 1 | 2 | 1 | 1 | 1 |
| Dimakopoulou et al., 2014 | 2 | 2 | 1 | 1 | 1 | 1 | 1 | 1 |
| Goeminne et al., 2014 | 1 | 2 | 1 | 1 | 3 | 1 | 1 | 1 |
| Hart et al., 2014 | 2 | 1 | 1 | 1 | 1 | 1 | 1 | 1 |
| Crouse et al., 2015 | 1 | 1 | 1 | 1 | 1 | 1 | 1 | 1 |
| Stockfelt et al., 2015 | 1 | 1 | 1 | 1 | 1 | 1 | 1 | 1 |
| Desikan et al., 2016 | 1 | 2 | 3 | 1 | 1 | 1 | 1 | 1 |
| Tonne et al., 2016 | 2 | 2 | 1 | 1 | 1 | 1 | 2 | 1 |
| Badaloni et al., 2017 | 1 | 2 | 1 | 1 | 1 | 1 | 2 | 1 |
| Blount et al., 2017 | 1 | 2 | 3 | 1 | 1 | 1 | 1 | 1 |
| Ruttens et al., 2017 | 1 | 2 | 2 | 2 | 3 | 1 | 1 | 2 |
| Alexeeff et al., 2018 | 1 | 2 | 1 | 1 | 2 | 1 | 2 | 1 |
| Barratt et al., 2018 | 3 | 2 | 1 | 1 | 1 | 1 | 1 | 1 |
| Kulick et al., 2018 | 1 | 2 | 1 | 2 | 1 | 1 | 1 | 1 |
| Nieuwenhuisjen et al., 2018 | 1 | 1 | 2 | 1 | 1 | 1 | 1 | 1 |
| Yang et al., 2018 | 2 | 1 | 1 | 1 | 1 | 1 | 1 | 1 |
| Bauleo et al., 2019 | 1 | 3 | 3 | 1 | 1 | 1 | 1 | 1 |
| Cakmak et al., 2019 | 1 | 2 | 1 | 1 | 1 | 1 | 2 | 1 |
| Cohen et al., 2019 | 2 | 2 | 1 | 1 | 2 | 1 | 1 | 1 |
| Dirgawati et al., 2019 | 1 | 1 | 1 | 1 | 1 | 1 | 1 | 1 |
| DuPré et al., 2019 | 2 | 1 | 1 | 2 | 1 | 1 | 1 | 1 |
| Hanigan et al., 2019 | 2 | 2 | 1 | 1 | 1 | 1 | 1 | 1 |
| Andersson et al., 2020 | 2 | 2 | 1 | 1 | 1 | 1 | 1 | 1 |
| Cohen et al., 2021 | 3 | 2 | 1 | 1 | 1 | 1 | 1 | 1 |
| Pan et al., 2021 | 2 | 2 | 3 | 1 | 1 | 1 | 1 | 1 |
| So et al., 2020 (capital region only) | 2 | 1 | 1 | 1 | 1 | 1 | 1 | 1 |
| Villanueva et al., 2021 | 1 | 2 | 4 | 1 | 1 | 1 | 1 | 1 |
| Carlsen et al., 2022 | 1 | 1 | 1 | 1 | 1 | 1 | 1 | 1 |
| Hadley et al., 2022 | 2 | 2 | 1 | 1 | 1 | 1 | 1 | 1 |
|
Legend: 1: low RoB; 2: probably low RoB; 3: probably high RoB; 4: high RoB
|
||||||||
A literature review and evaluation of the studies are presented in the sections below for all-cause mortality, circulatory mortality, and respiratory mortality. The study details, organized by exposure metric, are provided in Appendix A. Additional analyses, including subgroup, sensitivity, leave-one-out, and publication bias analyses, are provided in section 3 of the supporting documentation. Other causes of mortality were not further considered in this risk assessment due to the limited number of studies identified.
3.2 All-cause mortality
All-cause mortality (also referred to as natural cause, non-accidental cause, and total mortality) was evaluated in 47 of the 64 articles evaluating the association between long-term exposure to TRAP and mortality.
3.2.1 Nitrogen oxides (NO, NO2, and NOx)
NO2 is the most frequently measured TRAP pollutant for all-cause mortality with 19 studies while NO was among the least measured TRAP pollutants with only 2 studies. Ten studies used NOx to assess TRAP exposure.
NO2
For studies of NO2, the study details regarding study population, exposure assessment, confounders, and REs are provided in Appendix A.1. Most of the studies were conducted in Europe (n = 10); for North America, 3 studies were conducted in Canada while no studies conducted in the USA were identified in the literature searches. The majority of the studies (n = 14) were drawn from the general population with a cohort size ranging from 11,627 (Dirgawati et al., 2019) to 1,265,058 (Cesaroni et al., 2013). For exposure assessment of the general population cohorts, LUR modelling (n = 11) was the most common method used, followed by hybrid modelling (n = 2) and dispersion modelling (n = 1). Exposures were assigned based on the residential address, postal code, or census tract and the mean (or median) exposures ranged from 5.2 to 104 µg/m3. The lowest exposures were assigned to one of the Swedish cohorts included in the ESCAPE study (Beelen et al., 2014a) while the highest exposures were noted in a study conducted in Hong Kong, China (Yang et al., 2018). All 14 studies accounted for age and sex, as well as individual SES and/or area-level SES; 2 studies did not adjust for smoking (Cesaroni et al., 2012, 2013). Many studies also considered additional confounders, which are listed in Appendix A.1.
The most appropriately adjusted RE identified from each study pertaining to all-cause mortality is also specified in Appendix A.1. For the general population, 12 of the 14 REs were positive, of which 4 were statistically significant and 3 were borderline significant. The forest plot and results of the random-effects meta-analysis for all-cause mortality and NO2 in the general population are presented in Figure 3.1. Ten studies were included in the meta-analysis with REs ranging from 1.00 to 1.12. The pooled RE for the association between NO2 and all-cause mortality was significantly positive with a HR of 1.03 (95% CI: 1.01–1.05) and heterogeneity was substantial (I2 = 89.62%).
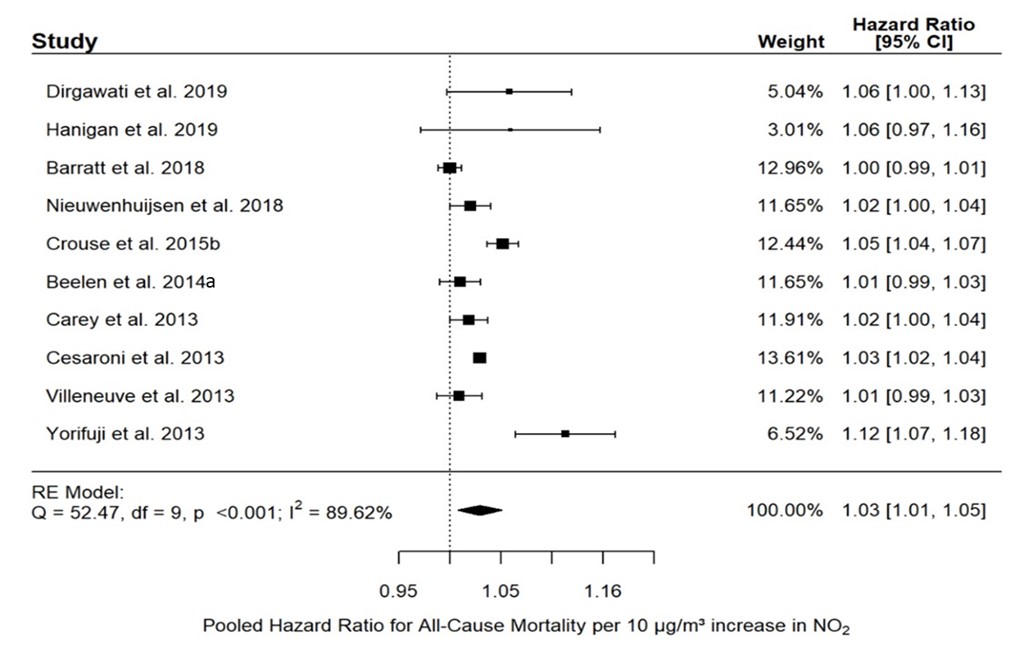
Figure 3.1: Text description
Figure 3.1 depicts a forest plot and results of the random-effects meta-analysis for all-cause mortality and NO2 exposure in the general population. The meta-analysis of ten individual studies resulted in a pooled RE of 1.03 (95% CI: 1.01–1.05) per 10 µg/m3 increase in NO2. The following results were also reported for the statistical model: Q = 52.47, df = 9, p <0.001, and I2 = 89.62%.
The following information on the individual studies included in the pooled analysis is included in this figure:
| Study reference | Weight of study | Hazard ratio | 95% CI |
|---|---|---|---|
| Dirgawati et al., 2019 | 5.04% | 1.06 | 1.00–1.13 |
| Hanigan et al., 2019 | 3.01% | 1.06 | 0.97–1.16 |
| Barratt et al., 2018 | 12.96% | 1.00 | 0.99–1.01 |
| Nieuwenhuijsen et al., 2018 | 11.65% | 1.02 | 1.00–1.04 |
| Crouse et al., 2015 | 12.44% | 1.05 | 1.04–1.07 |
| Beelen et al., 2014a | 11.65% | 1.01 | 0.99–1.03 |
| Carey et al., 2013 | 11.91% | 1.02 | 1.00–1.04 |
| Cesaroni et al., 2013 | 13.61% | 1.03 | 1.02–1.04 |
| Villeneuve et al., 2013 | 11.22% | 1.01 | 0.99–1.03 |
| Yorifuji et al., 2013 | 6.52% | 1.12 | 1.07–1.18 |
Heterogeneity remained substantial (I2 = 91.63%) in subgroup analysis based on the exposure assessment method when it was limited to studies that used LUR / hybrid models (RE: 1.03; 95% CI: 1.01–1.06), which included all but one study from the main analysis. Sensitivity analysis based on RoB was not done for the exposure domain as all the studies included in the meta-analysis scored low or probably low in this domain. When the analysis was limited to only studies that were low and probably low RoB for the confounder domain, the pooled estimate was robust with a RE of 1.04 (95% CI: 1.01–1.07; I2 = 88.60%). Similarly, leave-one-out analysis indicated the results were robust with pooled RE ranging from 1.02 to 1.03. There was evidence of publication bias as demonstrated by the asymmetric distribution of the funnel plot but this was not supported by either Egger's (p = 0.0898) or Begg's test (p = 0.7275). Additionally, the trim-and-fill method suggested that two hypothetical studies are needed to make the funnel plot symmetrical.
As indicated in Appendix A.1, five studies examining the association between all-cause mortality and NO2 focused exclusively on various patient populations, including patients from a respiratory disease clinic in Toronto, Ontario (Jerrett et al., 2009); patients surviving a coronary event in Rome, Italy (Rosenlund et al., 2008); and stroke (Maheswaran et al., 2010; Desikan et al., 2016) and myocardial infarction (MI) (Tonne et al., 2016) patients in London, United Kingdom. The cohort size of these studies ranged from 1,800 (Desikan et al., 2016) to 18,138 (Tonne et al., 2016). The studies used LUR models (n = 2), dispersion modelling (n = 2), and hybrid models (n = 1) to assess exposure and the majority (n = 3) accounted for the key confounders of age, sex, SES, and smoking. As summarized in Appendix A.1, three of the five REs were positive, of which one was statistically significant and one was borderline significant. The REs from the four studies in patients with a cardiovascular etiology (Rosenlund et al., 2008; Maheswaran et al., 2010; Desikan et al., 2016; Tonne et al., 2016) were pooled using a random-effects meta-analysis; the forest plot and results of this meta-analysis are presented in the supporting document. The pooled RE was 1.05 (95% CI: 0.84–1.30) per 10 µg/m3 NO2 exposure and heterogeneity was considered substantial (I2 = 85.17%).
NOx
For NOx, 10 studies conducted in Europe (n = 7), Israel (n = 2), and Australia (n = 1) examined the association between long-term exposure to NOx and all-cause mortality; the study details are depicted in Appendix A.2. Six of these studies were drawn from the general population and these cohorts ranged in size from 6,304 (Andersson et al., 2020) to 367,251 (Beelen et al., 2014a). An additional study with both population-based and patient-based cohorts of CHD also reported a RE for the general population (n = 2,393) (Cohen et al., 2021). For the general population cohorts, the majority of the studies used dispersion modelling (n = 4) followed by LUR modelling (n = 3) to assess NOx exposure and all studies assigned NOx exposure at the residential address; the mean (or median) exposures ranged from 5.80 to 107.3 µg/m3. The lowest exposures were estimated in a study conducted in Civitavecchia, Italy (Bauleo et al., 2019) while the highest exposures were modelled in one of the Italian cohorts included in the ESCAPE study (Beelen et al., 2014a). All studies accounted for the key confounders of age, sex, and SES (individual and/or area-level) and all but one study (Bauleo et al., 2019) also adjusted for smoking. Additional confounders were also considered in these studies.
The most appropriately adjusted RE for NOx and all-cause mortality from each study is summarized in Appendix A.2. Six of the 10 REs were positive, of which 2 were statistically significant and 2 were borderline significant. The forest plot and results of the random-effects meta-analysis for all-cause mortality and NOx in the general population are presented in Figure 3.2. For the general population, six studies, with the exception of Andersson et al. (2020) which provided HRs by exposure quintile, were included in the meta-analysis with REs ranging from 0.98 to 1.08 per 10 µg/m3 NOx. The pooled RE for the association between NOx and all-cause mortality in the general population was positive and borderline significant with a HR of 1.02 (95% CI: 0.99–1.06; I2 = 88.02%). Heterogeneity was substantial and was largely attributed to Nafstad et al. (2004) as no heterogeneity (I2 = 0.00%) was observed when this study was removed from the meta-analysis in the leave-one-out analysis.
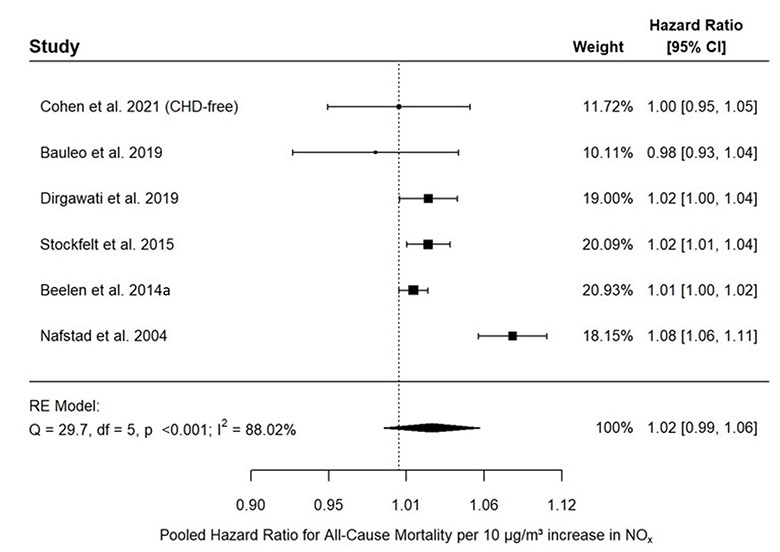
Figure 3.2: Text description
Figure 3.2 depicts a forest plot and results of the random-effects meta-analysis for all-cause mortality and NOx exposure in the general population. The meta-analysis of six individual studies resulted in a pooled RE of 1.02 (95% CI: 0.99–1.06) per 10 µg/m3 increase in NOx. The following results were also reported for the statistical model: Q = 29.7, df = 5, p <0.001, and I2 = 88.02%.
The following information on the individual studies included in the pooled analysis is included in this figure:
| Study reference | Weight of study | Hazard ratio | 95% CI |
|---|---|---|---|
Cohen et al., 2021 (CHD-free) |
11.72% |
1.00 |
0.95–1.05 |
Bauleo et al., 2019 |
10.11% |
0.98 |
0.93–1.04 |
Dirgawati et al., 2019 |
19.00% |
1.02 |
1.00–1.04 |
Stockfelt et al., 2015 |
20.09% |
1.02 |
1.01–1.04 |
Beelen et al., 2014a |
20.93% |
1.01 |
1.00–1.02 |
Nafstad et al., 2004 |
18.15% |
1.08 |
1.06–1.11 |
Subgroup analysis based on exposure assessment methodology indicated associations similar to the main analysis when the analysis was limited to studies using LUR modelling and dispersion modelling with pooled REs of 1.01 (95% CI: 1.00–1.03; I2 = 0.00%) and 1.03 (95% CI: 0.92-1.16; I2 = 91.34%), respectively. No heterogeneity was observed for pooled studies using LUR modelling to assess NOx exposure; in contrast, heterogeneity was greater than the main analysis when limited to studies using dispersion modelling. Sensitivity analysis with respect to RoB showed robust associations between NOx and all-cause mortality when only studies with low or probably low RoB for the exposure domain or confounder domain were included; the same study (Bauleo et al., 2019) was excluded for each of these analyses, resulting in a pooled RE of 1.03 (95% CI: 0.99–1.07; I2 = 89.75%). Leave-one-out analysis indicated that the main analysis was robust as the pooled RE ranged from 1.01 to 1.03 and that Nafstad et al. (2004) was the main source of heterogeneity as omitting this study removed heterogeneity from the main analysis (I2 = 0.00%). Publication bias was assessed but may be of limited use as fewer than 10 studies were included in the meta-analysis. The asymmetric distribution of the funnel plot indicated some evidence of a publication bias but this was not supported by either Egger's (p = 0.4660) or Begg's (p = 1.0000) tests. Additionally, the trim-and-fill method suggested that two hypothetical studies are needed to make the funnel plot symmetrical.
Four studies examined the association between long-term exposure to NOx and all-cause mortality in patient populations (Appendix A.2). Two of these studies were conducted in stroke (Desikan et al., 2016) and MI (Tonne et al., 2016) patients in London, United Kingdom. The other two studies were conducted in Israel in patients undergoing percutaneous coronary interventions (Cohen et al., 2019) and in CHD patient cohorts that were matched to population-based cohorts (Cohen et al., 2021). The cohort size of these studies ranged from 1,800 (Desikan et al., 2016) to 18,138 (Tonne et al., 2016). For the exposure assessment, Desikan et al. (2016) and Tonne et al. (2016) used dispersion modelling and Cohen et al. (2021) used LUR modelling, while Cohen et al. (2019) used three different methods (i.e., dispersion modelling, LUR modelling, and hybrid modelling) to estimate exposure to NOx. All studies accounted for the key confounders of age, sex, SES, and smoking, with the exception of Desikan et al. (2016) whose study did not adjust for smoking. As summarized in Appendix A.2, four of the six REs pertaining to patient populations were positive of which one was statistically significant. As only three of these REs could be pooled, meta-analysis was not conducted.
NO
The literature searches identified two studies evaluating the association between all-cause mortality and NO; both were based on the general population. The study details are depicted in Appendix A.3. One study was conducted on a cohort of 1,800 participants in London, United Kingdom (Desikan et al., 2016) and the other on a cohort of 60,548 participants residing in Hong Kong, China (Barratt et al., 2018). Both studies estimated exposure at the residential address; one used dispersion modelling (mean NO = 34.39 µg/m3; Desikan et al., 2016) while the other used an LUR model (mean NO = 489 µg/m3; Barratt et al., 2018). Both studies also included adjustments for the key confounders of age, sex, and SES, as well as additional confounders, but Desikan et al. (2016) did not adjust for smoking. As indicated in Appendix A.3, neither RE indicated an association.
3.2.2 PM
PM2.5
The literature searches identified 15 studies evaluating the association between all-cause mortality and PM2.5 that was indicative of TRAP exposure (section 2.1.2). Study details including study population, exposure assessment, confounders, and REs are provided in Appendix A.4. A majority of the studies were conducted in Europe (n = 9); no studies conducted in Canada were identified in the literature searches. Most of the studies were conducted in general population cohorts (n = 13) and these cohorts ranged in size from 11,627 (Dirgawati et al., 2019) to 1,265,058 (Cesaroni et al., 2013). For exposure assessment, the most common methods were LUR (n = 7) and dispersion modelling (n = 6), and exposures were assigned based on the residential address, postal code, or census tract. The lowest mean or median exposures were estimated for a study conducted in Australia (4.49 µg/m3; Hanigan et al., 2019) and the highest exposure was estimated for a study conducted in Hong Kong, China (42.4 µg/m3; Barratt et al., 2018). Each of the studies included adjustments for the key confounders of age, sex, and SES, and typically included additional confounders. With respect to smoking, three studies did not include adjustment, either direct or indirect, for individual-level smoking (Naess et al., 2007; Cesaroni et al., 2013; Desikan et al., 2016).
Summarized in Appendix A.4 is the most appropriately adjusted RE identified from each study. For the general population-based studies, 11 of 13 REs were positive, and 7 were statistically significant and 4 were borderline significant. The forest plot and random-effects meta-analysis for all-cause mortality and PM2.5 are presented in Figure 3.3. Ten studies were included in the meta-analysis with standardized REs ranging from 0.90 to 1.63. The pooled RE for the association between PM2.5 and all-cause mortality was significant at 1.06 (95% CI: 1.03–1.08) and the heterogeneity was minimal and likely not of importance (I2 = 0.14%).
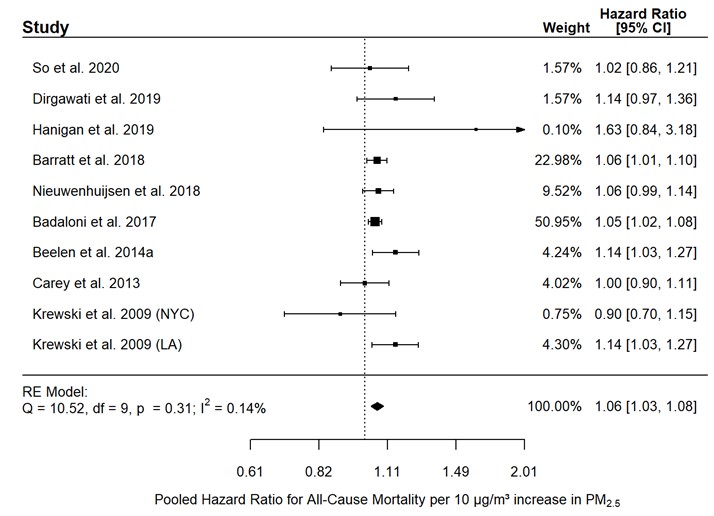
Figure 3.3: Text description
Figure 3.3 depicts a forest plot and results of the random-effects meta-analysis for all-cause mortality and PM2.5 exposure in the general population. The meta-analysis of ten individual studies resulted in a pooled RE of 1.06 (95% CI: 1.03–1.08) per 10 µg/m3 increase in PM2.5. The following results were also reported for the statistical model: Q = 10.52, df = 9, p = 0.31, and I2 = 0.14%.
The following information on the individual studies included in the pooled analysis is included in this figure:
| Study reference | Weight of study | Hazard ratio | 95% CI |
|---|---|---|---|
So et al., 2020 |
1.57% |
1.02 |
0.86–1.21 |
Dirgawati et al., 2019 |
1.57% |
1.14 |
0.97–1.36 |
Hanigan et al., 2019 |
0.10% |
1.63 |
0.84–3.18 |
Barratt et al., 2018 |
22.98% |
1.06 |
1.01–1.10 |
Nieuwenhuijsen et al., 2018 |
9.52% |
1.06 |
0.99–1.14 |
Badaloni et al., 2017 |
50.95% |
1.05 |
1.02–1.08 |
Beelen et al., 2014a |
4.24% |
1.14 |
1.03–1.27 |
Carey et al., 2013 |
4.02% |
1.00 |
0.90–1.11 |
Krewski et al., 2009 (NYC) |
0.75% |
0.90 |
0.70–1.15 |
Krewski et al., 2009 (LA) |
4.30% |
1.14 |
1.03–1.27 |
As the primary studies were evaluated as low or probably low RoB for the exposure and confounding domains, a sensitivity analysis based on RoB was not performed. Subgroup analysis based on the exposure assessment method (i.e., LUR modelling or dispersion modelling) did not indicate a difference from the main analysis. Leave-one-out analysis indicated that the main analysis was robust (pooled RE varied between 1.05 and 1.07) and no one study distorted the overall results. Neither test for publication bias indicated the presence of a bias (Egger's test p = 0.359; Begg's test p = 1.000). Also, trim-and-fill analysis indicated that one hypothetical study would be required to make the funnel plot symmetrical.
Two studies based on patient populations were identified in the literature search. Both studies were conducted in London, United Kingdom; one was based on stroke patients (N = 1800) (Desikan et al., 2016) and one on MI patients (N = 18,138) (Tonne et al., 2016). Both studies used dispersion modelling to estimate PM2.5 exposure. Tonne et al. (2016) considered PM2.5 from traffic exhaust sources and PM2.5 from traffic non-exhaust sources (i.e., brake dust, tire wear, and dust resuspension). Each of the three REs were positive and significant or borderline significant (Appendix A.4), and the REs were similar for both the traffic and non-traffic exhaust sources. Desikan et al. (2016) reported a stronger, though less precise, association for the stroke patients (HR = 1.28, 95% CI: 1.08–1.52, per 1.86 µg/m3) compared with the associations reported in the general population studies.
EC, PM2.5 abs, and BC
Seven studies that evaluated exposure to EC, PM2.5 abs, or BC and the risk of mortality were identified; study details are provided in Appendix A.5. Given the similar interpretation of the TRAP-surrogates, BC and PM2.5 abs were converted to EC-equivalent estimates to support pooling of the studies in a meta-analysis (as described in section 2.2.3). The studies were conducted in Europe (n = 3), Asia (n = 2), the USA (n = 1), and Australia (n = 1); the literature searches did not identify any studies conducted in Canada. Six of the studies considered the general population while one considered a patient population. For the general population studies, study size ranged from 11,627 (Dirgawati et al., 2019) to 1,249,108 (Badaloni et al., 2017). Each of these studies utilized LUR modelling to estimate exposure at residential address, and, based on EC-equivalents, the mean or median exposures ranged from 0.55 (Beelen et al., 2014a) to 16.4 µg/m3 (Barratt et al., 2018). Adjustments for the key confounders of age, sex, and SES were accounted for in each of the studies; a direct or indirect adjustment for smoking was accounted for in each study, except for Badaloni et al. (2017).
Summarized in Appendix A.5 is the most appropriately adjusted RE identified from each study. For the general population, all six REs were positive; two were significant and the other four were borderline significant. The forest plot and random-effects meta-analysis for all-cause mortality and EC are presented in Figure 3.4. Five studies were included in the meta-analysis with standardized REs ranging from 1.00 to 1.11. The pooled RE for the association between EC exposure and all-cause mortality was 1.02 (95% CI: 0.99–1.05) with substantial heterogeneity (I2 = 86.03%).
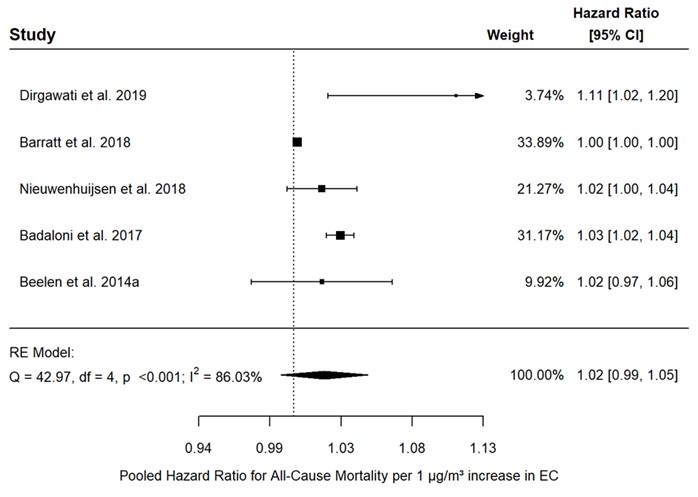
Figure 3.4: Text description
Figure 3.4 depicts a forest plot and results of the random-effects meta-analysis for all-cause mortality and EC exposure in the general population. The meta-analysis of five individual studies resulted in a pooled RE of 1.02 (95% CI: 0.99–1.05) per 1 µg/m3 increase in EC. The following results were also reported for the statistical model: Q = 42.97, df = 4, p <0.001, and I2 = 86.03%.
The following information on the individual studies included in the pooled analysis is included in this figure:
| Study reference | Weight of study | Hazard ratio | 95% CI |
|---|---|---|---|
Dirgawati et al., 2019 |
3.74% |
1.11 |
1.02–1.20 |
Barratt et al., 2018 |
33.89% |
1.00 |
1.00–1.00 |
Nieuwenhuijsen et al., 2018 |
21.27% |
1.02 |
1.00–1.04 |
Badaloni et al., 2017 |
31.17% |
1.03 |
1.02–1.04 |
Beelen et al., 2014a |
9.92% |
1.02 |
0.97–1.06 |
As the primary studies were evaluated as low or probably low RoB for the exposure and confounding domains, a sensitivity analysis based on RoB was not performed. Similarly, as each of the studies used LUR models, no subgroup analysis based on exposure assessment was performed. Leave-one-out analysis indicated the results were robust as the pooled RE ranged from 1.01 to 1.03. There was no indication of publication bias, as trim-and-fill analysis did not identify any missing studies and the tests did not indicate a bias (Egger's test p = 0.1895; Begg's test p = 0.8167).
The one patient population study was conducted in the USA based on adults hospitalized with acute MI (von Klot et al., 2009; summarized in Appendix A.5). The study identified a significant positive association between all-cause mortality and EC exposure, and included adjustments for age, sex, SES, and smoking. As only the single study was identified, a meta-analysis was not conducted.
PM10 and PMcoarse
The literature searches identified seven studies of PM10 and two studies of PMcoarse that evaluated an association with all-cause mortality. As the literature available for PMcoarse is limited, this assessment will focus on the PM10 literature. Study details including study population, exposure assessment, confounders, and REs are provided in Appendix A.6. Each of the studies was conducted in Europe, with four based on the general population and three based on patient populations. No studies conducted in Canada were identified in the literature searches. For the general population studies, the sample sizes were large, ranging from 322,159 (Beelen et al., 2014a) to 1,249,108 (Badaloni et al., 2017). For the exposure assessment, three of the studies employed LUR models and one utilized dispersion modelling, and exposures were assigned based on the residential address, postal code, or census tract. For PM10, the mean exposures ranged from 13.5 to 48.1 µg/m3 (Beelen et al., 2014a). Each of the studies adjusted for the key confounders of age, sex, SES, and directly or indirectly adjusted for smoking, except for Badaloni et al. (2017), which did not account for smoking.
Summarized in Appendix A.6 is the most appropriately adjusted RE identified from each study. For the general population, two of four REs for PM10 were positive and significant or borderline significant, and two indicated a null effect. The forest plot and random-effects meta-analysis for all-cause mortality and PM10 are presented in Figure 3.5. All of the general population studies were included in the meta-analysis; the standardized REs ranged from 1.00 to 1.04 and the pooled RE was 1.02 (95% CI: 1.00–1.03). No heterogeneity (I2 = 0.00%) was noted for this main analysis.

Figure 3.5: Text description
Figure 3.5 depicts a forest plot and results of the random-effects meta-analysis for all-cause mortality and PM10 exposure in the general population. The meta-analysis of four individual studies resulted in a pooled RE of 1.02 (95% CI: 1.00–1.03) per 10 µg/m3 increase in PM10. The following results were also reported for the statistical model: Q = 2.49, df = 3, p = 0.477, and I2 = 0%.
The following information on the individual studies included in the pooled analysis is included in this figure:
| Study reference | Weight of study | Hazard ratio | 95% CI |
|---|---|---|---|
Nieuwenhuijsen et al., 2018 |
7.08% |
1.00 |
0.97–1.03 |
Badaloni et al., 2017 |
88.05% |
1.02 |
1.01–1.03 |
Beelen et al., 2014a |
3.43% |
1.04 |
1.00–1.09 |
Carey et al., 2013 |
1.43% |
1.00 |
0.94–1.07 |
As each of the primary studies in the main analysis was evaluated as low or probably low RoB for the exposure and confounding domains, a sensitivity analysis based on RoB was not performed. Subgroup analysis based on the exposure assessment method (i.e., LUR modelling or dispersion modelling) did not indicate a difference from the main analysis. Leave-one-out analysis did not indicate that any one study was influencing the main analysis (pooled RE = 1.01–1.02). There was no indication of publication bias, as trim-and-fill analysis did not identify any missing studies and the tests did not indicate a bias (Egger's test p = 0.8851; Begg's test p = 1.000).
Three studies based on patient populations were identified. Each of the studies was conducted in London, United Kingdom. Two considered stroke patients and one considered MI patients (summarized in Appendix A.6). The cohorts ranged in size from 1,800 (Desikan et al., 2016) to 18,128 (Tonne et al., 2016). Two of the studies used dispersion modelling and one used hybrid modelling. For PM10, both REs were positive and significant or borderline significant. Tonne et al. (2016) evaluated the association of PM10 from exhaust and non-exhaust sources separately, and both REs were positive and borderline significant. The mean exposures were an order of magnitude smaller in Tonne et al. (2016) compared with the other patient population studies. Due to the small number of studies, a meta-analysis was not conducted.
3.2.3 Other TRAP pollutants: benzene
Only one study that examined the association between long-term exposure to benzene, as a marker of TRAP, and all-cause mortality was identified in the literature searches. This Canadian study by Villeneuve et al. (2013) was conducted in the general population of Ontario, accounted for the key confounders including indirect adjustment for smoking, and reported a significant, positive association (summarized in Appendix A.7).
3.2.4 Traffic and the road network infrastructure
Traffic proximity
Traffic proximity or distance to roadway was the most commonly used metric of traffic and the road network infrastructure that examined the association between traffic and all-cause mortality with 18 studies, of which 11 were conducted on the general population and 7 on various patient populations. The study details regarding study population, exposure assessment, confounders, and REs are provided in Appendix A.9.
For the general population, the majority of the studies were conducted in Europe (n = 7) followed by the USA (n = 2), Canada (n = 1), and Asia (n = 1). They ranged in size from 3,287 (Kulick et al., 2018) to 2,644,370 (Cakmak et al., 2019). All the studies conducted in the USA, Canada, and Asia were based on unique cohorts while those conducted in Europe were based on four cohorts: NLCS-AIR (Hoek et al., 2002; Beelen et al., 2008; Brunekreef et al., 2009); SALIA (Gehring et al., 2006); the Diet, Cancer, and Health Cohort Study (Raaschou-Nielsen et al., 2012); and the Rome Longitudinal Study (Cesaroni et al., 2013). All studies accounted for the key confounders of age, sex, and SES (individual- and/or area-level) and all but two studies (Cesaroni et al., 2013; Cakmak et al., 2019) also adjusted for smoking. Many studies also considered additional confounders. Proximity to traffic was directly measured in a geographic information system (GIS) and was based on the exact residential address for all but two studies. The Canadian study used the residential postal code centroid (Cakmak et al., 2019) while the study conducted in Iran used the geographic centre of each village for rural residents and the location of the primary health centre for urban residents (Hadley et al., 2022). No consistent definitions or categories were used to assess traffic proximity across the studies.
The associations between traffic proximity and risk of all-cause mortality in the general population are summarized in Figure 3.6; only unique cohorts and non-transformed data are included in the forest plot. Two studies considered traffic proximity as a continuous variable. In a Canada-wide study, Cakmak et al. (2019) reported a positive and significant association. In comparison, Kulick et al. (2018) did not observe any association based on log-transformed proximity. When traffic proximity was evaluated as a categorical variable, 10 of the 14 REs were positive, of which one was significant and the remainder were borderline significant. Of the three studies that examined exposure-response relationships, Cesaroni et al. (2013) and Hart et al. (2013) identified an increased risk with increased exposure while Kulick et al. (2018) did not.

Figure 3.6: Text description
Figure 3.6 depicts a forest plot of risk estimates for long-term exposure to traffic proximity and all-cause mortality in the general population. The x-axis representing risk estimates and 95% CI ranges from 0.8 to 1.9. The following information is depicted in this figure:
| Reference | Cohort, study location | Description | Data marker | Risk estimate | 95% CI | Type of risk estimate |
|---|---|---|---|---|---|---|
Cakmak et al., 2019 |
CanCHEC Cohort, Canada |
total length of local roads ≤200 m radius from residence, per 1,108.6 m increase |
A |
1.05 |
1.04–1.05 |
Continuous (per IQR increase) |
Hadley et al., 2022 |
Golestan Cohort Study, Asia |
living ≤100 m from a minor highway or ≤500 m from a major highway |
B |
1.04 |
0.96–1.12 |
Categorical |
Kulick et al., 2018 |
The Northern Manhattan Cohort, USA |
distance to roadway categorized as <100 m (reference group ≥400 m) |
C1 |
0.95 |
0.81–1.13 |
Categorical |
Kulick et al., 2018 |
The Northern Manhattan Cohort, USA |
distance to roadway categorized as 100 to <200 m (reference group ≥400 m) |
C2 |
1.04 |
0.90–1.21 |
Categorical |
Kulick et al., 2018 |
The Northern Manhattan Cohort, USA |
distance to roadway categorized as 200 to <400 m (reference group ≥400 m) |
C3 |
1.04 |
0.91–1.18 |
Categorical |
Cesaroni et al., 2013 |
Rome Longitudinal Study, Europe |
distance to high traffic road with >10,000 vehicles/day: <50 m (reference group ≥250 m) |
D1 |
1.02 |
1.00–1.01 |
Categorical |
Cesaroni et al., 2013 |
Rome Longitudinal Study, Europe |
distance to high traffic road with >10,000 vehicles/day: 50–100 m (reference group ≥250 m) |
D2 |
1.01 |
0.99–1.03 |
Categorical |
Cesaroni et al., 2013 |
Rome Longitudinal Study, Europe |
distance to high traffic road with >10,000 vehicles/day: 100–150 m (reference group ≥250 m) |
D3 |
1.01 |
0.99–1.02 |
Categorical |
Cesaroni et al., 2013 |
Rome Longitudinal Study, Europe |
distance to high traffic road with >10,000 vehicles/day: 150–250 m (reference group ≥250 m) |
D4 |
0.99 |
0.98–1.01 |
Categorical |
Hart et al., 2013 |
NHS, USA |
living ≤50 m from A3 road or ≤150 m from A1 or A2 road; consistently close (reference group: consistently far) |
E1 |
1.05 |
1.00–1.10 |
Categorical |
Hart et al., 2013 |
NHS, USA |
living ≤50 m from A3 road or ≤150 m from A1 or A2 road; moved far to close (reference group: consistently far) |
E2 |
1.17 |
1.00–1.37 |
Categorical |
Hart et al., 2013 |
NHS, USA |
living ≤50 m from A3 road or ≤150 m from A1 or A2 road; moved close to far (reference group: consistently far) |
E3 |
0.98 |
0.94–1.03 |
Categorical |
Heinrich et al., 2013 |
SALIA, Europe |
living ≤50 m from a major roadway (≥10,000 cars/day) |
F |
1.42 |
1.12–1.79 |
Categorical |
Raaschou–Nielsen et al., 2012 |
Diet, Cancer, and Health Cohort Study, Europe |
living ≤50 m from a major roadway (≥10,000 vehicles/day) |
G |
0.94 |
0.85–1.05 |
Categorical |
Brunekreef et al., 2009 |
NLCS-AIR Cohort, Europe |
living near a major road (≤100 m from a freeway or ≤50 m from a major road with 10,000 motor vehicles/day) |
H |
1.05 |
0.97–1.12 |
Categorical |
Traffic proximity and risk of all-cause mortality were also examined in a diverse group of patient populations (summarized in Appendix A.9 and Figure 3.7). These studies were conducted in Canada (n = 2), the USA (n = 2), and Europe (n = 3). With the exception of one study that did not account for any confounders (Finkelstein et al., 2004), all accounted for age and sex, five accounted for SES, and three accounted for smoking; many studies also accounted for additional confounders. For the majority of the studies, exposure was based on the exact residential address while two studies used postal or ZIP code to assign exposure (Finkelstein et al., 2004; Medina-Ramón et al., 2008). For the two studies that assessed exposure as a continuous variable (Medina-Ramón et al., 2008; Ruttens et al., 2017), no association was observed based on distance to a major road or freeway. Ruttens et al. (2017) identified positive associations that were significant or borderline significant when considering the total length of roads in buffer zones, with the greatest risk for a 100-m buffer zone. Goeminne et al. (2014) reported that each 10-fold increase in the distance to a major road resulted in a significant lower risk of dying (HR = 0.28; 95% CI: 0.10–0.77). When traffic proximity was evaluated as a categorical variable, positive associations that were significant or borderline significant were observed, and Wilker et al. (2013) observed an exposure-response relationship.
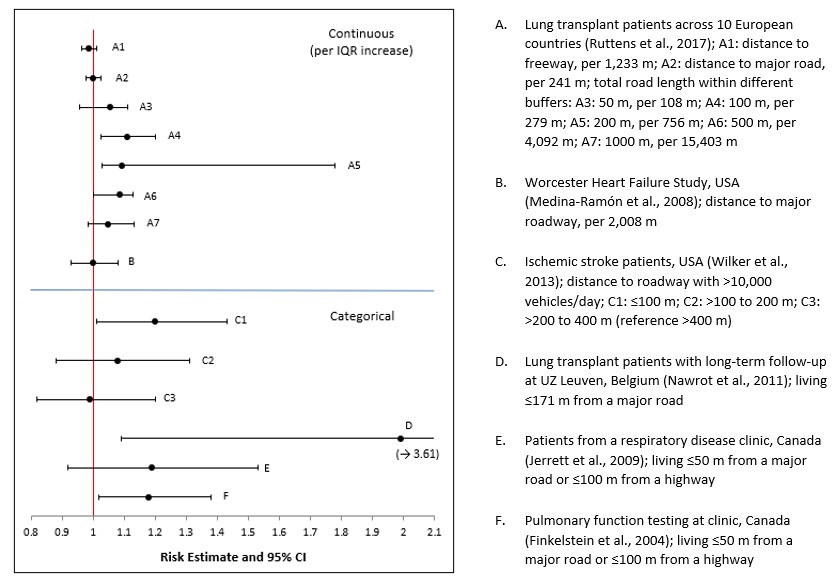
Figure 3.7: Text description
Figure 3.7 depicts a forest plot of risk estimates for long-term exposure to traffic proximity and all-cause mortality in patient populations. The x-axis representing risk estimates and 95% CI ranges from 0.8 to 2.1. The following information is depicted in this figure:
| Reference | Cohort, study location | Description | Data marker | Risk estimate | 95% CI | Type of risk estimate |
|---|---|---|---|---|---|---|
Ruttens et al., 2017 |
Lung transplant patients across 10 European countries |
distance to freeway, per 1,233 m |
A1 |
0.987 |
0.964–1.012 |
Continuous (per IQR increase) |
Ruttens et al., 2017 |
Lung transplant patients across 10 European countries |
distance to major road, per 241 m |
A2 |
1.000 |
0.976–1.024 |
Continuous (per IQR increase) |
Ruttens et al., 2017 |
Lung transplant patients across 10 European countries |
total road length within different buffers: 50 m, per 108 m |
A3 |
1.055 |
0.955–1.112 |
Continuous (per IQR increase) |
Ruttens et al., 2017 |
Lung transplant patients across 10 European countries |
total road length within different buffers: 100 m, per 279 m |
A4 |
1.111 |
1.025–1.202 |
Continuous (per IQR increase) |
Ruttens et al., 2017 |
Lung transplant patients across 10 European countries |
total road length within different buffers: 200 m, per 756 m |
A5 |
1.094 |
1.030–1.779 |
Continuous (per IQR increase) |
Ruttens et al., 2017 |
Lung transplant patients across 10 European countries |
total road length within different buffers: 500 m, per 4,092 m |
A6 |
1.085 |
1.000–1.130 |
Continuous (per IQR increase) |
Ruttens et al., 2017 |
Lung transplant patients across 10 European countries |
total road length within different buffers: 1000 m, per 15,403 m |
A7 |
1.047 |
0.985–1.131 |
Continuous (per IQR increase) |
Medina Ramón et al., 2008 |
Worcester Heart Failure Study, USA |
distance to major roadway, per 2,008 m |
B |
1.00 |
0.93–1.08 |
Continuous (per IQR increase) |
Wilker et al., 2013 |
Ischemic stroke patients, USA |
distance to roadway with >10,000 vehicles/day; ≤100 m (reference >400 m) |
C1 |
1.20 |
1.01–1.43 |
Categorical |
Wilker et al., 2013 |
Ischemic stroke patients, USA |
distance to roadway with >10,000 vehicles/day; >100 to 200 m (reference >400 m) |
C2 |
1.08 |
0.88–1.31 |
Categorical |
Wilker et al., 2013 |
Ischemic stroke patients, USA |
distance to roadway with >10,000 vehicles/day; >200 to 400 m (reference >400 m) |
C3 |
0.99 |
0.82–1.20 |
Categorical |
Nawrot et al., 2011 |
Lung transplant patients with long-term follow-up at UZ Leuven, Belgium |
living ≤171 m from a major road |
D |
1.99 |
1.09–3.61 |
Categorical |
Jerrett et al., 2009 |
Patients from a respiratory disease clinic, Canada |
living ≤50 m from a major road or ≤100 m from a highway |
E |
1.19 |
0.92–1.53 |
Categorical |
Finkelstein et al., 2004 |
Pulmonary function testing at clinic, Canada |
living ≤50 m from a major road or ≤100 m from a highway |
F |
1.18 |
1.02–1.38 |
Categorical |
Traffic density
The literature search identified nine studies that evaluated the association between traffic density and all-cause mortality; five studies were conducted in the general population and four considered patient populations. Study details including study population, exposure assessment, confounders, and REs are provided in Appendix A.10. For the general population studies, each was conducted in Europe and considered risks in the general population. They ranged in size from 52,061 (Raaschou-Nielsen et al., 2012) to 1,265,058 (Cesaroni et al., 2013). Beelen et al. (2008) and Brunekreef et al. (2009) were conducted with the same cohort and had identical results. Each of the studies accounted for the key confounders of age, sex, and SES, and smoking was accounted for in each of the studies, except for Cesaroni et al. (2013).
The REs for traffic density and all-cause mortality in the general population are summarized in a forest plot (Figure 3.8). Both the ESCAPE study (Beelen et al., 2014a) and NLCS-AIR Cohort (Brunekreef et al., 2009) considered traffic as a continuous variable. For both these studies, positive, borderline-significant associations were observed when evaluated based on traffic on the nearest road to the residence and sum of traffic in a 100-m buffer around the residence. Cesaroni et al. (2013) evaluated quintiles of traffic density in a 150-m buffer around the residence and identified a positive association for each quintile and a significant trend increasing risk (p < 0.001).

Figure 3.8: Text description
Figure 3.8 depicts a forest plot of risk estimates for long-term exposure to traffic density and all-cause mortality in the general population. The x-axis representing risk estimates and 95% CI ranges from 0.95 to 1.1. The following information is depicted in this figure:
| Traffic indicator | Reference | Cohort, study location | Description | Data marker | Risk estimate | 95% CI | Type of risk estimate |
|---|---|---|---|---|---|---|---|
Traffic on nearest road |
Beelen et al., 2014a |
ESCAPE, Europe |
traffic on nearest road (per 5,000 vehicles/day) |
A1 |
1.01 |
1.00–1.03 |
Continuous |
Traffic on nearest road |
Brunekreef et al., 2009 |
NLCS-AIR Cohort, Europe |
traffic on nearest road (per 10,000 vehicles/day) |
B1 |
1.03 |
1.00–1.08 |
Continuous |
Sum of traffic in 100-m buffer |
Beelen et al., 2014a |
ESCAPE, Europe |
sum of traffic intensity in 100-m buffer (per 4x 10⁶ vehicle-m/day) |
A2 |
1.01 |
0.98–1.05 |
Continuous |
Sum of traffic in 100-m buffer |
Brunekreef et al., 2009 |
NLCS-AIR Cohort, Europe |
sum of traffic intensity in 100-m buffer (per 335,000 vehicles/day) |
B2 |
1.02 |
0.97–1.07 |
Continuous |
Traffic density in 150-m buffer |
Cesaroni et al., 2013 |
Rome Longitudinal Study, Europe |
traffic density in 150-m buffer (vehicle-m/day); (0.25–1.63) x 106 (reference: <0.25 x 10⁶) |
C1 |
1.02 |
1.00–1.04 |
Categorical |
Traffic density in 150-m buffer |
Cesaroni et al., 2013 |
Rome Longitudinal Study, Europe |
traffic density in 150-m buffer (vehicle-m/day); (1.63–3.23) x 106 (reference: <0.25 x 10⁶) |
C2 |
1.03 |
1.01–1.05 |
Categorical |
Traffic density in 150-m buffer |
Cesaroni et al., 2013 |
Rome Longitudinal Study, Europe |
traffic density in 150-m buffer (vehicle-m/day); (3.23–6.66) x 106 (reference: <0.25 x 10⁶) |
C3 |
1.03 |
1.01–1.05 |
Categorical |
Traffic density in 150-m buffer |
Cesaroni et al., 2013 |
Rome Longitudinal Study, Europe |
traffic density in 150-m buffer (vehicle-m/day); ≥6.66 x 10⁶ (reference: <0.25 x 10⁶) |
C4 |
1.04 |
1.03–1.06 |
Categorical |
Four studies conducted in patient populations were identified in the literature search (summarized in Appendix A.10). These studies, representing a diverse group of patient populations, were conducted in the USA (n = 2) and Europe (n = 2), and had a wide range of study sizes (183 [Goeminne et al., 2014] to 32,875 [Blount et al., 2017]). Each of the studies accounted for key confounders of age, sex, and SES, while smoking was only accounted for in Goeminne et al. (2014) and Tonne et al. (2016). A positive, borderline significant or significant association between traffic density and all-cause mortality was observed in each study.
3.2.5 Summary
The association between TRAP and all-cause mortality has been investigated in 47 cohort studies. The majority of these studies were based on a general population and were conducted in Europe. Over 60% of the studies assessed exposure to TRAP by modelling individual pollutants, while the remainder used metrics of traffic and the road network infrastructure as indirect measures of exposure. Nearly all the studies accounted for the key confounders of age, sex, SES, and smoking and many considered additional confounders. For the pooled analyses based on the general population, a positive association was determined for each of the pollutants evaluated (i.e., NO2, NOx, PM2.5, EC, and PM10), and these associations with pooled REs ranging from 1.02 to 1.06 were significant for NO2 and PM2.5 and borderline significant for NOx, EC, and PM10. While there was no or little heterogeneity for PM2.5 and PM10, heterogeneity was substantial for NO2, NOx, and EC. The results from the pooled analyses was supported by the qualitative analysis of the different metrics for traffic and the road network infrastructure, which also provided some indication of an exposure-response relationship. For patient populations, pooled analysis could only be conducted for NO2, where a positive non-significant association was observed for patients with a cardiovascular etiology. For NO and benzene, the evidence was limited and did not support conducting a pooled analysis.
3.3 Circulatory mortality
Circulatory mortality (also referred to as cardiovascular mortality) was evaluated in 41 of the 64 articles evaluating the association between long-term exposure to TRAP and mortality. An evaluation of the studies examining the effects of long-term exposure to TRAP and circulatory mortality are presented below by TRAP pollutant or metric. These studies evaluated mortality from circulatory system diseases (CSD) as a group, as well as from more specific causes (e.g., CHD [also referred to as IHD], MI, heart failure [HF], and cerebrovascular disease [CBVD], including stroke). In the few instances that studies reported cardiopulmonary or cardiorespiratory mortality without presenting the results for circulatory and respiratory mortality separately, the studies were considered a measure of circulatory mortality, as these causes dominate the combined category (HEI, 2022). Similarly, as stroke is the most common cause of CBVD, and consistent with the approach taken by HEI (2022), CBVD mortality and stroke mortality were pooled for meta-analysis or qualitatively evaluated together in the absence of a quantitative analysis.
3.3.1 Nitrogen oxides (NO, NO2, and NOx)
NO2
For NO2 studies (n = 19), details including study population, exposure assessment, confounders, and REs are provided in Appendix A.1. Most of the studies were conducted in Europe (n = 8), Canada (n = 5), and Asia (n = 4). Two of the studies had a case-control study design (Rosenlund et al., 2006, 2009), and the rest were cohort studies. All but one Canadian study (Jerrett et al., 2009) were drawn from the general population with a study size ranging from 3,210 (Rosenlund et al., 2006) to 1,265,058 (Cesaroni et al., 2013). For exposure assessment of the studies conducted in the general population, LUR modelling (n = 12) was the most common method used, followed by dispersion modelling (n = 4) and hybrid modelling (n = 2). Exposures were assigned based on the residential address, postal code, census block, or at the neighborhood level, with the mean (or median) exposures ranging from 5.2 to 107 µg/m3. The lowest exposures were assigned to one of the Swedish cohorts included in the ESCAPE study (Beelen et al., 2014a) while the highest exposures were noted in a study conducted in Hong Kong, China (Barratt et al., 2018). Studies conducted in the general population each examined one or more endpoints pertaining to circulatory mortality, including mortality from CSD (n = 12), CHD (n = 12), CBVD (n = 10) and stroke (n = 1), MI (n = 3), and dysrhythmias, HF, and cardiac arrest (n = 2). All 18 studies accounted for age and sex, as well as individual SES and/or area-level SES; 5 studies did not adjust for smoking (Naess et al., 2007; Rosenlund et al., 2008, 2009; Gan et al., 2011; Cesaroni et al., 2013). Many studies also considered additional confounders.
The most appropriately adjusted RE identified from each study for each relevant outcome pertaining to circulatory mortality is also specified in Appendix A.1.
For the general population, 12 of the 15 REs pertaining to CSD mortality were positive, of which 7 were statistically significant and 5 were borderline significant. Four of these REs were derived from the same study (Naess et al., 2007) and correspond to different age groups and sex. The forest plot and results of the random-effects meta-analysis for CSD mortality and NO2 are presented in Figure 3.9. Seven studies were included in the meta-analysis for the general population with REs ranging from 0.99 to 1.24. The pooled RE for the association between NO2 and CSD mortality was borderline significant at 1.05 (95% CI: 0.98–1.12) with considerable heterogeneity (I2 = 96.64%).
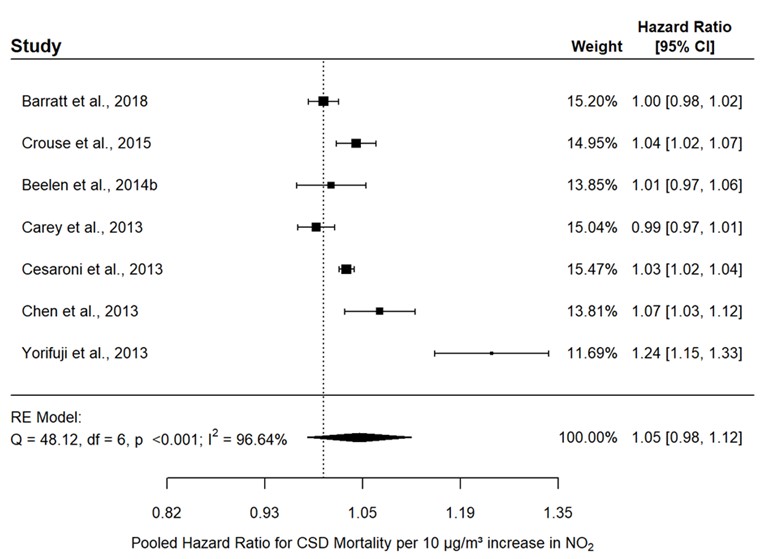
Figure 3.9: Text description
Figure 3.9 depicts a forest plot and results of the random-effects meta-analysis for CSD mortality and NO2 exposure in the general population. The meta-analysis of seven individual studies resulted in a pooled RE of 1.05 (95% CI: 0.98–1.12) per 10 µg/m3 increase in NO2. The following results were also reported for the statistical model: Q = 48.12, df = 6, p <0.001, and I2 = 96.64%.
The following information on the individual studies included in the pooled analysis is included in this figure:
| Study reference | Weight of study | Hazard ratio | 95% CI |
|---|---|---|---|
Barratt et al., 2018 |
15.20% |
1.00 |
0.98–1.02 |
Crouse et al., 2015 |
14.95% |
1.04 |
1.02–1.07 |
Beelen et al., 2014b |
13.85% |
1.01 |
0.97–1.06 |
Carey et al., 2013 |
15.04% |
0.99 |
0.97–1.01 |
Cesaroni et al., 2013 |
15.47% |
1.03 |
1.02–1.04 |
Chen et al., 2013 |
13.81% |
1.07 |
1.03–1.12 |
Yorifuji et al., 2013 |
11.69% |
1.24 |
1.15–1.33 |
Heterogeneity remained considerable (I2 = 96.68%) when the analysis was limited to studies that used LUR models (RE: 1.06; 95% CI: 0.98–1.14), which included all but one study from the main analysis. Sensitivity analysis based on RoB was not done for the exposure domain as all the studies included in the meta-analysis scored low or probably low for this domain, but when the analysis was limited to studies with low and probably low RoB for the confounder domain, the pooled RE was robust (RE: 1.05; 95% CI: 0.97–1.14) and heterogeneity was unchanged (I2 = 95.7%). Leave-one-out analysis indicated that the results were robust for all studies with the exception of Yorifuji et al. (2013); removing the latter resulted in a lower pooled RE of 1.02 and reduced heterogeneity (I2 = 80.96%). Although the Egger's test indicated evidence of a publication bias (p = 0.04067), this was not supported by the Begg's test (p = 0.2389) or the trim-and-fill analysis, which did not identify any missing studies.
For CHD mortality in the general population, 11 of the 12 REs were positive, of which 7 were statistically significant and 2 were borderline significant. The forest plot and results of the random-effects meta-analysis for CHD mortality and NO2 are presented in Figure 3.10. Nine studies were included in the meta-analysis for the general population with REs ranging from 1.00 to 1.29. The pooled RE for the association between NO2 and CHD mortality was significant at 1.05 (1.03–1.07) and the heterogeneity was minimal and likely not of importance (I2 = 0.4%).

Figure 3.10: Text description
Figure 3.10 depicts a forest plot and results of the random-effects meta-analysis for CHD mortality and NO2 exposure in the general population. The meta-analysis of nine individual studies resulted in a pooled RE of 1.05 (95% CI: 1.03–1.07) per 10 µg/m3 increase in NO2. The following results were also reported for the statistical model: Q = 12.5, df = 8, p = 0.13, and I2 = 0.4%.
The following information on the individual studies included in the pooled analysis is included in this figure:
| Study reference | Weight of study | Hazard ratio | 95% CI |
|---|---|---|---|
Alexeeff et al., 2018 |
0.15% |
1.13 |
0.85–1.50 |
Barratt et al., 2018 |
12.20% |
1.03 |
1.00–1.07 |
Crouse et al., 2015 |
9.93% |
1.05 |
1.02–1.09 |
Beelen et al., 2014b |
1.53% |
1.00 |
0.91–1.09 |
Cesaroni et al., 2013 |
58.54% |
1.05 |
1.04–1.07 |
Chen et al., 2013 |
3.55% |
1.09 |
1.02–1.15 |
Yorifuji et al., 2013 |
0.64% |
1.29 |
1.12–1.48 |
Gan et al., 2011 |
7.79% |
1.05 |
1.01–1.09 |
Rosenlund et al., 2008 |
5.67% |
1.07 |
1.02–1.12 |
As all the primary studies included in the meta-analysis used LUR models to assess exposure and were evaluated as low or probably low RoB for the exposure domain, subgroup analysis by exposure assessment and sensitivity analysis based on RoB for the exposure domain were not performed. When analysis was limited to studies with low and probably low RoB for the confounder domain, which excluded three studies (i.e., Rosenlund et al., 2008, Gan et al., 2011, and Cesaroni et al., 2013), the pooled RE was robust (RE: 1.06) but there was increased uncertainty around the RE (95% CI: 0.99–1.14) and heterogeneity became substantial (I2 = 61.9%). Leave-one-out analysis did not indicate that any one study was influencing the main analysis; the association remained significant with a pooled RE = 1.05. Neither test for publication bias suggested the presence of a bias (Egger's test p = 0.2371; Begg's test p = 0.1194) while trim-and-fill analysis indicated that two hypothetical studies would be required to make the funnel plot symmetrical.
For CBVD mortality (including stroke mortality) in the general population, 7 of the 11 REs were positive, of which 1 was statistically significant and 5 were borderline significant. The forest plot and results of the random-effects meta-analysis for CBVD mortality and NO2 are presented in Figure 3.11. Eight studies were included in the meta-analysis for the general population with REs ranging from 0.93 to 1.57. The pooled estimate for the association between NO2 and CBVD mortality was borderline significant at 1.01 (95% CI: 0.98–1.04) and the heterogeneity was minimal and likely not of importance (I2 = 0.56%).
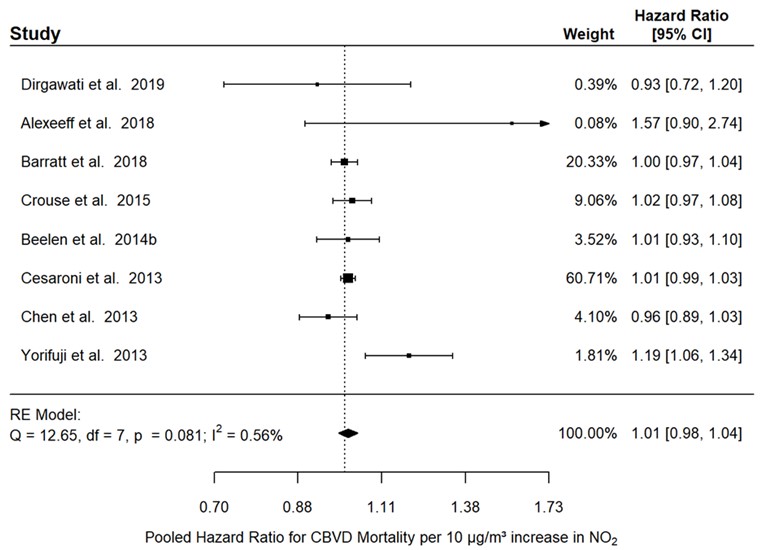
Figure 3.11: Text description
Figure 3.11 depicts a forest plot and results of the random-effects meta-analysis for CBVD mortality and NO2 exposure in the general population. The meta-analysis of eight individual studies resulted in a pooled RE of 1.01 (95% CI: 0.98–1.04) per 10 µg/m3 increase in NO2. The following results were also reported for the statistical model: Q = 12.65, df = 7, p = 0.081, and I2 = 0.56%.
The following information on the individual studies included in the pooled analysis is included in this figure:
| Study reference | Weight of study | Hazard ratio | 95% CI |
|---|---|---|---|
Dirgawati et al., 2019 |
0.39% |
0.93 |
0.72–1.20 |
Alexeeff et al., 2018 |
0.08% |
1.57 |
0.90–2.74 |
Barratt et al., 2018 |
20.33% |
1.00 |
0.97–1.04 |
Crouse et al., 2015 |
9.06% |
1.02 |
0.97–1.08 |
Beelen et al., 2014b |
3.52% |
1.01 |
0.93–1.10 |
Cesaroni et al., 2013 |
60.71% |
1.01 |
0.99–1.03 |
Chen et al., 2013 |
4.10% |
0.96 |
0.89–1.03 |
Yorifuji et al., 2013 |
1.81% |
1.19 |
1.06–1.34 |
Subgroup analysis by exposure assessment and sensitivity analysis based on RoB for the exposure domain were not performed as all the primary studies included in the meta-analysis used LUR modelling or hybrid modelling to assess exposure and were evaluated as low or probably low RoB for the exposure domain. When analysis was limited to studies with low and probably low RoB for the confounder domain, which included all but Cesaroni et al. (2013), the pooled estimate was robust (RE: 1.02) but heterogeneity became moderate (I2 = 50.81%). Limiting the analysis to studies exclusively evaluating CBVD mortality (i.e., excluding stroke mortality) did not change the pooled estimate (RE: 1.01) or the heterogeneity (I2 = 0.54%). Similarly, leave-one-out analysis did not indicate that any one study was influencing the main analysis (pooled RE = 1.01–1.02). Neither test for publication bias indicated the presence of a bias (Egger's test p = 0.4139; Begg's test p = 0.7195) while trim-and-fill analysis indicated that one hypothetical study would be required to make the funnel plot symmetrical.
A limited number of studies (three or less) were identified in the literature searches pertaining to NO2 exposure and MI mortality, dysrhythmias, HF, and cardiac arrest mortality in the general population; these studies reported mostly positive associations that were borderline significant or significant.
The only study to examine the association between long-term exposure to NO2 and circulatory mortality in a patient population was conducted in adult patients from a respiratory disease clinic in Toronto, Ontario, (Jerrett et al., 2009). This Canadian study accounted for the key confounders including smoking, and reported a significant, positive association between NO2 and CSD mortality (summarized in Appendix A.1).
NOx
For NOx, seven studies examined the association between long-term exposure to NOx and circulatory causes of mortality; the study details are depicted in Appendix A.2. They were conducted in Europe (n = 6) and Australia (n = 1) and all were drawn from the general population with cohorts ranging in size from 6,304 (Andersson et al., 2020) to 367,383 (Beelen et al., 2014a). The majority of the studies used dispersion modelling (n = 5) followed by LUR modelling (n = 2) to assess NOx exposure and all studies assigned NOx exposure at the residential address; the mean (or median) exposures ranged from 5.80 to 107.3 µg/m3. The lowest exposures were estimated in a study conducted in Civitavecchia, Italy (Bauleo et al., 2019) while the highest exposures were modelled in one of the Italian cohorts included in the ESCAPE study (Beelen et al., 2014a). The studies each examined one or more endpoints pertaining to circulatory mortality, including mortality from CSD (n = 4), CHD (n = 4), CBVD (n = 4) and stroke (n = 1), MI (n = 3), cardiac diseases (n = 1), and acute coronary events (ACE; n = 1). All studies accounted for the key confounders of age, sex, and SES (individual- and/or area-level) and all but one study (Bauleo et al., 2019) also adjusted for smoking. Additional confounders were also considered in these studies.
The most appropriately adjusted RE from each study for each relevant outcome pertaining to circulatory mortality is summarized in Appendix A.2.
For CHD mortality, three of the four REs were positive of which two were borderline significant and one was statistically significant. The forest plot and results of the random-effects meta-analysis for CHD mortality and NOx in the general population are presented in Figure 3.12. Four studies were included in the meta-analysis with REs ranging from 0.86 to 1.08. The pooled RE for the association between NOx and CHD mortality was borderline significant at 1.02 (95% CI: 0.93–1.13) and the heterogeneity was substantial (I2 = 77.84%).
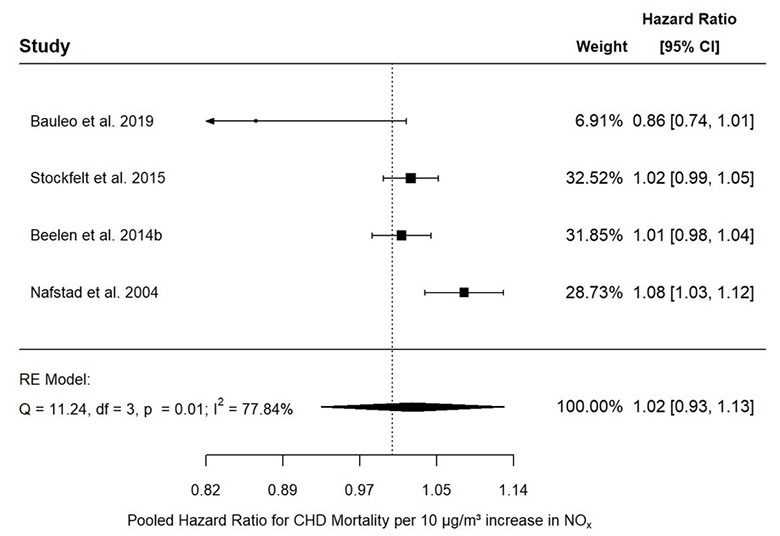
Figure 3.12: Text description
Figure 3.12 depicts a forest plot and results of the random-effects meta-analysis for CHD mortality and NOx exposure in the general population. The meta-analysis of four individual studies resulted in a pooled RE of 1.02 (95% CI: 0.93–1.13) per 10 µg/m3 increase in NOx. The following results were also reported for the statistical model: Q = 11.24, df = 3, p = 0.01, and I2 = 77.84%.
The following information on the individual studies included in the pooled analysis is included in this figure:
| Study reference | Weight of study | Hazard ratio | 95% CI |
|---|---|---|---|
Bauleo et al., 2019 |
6.91% |
0.86 |
0.74–1.01 |
Stockfelt et al., 2015 |
32.52% |
1.02 |
0.99–1.05 |
Beelen et al., 2014b |
31.85% |
1.01 |
0.98–1.04 |
Nafstad et al., 2004 |
28.73% |
1.08 |
1.03–1.12 |
When the analysis was limited to studies using dispersion modelling to assess exposure, which included all but one study from the main analysis, the pooled RE remained positive but was not significant (RE: 1.01; 95% CI: 0.78–1.30) and heterogeneity increased (I2 = 91.16%). In contrast, the pooled RE and heterogeneity from the main analysis were robust to the sensitivity analyses based on RoB (i.e., excluding studies with high or probably high RoB in the exposure assessment or confounder domains). Leave-one-out analysis indicated the following: 1) Nafstad et al. (2004) was the main source of heterogeneity as omitting this study removed heterogeneity from the main analysis, and 2) omitting Beelen et al. (2014b) and Stockfelt et al. (2015) increased the uncertainty around the RE. There was no evidence of a publication bias as demonstrated by the Begg's (p = 0.7500) and Egger's (p = 0.2366) tests and the trim-and-fill method suggested that one hypothetical study was needed to make the funnel plot symmetrical.
For CBVD mortality (including stroke mortality), two of the five REs were positive and borderline significant. The forest plot and results of the random-effects meta-analysis for CBVD mortality and NOx in the general population are presented in Figure 3.13. Five studies were included in the meta-analysis with REs ranging from 0.82 to 1.04. The pooled analysis indicated a null association (RE: 1.00; 95% CI: 0.96–1.05) between NOx and CBVD mortality with minimal heterogeneity that was likely not of importance (I2 = 0.10%).
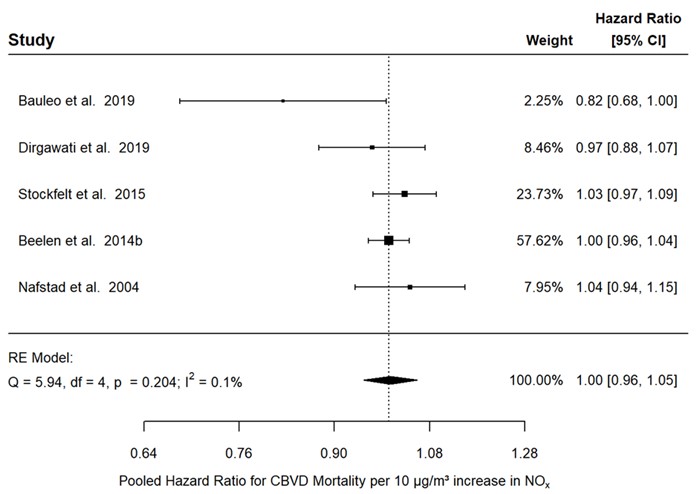
Figure 3.13: Text description
Figure 3.13 depicts a forest plot and results of the random-effects meta-analysis for CBVD mortality and NOx exposure in the general population. The meta-analysis of five individual studies resulted in a pooled RE of 1.00 (95% CI: 0.96–1.05) per 10 µg/m3 increase in NOx. The following results were also reported for the statistical model: Q = 5.94, df = 4, p = 0.204, and I2 = 0.1%.
The following information on the individual studies included in the pooled analysis is included in this figure:
| Study reference | Weight of study | Hazard ratio | 95% CI |
|---|---|---|---|
Bauleo et al., 2019 |
2.25% |
0.82 |
0.68–1.00 |
Dirgawati et al., 2019 |
8.46% |
0.97 |
0.88–1.07 |
Stockfelt et al., 2015 |
23.73% |
1.03 |
0.97–1.09 |
Beelen et al., 2014b |
57.62% |
1.00 |
0.96–1.04 |
Nafstad et al., 2004 |
7.95% |
1.04 |
0.94–1.15 |
Except for the higher heterogeneity observed for dispersion modelling (I2 = 70.44%), subgroup analysis based on the exposure assessment method (i.e., LUR modelling or dispersion modelling) did not indicate a difference from the main analysis. In contrast, sensitivity analyses based on RoB (i.e., excluding studies with high and probably high RoB for the confounder or exposure assessment domain) or limiting the analysis to studies exclusively evaluating CBVD mortality (excluding stroke mortality) resulted in a positive association (RE: 1.01) with borderline significance (95% CI: 0.97–1.04 and 95% CI: 0.94–1.07, respectively). In each of these instances, one study was excluded from the main analysis. Similarly, these studies (Bauleo et al., 2019 and Dirgawati et al., 2019) were the only ones noted to influence the main analysis in the leave-one-out analysis. Neither test for publication bias indicated the presence of a bias (Egger's test p = 0. 2724; Begg's test p = 0.4833) and trim-and-fill analysis suggested that one hypothetical study was needed to make the funnel plot symmetrical.
Four studies examined the association between CSD mortality and NOx, one of which provided the REs by quintile of exposure. No exposure-response relationship could be determined from this study (Andersson et al., 2020). Four of the seven REs reported for CSD mortality were positive, of which three were borderline significant. Similarly, two of the three REs pertaining to MI mortality were positive and borderline significant. One RE was reported for each of cardiac disease mortality and ACE mortality; neither indicated a positive association.
NO
The literature searches identified three studies conducted in Canada, the USA, and Asia evaluating the association between circulatory causes of mortality and NO; the study details are depicted in Appendix A.3. They were drawn from the general population with cohorts ranging in size from 41,869 (Alexeeff et al., 2018) to 406,232 (Gan et al., 2011). NO exposure was assessed by LUR models (n = 2) or hybrid models (n = 1) and were based on the residential address or postal code. Mean NO ranged from 6.0 (Alexeeff et al., 2018) to 489 µg/m3 (Barratt et al., 2018). The studies each examined one or more endpoints pertaining to circulatory mortality, including mortality from CSD (n = 1), CHD (n = 3), and CBVD (n = 2). They included adjustments for the key confounders of age, sex, and SES, as well as additional confounders, but Gan et al. (2011) did not adjust for smoking. Based on a limited number of REs for each mortality endpoint, mixed results were observed for CHD and CBVD and there was no evidence of an association for CSD.
3.3.2 PM
PM2.5
The literature searches identified 12 studies evaluating the association between circulatory causes of mortality and PM2.5 that was indicative of TRAP exposure (section 2.1.2). Study details including study population, exposure assessment, confounders, and REs are provided in Appendix A.4. Half of the studies were conducted in Europe (n = 6), while one study was conducted in Canada. All of the studies were conducted in cohorts drawn from the general population, which ranged in size from 10,126 (Dirgawati et al., 2019) to 1,265,058 (Cesaroni et al., 2013). For exposure assessment, the most commonly employed methods were LUR modelling (n = 7) and dispersion modelling (n = 4); exposures were assigned based on the residential address, postal code, or neighbourhood. The lowest mean or median exposures were estimated for a study conducted in Vancouver, British Columbia (4.08 µg/m3; Gan et al., 2011) and the highest exposure was estimated for a study conducted in Hong Kong, China (42.4 µg/m3; Barratt et al., 2018). Each of the studies included adjustments for the key confounders of age, sex, and SES, and typically included additional confounders. With respect to smoking, three studies did not include adjustment, either direct or indirect, for individual-level smoking (Naess et al., 2007; Gan et al., 2011; Cesaroni et al., 2013).
Most of the studies identified evaluated CSD mortality (n = 9, including 2 cardiopulmonary disease [CPD] mortalities), with fewer studies considering specific causes of mortality including CHD (n = 6), CBVD (n = 3) and stroke (n = 1), and MI (n = 2). Summarized in Appendix A.4 is the most appropriately adjusted RE identified from each study, for each relevant outcome. For CSD mortality, 10 of 13 individual REs were positive, of which 7 were significant and 1 was borderline significant. The forest plot and random-effects meta-analysis for CSD mortality and PM2.5 are presented in Figure 3.14. Six studies were included in the meta-analysis with standardized REs ranging from 0.73 to 1.11. The pooled RE for the association between PM2.5 and CSD mortality was borderline significant at 1.06 (95% CI: 0.96–1.16) and the heterogeneity was moderate (I2 = 40.03%). Leave-one-out analysis indicated that the main analysis was robust (pooled RE varied between 1.02 and 1.08). Neither test for publication bias indicated the presence of a bias (Egger's test p = 0.08633; Begg's test p = 0.2722). Also, trim-and-fill analysis indicated that two hypothetical studies, with positive associations, would be required to make the funnel plot symmetrical.
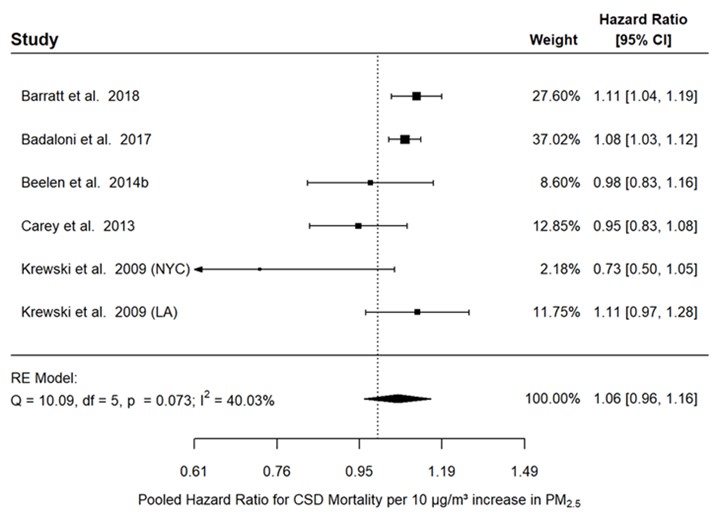
Figure 3.14: Text description
Figure 3.14 depicts a forest plot and results of the random-effects meta-analysis for CSD mortality and PM2.5 exposure in the general population. The meta-analysis of six studies resulted in a pooled RE of 1.06 (95% CI: 0.96–1.16) per 10 µg/m3 increase in PM2.5. The following results were also reported for the statistical model: Q = 10.09, df = 5, p = 0.073, and I2 = 40.03%.
The following information on the individual studies included in the pooled analysis is included in this figure:
| Study reference | Weight of study | Hazard ratio | 95% CI |
|---|---|---|---|
Barratt et al., 2018 |
27.60% |
1.11 |
1.04–1.19 |
Badaloni et al., 2017 |
37.02% |
1.08 |
1.03–1.12 |
Beelen et al., 2014b |
8.60% |
0.98 |
0.83–1.16 |
Carey et al., 2013 |
12.85% |
0.95 |
0.83–1.08 |
Krewski et al., 2009 (NYC) |
2.18% |
0.73 |
0.50–1.05 |
Krewski et al., 2009 (LA) |
11.75% |
1.11 |
0.97–1.28 |
For CHD mortality, seven of the eight individual REs were positive, of which four were significant and three were borderline significant (summarized in Appendix A.4). The forest plot and random-effects meta-analysis for CHD mortality and PM2.5 are presented in Figure 3.15. Six studies were included in the meta-analysis with standardized REs ranging from 0.96 to 1.59. The pooled RE for the association between PM2.5 and CHD mortality was significant at 1.10 (95% CI: 1.01–1.20) and the heterogeneity was minimal and likely not of importance (I2 = 0.09%). Leave-one-out analysis indicated that the main analysis was robust (pooled RE varied between 1.09 and 1.15). There was no indication of publication bias, as trim-and-fill analysis did not identify any missing studies and the tests did not indicate a bias (Egger's test p = 0. 3804; Begg's test p = 1). From the sensitivity analyses, when the analysis was limited to studies with low and probably low RoB for the confounder domain, the pooled RE was robust (RE: 1.13) but there was increased uncertainty around the RE (95% CI: 0.97–1.32) and heterogeneity became moderate (I2 = 39.74%).
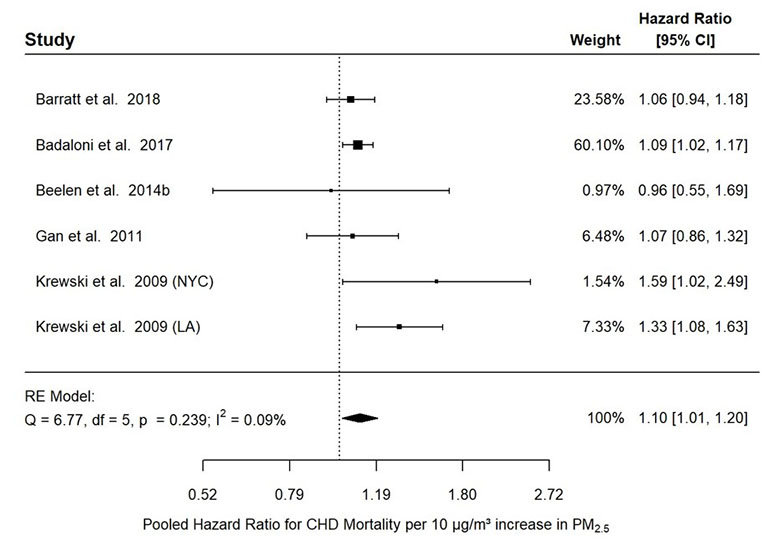
Figure 3.15: Text description
Figure 3.15 depicts a forest plot and results of the random-effects meta-analysis for CHD mortality and PM2.5 exposure in the general population. The meta-analysis of six individual studies resulted in a pooled RE of 1.10 (95% CI: 1.01–1.20) per 10 µg/m3 increase in PM2.5. The following results were also reported for the statistical model: Q = 6.77, df = 5, p = 0.239, and I2 = 0.09%.
The following information on the individual studies included in the pooled analysis is included in this figure:
| Study reference | Weight of study | Hazard ratio | 95% CI |
|---|---|---|---|
Barratt et al., 2018 |
23.58% |
1.06 |
0.94–1.18 |
Badaloni et al., 2017 |
60.10% |
1.09 |
1.02–1.17 |
Beelen et al., 2014b |
0.97% |
0.96 |
0.55–1.69 |
Gan et al., 2011 |
6.48% |
1.07 |
0.86–1.32 |
Krewski et al., 2009 (NYC) |
1.54% |
1.59 |
1.02–2.49 |
Krewski et al., 2009 (LA) |
7.33% |
1.33 |
1.08–1.63 |
For CBVD mortality including stroke, three of the four studies reported a positive association, of which two were significant or borderline significant (summarized in Appendix A.4). The forest plot and random effects meta-analysis for this association are presented in Figure 3.16. For the four studies included in the meta-analysis, the standardized REs ranged from 0.50 to 1.46. The pooled RE for the association between PM2.5 and CBVD mortality (including stroke) was borderline significant at 1.08 (95% CI: 1.00–1.18) and the heterogeneity was minimal and likely not of importance (I2 = 0.03%). Leave-one-out analysis indicated that two studies (Barratt et al., 2018 and Cesaroni et al., 2013) had the greatest impact on the pooled estimate, as no association was observed when one of these studies was removed. Neither test for publication bias indicated the presence of a bias (Egger's test p = 0.7566; Begg's test p = 1.000). Also, trim-and-fill analysis indicated that no hypothetical studies would be required to make the funnel plot symmetrical. The sensitivity analyses, excluding the study that only considered stroke (Dirgawati et al., 2019), resulted in a significant association (RE: 1.08 [95% CI: 1.02–1.15]), and analysis based on RoB (i.e., excluding studies with probably high or high RoB in the confounder domain) resulted in a null association (RE: 0.99 [95% CI: 0.30–3.31]).

Figure 3.16: Text description
Figure 3.16 depicts a forest plot and results of the random-effects meta-analysis for CBVD mortality and PM2.5 exposure in the general population. The meta-analysis of four individual studies resulted in a pooled RE of 1.08 (95% CI: 1.00–1.18) per 10 µg/m3 increase in PM2.5. The following results were also reported for the statistical model: Q = 5.17, df = 3, p = 0.16, and I2 = 0.03%.
The following information on the individual studies included in the pooled analysis is included in this figure:
| Study reference | Weight of study | Hazard ratio | 95% CI |
|---|---|---|---|
Dirgawati et al., 2019 |
0.29% |
0.50 |
0.24–1.05 |
Barratt et al., 2018 |
10.61% |
1.11 |
0.99–1.25 |
Beelen et al., 2014b |
0.35% |
1.46 |
0.75–2.84 |
Cesaroni et al., 2013 |
88.76% |
1.08 |
1.04–1.13 |
For the other specific causes of circulatory mortality, there was an insufficient number of studies to conduct a meta-analysis. A borderline significant increase was reported for CHD mortality and no associations were observed for MI mortality.
EC, PM2.5 abs, and BC
Eight studies were identified that evaluated exposure to PM2.5 abs or BC and circulatory mortality. Study details are provided in Appendix A.5. Studies were conducted in Canada (n = 1), Europe (n = 3), Asia (n = 2), the USA (n = 1), and Australia (n = 1). Each of the studies considered general population cohorts and study sizes ranged from 10,126 (Dirgawati et al., 2019) to 1,249,108 (Badaloni et al., 2017). Exposure assessment methods included LUR modelling (n = 6), hybrid modelling (n = 1), and dispersion modelling (n = 1) and exposure was assigned based on the residential address or postal code. Based on EC-equivalents, the mean or median exposures ranged from 0.45 (Alexeef et al., 2018) to 16.4 µg/m3 (Barratt et al., 2018). Adjustments for the key confounders of age, sex, and SES were accounted for in each of the studies; direct or indirect adjustment for smoking was accounted for in each study, except for Gan et al. (2011) and Badaloni et al. (2017).
The studies considered mortality associated with CSD (n = 6), CHD (n = 4), CBVD (n = 3) and stroke (n = 1), and MI (n = 2). Summarized in Appendix A.5 is the most appropriately adjusted RE identified from each study. There was an insufficient number of studies with poolable data to conduct a meta-analysis for these outcomes, except CHD and CBVD including stroke.
For CHD, the EC-equivalent standardized REs ranged from 0.98 to 1.06 and the pooled RE was positive and borderline significant with a HR of 1.03 (95% CI: 0.99–1.08) (Figure 3.17). Heterogeneity was substantial (I2 = 81.92%) and was largely attributed to Barratt et al. (2018) as no heterogeneity (I2 = 0%) was observed when this study was removed from the meta-analysis in the leave-one-out analysis. Leave-one-out analysis also indicated the main analysis was robust (pooled RE varied between 1.02 and 1.05). Neither test for publication bias suggested the presence of a bias (Egger's test p = 0.9973; Begg's test p = 0.75) while trim-and-fill analysis indicated that one hypothetical study would be required to make the funnel plot symmetrical. As each of the primary studies in the main analysis was evaluated as low or probably low RoB for the exposure assessment and confounding domains, a sensitivity analysis based on RoB was not conducted. Subgroup analysis based on the exposure assessment was also not conducted since all the studies utilized LUR models.
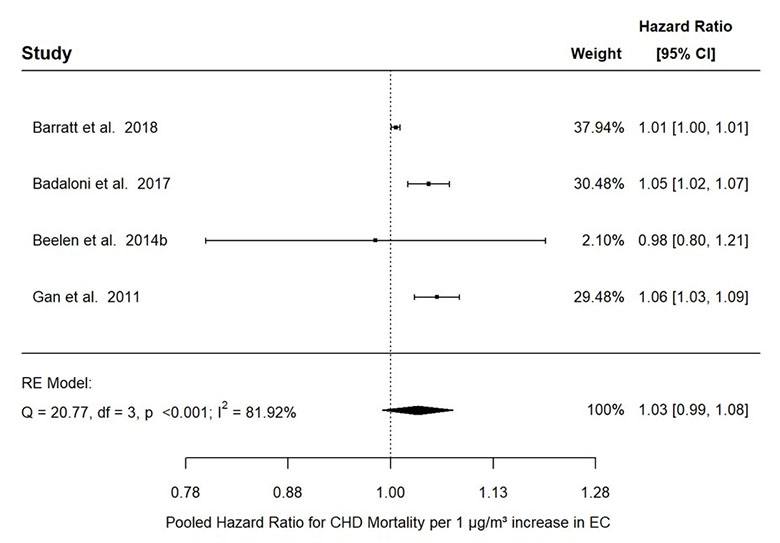
Figure 3.17: Text description
Figure 3.17 depicts a forest plot and results of the random-effects meta-analysis for CHD mortality and EC exposure in the general population. The meta-analysis of four individual studies resulted in a pooled RE of 1.03 (95% CI: 0.99–1.08) per 1 µg/m3 increase in EC. The following results were also reported for the statistical model: Q = 20.77, df = 3, p <0.001, and I2 = 81.92%.
The following information on the individual studies included in the pooled analysis is included in this figure:
| Study reference | Weight of study | Hazard ratio | 95% CI |
|---|---|---|---|
Barratt et al., 2018 |
37.94% |
1.01 |
1.00–1.01 |
Badaloni et al., 2017 |
30.48% |
1.05 |
1.02–1.07 |
Beelen et al., 2014b |
2.10% |
0.98 |
0.80–1.21 |
Gan et al., 2011 |
29.48% |
1.06 |
1.03–1.09 |
For CBVD including stroke, the results were mixed with the EC-equivalent standardized REs ranging from 0.68 to 1.01. The pooled RE for the association between EC and CBVD mortality (including stroke) was null at 1.00 (95% CI: 0.99–1.01) and there was no heterogeneity (I2 = 0%) (Figure 3.18). Leave-one-out analysis indicated that two studies (Barratt et al., 2018 and Beelen et al., 2014b) had the largest influence on the main analysis. Neither test for publication bias indicated the presence of a bias (Egger's test p = 0.3354; Begg's test p = 0.3333). Also, trim-and-fill analysis indicated that one hypothetical study would be required to make the funnel plot symmetrical. Excluding the study that only considered stroke (Dirgawati et al., 2019) also resulted in a null association (RE: 1.00 [95% CI: 1.00–1.01]).
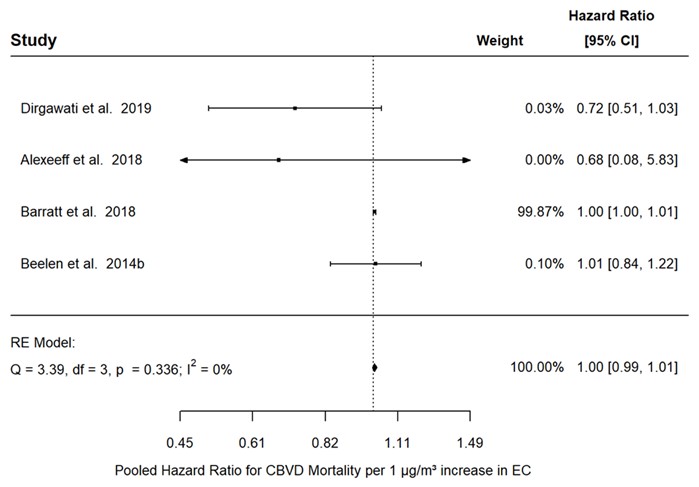
Figure 3.18: Text description
Figure 3.18 depicts a forest plot and results of the random-effects meta-analysis for CBVD mortality and EC exposure in the general population. The meta-analysis of four individual studies resulted in a pooled RE of 1.00 (95% CI: 0.99–1.01) per 1 µg/m3 increase in EC. The following results were also reported for the statistical model: Q = 3.39, df = 3, p = 0.336, and I2 = 0%.
The following information on the individual studies included in the pooled analysis is included in this figure:
| Study reference | Weight of study | Hazard ratio | 95% CI |
|---|---|---|---|
Dirgawati et al., 2019 |
0.03% |
0.72 |
0.51–1.03 |
Alexeeff et al., 2018 |
0.00% |
0.68 |
0.08–5.83 |
Barratt et al., 2018 |
99.87% |
1.00 |
1.00–1.01 |
Beelen et al., 2014b |
0.10% |
1.01 |
0.84–1.22 |
For CSD mortality, five of the studies reported a positive association, of which four were significant; however, the analysis of the ESCAPE cohorts did not report an association (Beelen et al., 2014b).
PM10 and PMcoarse
The literature searches identified seven studies of PM10 and one study of PMcoarse that had an association with circulatory mortality. As the literature available for PMcoarse is limited, this assessment will focus on the PM10 literature. Study details including study population, exposure assessment, confounders, and REs are provided in Appendix A.6. Each of the studies was conducted in Europe; five of the studies were based on general population cohorts and two were population-based case-control studies. No studies conducted in Canada were identified in the literature searches. The sample sizes ranged from 3,249 (Rosenlund et al., 2006) to 1,249,108 (Badaloni et al., 2017). For exposure assessment, four of the studies utilized dispersion modelling, three employed LUR modelling, and exposures were assigned at the residential address-, postal code-, or neighbourhood-level. For PM10, the mean exposures ranged from 2.2 (Rosenlund et al., 2009) to 48.1 µg/m3 (Beelen et al., 2014b). Each of the studies adjusted for the key confounders of age, sex, and SES; adjustments for smoking were included in each of the studies except for Naess et al. (2007) and Rosenlund et al. (2009).
For PM10, the studies evaluated CSD mortality (n = 4) and specific causes of circulatory mortality including MI (n = 3), CHD (n = 2), and CBVD (n = 1). There was an insufficient number of studies with poolable data to conduct a meta-analysis for any of these outcomes. For CSD mortality, seven REs were provided in the studies, of which six were positive with four of these statistically significant. For MI mortality, the results were mixed with two studies reporting an association (one significant and one non-significant) and two with null associations. Similarly, for CHD mortality, one study reported a borderline significant association and another a null association. For CBVD mortality, the single study reported a non-significant association.
3.3.3 Other TRAP pollutants: CO and benzene
CO
The literature searches identified two population-based case-control studies conducted in Stockholm, Sweden evaluating the association between circulatory mortality and CO; the study details are depicted in Appendix A.8. CO exposure was assessed by dispersion modelling and assigned based on the residential address; median CO ranged from 62.6 to 64.2 µg/m3. Both studies reported positive associations that were borderline or statistically significant for CO exposure and mortality caused by MI. They accounted for the key confounders of age, sex, and SES and one study adjusted for smoking.
Benzene
Only one study was identified in the literature searches to examine the association between long-term exposure to benzene, as a marker of TRAP, and circulatory mortality. This Canadian study by Villeneuve et al. (2013) was conducted in the general population of Ontario and accounted for the key confounders including an indirect adjustment for smoking. It reported a positive association that was borderline significant for exposure to benzene and CSD mortality (summarized in Appendix A.7).
3.3.4 Traffic and the road network infrastructure
Traffic proximity
Traffic proximity or distance to roadway was the most commonly used metric of traffic and the road network infrastructure that examined the association between traffic and circulatory mortality with 17 studies, of which 15 were conducted on the general population and 2 on patient populations. The study details regarding study population, exposure assessment, confounders, and REs are provided in Appendix A.9.
For the general population, the majority of the studies were conducted in Europe (n = 9) followed by Canada (n = 3), the USA (n = 2), and Asia (n = 1), and ranged in size from 3,287 (Kulick et al., 2018) to 2,644,370 (Cakmak et al., 2019). All of the studies conducted in the USA, Canada, and Asia were based on unique cohorts while those conducted in Europe were based on five cohorts: NLCS-AIR (Hoek et al., 2002; Beelen et al., 2008, 2009; Brunekreef et al., 2009); SALIA (Gehring et al., 2006; Heinrich et al., 2013); the Swiss National Cohort (Huss et al., 2010); the Diet, Cancer, and Health Cohort Study (Raaschou-Nielsen et al., 2012); and the Rome Longitudinal Study (Cesaroni et al., 2013). Studies conducted in the general population each examined one or more endpoints pertaining to circulatory mortality including mortality from CSD (n = 13, including 3 CPD mortality), CHD (n = 7), CBVD (n = 5) and stroke (n = 1), acute MI (n = 1), sudden cardiac death (n = 1), HF (n = 1), and cardiac dysrhythmia (n = 1). Most of the 15 studies accounted for the key confounders of age, sex, SES, and smoking. Specifically, all 15 studies accounted for age, sex, and individual SES and/or area-level SES but 5 studies did not adjust for smoking (Gan et al., 2010; Huss et al., 2010; Cesaroni et al., 2013; Chen et al., 2013; Cakmak et al., 2019). Many studies also considered additional confounders. Proximity to traffic was directly measured in a GIS. It was based on the exact residential address (European and American studies), the residential postal code (Canadian studies), or the geographic centre of each village for rural residents and the location of the primary health centre for urban residents (Iranian study). No consistent definitions or categories were used to assess traffic proximity across the studies.
The associations between traffic proximity and risk of CSD mortality in the general population are summarized in Figure 3.19; only unique cohorts and non-transformed data are included in the forest plot. Two studies considered traffic proximity as a continuous variable. In a Canada-wide study, Cakmak et al. (2019) reported a positive and significant association. In comparison, Kulick et al. (2018) did not observe any associations based on log-transformed proximity. When traffic proximity was evaluated as a categorical variable, 8 of the 15 REs were positive, of which 5 were significant and 3 were borderline significant. Of the three studies that examined exposure-response relationships, both Huss et al. (2010) and Cesaroni et al. (2013) identified an increased risk with increased exposure while Kulick et al. (2018) did not.

Figure 3.19: Text description
Figure 3.19 depicts a forest plot of risk estimates for long-term exposure to traffic proximity and CSD mortality in the general population. The x-axis representing risk estimates and 95% CI ranges from 0.7 to 1.6. The following information is depicted in this figure:
| Reference | Cohort, study location | Description | Data marker | Risk estimate | 95% CI | Type of risk estimate |
|---|---|---|---|---|---|---|
Cakmak et al., 2019 |
CanCHEC Cohort, Canada |
total length of local roads ≤200 m radius from residence, per 1,108.6 m increase |
A |
1.04 |
1.03–1.04 |
Continuous (per IQR increase) |
Hadley et al., 2022 |
Golestan Cohort Study, Asia |
living ≤100 m from a minor highway or ≤500 m from a major highway |
B |
1.13 |
1.01–1.27 |
Categorical |
Kulick et al., 2018 |
The Northern Manhattan Cohort, USA |
distance to roadway categorized as <100 m (reference group ≥400 m) |
C1 |
0.92 |
0.71–1.19 |
Categorical |
Kulick et al., 2018 |
The Northern Manhattan Cohort, USA |
distance to roadway categorized as 100 to <200 m (reference group ≥400 m) |
C2 |
0.94 |
0.74–1.19 |
Categorical |
Kulick et al., 2018 |
The Northern Manhattan Cohort, USA |
distance to roadway categorized as 200 to <400 m (reference group ≥400 m) |
C3 |
1.00 |
0.82–1.23 |
Categorical |
Heinrich et al., 2013 |
SALIA, Europe |
living ≤50 m from a major roadway (≥10,000 vehicles/day) |
D |
1.95 |
1.37–2.77 |
Categorical |
Chen et al., 2013 |
Ontario Tax Cohort, Canada |
living ≤50 m from a major road or <100 m from a highway; pooled risk estimate for Toronto, Hamilton, and Windsor |
E |
1.04 |
1.00–1.08 |
Categorical |
Cesaroni et al., 2013 |
Rome Longitudinal Study, Europe |
distance to high traffic road with >10,000 vehicles/day: <50 m (reference group ≥250 m) |
F1 |
1.03 |
1.01–1.05 |
Categorical |
Cesaroni et al., 2013 |
Rome Longitudinal Study, Europe |
distance to high traffic road with >10,000 vehicles/day: 50–100 m (reference group ≥250 m) |
F2 |
0.99 |
0.97–1.02 |
Categorical |
Cesaroni et al., 2013 |
Rome Longitudinal Study, Europe |
distance to high traffic road with >10,000 vehicles/day: 100–150 m (reference group ≥250 m) |
F3 |
1.00 |
0.97–1.02 |
Categorical |
Cesaroni et al., 2013 |
Rome Longitudinal Study, Europe |
distance to high traffic road with >10,000 vehicles/day: 150–250 m (reference group ≥250 m) |
F4 |
0.99 |
0.97–1.02 |
Categorical |
Raaschou-Nielsen et al., 2012 |
Diet, Cancer, and Health Cohort Study, Europe |
living ≤50 m from a major roadway (≥10,000 vehicles/day) |
G |
0.98 |
0.79–1.21 |
Categorical |
Huss et al., 2010 |
Swiss National Cohort, Europe |
distance to main road: <50 m (reference group ≥200 m) |
H1 |
1.04 |
1.03–1.06 |
Categorical |
Huss et al., 2010 |
Swiss National Cohort, Europe |
distance to main road: 50–99 m (reference group ≥200 m) |
H2 |
1.04 |
1.02–1.05 |
Categorical |
Huss et al., 2010 |
Swiss National Cohort, Europe |
distance to main road: 100–199 m (reference group ≥200 m) |
H3 |
1.02 |
1.00–1.03 |
Categorical |
Brunekreef et al., 2009 |
NLCS-AIR Cohort, Europe |
living near a major road (≤100 m from a freeway or ≤50 m from a major road with 10,000 motor vehicles/day) |
I |
1.05 |
0.93–1.18 |
Categorical |
CHD and CBVD (including stroke) mortality are the only specific causes of circulatory mortality for which REs were identified for traffic proximity in three or more unique cohorts. The risk of CHD and CBVD mortality in the general population are summarized in Figure 3.20; only unique cohorts are included in the forest plot. For CHD mortality, only one Canadian study considered traffic proximity as a continuous variable. In this Canada-wide study, Cakmak et al. (2019) reported a positive and significant association. When traffic proximity was evaluated as a categorical variable, most of the REs (i.e., eight of nine) were positive, of which three were significant and five were borderline significant. An increased risk with increased exposure was also observed in the only study that examined exposure-response relationships (Cesaroni et al., 2013). For CBVD mortality, a positive, borderline significant association was reported in the only study that considered traffic proximity as a continuous variable (Cakmak et al., 2019). However, when traffic proximity was evaluated as a categorical variable, only 5 of the 10 REs were positive and borderline significant. Additionally, an increased risk with increased exposure was observed in one of the two studies that examined exposure-response relationships (Huss et al., 2010; Cesaroni et al., 2013).

Figure 3.20: Text description
Figure 3.20 depicts a forest plot of risk estimates for long-term exposure to traffic proximity and CHD and CBVD mortality in the general population. The x-axis representing risk estimates and 95% CI ranges from 0.6 to 1.5. The following information is depicted in this figure:
| Health outcome | Reference | Cohort, study location | Description | Data marker | Risk estimate | 95% CI | Type of risk estimate |
|---|---|---|---|---|---|---|---|
CHD mortality |
Cakmak et al., 2019 |
CanCHEC Cohort, Canada |
total length of local roads ≤200 m radius from residence, per 1,108.6 m increase |
A |
1.05 |
1.04–1.06 |
Continuous (per IQR increase) |
CHD mortality |
Hart et al., 2014 |
NHS, the USA |
living <500 m from nearest A1 (primary roads, e.g., interstate highways), A2 (primary major, non-interstate highways and major roads), or A3 (smaller, secondary roads, usually with more than two lanes) roads |
B |
1.04 |
1.00–1.07 |
Categorical |
CHD mortality |
Cesaroni et al., 2013 |
Rome Longitudinal Study, Europe |
distance to high traffic road with >10,000 vehicles/day: <50 m (reference group ≥250 m) |
C1 |
1.05 |
1.01–1.09 |
Categorical |
CHD mortality |
Cesaroni et al., 2013 |
Rome Longitudinal Study, Europe |
distance to high traffic road with >10,000 vehicles/day: 50–100 m (reference group ≥250 m) |
C2 |
1.02 |
0.98–1.06 |
Categorical |
CHD mortality |
Cesaroni et al., 2013 |
Rome Longitudinal Study, Europe |
distance to high traffic road with >10,000 vehicles/day: 100–150 m (reference group ≥250 m) |
C3 |
0.99 |
0.95–1.04 |
Categorical |
CHD mortality |
Cesaroni et al., 2013 |
Rome Longitudinal Study, Europe |
distance to high traffic road with >10,000 vehicles/day: 150–250 m (reference group ≥250 m) |
C4 |
1.01 |
0.97–1.05 |
Categorical |
CHD mortality |
Chen et al., 2013 |
Ontario Tax Cohort, Canada |
living ≤50 m from a major road or <100 m from a highway; pooled risk estimate for Toronto, Hamilton, and Windsor |
D |
1.07 |
1.01–1.13 |
Categorical |
CHD mortality |
Raaschou-Nielsen et al., 2012 |
Diet, Cancer, and Health Cohort Study, Europe |
living ≤50 m from a major roadway (≥10,000 vehicles/day) |
E |
1.04 |
0.76–1.44 |
Categorical |
CHD mortality |
Gan et al., 2010 |
Vancouver metropolitan residents, Canada |
living near a major road (≤50 m from major road or ≤150 m from highway) |
F |
1.29 |
1.18–1.41 |
Categorical |
CHD mortality |
Beelen et al., 2009 |
NLCS-AIR, Europe |
living near a major road (≤100 m from motorway or ≤50 m from local road with traffic intensity >10,000 motor vehicles/24 h) |
G |
1.15 |
0.99–1.34 |
Categorical |
CBVD mortality |
Cakmak et al., 2019 |
CanCHEC Cohort, Canada |
total length of local roads ≤200 m radius from residence, per 1,108.6 m increase |
A |
1.01 |
0.99–1.02 |
Continuous (per IQR increase) |
CBVD mortality |
Cesaroni et al., 2013 |
Rome Longitudinal Study, Europe |
distance to high traffic road with >10,000 vehicles/day: <50 m (reference group ≥250 m) |
C1 |
1.03 |
0.98–1.08 |
Categorical |
CBVD mortality |
Cesaroni et al., 2013 |
Rome Longitudinal Study, Europe |
distance to high traffic road with >10,000 vehicles/day: 50–100 m (reference group ≥250 m) |
C2 |
1.01 |
0.95–1.06 |
Categorical |
CBVD mortality |
Cesaroni et al., 2013 |
Rome Longitudinal Study, Europe |
distance to high traffic road with >10,000 vehicles/day: 100–150 m (reference group ≥250 m) |
C3 |
1.00 |
0.94–1.05 |
Categorical |
CBVD mortality |
Cesaroni et al., 2013 |
Rome Longitudinal Study, Europe |
distance to high traffic road with >10,000 vehicles/day: 150–250 m (reference group ≥250 m) |
C4 |
1.00 |
0.96–1.05 |
Categorical |
CBVD mortality |
Chen et al., 2013 |
Ontario Tax Cohort, Canada |
living ≤50 m from a major road or <100 m from a highway; pooled risk estimate for Toronto, Hamilton, and Windsor |
D |
1.01 |
0.92–1.10 |
Categorical |
CBVD mortality |
Raaschou-Nielsen et al., 2012 |
Diet, Cancer, and Health Cohort Study, Europe |
living ≤50 m from a major roadway (≥10,000 vehicles/day) |
E |
0.87 |
0.54–1.39 |
Categorical |
CBVD mortality |
Huss et al., 2010 |
Swiss National Cohort, Europe |
distance to main road: <50 m (reference group ≥200 m) |
H1 |
1.01 |
0.98–1.05 |
Categorical |
CBVD mortality |
Huss et al., 2010 |
Swiss National Cohort, Europe |
distance to main road: 50–99 m (reference group ≥200 m) |
H2 |
0.99 |
0.95–1.03 |
Categorical |
CBVD mortality |
Huss et al., 2010 |
Swiss National Cohort, Europe |
distance to main road: 100–199 m (reference group ≥200 m) |
H3 |
1.02 |
0.98–1.06 |
Categorical |
CBVD mortality |
Beelen et al., 2009 |
NLCS-AIR, Europe |
living near a major road (≤100 m from motorway or ≤50 m from local road with traffic intensity >10,000 motor vehicles/24 h) |
G |
0.70 |
0.51–0.96 |
Categorical |
A limited number of studies also evaluated other causes of circulatory mortality (summarized in Appendix A.9). An increased risk with increased exposure was observed for MI mortality and a positive significant association was reported for SCD mortality. In contrast, no association was found for HF and cardiac dysrhythmia.
Two Canadian studies examined the association between exposure to traffic proximity and circulatory mortality in patient populations (summarized in Appendix A.9). These studies ranged in size from 2,360, comprising patients from a respiratory disease clinic in Toronto, Ontario (Jerrett et al., 2009), to 5,228, comprising patients who underwent pulmonary function testing at a clinic in Hamilton, Ontario (Finkelstein et al., 2005). Each study accounted for key confounders of age, sex, and SES, while smoking was only accounted for in Jerrett et al. (2009). A positive, borderline significant or significant association was observed between traffic proximity and CSD mortality in each study and between traffic proximity and CBVD mortality in one study.
Traffic density
Seven studies were identified in the literature search evaluating the risk of circulatory mortality and measures of traffic density. Study details including study population, exposure assessment, confounders, and REs are provided in Appendix A.10. The studies were conducted in Europe (n = 6) and Asia (n = 1). Each study was based on general population cohorts and ranged in size from 12,098 (Pan et al., 2021) to 1,265,058 (Cesaroni et al., 2013). Beelen et al. (2008, 2009) and Brunekreef et al. (2009) were conducted in the NLCS-AIR cohort and had identical results. Each of the studies accounted for the key confounders of age, sex, and SES, and smoking was accounted for in each of the studies except for Cesaroni et al. (2013). Each of the studies evaluated CSD mortality; specific causes of circulatory mortality were evaluated in four of the studies (Beelen et al., 2009, 2014; Raaschou-Nielsen et al., 2012; Cesaroni et al., 2013). The studies mostly reported positive, borderline significant associations for CSD or CHD mortality and measures of traffic density near the residence (summarized in Figure 3.21). Cesaroni et al. (2013) noted a significant trend of increasing risk for both CSD and CHD for the quintiles of exposure. Beelen et al. (2009) reported a significant association for CHD mortality. For CBVD, mixed results were noted between the three studies, and, for other specific causes (e.g., MI, HF, dysrhythmia), the single analysis reported positive associations.

Figure 3.21: Text description
Figure 3.21 depicts a forest plot of risk estimates for long-term exposure to traffic density and CSD and CHD mortality in the general population. The x-axis representing risk estimates and 95% CI ranges from 0.85 to 1.25. The following information is depicted in this figure:
| Health outcome | Traffic indicator | Reference | Cohort, study location | Description | Data marker | Risk estimate | 95% CI | Type of risk estimate |
|---|---|---|---|---|---|---|---|---|
CSD mortality |
Traffic on nearest road |
Brunekreef et al., 2009 |
NLCS-AIR Cohort, Europe |
traffic on nearest road (per 10,000 vehicles/day) |
A1 |
1.05 |
0.99–1.12 |
Continuous |
CSD mortality |
Traffic on nearest road |
Beelen et al., 2014b |
ESCAPE, Europe |
traffic on nearest road (per 5,000 vehicles/day) |
B1 |
1.02 |
0.99–1.05 |
Continuous |
CSD mortality |
Traffic on nearest road |
Pan et al., 2021 |
REVEAL-HBV, Asia |
log vehicle/day |
C |
1.13 |
0.96–1.33 |
Continuous |
CSD mortality |
Sum of traffic in 100- or 200-m buffer |
Brunekreef et al., 2009 |
NLCS-AIR Cohort, Europe |
sum of traffic intensity in 100 m buffer (per 335,000 vehicles/day) |
A2 |
1.00 |
0.92–1.08 |
Continuous |
CSD mortality |
Sum of traffic in 100- or 200-m buffer |
Beelen et al., 2014b |
ESCAPE, Europe |
sum of traffic intensity in 100-m buffer (per 4 x 10⁶ vehicle-m/day) |
B2 |
0.99 |
0.89–1.11 |
Continuous |
CSD mortality |
Sum of traffic in 100- or 200-m buffer |
Raaschou-Nielsen et al., 2012 |
Diet, Cancer, and Health Cohort Study, Europe |
per doubling of traffic within 200 m buffer |
D1 |
1.02 |
0.98–1.06 |
Continuous |
CSD mortality |
Traffic density in 150-m buffer |
Cesaroni et al., 2013 |
Rome Longitudinal Study, Europe |
traffic density in 150-m buffer (vehicle-m/day); (0.25–1.63) x 106 (reference: <0.25 x 10⁶) |
E1 |
1.02 |
0.99–1.04 |
Categorical |
CSD mortality |
Traffic density in 150-m buffer |
Cesaroni et al., 2013 |
Rome Longitudinal Study, Europe |
traffic density in 150-m buffer (vehicle-m/day); (1.63–3.23) x 106 (reference: <0.25 x 10⁶) |
E2 |
1.03 |
1.00–1.05 |
Categorical |
CSD mortality |
Traffic density in 150-m buffer |
Cesaroni et al., 2013 |
Rome Longitudinal Study, Europe |
traffic density in 150-m buffer (vehicle-m/day); (3.23–6.66) x 106 (reference: <0.25 x 10⁶) |
E3 |
1.03 |
1.00–1.06 |
Categorical |
CSD mortality |
Traffic density in 150-m buffer |
Cesaroni et al., 2013 |
Rome Longitudinal Study, Europe |
traffic density in 150-m buffer (vehicle-m/day); ≥6.66 x 10⁶ (reference: <0.25 x 10⁶) |
E4 |
1.05 |
1.02–1.07 |
Categorical |
CHD mortality |
Traffic on nearest road |
Beelen et al., 2009 |
NLCS-AIR Cohort, Europe |
traffic on nearest road (per 10,000 vehicle/day) |
F |
1.11 |
1.03–1.20 |
Continuous |
CHD mortality |
Traffic on nearest road |
Beelen et al., 2014b |
ESCAPE, Europe |
traffic on nearest road (per 5,000 vehicles/day) |
B3 |
1.02 |
0.99–1.06 |
Continuous |
CHD mortality |
Sum of traffic in 100- or 200-m buffer |
Raaschou-Nielsen et al., 2012 |
Diet, Cancer, and Health Cohort Study, Europe |
per doubling of traffic within 200 m buffer |
D2 |
1.01 |
0.95–1.07 |
Continuous |
CHD mortality |
Sum of traffic in 100- or 200-m buffer |
Beelen et al., 2014b |
ESCAPE, Europe |
sum of traffic intensity in 100-m buffer (per 4 x 10⁶ vehicle-m/day) |
B4 |
1.02 |
0.88–1.18 |
Continuous |
CHD mortality |
Traffic density in 150-m buffer |
Cesaroni et al., 2013 |
Rome Longitudinal Study, Europe |
traffic density in 150-m buffer (vehicle-m/day); (0.25–1.63) x 106 (reference: <0.25 x 10⁶) |
E5 |
1.00 |
0.95–1.04 |
Categorical |
CHD mortality |
Traffic density in 150-m buffer |
Cesaroni et al., 2013 |
Rome Longitudinal Study, Europe |
traffic density in 150-m buffer (vehicle-m/day); (1.63–3.23) x 106 (reference: <0.25 x 10⁶) |
E6 |
1.01 |
0.97–1.04 |
Categorical |
CHD mortality |
Traffic density in 150-m buffer |
Cesaroni et al., 2013 |
Rome Longitudinal Study, Europe |
traffic density in 150-m buffer (vehicle-m/day); (3.23–6.66) x 106 (reference: <0.25 x 10⁶) |
E7 |
1.04 |
1.00–1.09 |
Categorical |
CHD mortality |
Traffic density in 150-m buffer |
Cesaroni et al., 2013 |
Rome Longitudinal Study, Europe |
traffic density in 150-m buffer (vehicle-m/day); ≥6.66 x 10⁶ (reference: <0.25 x 10⁶) |
E8 |
1.04 |
1.00–1.09 |
Categorical |
3.3.5 Summary
The association between TRAP and circulatory mortality was evaluated in 39 cohort and 2 case-control studies; all but 2 studies were based on the general population and the majority were conducted in Europe. These studies evaluated mortality from CSD as a group, as well as from more specific causes, including CHD and CBVD (including stroke). Over 60% of the studies assessed exposure to TRAP by modelling individual traffic-related pollutants; the remainder used metrics of traffic and the road network infrastructure to assess the contribution of traffic emissions to ambient air pollution. Nearly all the studies accounted for the key confounders of age, sex, SES, and smoking and many considered additional confounders. Pooled analyses were conducted on the general population studies.
For CSD mortality, pooled analyses of the two pollutants evaluated (NO2 and PM2.5) indicated a positive association with pooled estimates of 1.05 and 1.06, respectively; both associations were borderline significant. Heterogeneity was considerable for NO2 and moderate for PM2.5. The meta-analysis results were supported by the qualitative analysis of 1) the other pollutants (i.e., NOx, BC, PM2.5 abs, PM10, and benzene) and of 2) the different metrics for traffic and the road network infrastructure, which demonstrated some evidence of an exposure-response relationship.
For CHD mortality, the pooled analyses indicated a positive association for each of the pollutants evaluated (i.e., NO2, NOx, PM2.5, and EC); these associations with pooled REs ranging from 1.02 to 1.10 were significant or borderline significant. Heterogeneity was likely not of importance for NO2 and PM2.5, but substantial for NOx and EC. The meta-analysis results were supported by the qualitative analysis of the different metrics for traffic and the road network infrastructure with demonstration of an exposure-response relationship. In contrast, the evidence for NO and PM10 was mixed and the limited number of studies did not support conducting a pooled analysis.
For CBVD mortality, the pooled analyses of the pollutants evaluated produced mixed results. A positive association of borderline significance was identified for NO2 and PM2.5 with REs of 1.01 and 1.08, respectively, but a null association was determined for NOx and EC. Heterogeneity was likely not of importance for each of the four pollutants. Mixed results were also observed for the qualitative analysis of the metrics of traffic and the road network infrastructure. Evidence from NO and PM10 was limited and did not support conducting a pooled analysis.
There was also some evidence of positive associations for other causes of circulatory mortality and various traffic-related air pollutants but this evidence was limited and did not support conducting a pooled analysis.
3.4 Respiratory mortality
Based on the overlap of ICD codes, individual studies refer to respiratory mortality as mortality from respiratory disease, pulmonary disease, non-malignant respiratory disease, and respiratory disease excluding lung cancer. While some studies included mortality from all respiratory disorders, others did not include lung diseases due to external agents. For this risk assessment, and consistent with HEI (2022), these health outcomes were considered similar and are referred to as respiratory mortality (or respiratory disorder [RD] mortality in the appendix). Respiratory mortality was evaluated in 20 of the 64 articles evaluating the association between long-term exposure to TRAP and mortality. An evaluation of the studies examining the effects of long-term exposure to TRAP and respiratory mortality are presented below by TRAP pollutant or metric. These studies evaluated mortality from respiratory disorders as a group, as well as from more specific causes (e.g., chronic obstructive pulmonary disease [COPD], pneumonia, and influenza/pneumonia).
3.4.1 Nitrogen oxides (NO, NO2, and NOx)
NO2
The literature searches identified 12 studies evaluating the association between respiratory causes of mortality and NO2. Study details pertaining to this health endpoint including study population, exposure assessment, confounders, and REs are provided in Appendix A.1. The studies were conducted in Canada (n = 4), Europe (n = 4), and Asia (n = 4). All but one Canadian study (Jerrett et al., 2009) were drawn from the general population with a study size ranging from 12,029 (Yorifuji et al., 2010) to 1,265,058 (Cesaroni et al., 2013). For exposure assessment of the studies conducted in the general population, LUR modelling (n = 9) was the most common method used, followed by dispersion modelling (n = 2). Exposures were assigned based on the residential address or postal code, or at the neighbourhood level, and the mean exposures ranged from 5.2 to 107 µg/m3. The lowest exposures were assigned to one of the Swedish cohorts included in the ESCAPE study (Dimakopoulou et al., 2014) while the highest exposures were noted in a study conducted in Hong Kong, China (Barratt et al., 2018). Studies conducted in the general population each examined one or more endpoints pertaining to respiratory mortality. Most of the studies identified evaluated respiratory mortality (n = 9), with fewer studies considering specific causes of mortality including COPD (n = 6); influenza and pneumonia (n = 2); and pneumonia alone (n = 2). All 11 studies accounted for age and sex, as well as individual SES and/or area-level SES; 3 studies did not adjust for smoking (Naess et al., 2007; Cesaroni et al., 2013; Gan et al., 2013). Many studies also considered additional confounders.
The most appropriately adjusted RE identified from each study for each relevant outcome is specified in Appendix A.1.
For the general population, six of the nine REs pertaining to respiratory mortality were positive, of which four were statistically significant and two were borderline significant. The forest plot and results of the random-effects meta-analysis for respiratory mortality and NO2 are presented in Figure 3.22. Seven studies were included in the meta-analysis for the general population with REs ranging from 0.97 to 1.19. The pooled RE for the association between NO2 and respiratory mortality was borderline significant at 1.04 (95% CI: 0.99–1.09) and the heterogeneity was substantial (I2 = 74.36%).

Figure 3.22: Text description
Figure 3.22 depicts a forest plot and results of the random-effects meta-analysis for respiratory mortality and NO2 exposure in the general population. The meta-analysis of seven individual studies resulted in a pooled RE of 1.43 (95% CI: 0.99–1.09) per 10 µg/m3 increase in NO2. The following results were also reported for the statistical model: Q = 22.8, df = 6, p <0.001, and I2 = 74.36%.
The following information on the individual studies included in the pooled analysis is included in this figure:
| Study reference | Weight of study | Hazard ratio | 95% CI |
|---|---|---|---|
Barratt et al., 2018 |
19.73% |
1.00 |
0.97–1.02 |
Crouse et al., 2015 |
16.05% |
1.09 |
1.04–1.13 |
Dimakopoulou et al., 2014 |
9.61% |
0.97 |
0.89–1.05 |
Carey et al., 2013 |
17.12% |
1.07 |
1.02–1.11 |
Cesaroni et al., 2013 |
19.04% |
1.03 |
1.00–1.06 |
Villeneuve et al., 2013 |
12.33% |
1.04 |
0.97–1.10 |
Yorifuji et al., 2013 |
6.12% |
1.19 |
1.06–1.34 |
The subgroup and sensitivity analyses conducted did not indicate a difference from the main analysis. Specifically, both the pooled RE and the heterogeneity were robust when limiting the analysis to studies that used LUR modelling to assess exposure (n = 6) or to those with low and probably low RoB for the confounder domain (n = 5). Leave-one-out analysis indicated the results were robust as the pooled RE ranged from 1.03 to 1.05 and the heterogeneity remained substantial. There was no indication of publication bias, as trim-and-fill analysis did not identify any missing studies and the tests did not indicate a bias (Egger's test p = 0.3593; Begg's test p = 0.3813).
For COPD mortality in the general population, eight of the nine REs were positive, of which one was statistically significant and six were borderline significant. Four of the REs were derived from the same study (Naess et al., 2007) and correspond to different age groups and sex. For this exposure-outcome pair, no meta-analysis was conducted as there was an insufficient number of studies that corresponded to unique cohorts and that had the necessary data to conduct a quantitative analysis.
A limited number of studies were identified in the literature searches pertaining to NO2 exposure and mortality from influenza and pneumonia (combined) and from pneumonia alone in the general population. Two studies were identified for each outcome and both studies were conducted in the same cohort for each of the outcomes. Although no association was identified for mortality from pneumonia alone, a positive, borderline significant association was reported for mortality from influenza and pneumonia (combined).
The only study to examine the association between long-term exposure to NO2 and respiratory mortality in a patient population was conducted in adult patients from a respiratory disease clinic in Toronto, Ontario, (Jerrett et al., 2009). This Canadian study accounted for the key confounders including smoking and reported a positive but not significant association between NO2 and respiratory mortality (summarized in Appendix A.1).
NOx
The literature searches identified four studies, all conducted in Europe and drawn from the general population, evaluating the association between respiratory mortality and NOx. Study details including study population, exposure assessment, confounders, and REs are provided in Appendix A.2. The cohorts ranged in size from 7,494 (Stockfelt et al., 2015) to 307,553 (Dimakopoulou et al., 2014). The majority of the studies used dispersion modelling (n = 3) while one study used an LUR model to assess NOx exposure. All studies assigned NOx exposure at the residential address; the mean (or median) exposures ranged from 5.80 to 96.1 µg/m3. The lowest exposures were estimated in a study conducted in Civitavecchia, Italy (Bauleo et al., 2019) while the highest exposures were modelled in an Italian cohort included in the ESCAPE study (Dimakopoulou et al., 2014). All four studies examined respiratory mortality and one study also evaluated COPD mortality. The studies accounted for the key confounders of age, sex, and SES (individual- and/or area-level) and all but one study (Bauleo et al., 2019) also adjusted for smoking. They also typically considered additional confounders.
The most appropriately adjusted RE from each study for each relevant outcome is summarized in Appendix A.2. For respiratory mortality, two of the four REs were positive of which one was statistically significant. The forest plot and results of the random-effects meta-analysis for respiratory mortality and NOx in the general population are presented in Figure 3.23. Four studies were included in the meta-analysis for the general population with REs ranging from 0.99 to 1.16. The pooled RE was borderline significant at 1.05 (95% CI: 0.93–1.20) and heterogeneity was substantial (I2 = 66.29%).
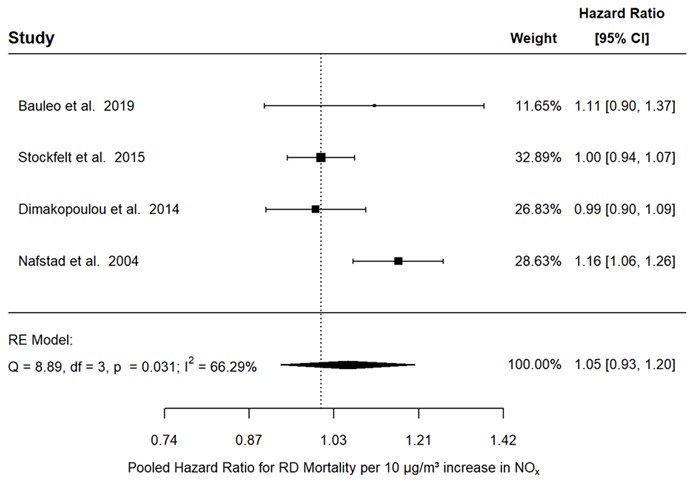
Figure 3.23: Text description
Figure 3.23 depicts a forest plot and results of the random-effects meta-analysis for respiratory mortality and NOx exposure in the general population. The meta-analysis of four individual studies resulted in a pooled RE of 1.05 (95% CI: 0.93–1.20) per 10 µg/m3 increase in NOx. The following results were also reported for the statistical model: Q = 8.89, df = 3, p = 0.031, and I2 = 66.29%.
The following information on the individual studies included in the pooled analysis is included in this figure:
| Study reference | Weight of study | Hazard ratio | 95% CI |
|---|---|---|---|
Bauleo et al., 2019 |
11.65% |
1.11 |
0.90–1.37 |
Stockfelt et al., 2015 |
32.89% |
1.00 |
0.94–1.07 |
Dimakopoulou et al., 2014 |
26.83% |
0.99 |
0.90–1.09 |
Nafstad et al., 2004 |
28.63% |
1.16 |
1.06–1.26 |
When the analysis was limited to studies using dispersion modelling to assess exposure, which included all but one study from the main analysis, the pooled RE remained positive but was not significant (RE: 1.08; 95% CI: 0.88–1.33). Similarly, the pooled RE from the main analysis was robust to the sensitivity analyses based on RoB (i.e., excluding studies with high or probably high RoB in the exposure assessment or confounder domains). Heterogeneity remained substantial for all subgroup and sensitivity analyses. Leave-one-out analysis indicated that Nafstad et al. (2004) was the main source of heterogeneity as omitting this study removed heterogeneity from the main analysis. It was also the only study that, when omitted, resulted in a null association. A positive but non-significant association was observed when each of the three other studies were omitted. There was no indication of publication bias, as trim-and-fill analysis did not identify any missing studies and the tests did not indicate a bias (Egger's test p = 0.6812; Begg's test p = 0.7500).
Only one RE was identified for exposure to NOx and COPD mortality. This RE was positive and borderline significant.
NO
Two studies evaluating the association between respiratory mortality and NO were identified in the literature searches; both were based on the general population. The study details are depicted in Appendix A.3. One study was conducted on a cohort of 465,360 participants in Vancouver, British Columbia (Gan et al., 2013) and the other on a cohort of 60,548 participants residing in Hong Kong, China (Barratt et al., 2018). Both studies estimated exposure using LUR models with a mean NO ranging from 32.1 (Gan et al., 2013) to 489 µg/m3 (Barratt et al., 2018). Both studies included adjustments for the key confounders of age, sex, and SES, but Barratt et al. (2008) also adjusted for smoking as well as additional confounders. A positive association that was borderline significant was reported for COPD mortality and NO in each of the studies; however, no association was observed for respiratory mortality or pneumonia mortality and NO.
3.4.2 PM
PM2.5
The literature search identified seven studies evaluating the association between long-term PM2.5 exposure and respiratory mortality. Study details including study population, exposure assessment, confounders, and REs are provided in Appendix A.4. Each of the studies considered general population cohorts and were conducted in Canada (n = 1), Europe (n = 4), and Asia (n = 2). The cohort sizes ranged from 60,458 (Barratt et al., 2018) to 1,265,058 (Cesaroni et al., 2013). The exposure assessments were derived from either LUR modelling (n = 4) or dispersion modelling (n = 3), with exposures assigned at either the residential address, postal code, or neighbourhood level. The lowest mean or median exposures were estimated for a study conducted in Vancouver, British Columbia (4.10 µg/m3, Gan et al., 2013) and the highest exposure was estimated for a study conducted in Hong Kong, China (42.4 µg/m3; Barratt et al., 2018). Each of the studies included adjustments for the key confounders of age, sex, and SES, and typically included additional confounders. With respect to smoking, three studies did not include an adjustment, either direct or indirect, for individual-level smoking (Naess et al., 2007; Gan et al., 2011; Cesaroni et al., 2013).
Five of the studies evaluated respiratory mortality, four evaluated COPD mortality, and two evaluated pneumonia mortality. Summarized in Appendix A.4 is the most appropriately adjusted RE identified from each study, for each relevant outcome. For respiratory mortality, four of the studies reported a positive association, of which one was significant and three were borderline significant, and one study reported no association. The forest plot and random-effects meta-analysis for respiratory mortality and PM2.5 are presented in Figure 3.24. Four studies were included in the meta-analysis with standardized REs ranging from 0.79 to 1.43. The pooled RE for the association between PM2.5 and respiratory mortality was non-significant at 1.09 (95% CI: 0.80–1.49) and the heterogeneity was substantial (I2 = 88.34%). Leave-one-out analysis indicated that the main analysis was robust (pooled RE varied between 1.03 and 1.13) and no one study distorted the overall results. Neither test for publication bias indicated the presence of a bias (Egger's test p = 0.7017; Begg's test p = 1.000). Also, trim-and-fill analysis indicated that one hypothetical study would be required to make the funnel plot symmetrical.

Figure 3.24: Text description
Figure 3.24 depicts a forest plot and results of the random-effects meta-analysis for respiratory mortality and PM2.5 exposure in the general population. The meta-analysis of four individual studies resulted in a pooled RE of 1.09 (95% CI: 0.80–1.49) per 10 µg/m3 increase in PM2.5. The following results were also reported for the statistical model: Q = 11.02, df = 3, p = 0.012, and I2 = 88.34%.
The following information on the individual studies included in the pooled analysis is included in this figure:
| Study reference | Weight of study | Hazard ratio | 95% CI |
|---|---|---|---|
Barratt et al., 2018 |
32.85% |
1.04 |
0.96–1.12 |
Dimakopoulou et al., 2014 |
8.47% |
0.79 |
0.47–1.34 |
Carey et al., 2013 |
24.52% |
1.43 |
1.17–1.74 |
Cesaroni et al., 2013 |
34.15% |
1.03 |
0.97–1.08 |
For COPD mortality, each of the seven associations were positive, of which one was significant and five were borderline significant. Only two studies evaluated pneumonia mortality and reported null associations. There was an insufficient number of studies with poolable data to conduct a meta-analysis for any of these outcomes.
EC, PM2.5 abs, and BC
Four studies were identified that evaluated exposure to PM2.5 abs or BC and respiratory mortality. Study details are provided in Appendix A.5. The studies were conducted in Canada (n = 1), Europe (n = 1), and Asia (n = 2). Each of the studies considered general population cohorts and study sizes ranged from 60,548 (Barratt et al., 2018) to 465,360 (Gan et al., 2013). Each study used LUR modelling to assess exposures, which were assigned at the residential address or postal code level. Exposures, based on EC-equivalents, were 1.1 µg/m3 for the studies conducted in Canada and Europe, and 12 µg/m3 for the studies conducted in Asia. Adjustments for the key confounders of age, sex, and SES were accounted for in each of the studies; direct or indirect adjustment for smoking was accounted for in each study, except for Gan et al. (2013).
The studies considered mortality associated with respiratory disorders (n = 3), COPD (n = 4), and pneumonia (n = 2). The two studies conducted in Asia (Barratt et al., 2018; Yang et al., 2018) were based on the same cohort and had identical results for each cause-specific mortality. For respiratory disease and pneumonia mortality, a negative association was noted in each of the studies. For COPD, a positive, borderline significant association was reported for the Canadian study (Gan et al., 2013), while a negative association was reported in the two Asian studies (Barratt et al., 2018; Yang et al., 2018). There was an insufficient number of studies with poolable data to conduct a meta-analysis for any of these outcomes.
PM10 and PMcoarse
The literature search identified three studies of PM10 and one study of PMcoarse and the association with respiratory morbidity. Study details are provided in Appendix A.6. Each of the studies was conducted in Europe, based on general population cohorts with study sizes ranging from 143,842 (Naess et al., 2007) to 830,842 (Carey et al., 2013). For exposure assessment, two studies utilized dispersion modelling (Naess et al., 2007; Carey et al., 2013) and one employed LUR modelling (Dimakopoulou et al., 2014); exposures were assigned at the residential address, postal code, or neighbourhood level. For PM10, the mean exposures ranged from 3.0 (Carey et al., 2013) to 10 µg/m3 (Dimakopoulou et al., 2014). Adjustments for the key confounders of age, sex, and SES were accounted for in each of the studies; direct or indirect adjustment for smoking was accounted for in each study, except for Naess et al. (2007).
Two studies evaluated respiratory mortality and PM10 with conflicting results as one reported a significant, positive association (Carey et al., 2013) and the other a borderline significant, negative association (Dimakopoulou et al., 2014). No association was also observed for respiratory mortality and PMcoarse. For COPD, one study reported positive associations (either significant or borderline significant) with PM10 (Naess et al., 2007). There was an insufficient number of studies with poolable data to conduct a meta-analysis for any of these outcomes.
3.4.3 Other TRAP pollutants: benzene
Only one study was identified in the literature searches that examined the association between long-term exposure to benzene, as a marker of TRAP, and respiratory mortality. This Canadian study by Villeneuve et al. (2013) was conducted in the general population of Ontario, accounted for the key confounders including indirect adjustment for smoking, and reported a borderline significant, positive association (summarized in Appendix A.7).
3.4.4 Traffic and the road network infrastructure
Traffic proximity
The literature search identified six studies that examined the association between traffic proximity or distance to roadway and respiratory mortality. Five of these studies were conducted on the general population and one on a patient population. The study details are provided in Appendix A.9.
For the general population, four studies were conducted in Europe and one study was conducted in Canada. The studies had a cohort design and ranged in size from 4,752 (Heinrich et al., 2013) to 2,644,370 (Cakmak et al., 2019). They were based on unique study populations, with the exception of two studies conducted in Europe that were both based on the NLCS-AIR cohort (Beelen et al., 2008; Brunekreef et al., 2009). The five studies evaluated mortality from respiratory diseases as a group; one study also examined COPD mortality. All studies accounted for the key confounders of age, sex, and SES (individual- and/or area-level), of which three studies also adjusted for smoking. Some studies considered additional confounders. Proximity to traffic was directly measured in a GIS, based on the exact residential address (European studies) or residential postal code (Canadian study). No consistent definitions or categories were used to assess traffic proximity across the studies.
The associations between traffic proximity and risk of respiratory mortality in the general population are summarized in Figure 3.25; only unique cohorts are included in the forest plot. Traffic proximity was considered a continuous variable in only one study. In this Canada-wide study, Cakmak et al. (2019) reported a positive, significant association. When traffic proximity was evaluated as a categorical variable, four of the six REs were positive, of which two had a wide 95% CI, one was significant, and the remainder were borderline significant. The two REs that showed no association corresponded to distances farther away from high traffic roads (i.e., 100–150 m and 150–250 m) and were part of a study examining exposure-response relationships (Cesaroni et al., 2013). A RE indicating a positive, borderline significant association was also reported for COPD mortality by Cakmak et al. (2019).
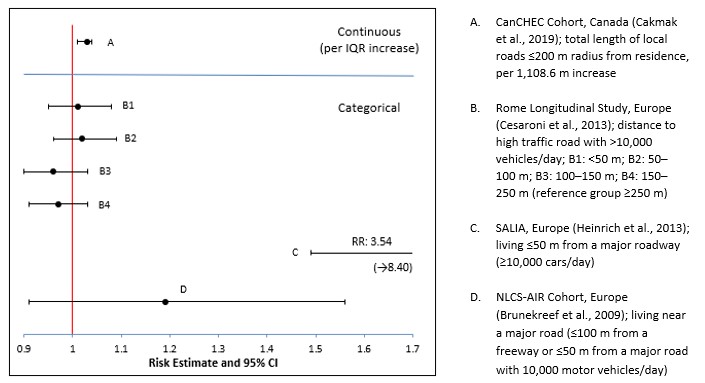
Figure 3.25: Text description
Figure 3.25 depicts a forest plot of risk estimates for long-term exposure to traffic proximity and respiratory mortality in the general population. The x-axis representing risk estimates and 95% CI ranges from 0.9 to 1.7. The following information is depicted in this figure:
| Reference | Cohort, study location | Description | Data marker | Risk estimate | 95% CI | Type of risk estimate |
|---|---|---|---|---|---|---|
Cakmak et al., 2019 |
CanCHEC Cohort, Canada |
total length of local roads ≤200 m radius from residence, per 1,108.6 m increase |
A |
1.03 |
1.01–1.04 |
Continuous (per IQR increase) |
Cesaroni et al., 2013 |
Rome Longitudinal Study, Europe |
distance to high traffic road with >10,000 vehicles/day: <50 m (reference group ≥250 m) |
B1 |
1.01 |
0.95–1.08 |
Categorical |
Cesaroni et al., 2013 |
Rome Longitudinal Study, Europe |
distance to high traffic road with >10,000 vehicles/day: 50–100 m (reference group ≥250 m) |
B2 |
1.02 |
0.96–1.09 |
Categorical |
Cesaroni et al., 2013 |
Rome Longitudinal Study, Europe |
distance to high traffic road with >10,000 vehicles/day: 100–150 m (reference group ≥250 m) |
B3 |
0.96 |
0.90–1.03 |
Categorical |
Cesaroni et al., 2013 |
Rome Longitudinal Study, Europe |
distance to high traffic road with >10,000 vehicles/day: 150–250 m (reference group ≥250 m) |
B4 |
0.97 |
0.91–1.03 |
Categorical |
Heinrich et al., 2013 |
SALIA, Europe |
living ≤50 m from a major roadway (≥10,000 cars/day) |
C |
3.54 |
1.49–8.40 |
Categorical |
Brunekreef et al., 2009 |
NLCS-AIR Cohort, Europe |
living near a major road (≤100 m from a freeway or ≤50 m from a major road with 10,000 motor vehicles/day) |
D |
1.19 |
0.91–1.56 |
Categorical |
Only one study was identified in the literature searches to examine the association between traffic proximity and respiratory mortality in a patient population. This Canadian study (Finkelstein et al., 2005) conducted in patients who underwent pulmonary function testing at a clinic in Hamilton, Ontario, accounted for the key confounders of age, sex, and SES, and reported no association (summarized in Appendix A.9).
Traffic density
Four studies were identified in the literature search evaluating the risk of respiratory mortality and measures of traffic density. Study details including study population, exposure assessment, confounders, and REs are provided in Appendix A.10. Each of the studies was conducted in Europe based on general population cohorts, and ranged in size from 105,296 (Brunekreef et al., 2009) to 1,265,058 (Cesaroni et al., 2013). Beelen et al. (2008) and Brunekreef et al. (2009) were conducted in the NLCS-AIR cohort and had identical results. Each of the studies accounted for the key confounders of age, sex, and SES, and smoking was accounted for in each of the studies except for Cesaroni et al. (2013). The studies considered respiratory mortality; no specific causes of mortality were considered. An increased risk of respiratory mortality based on traffic density near the residence was reported in each of the studies (summarized in Figure 3.26), with most REs being borderline significant or significant.

Figure 3.26: Text description
Figure 3.26 depicts a forest plot of risk estimates for long-term exposure to traffic density and respiratory mortality in the general population. The x-axis representing risk estimates and 95% CI ranges from 0.9 to 1.5. The following information is depicted in this figure:
| Traffic indicator | Reference | Cohort, study location | Description | Data marker | Risk estimate | 95% CI | Type of risk estimate |
|---|---|---|---|---|---|---|---|
Traffic on nearest road |
Dimakopoulou et al., 2014 |
ESCAPE, Europe |
traffic on nearest road (per 5,000 vehicles/day) |
A1 |
1.01 |
0.95–1.06 |
Continuous |
Traffic on nearest road |
Brunekreef et al., 2009 |
NLCS-AIR Cohort, Europe |
traffic on nearest road (per 10,000 vehicles/day) |
B1 |
1.11 |
0.95–1.26 |
Continuous |
Sum of traffic in 100-m buffer |
Dimakopoulou et al., 2014 |
ESCAPE, Europe |
sum of traffic intensity in 100-m buffer (per 4 x 10⁶ vehicle-m/day) |
A2 |
1.03 |
0.93–1.12 |
Continuous |
Sum of traffic in 100-m buffer |
Brunekreef et al., 2009 |
NLCS-AIR Cohort, Europe |
sum of traffic intensity in 100-m buffer (per 335,000 vehicles/day) |
B2 |
1.21 |
1.02–1.44 |
Continuous |
Traffic density in 150-m buffer |
Cesaroni et al., 2013 |
Rome Longitudinal Study, Europe |
traffic density in 150-m buffer (vehicle-m/day); (0.25–1.63) x 106 (reference: <0.25 x 10⁶) |
C1 |
1.02 |
0.95–1.10 |
Categorical |
Traffic density in 150-m buffer |
Cesaroni et al., 2013 |
Rome Longitudinal Study, Europe |
traffic density in 150-m buffer (vehicle-m/day); (1.63–3.23) x 106 (reference: <0.25 x 10⁶) |
C2 |
1.06 |
0.99–1.14 |
Categorical |
Traffic density in 150-m buffer |
Cesaroni et al., 2013 |
Rome Longitudinal Study, Europe |
traffic density in 150-m buffer (vehicle-m/day); (3.23–6.66) x 106 (reference: <0.25 x 10⁶) |
C3 |
1.02 |
0.95–1.10 |
Categorical |
Traffic density in 150-m buffer |
Cesaroni et al., 2013 |
Rome Longitudinal Study, Europe |
traffic density in 150-m buffer (vehicle-m/day); ≥6.66 x 10⁶ (reference: <0.25 x 10⁶) |
C4 |
1.08 |
1.00–1.15 |
Categorical |
3.4.5 Summary
The association between TRAP and respiratory mortality has been investigated in 20 studies of a cohort design; all but two studies were conducted in the general population. These studies evaluated mortality from respiratory disorders as a group, as well as from more specific causes, including COPD. The majority of these studies were conducted in Europe and Canada and assessed exposure to TRAP by modelling individual traffic-related pollutants. Nearly all the studies accounted for the key confounders of age, sex, SES, and smoking and many considered additional confounders. Pooled analyses were conducted on the general population.
For respiratory mortality (from all respiratory disorders), the pooled analyses indicated a positive association for each of the pollutants evaluated (i.e., NO2, NOx, and PM2.5), and these associations with pooled REs ranging from 1.04 to 1.16 were borderline significant for NO2 and NOx, but non-significant for PM2.5. Heterogeneity was substantial for each of the three pollutants. The evidence for an association was supported by the qualitative analysis of the different metrics for traffic and the road network infrastructure with some demonstration of an exposure-response relationship. For the other pollutants (i.e., NO, PM2.5 abs, BC, PM10, and benzene), the evidence did not support the pooled analyses but was based on a limited number of studies that were not poolable.
Pooled analyses could not be conducted for any specific cause of respiratory mortality. For COPD mortality, most or all of the REs for NO2, NOx, NO, PM2.5, and PM10 were positive and significant or borderline significant. The evidence was limited to only one or two studies for the other specific causes of respiratory mortality.
Chapter 4. Risk characterization and evaluation of causality
4.1 Evidence from long-term epidemiological studies
As a result of the limited number of studies identified for a diverse range of patient populations, characterization of risk and determination of causality were only conducted for the general population.
4.1.1 All-cause mortality
For this assessment, all-cause mortality refers to the total number of deaths as well as deaths that were not the result of an accident or suicide; the two were jointly evaluated as the fraction of non-accidental causes of death is generally high (Chen and Hoek, 2020). Forty-seven studies investigated the association between TRAP and all-cause mortality (section 3.2). The majority of these studies were based on the general population. All used a cohort study design and are therefore able to provide a temporal sequence for the observed health outcome. Mortality was ascertained using registry data, including national death records, insurance records, and hospital records. The studies were conducted mainly in Europe and North America. As such, the results from these studies were considered relevant to a Canadian assessment given the similarities in air pollution mixture, standard of living, health care, climate, and so on between Canada, the USA, and European countries. There were also a smaller number of studies in Asia and Australia. Over 60% of the studies assessed exposure to TRAP by modelling individual pollutants, of which a sufficient number of studies (i.e., equal to or greater than four studies) were identified for NO2, NOx, PM2.5, EC, and PM10 to conduct quantitative analysis. The remaining studies used metrics of traffic and the road network infrastructure as indirect measures of exposure. Nearly all the studies accounted for the key confounders of age, sex, SES, and smoking and many considered additional confounders (e.g., lifestyle, diet, or health status). The majority of the studies were considered to be of high quality based on the RoB analysis.
Pooled analyses were undertaken to objectively examine the consistency, exposure-response relationship, and strength of the association between all-cause mortality and TRAP for the general population. Random effects models were employed to address heterogeneity in the primary studies. The pooled estimates of these analyses are presented in the forest plot below (Figure 4.1) for each of the following traffic-related air pollutants: NO2, NOx, PM2.5, EC, and PM10. Together, these analyses represent 35 unique observations. A positive association was determined for each of the pollutants with pooled REs ranging from 1.02 to 1.06 per increment of pollutant; all were significant or borderline significant. While the magnitudes of the pooled estimates are not readily comparable, all demonstrated an exposure-response relationship. The pooled REs were also robust to subgroup and sensitivity analyses, when applicable. There was an insufficient number of studies conducted in Canada or North America to conduct subgroup analysis by region but when studies were grouped by exposure assessment method, the pooled estimates and level of significance remained largely unchanged. Similarly, the main analysis was robust when excluding studies with high or probably high RoB in the confounder or exposure domain. Confidence in the association between all-cause mortality and TRAP is further supported by having included studies with different population characteristics (e.g., geographical region, age distribution, and size and type of population) in the pooled analyses as potential biases are unlikely to affect REs in the same direction in different populations. Additionally, the pooled analyses were supported by the qualitative analysis of the different metrics for traffic and the road network infrastructure, which also provided some indication of an exposure-response relationship.

Figure 4.1: Text description
Figure 4.1 depicts a forest plot of pooled risk estimates for exposure to TRAP and risk of all-cause mortality in the general population. The x-axis representing pooled estimates and 95% CI ranges from 0.95 to 1.1. The following information is depicted in this figure:
| Data marker | Pollutant | Increment | Pooled RE | 95% CI | n | I2 |
|---|---|---|---|---|---|---|
A |
NO2 |
10 μg/m3 |
1.03 |
1.01–1.05 |
10 |
89.62% |
B |
NOx |
10 μg/m3 |
1.02 |
0.99–1.06 |
6 |
88.02% |
C |
PM2.5 |
10 μg/m3 |
1.06 |
1.03–1.08 |
10 |
0.14% |
D |
EC |
1 μg/m3 |
1.02 |
0.99–1.05 |
5 |
86.03% |
E |
PM10 |
10 μg/m3 |
1.02 |
1.00–1.03 |
4 |
0.00% |
Heterogeneity varied considerably across the pollutants evaluated as depicted in Figure 4.1. Pollutants with greater traffic specificity, such as NO2, NOx, and EC, exhibited substantial heterogeneity compared with PM2.5 and PM10, which displayed no or limited heterogeneity. This was expected given that pollutants with greater traffic specificity have greater spatial variation in TRAP exposure estimates, which vary according to factors such as traffic volume and configuration of the roadway network. For NO2, the substantial heterogeneity observed is consistent with analyses reported by HEI (2022) and Huangfu and Atkinson (2020). As illustrated in the forest plots in section 3.2, heterogeneity was mainly due to the magnitude of the individual REs and not to the direction of the association. Unlike for NOx and EC, where heterogeneity was attributed to one or two REs, no individual RE influenced the heterogeneity in the NO2 analysis. Sources of heterogeneity can be attributed to methodological differences among the primary studies, including exposure assessment methodologies, study location, distinct inclusion and exclusion criteria, population characteristics (e.g., age ranges), and adjustment for confounders and covariates. The variable range of exposures between the primary studies, the sources of TRAP (e.g., the proportion of gasoline vs. diesel vehicles can impact the nature of the TRAP mixture), as well as the large variations in the size of the primary studies may have also contributed to heterogeneity.
4.1.2 Circulatory mortality
Forty-one studies investigated the association between long-term exposure to TRAP and circulatory mortality; all but two studies were based on the general population (section 3.3). They evaluated mortality from CSD as a group and/or from more specific causes. This assessment focused on CSD, CHD, and CBVD due to the limited number of studies identified for the other health outcomes. All the studies pertaining to CSD, CHD, and CBVD were of a cohort study design and, as such, a temporal sequence could be determined for the observed health outcome. Mortality was ascertained using registry data, including national death records, insurance records, and hospital records. The studies were conducted mainly in Europe and North America. As such, the results from these studies were considered relevant to a Canadian assessment, given the similarities in air pollution mixture, standard of living, health care, climate, and so on between Canada, the USA, and European countries. There were also a smaller number of studies in Asia and Australia. Over 60% of the studies assessed exposure to TRAP by modelling individual pollutants; the remaining studies used metrics of traffic and the road network infrastructure as indirect measures of exposure. Nearly all the studies accounted for the key confounders of age, sex, SES, and smoking and many considered additional confounders (e.g., lifestyle, diet, or health status). The majority of the studies were considered to be of high quality based on the RoB analysis.
When a sufficient number of studies (i.e., equal to or greater than four studies) were identified, pooled analyses were undertaken to objectively examine the consistency, exposure-response relationship, and strength of the association between the circulatory mortality health outcomes evaluated (i.e., CSD, CHD, and CBVD) and TRAP for the general population. Random effects models were employed to address heterogeneity in the primary studies. The pooled estimates of these analyses are presented in the forest plot below (Figure 4.2).

Figure 4.2: Text description
Figure 4.2 depicts a forest plot of pooled risk estimates for exposure to TRAP and risk of CSD mortality (at the top), CHD mortality (in the middle), and CBVD mortality (at the bottom) in the general population. The x-axis representing pooled estimates and 95% CI ranges from 0.9 to 1.3. The following information is depicted in this figure:
| Health outcome | Data marker | Pollutant | Increment | Pooled RE | 95% CI | n | I2 |
|---|---|---|---|---|---|---|---|
CSD mortality |
A1 |
NO2 |
10 μg/m3 |
1.05 |
0.98–1.12 |
7 |
96.64% |
CSD mortality |
C1 |
PM2.5 |
10 μg/m3 |
1.06 |
0.96–1.16 |
6 |
40.03% |
CHD mortality |
A2 |
NO2 |
10 μg/m3 |
1.05 |
1.03–1.07 |
9 |
0.40% |
CHD mortality |
B1 |
NOx |
10 μg/m3 |
1.02 |
0.93–1.13 |
4 |
77.84% |
CHD mortality |
C2 |
PM2.5 |
10 μg/m3 |
1.10 |
1.01–1.20 |
6 |
0.09% |
CHD mortality |
D1 |
EC |
1 μg/m3 |
1.03 |
0.99–1.08 |
4 |
81.92% |
CBVD mortality |
A3 |
NO2 |
10 μg/m3 |
1.01 |
0.98–1.04 |
8 |
0.56% |
CBVD mortality |
B2 |
NOx |
10 μg/m3 |
1.00 |
0.96–1.05 |
5 |
0.10% |
CBVD mortality |
C3 |
PM2.5 |
10 μg/m3 |
1.08 |
1.00–1.18 |
4 |
0.03% |
CBVD mortality |
D2 |
EC |
1 μg/m3 |
1.00 |
0.99–1.01 |
4 |
0.00% |
For CSD mortality, quantitative analysis was conducted for two pollutants: NO2, the most direct measure of TRAP exposure, and PM2.5. They represent 13 unique observations. A borderline significant, positive association was determined for both pollutants with pooled REs of 1.05 and 1.06 per 10 μg/m3 increase in pollutant for NO2 and PM2.5, respectively. The pooled REs for NO2 were generally robust to the subgroup, sensitivity, and leave-one-out analyses conducted. They were also supported by the qualitative analysis of NO, EC, and PM10 for which the REs were not pooled, and by the qualitative analysis of the different metrics for traffic and the road network infrastructure, which demonstrated some evidence of an exposure-response relationship. However, mixed results were observed for the qualitative analysis of NOx.
For CHD mortality, pooled REs representing 23 unique observations were derived for NO2, NOx, PM2.5, and EC. A positive association was determined for each of the pollutants with pooled REs ranging from 1.02 to 1.13 per incremental increase in pollutant; all were significant or borderline significant. The subgroup and sensitivity analyses, when conducted, resulted in pooled REs of similar magnitude to the main analysis. Similarly, no NO2 or EC study was found to influence the main analysis but a couple of studies, when omitted, increased the uncertainty around the pooled RE for NOx and PM2.5. This evidence was supported by the qualitative analysis of the different metrics for traffic and the road network infrastructure, which demonstrated a clear exposure-response relationship. In contrast, the evidence from the other pollutants (i.e., NO and PM10) was limited and did not indicate an evident association between CHD mortality and TRAP.
For CBVD mortality, the pooled analyses of the pollutants evaluated (NO2, NOx, PM2.5, and EC) produced mixed results. Specifically, a weak positive association of 1.01 and a stronger positive association of 1.08 per increment of pollutant were identified for NO2 and PM2.5, respectively, while null associations were determined for NOx and EC. Both positive associations were of borderline significance and the pooled REs represented 21 unique observations. Inconsistent results were also observed for the qualitative analysis of the metrics of traffic and the road network infrastructure and evidence from the other pollutants was limited.
Heterogeneity varied considerably across the pollutants and circulatory mortality outcomes evaluated as depicted in Figure 4.2. The pooled estimate for the majority of the exposure-outcome pairs, including NO2 – CHD mortality, PM2.5 – CHD mortality, and TRAP pollutants for which quantitative analysis was undertaken (i.e., NO2, NOx, PM2.5, and EC) – CBVD mortality displayed little or no heterogeneity. In contrast, heterogeneity was considerable (I2 = 96.68%) in the pooled analysis for NO2 and CSD mortality. Two thirds of the REs in the NO2 – CSD mortality analysis had effect estimates in the same direction and no individual RE influenced the heterogeneity. Substantial heterogeneity (I2 = 77.84%) was also observed for the NOx – CHD mortality analysis; this heterogeneity was attributed to one study (Nafstad et al., 2004) as omitting this study from the pooled analysis resulted in minimal heterogeneity. In contrast, omitting one of three studies (Krewski et al., 2009 [NYC cohort]; Carey et al., 2013; Beelen et al., 2014a) from the pooled analysis of PM2.5 and CSD mortality decreased heterogeneity from moderate (I2 = 40.03%) to minimal (I2 ≤ 0.12%). The variability in heterogeneity can be explained by the extent to which a number of factors, including the methodological differences among the primary studies (described in section 4.1.1), the range of exposures between the primary studies, and the size of the primary study, are similar or dissimilar across the pooled studies.
4.1.3 Respiratory mortality
Twenty studies investigated the association between long-term exposure to TRAP and respiratory mortality; all but two studies were based on the general population (section 3.4). They evaluated mortality from all respiratory disorders (respiratory mortality) and/or from more specific causes. Due to the limited number of studies identified for other specific respiratory causes, this assessment only addresses COPD mortality as a specific cause. Similar to the previous health outcomes evaluated in this assessment, all the studies were of a cohort study design and, as such, a temporal sequence could be determined for the observed health outcome. Mortality was ascertained using registry data, including national death records, insurance records, and hospital records. The studies were conducted mainly in Europe and Canada and, as described previously, the results from these studies were considered relevant to a Canadian assessment. The majority of the studies assessed exposure to TRAP by modelling individual pollutants; the remaining studies used metrics of traffic and the road network infrastructure as indirect measures of exposure. Nearly all the studies accounted for the key confounders of age, sex, SES, and smoking and many considered additional confounders (e.g., lifestyle, diet, or health status). The majority of the studies were considered to be of high quality based on the RoB analysis.
For the general population, pooled analyses were conducted for respiratory mortality and long-term exposure to the following three pollutants representing TRAP exposure: NO2, NOx, and PM2.5. Random effects models were employed to address heterogeneity in the primary studies. The pooled estimates of these analyses representing 15 unique observations are presented in the forest plot below (Figure 4.3). A positive association was determined for each of the pollutants with pooled REs ranging from 1.04 to 1.09 per 10 μg/m3 increase in pollutant, indicating consistency and strength in the association as well as an exposure-response relationship. Although the association was borderline significant for NO2 and NOx, it was non-significant and imprecise for PM2.5 as depicted by the large 95% CI. For NO2, the subgroup and sensitivity analyses, when conducted, resulted in pooled REs of similar magnitude and precision to the main analysis. In contrast, for NOx, while the pooled RE was robust, statistical significance was not observed in these analyses. A null association was also noted for NOx when Nafstad et al. (2004) was omitted in the leave-one-out analysis. For PM2.5, the pooled estimates from the subgroup and sensitivity analyses varied from the main analysis and the 95% CI remained large; this was attributed to the limited number of studies (n = 2 or 3) in these analyses. The positive association between respiratory mortality and TRAP exposure was supported by the qualitative analysis of the different metrics for traffic and the road network infrastructure, which demonstrated some evidence of an exposure-response relationship but also included some imprecise associations. The evidence from the qualitative analysis of the other pollutants representing TRAP exposure was limited and did not support an association between respiratory mortality and TRAP exposure.

Figure 4.3: Text description
Figure 4.3 depicts a forest plot of pooled risk estimates for exposure to TRAP and risk of respiratory mortality in the general population. The x-axis representing pooled estimates and 95% CI ranges from 0.8 to 1.5. The following information is depicted in this figure:
| Data marker | Pollutant | Increment | Pooled RE | 95% CI | n | I2 |
|---|---|---|---|---|---|---|
A |
NO2 |
10 μg/m3 |
1.04 |
0.99–1.09 |
7 |
74.36% |
B |
NOx |
10 μg/m3 |
1.05 |
0.93–1.20 |
4 |
66.29% |
C |
PM2.5 |
10 μg/m3 |
1.09 |
0.80–1.49 |
4 |
88.34% |
Heterogeneity was substantial in the pooled REs for all three pollutants (as indicated in Figure 4.3) and remained substantial in all the subgroup and sensitivity analyses that were conducted with an n greater than or equal to 3. Unlike for NO2 where no one study influenced heterogeneity, no heterogeneity in the pooled RE was observed when Nafstad et al. (2004) and Carey et al. (2013) were omitted in the leave-one-out analysis for NOx and PM2.5, respectively. The sources of heterogeneity are described in section 4.1.3.
Pooled analysis was not conducted for COPD mortality and exposure to TRAP as there was an insufficient number of studies from unique cohorts that had the necessary data to conduct a quantitative analysis. The qualitative analysis indicated mostly positive associations that were either significant or borderline significant for NO2, NOx, NO, PM2.5, and PM10.
4.2 Biological evidence
HEI (2010) identified that the health effects of TRAP exposure were mediated through oxidative stress, which occurs when levels of reactive oxygen species (ROS) or free radical generation exceeds the antioxidant defence systems in cells. This leads to oxidative damage to lipids, proteins, and DNA, and can result in impairment of cellular function and cell death. Additionally, the altered redox state of the cell results in activation of gene expression of cytokines, chemokines, and adhesion molecules that participate in inflammatory responses, contributing to the cycle of oxidative tissue injury. HEI (2022) expanded on this and identified numerous inter-related pathways by which TRAP exposure can lead to adverse health outcomes. Inhaled TRAP particles penetrate the lungs and initiate a suite of responses including:
- lung inflammation, which can result in inflammatory mediators entering systemic circulation mediating a systemic inflammatory response;
- direct formation of biological intermediates (e.g., oxidized macromolecules) that can enter systemic circulation and mediate a systemic inflammatory response;
- neuroendocrine activation, which can elicit respiratory symptoms and alter cardiorespiratory function; and
- translocation of particles from the lungs into the blood stream where they can have direct impacts on the vasculature or other organs/tissues in the body.
These mechanisms of action can also lead to cardiovascular impairment, and ultimately circulatory morbidity and mortality, through impacts on the heart (e.g., altered heart rate variability [HRV], arrhythmia), vasculature (e.g., impaired endothelial function, altered vasoconstriction, exacerbation of atherosclerosis), and blood (e.g., increased coagulability, impaired platelet activity).
HEI (2022) also identified that TRAP exposure elicits adverse respiratory outcomes via action on airway oxidative stress and tissue damage, airway reactivity and remodelling, inflammatory pathways and immunological responses, and enhanced sensitization to aeroallergens. The mechanisms of action are complex and are influenced by genetic susceptibility, compromised lung function, and increased susceptibility to bacterial and viral pathogens.
Similar mechanisms of action centred on ROS generation, oxidative stress, and inflammatory responses were identified in the previous risks assessment of TRAP by Health Canada, providing biological plausibility for asthma, allergies, and lung function (Health Canada, 2020) and selected cancer outcomes (Health Canada, 2022c). As noted in those assessments, although the experimental studies mainly considered short-term exposures, the biological responses are informative to provide mechanistic insight into the effects observed in the long-term epidemiological studies.
A review of recent primary literature also identified adverse effects of TRAP exposure on the circulatory and respiratory systems (table summaries provided in section 4 of the supporting documentation). Panel studies that evaluated the biological responses of the circulatory system to real-world traffic exposures identified the following: alterations in HRV, blood pressure, and heart rate; increased biomarkers of systemic oxidative stress, inflammation, and cardiac injury; and/or endothelial dysfunction and arterial stiffness (Mallach et al., 2023; Zhang et al., 2022; Han et al., 2021; Hudda et al., 2021; Wang et al., 2022; Biel et al., 2020; Liang et al., 2018; Cole-Hunter et al., 2016; Kubesch et al., 2015; Ladva et al., 2018; Sarnat et al., 2014; Chu et al., 2016; Mirowsky et al., 2015; Jiang et al., 2016; Weichenthal et al., 2014; Brucker et al., 2013; Bartell et al., 2013; Huang et al., 2013; Chuang et al., 2013; Shields et al., 2013). Most of these panel studies were conducted in the USA (n = 7), followed by Asia (n = 6) and Canada (n = 3). Controlled exposure studies focused on short-term DE exposure and reported HRV and blood pressure alterations, increased biomarkers of systemic oxidative stress and inflammation, vasoconstriction, and altered blood chemistry (Cosselman et al., 2020; Sack et al., 2016; Jiang et al., 2014; Tong et al., 2014; Krishnan et al., 2013). A small number of studies in laboratory animals considered either roadside exposures or particles collected from roadsides and evaluated longer durations (e.g., weeks to months). These studies observed oxidative stress and inflammation in cardiac tissue that was associated with fibrosis (Edwards et al., 2020) and evidence of increased progression of atherosclerosis (Zhao et al., 2020).
For respiratory system impacts of TRAP exposure, the panel studies of real-world traffic exposures and controlled exposure studies of DE reported oxidative stress and inflammation of the airways and/or altered lung function metrics (Orach et al., 2022; Xu et al., 2022; Han et al., 2019; Wang et al., 2022; Jiang et al., 2019; Matt et al., 2016; Sarnat et al., 2014; Zhao et al., 2015). These studies were primarily conducted in Asia. Studies in experimental animals identified that TRAP and traffic particles increased oxidative stress and induced inflammatory responses in lungs and airways; altered lung function and induced airway hyperresponsiveness; and resulted in respiratory tissue changes, including thickening of alveolar walls, smooth muscle hypertrophy, matrix remodelling, and cellular degeneration (Xiao et al., 2022; Jheng et al., 2021; Chuang et al., 2020; Chan et al., 2019; Samara et al., 2015). In addition, in vitro studies in respiratory tissue cell lines reported ROS generation, oxidative stress, inflammatory responses, and reduced cell viability associated with traffic particles (Gong et al., 2022; Van Den Heuvel et al., 2016; Mirowski et al., 2015; Shang et al., 2013).
Considered together, multiple lines of evidence provide a biological basis for adverse health impacts on the circulatory and respiratory systems. For all-cause mortality, cancer along with circulatory and respiratory causes are among the leading non-accidental causes of death in Canada (Statistics Canada, 2022). The mechanistic information summarized in this section provides possible pathways by which TRAP exposure can disrupt or alter cellular and tissue function, which can enhance disease progression and ultimately lead to mortality. Overall, the experimental evidence reviewed in this assessment and Health Canada (2022c) provide the biological plausibility for all-cause as well as circulatory and respiratory mortality.
4.3 Determination of causality
4.3.1 All-cause mortality
For all-cause mortality (sections 3.2 and 4.1.1), based on the following lines of evidence:
- The positive association between long-term TRAP exposure and all-cause mortality determined for each of the air pollutants associated with exposure to TRAP (i.e., NO2, NOx, PM2.5, EC, and PM10). For each of the pollutants, the pooled REs ranged from 1.02 to 1.06 per increment of pollutant and were significant (for NO2 and PM2.5) or borderline significant (for NOx, EC, and PM10), indicating an exposure-response relationship, and consistency in the association across several pollutants.
- Considerable qualitative evidence from the various metrics of traffic and road network infrastructure, which also supported the presence of an exposure-response relationship.
- Support from the biological evidence, which provides a biological basis for adverse health impacts on the circulatory and respiratory systems, as circulatory and respiratory causes are among the leading non-accidental causes of death.
Overall, it is concluded that there is sufficient evidence of a causal relationship between long-term exposure to TRAP and all-cause mortality.
4.3.2 Circulatory mortality
For CSD mortality (sections 3.3 and 4.1.2), based on the following lines of evidence:
- The positive, borderline significant associations between long-term TRAP exposure and CSD mortality determined for NO2 and PM2.5, with pooled REs of 1.05 and 1.06 per increment, respectively, indicating an exposure-relationship and consistency in the evidence. This is supported by qualitative analysis from other TRAP pollutants (i.e., BC, PM2.5 abs, PM10, and benzene), noting the limited evidence for these pollutants.
- Support from the qualitative evidence based on the various metrics of traffic and road network infrastructure, which also indicated the presence of an exposure-response relationship.
- Support from the biological evidence, which provides a biological basis for adverse health impacts on the circulatory system.
Overall, it is concluded that there is sufficient evidence that the relationship between long-term TRAP exposure and CSD mortality is likely to be causal.
For CHD mortality (sections 3.3 and 4.1.2), based on the following lines of evidence:
- The positive, significant association between long-term TRAP exposure and CHD mortality determined for NO2 and PM2.5 with pooled REs of 1.05 and 1.10 per increment, respectively, and borderline significant associations for NOx and EC with pooled REs of 1.02 and 1.03 per increment, respectively. These quantitative syntheses indicate an exposure-relationship and consistency in the evidence for these pollutants; however, mixed results were noted from the limited studies of NO and PM10.
- Support from the qualitative evidence based on the various metrics of traffic and road network infrastructure, which also indicated the presence of an exposure-response relationship.
- Support from the biological evidence, which provides a biological basis for adverse health impacts on the circulatory system.
Overall, it is concluded that there is sufficient evidence that the relationship between long-term TRAP exposure and CHD mortality is likely to be causal.
For CBVD mortality (sections 3.3 and 4.1.2), based on the following lines of evidence:
- The mixed results between long-term TRAP exposure and CBVD mortality for the TRAP pollutants. Specifically, a positive, borderline significant association was determined for NO2 and PM2.5 with REs of 1.01 and 1.08 per increment, respectively; however, a null association was identified for NOx and EC. The qualitative analysis for NO and PM10 was limited to support an association.
- Limited support from the qualitative evidence based on the various metrics of traffic and road network infrastructure, with no clear evidence of an exposure-response relationship.
- Support from the biological evidence, which provides a biological basis for adverse health impacts on the circulatory system.
Overall, it is concluded that there is inadequate evidence to infer a causal relationship between long-term TRAP exposure and CBVD mortality.
4.3.3 Respiratory mortality
For respiratory mortality (sections 3.4 and 4.1.3), based on the following lines of evidence:
- The positive, borderline significant associations between long-term TRAP exposure and respiratory mortality determined for NO2 and NOx, with pooled REs of 1.04 and 1.05 per increment, respectively, indicating an exposure-relationship and consistency in the evidence. For PM2.5, a positive association was identified, with a pooled RE of 1.09; however, it was non-significant and imprecise. Limited qualitative evidence was noted for the other pollutants (i.e., NO, PM2.5 abs, BC, PM10, and benzene).
- Support from the qualitative evidence based on the various metrics of traffic and road network infrastructure, which also suggested the presence of an exposure-response relationship.
- Support from the biological evidence, which provides a biological basis for adverse health impacts on the respiratory system.
Overall, it is concluded that the evidence is suggestive of, but not sufficient to infer, a causal relationship between long-term TRAP exposure and respiratory mortality.
For COPD mortality (sections 3.4 and 4.1.3), based on the following lines of evidence:
- Although a quantitative synthesis could not be conducted for COPD mortality, most or all of the REs for the various TRAP pollutants (i.e., NO2, NOx, NO, PM2.5, and PM10) were positive and significant or borderline significant.
- Support from the biological evidence, which provides a biological basis for adverse health impacts on the respiratory system.
Overall, it is concluded that the evidence is suggestive of, but not sufficient to infer, a causal relationship between long-term TRAP exposure and COPD mortality.
Chapter 5. Conclusion
Using systematic review techniques, including meta-analysis, this risk assessment evaluated the epidemiological literature regarding the associations between long-term exposure to TRAP and mortality. These associations were assessed along with relevant biological evidence gathered from mechanistic data from recent risk assessments of TRAP and recent primary literature as part of a weight of evidence approach to determine the causal role of long-term TRAP exposure in the health endpoints of all-cause mortality, CSD mortality, CHD mortality, CBVD mortality, respiratory mortality, and COPD mortality.
Based on the overall weight of evidence, it is concluded that:
- there is sufficient evidence of a causal relationship between long-term exposure to TRAP and all-cause mortality;
- there is sufficient evidence that the relationship between long-term TRAP exposure and CSD mortality is likely to be causal;
- there is sufficient evidence that the relationship between long-term TRAP exposure and CHD mortality is likely to be causal;
- there is inadequate evidence to infer a causal relationship between long-term TRAP exposure and CBVD mortality;
- the evidence is suggestive of, but not sufficient to infer, a causal relationship between long-term TRAP exposure and respiratory mortality;
- the evidence is suggestive of, but not sufficient to infer, a causal relationship between long-term TRAP exposure and COPD mortality.
Key uncertainties and gaps
The conclusions of this risk assessment were formed in consideration of the epidemiological and biological literature evaluating the health effects associated with exposure to TRAP pollutants. For the causes of mortality considered in this assessment, the scientific evidence was mainly based on NO2, NOx, PM2.5, PM10, EC, traffic proximity, and traffic density. Although these markers are typically used to assess or quantify TRAP exposure, a definitive causative agent for the health impacts was not identified from the studies. Given the expected high degree of correlation between the individual TRAP components, further studies and use of multi-pollutant models would be required to identify the causative agent or agents within the TRAP mixture responsible for the health effects.
The exposure assessment framework described in section 2.1.2 was stringently applied to confirm TRAP specificity. As such, between-cities analyses and national scale studies with no city-specific adjustment were excluded from this assessment as they are more influenced by climate, topography, presence of point-source emitters, and overall city size (Crouse et al., 2015). While this limited the evidence base for this assessment, it allowed identification of studies in which the exposure contrasts were more likely attributable to TRAP sources. Additional studies with intra-city analyses would help to expand the TRAP-specific literature database. As most of the primary studies estimated TRAP exposures at the residential address only, the accuracy by which TRAP exposure is assigned could also be improved in future studies by considering the mobility of the study participants and/or residential address changes.
The quantitative analyses in this risk assessment were highly comparable to those reported by HEI (2022), which is expected given the similarities in the approaches taken. However, key differences in the analyses were noted, including differences in the literature search periods and application of the inclusion/exclusion criteria. This led to some differences in the studies included in the quantitative synthesis and resulted in small variations in some of the pooled estimates.
In nearly all the studies evaluated, mortality from all causes and specific causes were ascertained using registry data and/or causes of mortality classified based on ICD codes. Mortality registries are generally complete, as is linkage of individuals to these registries. Of the small number of studies that did not rely on registry data, the information was taken from medical records, which were also considered to be reliable sources of this information. Mortality from a broad group of diseases such as circulatory and respiratory diseases are also less likely to be misclassified compared with specific causes of diseases such as CHD, CBVD, and COPD. As ICD codes have been updated over time and studies have used different versions of this code, there may be some inconsistencies on how specific causes of circulatory and respiratory mortality were classified. Additionally, five studies reported cardiopulmonary or cardiorespiratory mortality, without presenting the results for circulatory and respiratory mortality separately. These studies were considered a measure of circulatory mortality, as these causes dominate the combined category but could also result in the misclassification of the outcomes.
REs from all studies but one had some level of adjustment for confounders (e.g., age, sex, SES, smoking, and lifestyle factors); however, the level of adjustment was variable between the studies. Consistency in the inclusion and specification of the key confounders would improve the robustness of the quantitative syntheses. Additionally, the potential contributing role of environmental features such as traffic noise, green space, and neighbourhood walkability in the outcomes were considered in only a limited number of studies. Further studies exploring the potential confounding effects of these factors could help refine the risk attributable to TRAP exposure.
Although a substantial body of primary literature was identified for TRAP exposure and mortality, the size of the evidence base varied considerably depending on type of mortality. For all-cause mortality, the literature database was well developed, resulting in the most number of exposure-outcome pairs and unique observations, thus providing greater certainty in the causality conclusion. In comparison, the causality conclusions drawn for circulatory and respiratory mortality and their subtypes were based on a less developed epidemiological literature database, resulting in fewer exposure-outcome pairs and unique observations. While the overall evidence was more limited, the consistency, strength, and exposure response of the association was sufficient to evaluate the relationship and determine the level of causality. For other causes of mortality such as CBVD, CHD, MI, and HF, only a limited number of epidemiological studies were identified; as a result, the causal relationship could not be determined. Additional studies on these health outcomes would be useful in further characterizing and understanding the role of TRAP exposure in mortality. Similarly, only a limited number of studies were conducted on populations that may be disproportionately impacted, including patient populations; as such, this was inadequate to support a conclusion for all-cause or any specific causes of mortality. Furthermore, additional studies addressing the potential sex-based differences in risk of mortality from specific causes of mortality (e.g., higher cardiovascular risk in males) and the influence of TRAP exposure on these differential risks would be informative.
For this risk assessment, the biological and mechanistic evidence was derived from existing reviews of TRAP by Health Canada (2020, 2022c) and HEI (2010, 2022) as well as a search of the primary literature from the past 10 years (i.e., 2013–2023). Based on the scientific evidence considered in this assessment, additional biological studies would be beneficial to further elucidate the mechanisms of action for the role of TRAP in mortality, particularly with respect to the effects of long-term exposure. At present, the majority of the experimental evidence is based on short-term exposures and supports a role for TRAP exposure in cellular and tissue dysfunction and enhancement of disease progression, which can ultimately lead to mortality. From the experimental evidence reviewed in this risk assessment, the proposed mechanisms of action have identified the central role of inflammation and oxidative stress, suggesting a possible overlap or one or more shared pathways of effect. A more thorough understanding of the mechanism would also help identify the component or components of TRAP that are the causative agent or agents of the observed health effects. This information could be used to inform policies or programs that would reduce or mitigate exposure to one or more specific pollutants.
References
Alexeeff SE, Roy A, Shan J, et al. High-resolution mapping of traffic related air pollution with Google street view cars and incidence of cardiovascular events within neighborhoods in Oakland, CA. Environ Health. 2018;17(1):38.
Andersson EM, Ögren M, Molnár P, Segersson D, Rosengren A, Stockfelt L. Road traffic noise, air pollution and cardiovascular events in a Swedish cohort. Environ Res. 2020;185:109446.
Badaloni C, Cesaroni G, Cerza F, Davoli M, Brunekreef B, Forastiere F. Effects of long-term exposure to particulate matter and metal components on mortality in the Rome longitudinal study. Environ Int. 2017;109:146-154.
Barratt B, Lee M, Wong P, et al. A Dynamic Three-Dimensional Air Pollution Exposure Model for Hong Kong. Res Rep Health Eff Inst. 2018;(194):1-65.
Bartell SM, Longhurst J, Tjoa T, Sioutas C, Delfino RJ. Particulate air pollution, ambulatory heart rate variability, and cardiac arrhythmia in retirement community residents with coronary artery disease. Environ Health Perspect. 2013;121(10):1135-1141.
Bauleo L, Bucci S, Antonucci C, et al. Long-term exposure to air pollutants from multiple sources and mortality in an industrial area: a cohort study. Occup Environ Med. 2019;76(1):48-57.
Beelen R, Raaschou-Nielsen O, Stafoggia M, et al. Effects of long-term exposure to air pollution on natural-cause mortality: an analysis of 22 European cohorts within the multicentre ESCAPE project. Lancet. 2014a;383(9919):785-795.
Beelen R, Stafoggia M, Raaschou-Nielsen O, et al. Long-term exposure to air pollution and cardiovascular mortality: an analysis of 22 European cohorts. Epidemiology. 2014b;25(3):368-378.
Beelen R, Hoek G, Houthuijs D, et al. The joint association of air pollution and noise from road traffic with cardiovascular mortality in a cohort study. Occup Environ Med. 2009;66(4):243-250.
Beelen R, Hoek G, van den Brandt PA, et al. Long-term effects of traffic-related air pollution on mortality in a Dutch cohort (NLCS-AIR study). Environ Health Perspect. 2008;116(2):196-202.
Biel R, Danieli C, Shekarrizfard M, et al. Acute cardiovascular health effects in a panel study of personal exposure to traffic-related air pollutants and noise in Toronto, Canada. Sci Rep. 2020;10(1):16703.
Blount RJ, Pascopella L, Catanzaro DG, et al. Traffic-Related Air Pollution and All-Cause Mortality during Tuberculosis Treatment in California. Environ Health Perspect. 2017;125(9):097026.
Bradford Hill A. The environment and disease: Association or causation? Proc R Soc Med 1965;58(5):295-300.
Brucker N, Moro AM, Charão MF, et al. Biomarkers of occupational exposure to air pollution, inflammation and oxidative damage in taxi drivers. Sci Total Environ. 2013;463-464:884-893.
Brunekreef B, Beelen R, Hoek G, et al. Effects of long-term exposure to traffic-related air pollution on respiratory and cardiovascular mortality in the Netherlands: the NLCS-AIR study. Res Rep Health Eff Inst. 2009;(139):5-89.
Cakmak S, Hebbern C, Vanos J, Crouse DL, Tjepkema M. Exposure to traffic and mortality risk in the 1991-2011 Canadian Census Health and Environment Cohort (CanCHEC). Environ Int. 2019;124:16-24.
Canada. Canadian Environmental Protection Act Priority Substances List assessment report: Benzene. Ottawa, ON: Environment Canada, Health Canada; 1993. http://www.hc-sc.gc.ca/ewh-semt/alt_formats/hecs-sesc/pdf/pubs/contaminants/psl1-lsp1/benzene/benzene_e.pdf.
Carey IM, Atkinson RW, Kent AJ, van Staa T, Cook DG, Anderson HR. Mortality associations with long-term exposure to outdoor air pollution in a national English cohort. Am J Respir Crit Care Med. 2013;187(11):1226-1233.
Carlsen HK, Andersson EM, Molnár P, et al. Incident cardiovascular disease and long-term exposure to source-specific air pollutants in a Swedish cohort. Environ Res. 2022;209:112698.
CCME. Canada-wide Standard for Benzene 2010 Final Report. Winnipeg, MB, Canada: Canadian Council of Ministers of the Environment. 2012. https://www.ccme.ca/files/Resources/air/benzene/2010_benzene_rpt_final_e.pdf.
Cesaroni G, Badaloni C, Gariazzo C, et al. Long-term exposure to urban air pollution and mortality in a cohort of more than a million adults in Rome. Environ Health Perspect. 2013;121(3):324-331.
Cesaroni G, Porta D, Badaloni C, et al. Nitrogen dioxide levels estimated from land use regression models several years apart and association with mortality in a large cohort study. Environ Health. 2012;11:48.
Chan YL, Wang B, Chen H, et al. Pulmonary inflammation induced by low-dose particulate matter exposure in mice. Am J Physiol Lung Cell Mol Physiol. 2019;317(3):L424-L430.
Chen J, Hoek G. Long-term exposure to PM and all-cause and cause-specific mortality: A systematic review and meta-analysis. Environ Int. 2020;143:105974.
Chen H, Goldberg MS, Burnett RT, Jerrett M, Wheeler AJ, Villeneuve PJ. Long-term exposure to traffic-related air pollution and cardiovascular mortality. Epidemiology. 2013;24(1):35-43.
Chu JH, Hart JE, Chhabra D, Garshick E, Raby BA, Laden F. Gene expression network analyses in response to air pollution exposures in the trucking industry. Environ Health. 2016;15(1):101.
Chuang HC, Chen YY, Hsiao TC, et al. Alteration in angiotensin-converting enzyme 2 by PM1 during the development of emphysema in rats. ERJ Open Res. 2020;6(4):00174-2020.
Chuang HC, Lin LY, Hsu YW, Ma CM, Chuang KJ. In-car particles and cardiovascular health: an air conditioning-based intervention study. Sci Total Environ. 2013;452-453:309-313.
Cohen G, Steinberg DM, Keinan-Boker L, et al. Preexisting coronary heart disease and susceptibility to long-term effects of traffic-related air pollution: A matched cohort analysis. Eur J Prev Cardiol. 2021;28(13):1475-1486.
Cohen G, Steinberg DM, Yuval, et al. Cancer and mortality in relation to traffic-related air pollution among coronary patients: Using an ensemble of exposure estimates to identify high-risk individuals. Environ Res. 2019;176:108560.
Cole-Hunter T, Weichenthal S, Kubesch N, et al. Impact of traffic-related air pollution on acute changes in cardiac autonomic modulation during rest and physical activity: a cross-over study. J Expo Sci Environ Epidemiol. 2016;26(2):133-140.
Cosselman KE, Allen J, Jansen KL, et al. Acute exposure to traffic-related air pollution alters antioxidant status in healthy adults. Environ Res. 2020;191:110027.
Crouse DL, Peters PA, Villeneuve PJ, et al. Within- and between-city contrasts in nitrogen dioxide and mortality in 10 Canadian cities; a subset of the Canadian Census Health and Environment Cohort (CanCHEC). J Expo Sci Environ Epidemiol. 2015;25(5):482-489.
Davies HT, Crombie IK, Tavakoli M. When can odds ratios mislead? BMJ. 1998 Mar 28;316(7136):989-91.
de Hoogh K, Korek M, Vienneau D, Keuken M, Kukkonen J, Nieuwenhuijsen MJ, Badaloni C, Beelen R, Bolignano A, Cesaroni G, Pradas MC. Comparing land use regression and dispersion modelling to assess residential exposure to ambient air pollution for epidemiological studies. Environment international. 2014 Dec 1;73:382-92.
Desikan A, Crichton S, Hoang U, et al. Effect of exhaust- and nonexhaust-related components of particulate matter on long-term survival after stroke. Stroke. 2016;47(12):2916-2922.
Dimakopoulou K, Samoli E, Beelen R, et al. Air pollution and nonmalignant respiratory mortality in 16 cohorts within the ESCAPE project. Am J Respir Crit Care Med. 2014;189(6):684-696.
Dirgawati M, Hinwood A, Nedkoff L, et al. Long-term exposure to low air pollutant concentrations and the relationship with all-cause mortality and stroke in older men. Epidemiology. 2019;30 Suppl 1:S82-S89.
DuPré NC, Hart JE, Holmes MD, et al. Particulate matter and traffic-related exposures in relation to breast cancer survival. Cancer Epidemiol Biomarkers Prev. 2019;28(4):751-759.
Edwards S, Zhao G, Tran J, et al. Pathological cardiopulmonary evaluation of rats chronically exposed to traffic-related air pollution. Environ Health Perspect. 2020;128(12):127003.
Finkelstein MM, Jerrett M, Sears MR. Environmental inequality and circulatory disease mortality gradients. J Epidemiol Community Health. 2005;59(6):481-487.
Finkelstein MM, Jerrett M, Sears MR. Traffic air pollution and mortality rate advancement periods. Am J Epidemiol. 2004;160(2):173-177.
Gan WQ, FitzGerald JM, Carlsten C, Sadatsafavi M, Brauer M. Associations of ambient air pollution with chronic obstructive pulmonary disease hospitalization and mortality. Am J Respir Crit Care Med. 2013;187(7):721-727.
Gan WQ, Koehoorn M, Davies HW, Demers PA, Tamburic L, Brauer M. Long-term exposure to traffic-related air pollution and the risk of coronary heart disease hospitalization and mortality. Environ Health Perspect. 2011;119(4):501-507.
Gan WQ, Tamburic L, Davies HW, Demers PA, Koehoorn M, Brauer M. Changes in residential proximity to road traffic and the risk of death from coronary heart disease. Epidemiology. 2010;21(5):642-649.
Gehring U, Heinrich J, Krämer U, et al. Long-term exposure to ambient air pollution and cardiopulmonary mortality in women. Epidemiology. 2006;17(5):545-551.
Goeminne PC, Bijnens E, Nemery B, Nawrot TS, Dupont LJ. Impact of traffic related air pollution indicators on non-cystic fibrosis bronchiectasis mortality: a cohort analysis. Respir Res. 2014;15(1):108.
Gong X, Zhu L, Liu J, et al. Exposure to traffic-related fine particulate matter 2.5 causes respiratory damage via peroxisome proliferator-activated receptor gamma-regulated inflammation. Environ Toxicol. 2022;37(9):2178-2188.
Hadley MB, Nalini M, Adhikari S, et al. Spatial environmental factors predict cardiovascular and all-cause mortality: Results of the SPACE study. PLoS One. 2022;17(6):e0269650.
Hamra GB, Laden F, Cohen AJ, Raaschou-Nielsen O, Brauer M, Loomis D. Lung cancer and exposure to nitrogen dioxide and traffic: A systematic review and meta-analysis. Environ Health Perspect. 2015;123(11):1107-1112.
Han B, Zhao R, Zhang N, et al. Acute cardiovascular effects of traffic-related air pollution (TRAP) exposure in healthy adults: A randomized, blinded, crossover intervention study. Environ Pollut. 2021;288:117583.
Han B, Zhang N, Zhao R, et al. A randomized, double-blind, crossover intervention study of traffic-related air pollution and airway inflammation in healthy adults. Environ Epidemiol. 2019;3(5):e066.
Hanigan IC, Rolfe MI, Knibbs LD, et al. All-cause mortality and long-term exposure to low level air pollution in the "45 and up study" cohort, Sydney, Australia, 2006–2015. Environ Int. 2019;126:762-770.
Hart JE, Chiuve SE, Laden F, Albert CM. Roadway proximity and risk of sudden cardiac death in women. Circulation. 2014;130(17):1474-1482.
Hart JE, Rimm EB, Rexrode KM, Laden F. Changes in traffic exposure and the risk of incident myocardial infarction and all-cause mortality. Epidemiology. 2013;24(5):734-742.
Health Canada. Exposure to traffic-related air pollution in Canada: an assessment of population proximity to roadways. Ottawa, ON, Canada: Health Canada; 2022a. https://publications.gc.ca/collections/collection_2022/sc-hc/H144-99-2022-eng.pdf.
Health Canada. Health impacts of traffic-related air pollution. Ottawa, ON, Canada: Health Canada; 2022b. https://publications.gc.ca/collections/collection_2022/sc-hc/H144-91-2022-eng.pdf.
Health Canada. Traffic-related air pollution: an umbrella review-based human health risk assessment on selected cancer types. Ottawa, ON, Canada: Health Canada; 2022c. https://publications.gc.ca/collections/collection_2022/sc-hc/H144-97-2022-eng.pdf.
Health Canada. Lung cancer and ambient PM2.5 in Canada: a systematic review and meta-analysis. Ottawa, ON, Canada: Health Canada; 2022d. https://publications.gc.ca/collections/collection_2022/sc-hc/H144-98-2022-eng.pdf
Health Canada. Traffic-related air pollution: asthma, allergies, and lung function. Ottawa, ON, Canada: Health Canada; 2020. http://publications.gc.ca/site/eng/9.887339/publication.html.
Health Canada. Human health risk assessment for gasoline exhaust. Ottawa, ON, Canada: Health Canada; 2017. http://publications.gc.ca/collections/collection_2017/sc-hc/H144-52-2017-eng.pdf.
Health Canada. Human health risk assessment for ambient nitrogen dioxide. Ottawa, ON, Canada: Health Canada; 2016a. http://publications.gc.ca/collections/collection_2016/sc-hc/H114-31-2016-eng.pdf.
Health Canada. Human health risk assessment for diesel exhaust. Ottawa, ON, Canada: Health Canada; 2016b. http://publications.gc.ca/collections/collection_2016/sc-hc/H129-60-2016-eng.pdf.
Health Effects Institute. Protocol for a systematic review and meta-analysis of selected health effects of long-term exposure to traffic-related air pollution. Boston, MA: Health Effects Institute; 2019.
HEI Panel on the Health Effects of Long-Term Exposure to Traffic-Related Air Pollution. Systematic review and meta-analysis of selected health effects of long-term exposure to traffic-related air pollution. HEI Special Report 23. Boston, MA: Health Effects Institute; 2022.
HEI Panel on the Health Effects of Traffic-Related Air Pollution. Traffic-related air pollution: a critical review of the literature on emissions, exposure, and health effects. HEI Special Report 17. Boston, MA: Health Effects Institute; 2010.
Heinrich J, Thiering E, Rzehak P, et al. Long-term exposure to NO2 and PM10 and all-cause and cause-specific mortality in a prospective cohort of women. Occup Environ Med. 2013;70(3):179-186.
Higgins JPT, Thomas J, Chandler J, et al. (editors). Cochrane Handbook for Systematic Reviews of Interventions version 6.3 (updated February 2022). Cochrane, 2022. Available from www.training.cochrane.org/handbook.
Higgins JPT, Altman DG, Gøtzsche PC, et al. The Cochrane Collaboration's tool for assessing risk of bias in randomised trials. BMJ. 2011;343:d5928.
Hoek G, Brunekreef B, Goldbohm S, Fischer P, van den Brandt PA. Association between mortality and indicators of traffic-related air pollution in the Netherlands: a cohort study. Lancet. 2002;360(9341):1203-1209.
Huang J, Deng F, Wu S, Lu H, Hao Y, Guo X. The impacts of short-term exposure to noise and traffic-related air pollution on heart rate variability in young healthy adults. J Expo Sci Environ Epidemiol. 2013;23(5):559-564.
Huangfu P, Atkinson R. Long-term exposure to NO2 and O3 and all-cause and respiratory mortality: A systematic review and meta-analysis. Environ Int. 2020;144:105998.
Hudda N, Eliasziw M, Hersey SO, et al. Effect of reducing ambient traffic-related air pollution on blood pressure: a randomized crossover trial. Hypertension. 2021;77(3):823-832.
Huss A, Spoerri A, Egger M, Röösli M; Swiss National Cohort Study Group. Aircraft noise, air pollution, and mortality from myocardial infarction. Epidemiology. 2010;21(6):829-836.
Jerrett M, Finkelstein MM, Brook JR, et al. A cohort study of traffic-related air pollution and mortality in Toronto, Ontario, Canada. Environ Health Perspect. 2009;117(5):772-777.
Jerrett M, Burnett RT, Ma R, et al. Spatial analysis of air pollution and mortality in Los Angeles. Epidemiology. 2005;16(6):727-736.
Jheng YT, Putri DU, Chuang HC, et al. Prolonged exposure to traffic-related particulate matter and gaseous pollutants implicate distinct molecular mechanisms of lung injury in rats. Part Fibre Toxicol. 2021;18(1):24.
Jiang Y, Niu Y, Xia Y, et al. Effects of personal nitrogen dioxide exposure on airway inflammation and lung function. Environ Res. 2019;177:108620.
Jiang S, Bo L, Gong C, et al. Traffic-related air pollution is associated with cardio-metabolic biomarkers in general residents. Int Arch Occup Environ Health. 2016;89(6):911-921.
Jiang R, Jones MJ, Sava F, Kobor MS, Carlsten C. Short-term diesel exhaust inhalation in a controlled human crossover study is associated with changes in DNA methylation of circulating mononuclear cells in asthmatics. Part Fibre Toxicol. 2014;11:71.
Judek S, Stieb D, Xi G, Jovic B, Edwards B. Air Quality Benefits Assessment Tool (AQBAT) – User Guide – Version 3. Healthy Environments and Consumer Safety Branch, Health Canada. 2019. 205 pp.
Khreis H, Nieuwenhuijsen MJ. Traffic-related air pollution and childhood asthma: Recent advances and remaining gaps in the exposure assessment methods. Int J Environ Res Public Health. 2017;14(3):312.
Khreis H, Kelly C, Tate J, Parslow R, Lucas K, Nieuwenhuijsen M. Exposure to traffic-related air pollution and risk of development of childhood asthma: A systematic review and meta-analysis. Environ Int. 2017;100:1-31.
Krewski D, Jerrett M, Burnett RT, et al. Extended follow-up and spatial analysis of the American Cancer Society study linking particulate air pollution and mortality. Res Rep Health Eff Inst. 2009;(140):5-136.
Krishnan RM, Sullivan JH, Carlsten C, et al. A randomized cross-over study of inhalation of diesel exhaust, hematological indices, and endothelial markers in humans. Part Fibre Toxicol. 2013;10:7.
Kubesch N, De Nazelle A, Guerra S, et al. Arterial blood pressure responses to short-term exposure to low and high traffic-related air pollution with and without moderate physical activity. Eur J Prev Cardiol. 2015;22(5):548-557.
Kulick ER, Wellenius GA, Boehme AK, Sacco RL, Elkind MS. Residential proximity to major roadways and risk of incident ischemic stroke in NOMAS (The Northern Manhattan Study). Stroke. 2018;49(4):835-841.
Ladva CN, Golan R, Liang D, et al. Particulate metal exposures induce plasma metabolome changes in a commuter panel study. PLoS One. 2018;13(9):e0203468.
Lam J, Sutton P, Kalkbrenner A, et al. A systematic review and meta-analysis of multiple airborne pollutants and autism spectrum disorder. PLoS One. 2016;11(9):e0161851.
Liang D, Moutinho JL, Golan R, et al. Use of high-resolution metabolomics for the identification of metabolic signals associated with traffic-related air pollution. Environ Int. 2018;120:145-154.
Maheswaran R, Pearson T, Smeeton NC, Beevers SD, Campbell MJ, Wolfe CD. Impact of outdoor air pollution on survival after stroke: population-based cohort study. Stroke. 2010;41(5):869-877.
Mallach G, Shutt R, Thomson EM, Valcin F, Kulka R, Weichenthal S. Randomized cross-over study of in-vehicle cabin air filtration, air pollution exposure, and acute changes to heart rate variability, saliva cortisol, and cognitive function. Environ Sci Technol. 2023;57(8):3238-3247.
Matt F, Cole-Hunter T, Donaire-Gonzalez D, et al. Acute respiratory response to traffic-related air pollution during physical activity performance. Environ Int. 2016;97:45-55.
Matz CJ, Egyed M, Hocking R, Seenundun S, Charman N, Edmonds N. Human health effects of traffic-related air pollution (TRAP): A scoping review protocol. Syst Rev. 2019;8:223.
Medina-Ramón M, Goldberg R, Melly S, Mittleman MA, Schwartz J. Residential exposure to traffic-related air pollution and survival after heart failure. Environ Health Perspect. 2008;116(4):481-485.
Mirowsky JE, Peltier RE, Lippmann M, et al. Repeated measures of inflammation, blood pressure, and heart rate variability associated with traffic exposures in healthy adults. Environ Health. 2015;14:66.
Naess Ø, Nafstad P, Aamodt G, Claussen B, Rosland P. Relation between concentration of air pollution and cause-specific mortality: four-year exposures to nitrogen dioxide and particulate matter pollutants in 470 neighborhoods in Oslo, Norway. Am J Epidemiol. 2007;165(4):435-443.
Nafstad P, Håheim LL, Wisløff T, et al. Urban air pollution and mortality in a cohort of Norwegian men. Environ Health Perspect. 2004;112(5):610-615.
Nawrot TS, Vos R, Jacobs L, et al. The impact of traffic air pollution on bronchiolitis obliterans syndrome and mortality after lung transplantation. Thorax. 2011;66(9):748-754.
Nieuwenhuijsen MJ, Gascon M, Martinez D, et al. Air pollution, noise, blue space, and green space and premature mortality in Barcelona: a mega cohort. Int J Environ Res Public Health. 2018;15(11):2405.
Orach J, Rider CF, Yuen ACY, Carlsten C. Concentration-dependent increase in symptoms due to diesel exhaust in a controlled human exposure study. Part Fibre Toxicol. 2022;19(1):66.
Pan WC, Yeh SY, Wu CD, et al. Association between traffic count and cardiovascular mortality: A prospective cohort study in Taiwan. J Epidemiol. 2021;31(5):343-349.
R Core Team. R: A language and environment for statistical computing. In: R Foundation for Statistical Computing [Internet]. 2021 [cited 06 Sept 2022]. Available: https://www.R-project.org/.
Raaschou-Nielsen O, Andersen ZJ, Jensen SS, et al. Traffic air pollution and mortality from cardiovascular disease and all causes: a Danish cohort study. Environ Health. 2012;11:60.
Rosenlund M, Bellander T, Nordquist T, Alfredsson L. Traffic-generated air pollution and myocardial infarction. Epidemiology. 2009;20(2):265-271.
Rosenlund M, Picciotto S, Forastiere F, Stafoggia M, Perucci CA. Traffic-related air pollution in relation to incidence and prognosis of coronary heart disease. Epidemiology. 2008;19(1):121-128.
Rosenlund M, Berglind N, Pershagen G, Hallqvist J, Jonson T, Bellander T. Long-term exposure to urban air pollution and myocardial infarction. Epidemiology. 2006;17(4):383-390.
Ruttens D, Verleden SE, Bijnens EM, et al. An association of particulate air pollution and traffic exposure with mortality after lung transplantation in Europe. Eur Respir J. 2017;49(1):1600484.
Sack CS, Jansen KL, Cosselman KE, et al. Pretreatment with antioxidants augments the acute arterial vasoconstriction caused by diesel exhaust inhalation. Am J Respir Crit Care Med. 2016;193(9):1000-1007.
Samara C, Kouras A, Kaidoglou K, et al. Ultrastructural alterations in the mouse lung caused by real-life ambient PM10 at urban traffic sites. Sci Total Environ. 2015;532:327-336.
Sarnat JA, Golan R, Greenwald R, et al. Exposure to traffic pollution, acute inflammation and autonomic response in a panel of car commuters. Environ Res. 2014;133:66-76.
Shang Y, Fan L, Feng J, et al. Genotoxic and inflammatory effects of organic extracts from traffic-related particulate matter in human lung epithelial A549 cells: the role of quinones. Toxicol In Vitro. 2013;27(2):922-931.
Shields KN, Cavallari JM, Hunt MJ, et al. Traffic-related air pollution exposures and changes in heart rate variability in Mexico City: a panel study. Environ Health. 2013;12:7.
So R, Jørgensen JT, Lim YH, et al. Long-term exposure to low levels of air pollution and mortality adjusting for road traffic noise: A Danish Nurse Cohort study. Environ Int. 2020;143:105983.
Statistics Canada. Leading causes of death, total population, by age group. Table: 13-10-0394-01. 2022. Leading causes of death, total population, by age group (statcan.gc.ca)
Stieb DM, Berjawi R, Emode M, et al. Systematic review and meta-analysis of cohort studies of long term outdoor nitrogen dioxide exposure and mortality. PLoS One. 2021;16(2):e0246451.
Stockfelt L, Andersson EM, Molnár P, et al. Long term effects of residential NO(x) exposure on total and cause-specific mortality and incidence of myocardial infarction in a Swedish cohort. Environ Res. 2015;142:197-206.
Tong H, Rappold AG, Caughey M, et al. Cardiovascular effects caused by increasing concentrations of diesel exhaust in middle-aged healthy GSTM1 null human volunteers. Inhal Toxicol. 2014;26(6):319-326.
Tonne C, Halonen JI, Beevers SD, et al. Long-term traffic air and noise pollution in relation to mortality and hospital readmission among myocardial infarction survivors. Int J Hyg Environ Health. 2016;219(1):72-78.
US EPA. Preamble to the Integrated Science Assessments (ISA). EPA/600/R-15/067. Washington, DC: United States Environmental Protection Agency; 2015.
Van Den Heuvel R, Den Hond E, Govarts E, et al. Identification of PM10 characteristics involved in cellular responses in human bronchial epithelial cells (Beas-2B). Environ Res. 2016;149:48-56.
van Donkelaar A, Martin RV, Brauer M, Boys BL. Use of satellite observations for long-term exposure assessment of global concentrations of fine particulate matter. Environ Health Perspect. 2015 Feb;123(2):135–43.
Viechtbauer W. Conducting Meta-Analyses in R with the metafor Package. J Stat Soft. 2010 Aug 5;36(3):1–48.
Villanueva C, Chang J, Ziogas A, Bristow RE, Vieira VM. Ambient air pollution and ovarian cancer survival in California. Gynecol Oncol. 2021;163(1):155-161.
Villeneuve PJ, Jerrett M, Su J, et al. A cohort study of intra-urban variations in volatile organic compounds and mortality, Toronto, Canada. Environ Pollut. 2013;183:30-39.
Von Klot S, Gryparis A, Tonne C, et al. Elemental carbon exposure at residence and survival after acute myocardial infarction. Epidemiology. 2009;20(4):547-554.
Wang T, Xu H, Zhu Y, et al. Traffic-related air pollution associated pulmonary pathophysiologic changes and cardiac injury in elderly patients with COPD. J Hazard Mater. 2022;424(Pt B):127463.
Weichenthal S, Hatzopoulou M, Goldberg MS. Exposure to traffic-related air pollution during physical activity and acute changes in blood pressure, autonomic and micro-vascular function in women: a cross-over study. Part Fibre Toxicol. 2014;11:70.
Wilker EH, Mostofsky E, Lue SH, et al. Residential proximity to high-traffic roadways and poststroke mortality. J Stroke Cerebrovasc Dis. 2013;22(8):e366-e372.
WHO. WHO global air quality guidelines: particulate matter (PM2.5 and PM10), ozone, nitrogen dioxide, sulfur dioxide and carbon monoxide. World Health Organization. 2021. https://apps.who.int/iris/handle/10665/345329.
Xiao J, Cheng P, Ma P, et al. Toxicological effects of traffic-related air pollution on the lungs: Evidence, biomarkers and intervention. Ecotoxicol Environ Saf. 2022;238:113570.
Xu J, Zhang N, Zhang G, et al. Short-term effects of the toxic component of traffic-related air pollution (TRAP) on lung function in healthy adults using a powered air purifying respirator (PAPR). Environ Res. 2022;214(Pt 1):113745.
Yang Y, Tang R, Qiu H, et al. Long term exposure to air pollution and mortality in an elderly cohort in Hong Kong. Environ Int. 2018;117:99-106.
Yorifuji T, Kashima S, Tsuda T, et al. Long-term exposure to traffic-related air pollution and the risk of death from hemorrhagic stroke and lung cancer in Shizuoka, Japan. Sci Total Environ. 2013;443:397-402.
Yorifuji T, Kashima S, Tsuda T, et al. Long-term exposure to traffic-related air pollution and mortality in Shizuoka, Japan. Occup Environ Med. 2010;67(2):111-117.
Zhang Q, Du X, Li H, et al. Cardiovascular effects of traffic-related air pollution: A multi-omics analysis from a randomized, crossover trial. J Hazard Mater. 2022;435:129031.
Zhao J, Mi X, Zhao L, et al. Validation of PM2.5 model particle through physicochemical evaluation and atherosclerotic plaque formation in ApoE-/- mice. Ecotoxicol Environ Saf. 2020;192:110308.
Zhao J, Bo L, Gong C, et al. Preliminary study to explore gene-PM2.5 interactive effects on respiratory system in traffic policemen. Int J Occup Med Environ Health. 2015;28(6):971-983.
Appendix. Study details by exposure metric
The study details regarding study population, exposure assessment, confounders, and REs are provided in this appendix by pollutant or metric of traffic and the road network infrastructure.
| Reference | Cohort (Study period) | Study population | Exposure assessment method and distribution | Confounders and/or covariates | Total N | Cases | IncrementFootnote a | Risk estimate (95% CI) |
|---|---|---|---|---|---|---|---|---|
| Canada – General population | ||||||||
Gan et al., 2011 |
Cohort |
Vancouver metropolitan residents, British Columbia, aged 45–85 y Males: 45.3% |
LUR model (residential postal code)
|
Age, sex, area-level SES, pre-existing comorbidities |
406,232 |
CHD: |
8.4 µg/m3 |
CHD: |
Chen et al., 2013 |
Ontario Tax Cohort |
Residents in Toronto, Hamilton, or Windsor, Ontario All 3 cities: |
LUR model (residential postal code) Toronto: Hamilton: Windsor: |
Age, sex, individual-level SES, area-level SES, indirect adjustment for smoking (data from 2001 CCHS), marital status |
Pooled (Hamilton, Toronto, Windsor): |
CSD: |
5 ppb (9.4 µg/m3) |
CSD: |
CHD: |
CHD: |
|||||||
CBVD: |
CBVD: |
|||||||
Gan et al., 2013 |
Cohort |
Vancouver metropolitan residents, British Columbia, aged 45–85 y Males: 47.1% |
LUR model (residential postal code)
|
Age, sex, area-level SES |
465,360 |
COPD: |
8.4 µg/m3 |
COPD: |
Villeneuve et al., 2013 |
Ontario Tax Cohort |
Randomly selected income tax filing Canadians in 10 urban areas of Ontario, restricted to Toronto, aged ≥35 y Males: 50.4% |
LUR model (residential postal code)
|
Age, sex, individual-level SES, area-level SES, marital status indirectly adjusted for smoking |
58,760 |
All-cause: |
5.92 ppb (11.13 µg/m3) |
All-cause: |
CSD: |
CSD: |
|||||||
RD: |
RD: |
|||||||
Crouse et al., 2015 |
Cohort |
Cohort participants aged ≥25 y who completed long-form census from 10 cities (individually) across Canada Males: 48.0% |
LUR model (within city; residential address)
|
Age, sex, individual-level SES, area-level SES, indirect adjustment for smoking and BMI, Aboriginal ancestry, minority status, other individual- and area-level SES indicators |
735,590 |
All-cause: |
5 ppb (9.4 µg/m3) |
All-cause: |
CSD: |
CSD: |
|||||||
CHD: |
CHD: |
|||||||
CBVD: |
CBVD: |
|||||||
RD: |
RD: |
|||||||
| Canada – Patient population | ||||||||
Jerrett et al., 2009 |
Cohort |
Adult patients from respiratory disease clinic in Toronto, Ontario Males: 48% |
LUR model (residential postal code)
|
Age, sex, area-level SES, individual-level smoking, BMI, and lung function |
2,360 |
All-cause: |
4 ppb (7.52 µg/m3) |
All-cause: |
CSD: |
CSD: |
|||||||
RD: |
RD: |
|||||||
| USA – General population | ||||||||
Alexeeff et al., 2018 |
Cohort |
Adult members of the Kaiser Permanente Northern California health care system living in Oakland, CA during the study period; those with history of CSD were excluded Males: 47.0% |
Hybrid or other model (residential address)
|
Age, sex, area-level SES, individual-level smoking, race, BMI, health status |
41,869 |
CHD: |
3.8 ppb (7.14 µg/m3) |
CHD: |
CBVD: |
CBVD: |
|||||||
| Europe – General population | ||||||||
Rosenlund et al., 2006 |
Case-control Stockholm Heart Epidemiology Program (1992–1994) |
Population-based case-control in Stockholm, Sweden; first events of MI in population aged 45–70 y Males (cases; controls): 66%; 65% |
Dispersion model (residential address) Cases: Controls: |
Age, sex, individual-level SES, individual smoking, diabetes, physical activity |
3,210 |
MI: |
30 µg/m3 |
MI: |
Naess et al., 2007 |
Cohort |
Residents aged 51–90 y of 470 neighbourhoods in Oslo, Norway |
Dispersion model (neighbourhood-level)
|
Age, sex, individual-level SES, other SES indicators |
143,842 |
CSD: 71–90 y |
Quartile increase (not specified) |
CSD: 71–90 y |
COPD: 71–90 y |
COPD: 71–90 y |
|||||||
Rosenlund et al., 2008 |
Cohort |
Residents in Rome, Italy aged 35–84 y who experienced first coronary event Males: 68.3% |
LUR model (residential address; census block) 5th–95th percentile: 33.0–60.1 µg/m3 |
Age, sex, area-level SES |
11,167 |
CHD: |
10 µg/m3 |
CHD: |
Rosenlund et al., 2009 |
Case-control |
Population-based case-control in Stockholm, Sweden; first events of MI in population 15–79 y Males (cases; controls): 69%; 49% |
Dispersion model (residential address) Cases: |
Age, sex, individual-level SES, calendar year |
301,273 |
MI: |
30 µg/m3 |
MI: |
Cesaroni et al., 2012 |
Cohort |
Adults aged 45–80 y who resided in Rome, Italy ≥5 y Limited to participants that did not change address during study period |
LUR model (residential address)
|
Age, sex, individual-level SES, area-level SES, marital status, place of birth |
684,013 |
All-cause: 45,006 |
10 µg/m3 |
All-cause: |
Raaschou-Nielsen et al., 2012 |
Diet, Cancer, and Health Cohort Study (1993–2009) |
Adults aged 50–64 y living in the Copenhagen and Aarhus areas, born in Denmark, and with no previous cancer diagnosis. Males: 47.5% |
Hybrid model (residential address)
|
Age, sex, individual-level SES, area-level SES, individual smoking, lifestyle and dietary variables, occupational exposure, marital status |
52,061 |
All-cause: 5,534 |
Per doubling (logbase 2 transformed) µg/m3 |
All-cause: |
CSD: |
CSD: |
|||||||
CHD: |
CHD: |
|||||||
CBVD: |
CBVD: |
|||||||
Carey et al., 2013 |
Cohort |
Patients aged 40–89 y of 205 clinics in England, United Kingdom; fully registered for at least 1 year on Jan 1, 2003 Males: 48.4% |
Dispersion model (residential postcode centroid)
|
Age, sex, area-level SES, individual-level smoking, BMI |
830,429 |
All-cause: 82,421 |
10.7 µg/m3 |
All-cause: |
CSD: |
CSD: |
|||||||
RD: |
RD: |
|||||||
Cesaroni et al., 2013 |
Cohort |
Adults aged ≥30 y who resided in Rome, Italy ≥5 y Males: 45.5% |
LUR model (residential address)
|
Age, sex, individual-level SES, area-level SES, marital status, place of birth |
1,265,058 |
All-cause: |
10 µg/m3 |
All-cause: |
CSD: |
CSD: |
|||||||
CHD: |
CHD: |
|||||||
CBVD: |
CBVD: |
|||||||
RD: |
RD: |
|||||||
Beelen et al., 2014a |
Cohort |
22 cohorts from 13 countries; general population Mean age at baseline (SD): 41.1 (11.8) – 70.3 (8.1) y |
LUR model (residential address) Range of means (SD): |
Age, sex, individual-level SES, area-level SES, individual-level smoking, environmental tobacco smoke, dietary and lifestyle variables, marital status, other SES indicators |
367,251 |
All-cause: |
10 µg/m3 |
All-cause: |
Beelen et al., 2014b |
Cohort |
22 cohorts from 13 countries; general population Females (range): 63% (48%–100%) |
LUR model (residential address) Range of means (SD): |
Age, sex, individual-level SES, area-level SES, individual-level smoking, environmental tobacco smoke, dietary and lifestyle variables, marital status, other SES indicators |
367,383 |
CSD: |
10 µg/m3 |
CSD: |
CBVD: |
CBVD: |
|||||||
CHD: |
CHD: |
|||||||
MI: |
MI: |
|||||||
Dimakopoulou et al., 2014 |
Cohort |
16 cohorts from 11 countries; general population Females (range): 47.7%–100% |
LUR model (residential address) Range of means (SD): |
Age, sex, individual-level SES, area-level SES, individual-level smoking, environmental tobacco smoke, dietary and lifestyle variables, marital status, other SES indicators |
307,553 |
RD: |
10 µg/m3 |
RD: |
Nieuwenhuijsen et al., 2018 |
Cohort |
Adults ≥18 y, registered in SIDIAP and living in Barcelona; SIDIAP represents 80% of total population of Catalonia (Spain) Males: 53% |
LUR model (census tract) Geometric mean (95% CI): 53.42 (53.40–53.45) µg/m3 |
Age, sex, area-level SES, individual-level smoking |
792,649 |
All-cause: 28,391 |
5 µg/m3 |
All-cause: |
| Europe – Patient population | ||||||||
Rosenlund et al., 2008 |
Cohort |
Residents in Rome, Italy aged 35–84 y who survived first coronary event (1998–2000) by ≥28 days Males: 72.3% |
LUR model (residential address; census block)
|
Age, sex, area-level SES |
6,513 |
All-cause: 1,802 |
10 µg/m3 |
All-cause: |
Maheswaran et al., 2010 |
Cohort |
Patients residing in London, United Kingdom who experienced first-ever stroke 1995–2005 Across categorized exposure concentrations: |
Hybrid model (residential address) Mean (SD): 41 (3.3) µg/m3 |
Age, sex, area-level SES, individual-level smoking, ethnicity, lifestyle variables, comorbidities, medical variables |
3,320 |
All-cause: 1,856 |
10 µg/m3 |
All-cause: |
Desikan et al., 2016 |
Cohort |
South London Stroke Register (United Kingdom), a population-based register of incident strokes Males: 52.3% |
Dispersion model (residential postcode) Mean (SD): 44.59 (4.29) µg/m3 |
Age, sex, area-level SES, ethnicity, stroke-specific variables |
1,800 |
All-cause: |
5.04 µg/m3 |
All-cause: |
Tonne et al., 2016 |
Cohort |
Patients >25 y from Greater London, United Kingdom admitted to hospital with MI from hospitals that had >10 STEMI or non-STEMI admissions Males: 68% |
Dispersion model (residential postcode centroid)
|
Age, sex, area-level SES, individual-level smoking, ethnicity, medical history, MI, and STEMI-specific variables |
18,138 |
All-cause: |
8 µg/m3 |
All-cause: |
| Asia – General population | ||||||||
Yorifuji et al., 2010 |
Shizuoka Elderly Cohort (1999–2006) |
Adults ≥65 y living in Shizuoka, Japan in 1999 Females: 48%–49% Excluded participants who moved during study period |
LUR model (residential address) Mean (SD): 25 (12) µg/m3 |
Age, sex, individual-level SES, individual-level smoking, BMI, comorbidities |
12,029 |
All-cause: |
10 µg/m3 |
All-cause: |
CSD: |
CSD: |
|||||||
CHD: |
CHD: |
|||||||
Other cardiac diseasesFootnote c: |
Other cardiac diseasesFootnote c: |
|||||||
CBVD: |
CBVD: |
|||||||
RD: |
RD: |
|||||||
I&P: |
I&P: |
|||||||
COPD: |
COPD: |
|||||||
Yorifuji et al., 2013 |
Shizuoka Elderly Cohort (1999–2009) |
Adults ≥65 y living in Shizuoka, Japan in 1999 Females: 48.9% Excluded participants who moved during study period |
LUR model (residential address) Mean (SD): 22 (15) µg/m3 |
Age, sex, individual-level SES, area-level SES, individual-level smoking, BMI, comorbidities |
13,412 |
All-cause: |
10 µg/m3 |
All-cause: |
CSD: |
CSD: |
|||||||
CHD: |
CHD: |
|||||||
Other cardiac diseasesFootnote c: |
Other cardiac diseasesFootnote c: |
|||||||
CBVD: |
CBVD: |
|||||||
RD: |
RD: |
|||||||
I&P: |
I&P: |
|||||||
COPD: |
COPD: |
|||||||
Barratt et al., 2018 |
Elderly Health Service |
Hong Kong, China residents ≥65 y enrolled in Department of Health Elderly Health Service of the Hong Kong Government; participants lived in high-rise buildings below the 20th floor with openable windows streetside Males: 32.6% |
LUR model (residential address)
|
Age, sex, individual-level SES, area-level SES, individual-level smoking, indirect adjustment for smoking, BMI, physical activity, other SES indicators |
60,548 |
All-cause: 16,006 |
26 µg/m3 |
All-cause: |
CSD: |
CSD: |
|||||||
CHD: |
CHD: |
|||||||
CBVD: |
CBVD: |
|||||||
RD: |
RD: |
|||||||
Pneumonia: |
Pneumonia: |
|||||||
COPD: |
COPD: |
|||||||
Yang et al., 2018 |
Cohort |
Hong Kong, China residents ≥65 y enrolled in Department of Health Elderly Health Service of the Hong Kong Government Males: 33% |
LUR model (residential address) Median: 104 µg/m3 |
Age, sex, individual and area-level SES, individual-level smoking, indirect adjustment for smoking, BMI, physical activity, other SES indicators |
61,386 |
Not explicit |
25.6 µg/m3 |
All-cause: CSD: CHD: CBVD: RD: Pneumonia: COPD: |
| Australia – General population | ||||||||
Dirgawati et al., 2019 |
Cohort |
Men aged ≥65 y, original recruited for a randomized control trial on abdominal aortic aneurism in Perth Mean age (SD): 72.1 (4.4) y |
LUR model (residential address)
|
Age, sex, individual-level SES, individual-level smoking, BMI |
All-cause: |
All-cause: |
10 µg/m3 |
All-cause: |
Stroke: |
Stroke: |
Stroke: |
||||||
Hanigan et al., 2019 |
Cohort |
Participants ≥45 y and <80 y residing in Sydney Males: 47.6% |
Hybrid model (residential address)
|
Age, sex, individual- and area-level SES, individual-level smoking, alcohol consumption, BMI, marital status, physical activity, and other demographic variables |
75,145 |
All-cause: 3,280 |
5 µg/m3 |
All-cause: |
Abbreviations: BMI: body mass index; CanCHEC: Canadian Census Health and Environment Cohort; CBVD: cerebrovascular disease; CCHS: Canadian Community Health Survey; CHD: coronary heart disease; CI: confidence interval; COPD: chronic obstructive pulmonary disease; CSD: circulatory system disease; ESCAPE: European Study of Cohorts for Air Pollution Effects; I&P: influenza and pneumonia; HR: hazard ratio; IQR: interquartile range; LUR: land-use regression; MI: myocardial infarction; MRR: mortality rate ratio; OR: odds ratio; ppb: parts per billion; RD: respiratory disorder; RR: relative risk; SES: socio-economic status; SD: standard deviation; SIDIAP: Sistema d'Informació pel Desenvolupament de la Investigació en Atenció Primària STEMI: ST-elevation myocardial infarction; y: year.
|
||||||||
| Reference | Cohort (Study period) | Study population | Exposure assessment method and distribution | Confounders and/or covariates | Total N | Cases | IncrementFootnote a | Risk estimate (95% CI) |
|---|---|---|---|---|---|---|---|---|
| Europe – General population | ||||||||
Nafstad et al., 2004 |
Cohort |
40–49-year-old men residing in Oslo, Norway |
Dispersion model (residential address)
|
Age, sex, individual SES, individual smoking, physical activity, risk of cardiovascular diseases |
16,209 |
All-cause: 4,227 |
10 µg/m3 |
All-cause: |
CHD: |
CHD: |
|||||||
CBVD: |
CBVD: |
|||||||
RD: |
RD: |
|||||||
Beelen et al., 2014a |
Cohort |
22 cohorts from 13 countries; general population Females: 47.7%–100% |
LUR model (residential address) Range of means (SD): 8.7 (5.7) – 107.3 (24.1) µg/m3 |
Age, sex, individual-level SES, area-level SES, individual-level smoking, environmental tobacco smoke, dietary and lifestyle variables, marital status, other SES indicators |
367,251 |
All-cause: |
20 µg/m3 |
All-cause: |
Beelen et al., 2014b |
Cohort |
22 cohorts from 13 countries; general population Females (range): 63% (48%–100%) |
LUR model (residential address) Range of means (SD): 8.7 (5.7) – 107.3 (24.1) µg/m3 |
Age, sex, individual-level SES, area-level SES, individual-level smoking, environmental tobacco smoke, dietary and lifestyle variables, marital status, other SES indicators |
367,383 |
CSD: |
20 µg/m3 |
CSD: |
CBVD: |
CBVD: |
|||||||
CHD: |
CHD: |
|||||||
MI: |
MI: |
|||||||
Dimakopoulou et al., 2014 |
Cohort |
16 cohorts from 11 countries; general population Females (range): 47.7%–100% |
LUR model (residential address) Range of means (SD): |
Age, sex, individual-level SES, area-level SES, individual-level smoking, environmental tobacco smoke, dietary and lifestyle variables, marital status, other SES indicators |
307,553 |
RD: |
10 µg/m3 |
RD: |
Stockfelt et al., 2015 |
Cohort |
Men in Gothenburg, Sweden born 1915–1925 (except 1923) Mean age (range): 53.2 (48–58) y |
Dispersion model (residential address) Median range: 17–44 µg/m3 |
Age, sex, individual SES, individual smoking |
7,494 |
All-cause: |
10 µg/m3 |
All-cause: |
CSD: |
CSD: |
|||||||
CHD: |
CHD: |
|||||||
MI: |
MI: |
|||||||
CBVD: |
CBVD: |
|||||||
RD: |
RD: |
|||||||
Bauleo et al., 2019 |
Cohort |
All residents (18+ years) living in Civitavecchia, Italy on January 1, 1996 Females: 52.3% |
Dispersion model (residential address)
|
Age, sex, area-level SES, place of birth |
71,362 |
All-cause: |
12.77 µg/m3 |
All-cause: |
CSD: |
CSD: |
|||||||
Cardiac diseases: |
Cardiac diseases: |
|||||||
CHD: |
CHD: |
|||||||
ACE: |
ACE: |
|||||||
CBVD: |
CBVD: |
|||||||
RD: |
RD: |
|||||||
COPD: |
COPD: |
|||||||
Andersson et al., 2020 |
Cohort |
Random third of all men in Gothenburg, Sweden born 1915–1925 Mean age (in 1978): 58.2 y 80% of cohort died before 2011 |
Dispersion model (residential address) Mean NOx decreased from 53 μg/m3 in 1978 to 29 μg/m3 in 2010 Reference group: <36.7 µg/m3 |
Age, sex, individual-level SES, individual-level smoking, marital status, BMI, heredity, lifestyle variables, medical variables |
6,304 |
All-cause: |
By quintile: |
All-cause; by quintile: |
CSD: |
CSD; by quintile: |
|||||||
Carlsen et al., 2022 |
Malmo Diet and Cancer Cohort |
Random selection of individuals born from 1923 to 1950 in Malmö, Sweden; mean follow-up: 20 y Females: 60.3% |
Dispersion model (residential address)
|
Age, sex, individual-level SES, area-level SES, individual-level smoking, physical activity, health status, other lifestyle factors |
25,823 |
MI: |
9.62 µg/m3 |
MI: |
| Europe – Patient population | ||||||||
Desikan et al., 2016 |
Cohort |
South London Stroke Register (United Kingdom), a population-based register of incident strokes Males: 52.3% |
Dispersion model (residential address)
|
Age, sex, area-level SES, ethnicity, stroke-specific variables |
1,800 |
All-cause: 729 |
13.99 µg/m3 |
All-cause: |
Tonne et al., 2016 |
Cohort |
Patients >25 y from Greater London, United Kingdom admitted to hospital with MI from hospitals that had >10 STEMI or non-STEMI admissions Males: 68% |
Dispersion model (residential address)
|
Age, sex, area-level SES, individual-level smoking, ethnicity, medical history, MI and STEMI-specific variables |
18,138 |
All-cause: 5,129 |
19.2 µg/m3 |
All-cause: |
| Asia – Patient/ Mix population | ||||||||
Cohen et al., 2019 |
Cohort |
Patients undergoing percutaneous coronary interventions at the cardiology department, Rabin Medical Center, Israel Females: 24% |
LUR model (residential address)
|
Age, sex, area-level SES, individual-level smoking, ethnicity, comorbidities |
3,051 |
All-cause: 1,606 |
High vs. low (ppb) |
All-cause: |
Dispersion model (residential address) Range: 8.7–57.6 ppb |
Age, sex, area-level SES, individual-level smoking, ethnicity, comorbidities |
3,051 |
All-cause: 1,714 |
High vs. low (ppb) |
All-cause: |
|||
Hybrid model (residential address) High exposure (by LUR): 25.0–86.4 ppb |
Age, sex, area-level SES, individual-level smoking, ethnicity, comorbidities |
3,051 |
All-cause: 2,237 |
High vs. low (ppb) |
All-cause: |
|||
Cohen et al., 2021 |
Cohort |
Israeli residents; 2 patient-based cohorts of CHD and 2 population-based cohorts Age- and sex-matched cohort (2,393 matched pairs): |
LUR model (residential address) CHD-free: CHD: p-value <0.01 |
Age, sex, area-level SES, individual-level smoking, ethnicity, comorbidities |
2,393 |
All-cause: CHD-free: CHD: |
10 ppb 15.5 µg/m3 |
All-cause: CHD-free: CHD: |
| Australia – General population | ||||||||
Dirgawati et al., 2019 |
Cohort |
Men aged ≥65 y, originally recruited for a randomized control trial on abdominal aortic aneurism in Perth, Australia Mean age (SD): 72.1 (4.4) y |
LUR model (residential address) |
Age, sex, individual-level SES, individual-level smoking, BMI |
All-cause: |
All-cause: |
10 µg/m3 |
All-cause: |
Stroke: |
Stroke: |
Stroke: |
||||||
Abbreviations: ACE: acute coronary events; BMI: body mass index; CBVD: cerebrovascular disease; CHD: coronary heart disease; CI: confidence interval; COPD: chronic obstructive pulmonary disease; CSD: circulatory system disease; ESCAPE: European Study of Cohorts for Air Pollution Effects; HR: hazard ratio; IQR: interquartile range; LUR: land-use regression; MI: myocardial infarction; ppb: parts per billion; RD: respiratory disorder; SD: standard deviation; SES: socio-economic status; STEMI: ST-elevation myocardial infarction; y: year.
|
||||||||
| Reference | Cohort (Study period) | Study population | Exposure assessment method and distribution | Confounders and/or covariates | Total N | Cases | IncrementFootnote a | Risk estimate (95% CI) |
|---|---|---|---|---|---|---|---|---|
| Canada – General population | ||||||||
Gan et al., 2011 |
Cohort |
Vancouver metropolitan residents, British Columbia, aged 45–85 y Males: 45.3% |
LUR model (residential postal code)
|
Age, sex, area-level SES, pre-existing comorbidities |
406,232 |
CHD: |
13.2 µg/m3 |
CHD: |
Gan et al., 2013 |
Cohort |
Vancouver metropolitan residents, British Columbia, aged 45–85 y Males: 47.1% |
LUR model (residential postal code)
|
Age, sex, area-level SES |
465,360 |
COPD: |
13.2 µg/m3 |
COPD: |
| USA – General population | ||||||||
Alexeeff et al., 2018 |
Cohort |
Adult members of the Kaiser Permanente Northern California health care system, living in Oakland, California during the study period; those with history of CSD were excluded Males: 47.0% |
Hybrid or other model (residential address)
|
Age, sex, area-level SES, individual-level smoking, race, BMI, health status |
41,869 |
CHD: |
3.8 ppb (4.7 µg/m3) |
CHD: |
CBVD: |
CBVD: |
|||||||
| Europe – Patient population | ||||||||
Desikan et al., 2016 |
Cohort |
South London Stroke Register (UK), a population-based register of incident strokes Males: 52.3% |
Dispersion model (residential address) Mean (SD): 34.39 (7.15) µg/m3 |
Age, sex, area-level SES, ethnicity, stroke-specific variables |
1,800 |
All-cause: 729 |
8.86 µg/m3 |
All-cause: |
| Asia – General population | ||||||||
Barratt et al., 2018 |
Elderly Health Service |
Hong Kong, China, residents ≥65 y enrolled in Department of Health Elderly Health Service of the Hong Kong Government; participants lived in high-rise buildings below the 20th floor with openable windows streetside Males: 32.6% |
LUR model (residential address)
|
Age, sex, individual-level SES, area-level SES, individual-level smoking, indirect adjustment for smoking, BMI, physical activity, other SES indicators |
60,548 |
All-cause: 16,006 |
167 µg/m3 |
All-cause: |
CSD: |
CSD: |
|||||||
CHD: |
CHD: |
|||||||
CBVD: |
CBVD: |
|||||||
RD: |
RD: |
|||||||
Pneumonia: |
Pneumonia: |
|||||||
COPD: |
COPD: |
|||||||
Abbreviations: BMI: body mass index; CBVD: cerebrovascular disease; CHD: coronary heart disease; CI: confidence interval; COPD: chronic obstructive pulmonary disease; CSD: circulatory system disease; HR: hazard ratio; IQR: interquartile range; LUR: land-use regression; ppb: parts per billion; RD: respiratory disorder; RR: relative risk; SD: standard deviation; SES: socio-economic status; y: year.
|
||||||||
| Reference | Cohort (Study period) | Study population | Exposure assessment method and distribution | Confounders and/or covariates | Total N | Cases | Increment | Risk estimate (95% CI) |
|---|---|---|---|---|---|---|---|---|
| Canada – General population | ||||||||
Gan et al., 2011 |
Cohort |
Vancouver metropolitan residents, British Columbia, aged 45–85 y Males : 45.3% |
LUR model (residential postal code)
|
Age, sex, area-level SES, pre-existing comorbidities |
406,232 |
CHD: |
1.58 µg/m3 |
CHD: |
Gan et al., 2013 |
Cohort |
Vancouver metropolitan residents, British Columbia, aged 45–85 y Males : 47.1% |
LUR model (residential postal code)
|
Age, sex, area-level SES, pre-existing comorbidities |
465,360 |
COPD: |
1.58 µg/m3 |
COPD: |
| USA – General population | ||||||||
Jerrett et al., 2005 |
Cohort |
ACS-CPSII cohort members with a ZIP code in Los Angeles, California (no further details provided) |
Hybrid or other model (residential postcode) Range: 9.0–27.1 µg/m3 |
Age, sex, individual-level SES, area-level SES, individual-level smoking; included 40 individual confounders (lifestyle, dietary, demographic, occupational, and educational factors) and 8 ecological variables for ZIP code (income, income inequality, education, population size, racial composition, and unemployment) |
22,905 |
All-cause: |
10 µg/m3 |
All-cause: |
CPD: |
CPD: |
|||||||
Krewski et al., 2009 |
Cohort |
ACS-CPSII cohort members with a ZIP code in New York City, New York Males: 56.3% |
LUR model (residential postcode)
|
Age, sex, individual-level SES, area-level SES, individual-level smoking; included 40 individual confounders (lifestyle, dietary, demographic, occupational, and educational factors) |
44,056 |
All-cause: |
1.5 µg/m3 |
All-cause: |
CPD: |
CPD: |
|||||||
CHD: |
CHD: |
|||||||
Krewski et al., 2009 |
Cohort |
ACS-CPSII cohort members with a ZIP code in Los Angeles, California Males: 57% |
LUR model (residential postcode)
|
Age, sex, individual-level SES, area-level SES, individual-level smoking; included 40 individual confounders (lifestyle, dietary, demographic, occupational, and educational factors) |
22,905 |
All-cause: |
10 µg/m3 |
All-cause: |
CPD: |
CPD: |
|||||||
CHD: |
CHD: |
|||||||
| Europe – General population | ||||||||
Naess et al., 2007 |
Cohort |
Residents 51–90 y of 470 neighbourhoods in Oslo, Norway |
Dispersion model (neighbourhood-level)
|
Age, sex, individual-level SES, other SES indicators |
143,842 |
All-cause: |
Not specified |
All-cause: |
CSD: 71–90 y |
CSD: 71–90 y |
|||||||
COPD: 71–90 y |
COPD: 71–90 y |
|||||||
Carey et al., 2013 |
Cohort Clinical Practice Research Datalink (2003–2007) |
Patients aged 40–89 y of 205 clinics in England, United Kingdom; fully registered for at least 1 year on Jan 1, 2003 Males: 48.4% |
Dispersion model (residential postcode)
|
Age, sex, area-level SES, individual-level smoking, BMI |
830,842 |
All-cause: |
1.9 µg/m3 |
All-cause: |
CSD: |
CSD: |
|||||||
RD: |
RD: |
|||||||
Cesaroni et al., 2013 |
Cohort |
Adults aged ≥30 y who resided in Rome, Italy, ≥5 y Males: 45.5% |
Dispersion model (residential address)
|
Age, sex, individual-level SES, area-level SES, marital status, place of birth |
1,265,058 |
All-cause: |
10 µg/m3 |
All-cause: |
CSD: |
CSD: |
|||||||
CBVD: |
CBVD: |
|||||||
CHD: |
CHD: |
|||||||
RD: |
RD: |
|||||||
Beelen et al., 2014a |
Cohort |
22 cohorts from 13 countries; general population Females: 47.7%–100% |
LUR model (residential address) Range of means (SD): |
Age, sex, individual-level SES, area-level SES, individual-level smoking, environmental tobacco smoke, dietary and lifestyle variables, marital status, other SES indicators |
322,159 |
All-cause: |
5 µg/m3 |
All-cause: |
Beelen et al., 2014b |
Cohort |
22 cohorts from 13 countries; general population Females (range): 63% (48%–100%) |
LUR model (residential address) Range of means (SD): |
Age, sex, individual-level SES, area-level SES, individual-level smoking, environmental tobacco smoke, dietary and lifestyle variables, marital status, other SES indicators |
367,383 |
CSD: |
5 µg/m3 |
CSD: |
CBVD: |
CBVD: |
|||||||
CHD: |
CHD: |
|||||||
MI: |
MI: |
|||||||
Dimakopoulou et al., 2014 |
Cohort |
16 cohorts from 11 countries; general population Females range: 47.7%–100% |
LUR model (residential address) Range of means (SD): |
Age, sex, individual-level SES, area-level SES, individual-level smoking, environmental tobacco smoke, dietary and lifestyle variables, marital status, other SES indicators |
307,553 |
RD: |
5 µg/m3 |
RD: |
Badaloni et al., 2017 |
Cohort |
Adults aged ≥30 y who resided in Rome, Italy, ≥5 y Males: 45.4% |
LUR model (residential address) Mean (SE): 20 (1.9) µg/m3 |
Age, sex, individual-level SES, area-level SES, indirect smoking adjustment, marital status, place of birth |
1,249,108 |
All-cause: |
6.6 µg/m3 |
All-cause: |
CSD: |
CSD: |
|||||||
CHD: |
CHD: |
|||||||
Nieuwenhuijsen et al., 2018 |
Cohort SIDIAP (2010–2014) |
Adults ≥18 y, registered in SIDIAP and living in Barcelona; SIDIAP represents 80% of total population of Catalonia (Spain) Males: 53% |
LUR model (census tract) Geometric mean (95% CI): 16.08 (16.07–16.08) µg/m3 |
Age, sex, area-level SES, individual-level smoking |
792,649 |
All-cause: |
5 µg/m3 |
All-cause: |
So et al., 2020 |
Danish Nurse Cohort |
Female nurses >44 y recruited in 1993 or who turned 44 y in 1993–1999, recruited in 1999; Mean age (SD) at baseline: 53.2 (8.0) y |
Hybrid or other model (residential address) At baseline: |
Age, sex, individual-level SES, individual-level smoking, BMI, lifestyle variables, activity level, marital status, use of hormonal therapy |
24,526 |
All-cause: |
4.39 µg/m3 |
All-cause: |
Carlsen et al., 2022 |
Malmo Diet and Cancer Cohort |
Random selection of individuals born between 1923 and 1950 in Malmo, Sweden Females: 60.3% |
Dispersion model (residential address)
|
Age, sex, individual-level SES, area-level SES, individual-level smoking, physical activity, health status, other lifestyle factors |
25,823 |
MI: |
1.63 µg/m3 |
MI: |
| Europe – Patient population | ||||||||
Desikan et al., 2016 |
Cohort |
South London Stroke Register (United Kingdom), a population-based register of incident strokes Males: 52.3% |
Dispersion model (residential postcode)
|
Age, sex, area-level SES, ethnicity, stroke-specific variables |
1,800 |
All-cause: |
1.86 µg/m3 |
All-cause: |
Tonne et al., 2016 |
Cohort |
Patients >25 y from Greater London, United Kingdom admitted to hospital with MI from hospitals that had >10 STEMI or non-STEMI admissions Males: 68% |
Dispersion model (residential postcode centroid) Traffic exhaust:
Traffic non-exhaust:
|
Age, sex, area-level SES, individual-level smoking, ethnicity, medical history, MI, and STEMI-specific variables |
18,138 |
All-cause: |
Traffic exhaust: Traffic non-exhaust: |
All-cause: Traffic non-exhaust: |
| Asia – General population | ||||||||
Barratt et al., 2018 |
Elderly Health Service |
Hong Kong China, residents ≥65 y enrolled in Department of Health Elderly Health Service of the Hong Kong Government; participants lived in high-rise buildings below 20th floor with openable windows streetside Males: 32.6% |
LUR model (residential address)
|
Age, sex, individual and area-level SES, individual-level smoking, indirect adjustment for smoking, BMI, physical activity, other SES indicators |
60,548 |
All-cause: |
5.5 µg/m3 |
All-cause: |
CSD: |
CSD: |
|||||||
CHD: |
CHD: |
|||||||
CBVD: |
CBVD: |
|||||||
RD: |
RD: |
|||||||
Pneumonia: |
Pneumonia: |
|||||||
COPD: |
COPD: |
|||||||
Yang et al., 2018 |
Elderly Health Service |
Hong Kong, China, residents ≥65 y enrolled in Department of Health Elderly Health Service of the Hong Kong Government Males: 33% |
LUR model (residential address)
|
Age, sex, individual and area-level SES, individual-level smoking, indirect adjustment for smoking, BMI, physical activity, other SES indicators |
61,386 |
Not explicit |
5.5 µg/m3 |
All-cause: CSD: CHD: CBVD: RD: Pneumonia: COPD: |
| Australia – General population | ||||||||
Dirgawati et al., 2019 |
Cohort Health in Men Study (HIMS) |
Males aged ≥65 y, originally recruited for a randomized control trial on abdominal aortic aneurism in Perth, Australia Mean age (SD): 72.1 (4.4) y |
LUR model (residential address) Mean (SD): 5.1 (1.7) µg/m3 |
Age, sex, individual-level SES, individual-level smoking, BMI |
All-cause: |
All-cause: |
5 µg/m3 |
All-cause: |
Stroke: |
Stroke: |
Stroke: |
||||||
Hanigan et al., 2019 |
Cohort |
Participants ≥45 y and <80 y residing in Sydney, Australia; Males: 47.6% |
Hybrid or other model (residential address)
|
Age, sex, individual- and area-level SES, individual-level smoking, alcohol consumption, BMI, marital status, physical activity, and other demographic variables |
75,268 |
All-cause: |
1 µg/m3 |
All-cause: |
Abbreviations: ACS-CPSII: American Cancer Society – Cancer Prevention Survey II; BMI: body mass index; CBVD: cerebrovascular disease; CHD: coronary heart disease; CI: confidence interval; COPD: chronic obstructive pulmonary disease; CPD: cardiopulmonary disease; CSD: circulatory system disease; ESCAPE: European Study of Cohorts for Air Pollution Effects; HR: hazard ratio; IQR: interquartile range; LUR: land-use regression; MI: myocardial infarction; RD: respiratory disorder; RR: relative risk; SD: standard deviation; SE: standard error; SES: socio-economic status; SIDIAP: Sistema d'Informació pel Desenvolupament de la Investigació en Atenció Primària; STEMI: ST-elevation myocardial infarction; y: year. |
||||||||
| Reference | Cohort (Study period) | Study population | Exposure assessment method and distribution | Confounders and/or covariates | Total N | Cases | Increment | Risk estimate (95% CI) |
|---|---|---|---|---|---|---|---|---|
| Canada – General population | ||||||||
Gan et al., 2011 |
Cohort |
Vancouver metropolitan residents, British Columbia, aged 45–85 y Males : 45.3% |
LUR model (residential postal code) BC:
|
Age, sex, area-level SES, pre-existing comorbidities |
406,232 |
CHD: |
BC: |
CHD: |
Gan et al., 2013 |
Cohort |
Vancouver metropolitan residents, British Columbia, aged 45–85 y Males : 47.1% |
LUR model (residential postal code) BC:
|
Age, sex, area-level SES, pre-existing comorbidities |
465,360 |
COPD: |
BC: |
COPD: |
| USA – General population | ||||||||
Alexeeff et al., 2018 |
Cohort |
Adult members of the Kaiser Permanente Northern California health care system, living in Oakland, California during the study period; those with history of CSD were excluded |
Hybrid or other model (residential address) BC:
|
Age, sex, area-level SES, individual-level smoking, race, BMI, health status |
41,869 |
CSD: |
BC: |
CSD: |
CBVD: |
CBVD: |
|||||||
| USA – Patient population | ||||||||
Von Klot et al., 2009 |
Cohort |
Adult patients aged ≥25 y from Worcester, MA, hospitalized with acute MI Males: 59% |
LUR model (residential address) EC:
|
Age, sex, individual-level smoking, marital status, medical history, clinical variables |
3,169 |
All-cause: |
EC: |
All-cause: |
| Europe – General population | ||||||||
Beelen et al., 2014a |
Cohort |
22 cohorts from 13 countries; general population Females: 47.7%–100% |
LUR model (residential address) PM2.5 abs: Range of means (SD): |
Age, sex, individual-level SES, area-level SES, individual-level smoking, environmental tobacco smoke, dietary and lifestyle variables, marital status, other SES indicators |
322,159 |
All-cause: |
PM2.5 abs: |
All-cause: |
Beelen et al., 2014b |
Cohort |
22 cohorts from 13 countries; general population Females (range): 63% (48%–100%) |
LUR model (residential address) PM2.5 abs: Range of means (SD): |
Age, sex, individual-level SES, area-level SES, individual-level smoking, environmental tobacco smoke, dietary and lifestyle variables, marital status, other SES indicators |
367,383 |
CSD: |
PM2.5 abs: |
CSD: |
CBVD: |
CBVD: |
|||||||
CHD: |
CHD: |
|||||||
MI: |
MI: |
|||||||
Dimakopoulou et al., 2014 |
Cohort |
16 cohorts from 11 countries; general population Females range: 47.7%–100% |
LUR model (residential address) PM2.5 abs: Range of means (SD): |
Age, sex, individual-level SES, area-level SES, individual-level smoking, environmental tobacco smoke, dietary and lifestyle variables, marital status, other SES indicators |
307,553 |
RD: |
PM2.5 abs: |
RD: |
Badaloni et al., 2017 |
Cohort |
Adults aged ≥30 y who resided in Rome, Italy, ≥5 y Males: 45.4% |
LUR model (residential address) PM2.5 abs:
|
Age, sex, individual-level SES, area-level SES, marital status, place of birth |
1,249,108 |
All-cause: |
PM2.5 abs: |
All-cause: |
CSD: |
CSD: |
|||||||
CHD: |
CHD: |
|||||||
Nieuwenhuijsen et al., 2018 |
Cohort |
Adults ≥18 y, registered in SIDIAP and living in Barcelona; SIDIAP represents 80% of total population of Catalonia (Spain) Males: 53% |
LUR model (census tract) PM2.5 abs: Geometric mean (95% CI): 2.64 (2.64–2.64) x 10-5/m |
Age, sex, area-level SES, individual-level smoking |
792,649 |
All-cause: |
PM2.5 abs: |
All-cause: |
Carlsen et al., 2022 |
Malmo Diet and Cancer Cohort |
Random selection of individuals born between 1923 and 1950 in Malmo, Sweden Females: 60.3% |
Dispersion model (residential address) BC:
|
Age, sex, individual-level SES, area-level SES, individual-level smoking, physical activity, health status, other lifestyle factors |
25,823 |
MI: |
BC: |
MI: |
| Asia – General population | ||||||||
Barratt et al., 2018 |
Elderly Health Service Cohort (1998–2011) |
Hong Kong, China, residents ≥65 y enrolled in Department of Health Elderly Health Service of the Hong Kong Government; participants lived in high-rise buildings below 20th floor with openable windows streetside Males: 32.6% |
LUR model (residential address) BC:
|
Age, sex, individual and area-level SES, individual-level smoking, indirect adjustment for smoking, BMI, physical activity, other SES indicators |
60,548 |
All-cause: |
BC: |
All-cause: |
CSD: |
CSD: |
|||||||
CHD: |
CHD: |
|||||||
CBVD: |
CBVD: |
|||||||
RD: |
RD: |
|||||||
Pneumonia: |
Pneumonia: |
|||||||
COPD: |
COPD: |
|||||||
Yang et al., 2018 |
Cohort |
Hong Kong, China, residents ≥65 y enrolled in Department of Health Elderly Health Service of the Hong Kong Government Males: 33% |
LUR model (residential address) BC:
|
Age, sex, individual and area-level SES, individual-level smoking, indirect adjustment for smoking, BMI, physical activity, monthly expenses, other area-level SES indicators |
61,386 |
Not explicit |
BC: |
All-cause: CSD: CHD: CBVD: RD: Pneumonia: COPD: |
| Australia – General population | ||||||||
Dirgawati et al., 2019 |
Cohort |
Males aged ≥65 y, original recruited for a randomized control trial on abdominal aortic aneurism in Perth, Australia Mean age (SD): 72.1 (4.4) y |
LUR model (residential address) PM2.5 abs: Mean (SD): 0.9 (0.3) x 10-5/m |
Age, sex, individual-level SES, individual-level smoking, BMI |
All-cause: |
All-cause: |
PM2.5 abs: |
All-cause: |
Stroke: |
Stroke: |
Stroke: |
||||||
Abbreviations: BC: black carbon; BMI: body mass index; CI: confidence interval; CBVD: cerebrovascular disease; CHD: coronary heart disease; COPD: chronic obstructive pulmonary disease; CSD: circulatory system disease; EC: elemental carbon; ESCAPE: European Study of Cohorts for Air Pollution Effects; HR: hazard ratio; IQR: interquartile range; LUR: land-use regression; MI: myocardial infarction; PM2.5 abs: PM2.5 absorbance; RD: respiratory disorder; RR: relative risk; SD: standard deviation; SES: socio-economic status; SIDIAP: Sistema d'Informació pel Desenvolupament de la Investigació en Atenció Primària; y: year. |
||||||||
| Reference | Cohort (Study period) | Study population | Exposure assessment method and distribution | Confounders and/or covariates | Total N | Cases | Increment | Risk estimate (95% CI) |
|---|---|---|---|---|---|---|---|---|
| Europe – General population | ||||||||
Rosenlund et al., 2006 |
Case-control Stockholm Heart Epidemiology Program (1992–1994) |
Population-based case-control in Stockholm, Sweden; first events of MI in population aged 45–70 y Males (cases; controls): 66%; 65% Mean age (SD): |
Dispersion model (residential address) PM10: Cases: |
Age, sex, individual-level SES, individual smoking, diabetes, physical activity |
3,210 |
MI: |
PM10: |
MI: |
Naess et al., 2007 |
Cohort |
Residents 51–90 y of 470 neighbourhoods in Oslo, Norway |
Dispersion model (neighbourhood-level) PM10:
|
Age, sex, individual-level SES, other SES indicators |
143,842 |
CSD: 71–90 y |
PM10: |
CSD: 71–90 y |
COPD: 71–90 y |
COPD: 71–90 y |
|||||||
Rosenlund et al., 2009 |
Case-control |
Population-based case-control in Stockholm, Sweden; first events of MI in population 15–79 y Males (Cases; controls): 69%; 49% Fatal cases captured |
Dispersion model (residential address) PM10: Cases: |
Age, sex, individual-level SES |
301,273 |
MI: |
PM10: |
MI: |
Carey et al., 2013 |
Cohort Clinical Practice Research Datalink (2003–2007) |
Patients aged 40–89 y of 205 clinics in England, United Kingdom; fully registered for at least 1 year on Jan 1, 2003 Males: 48.4% |
Dispersion model (residential postcode centroid) PM10: Mean (SD): 19.7 (2.3) µg/m3 |
Age, sex, area-level SES, individual-level smoking, BMI |
830,842 |
All-cause: |
PM10: |
All-cause: |
CSD: |
CSD: |
|||||||
RD: |
RD: |
|||||||
Beelen et al., 2014a |
Cohort |
22 cohorts from 13 countries; general population Females: 47.7%–100% |
LUR model (residential address) PM10: Range of means (SD): PMcoarse: Range of means (SD): |
Age, sex, individual-level SES, area-level SES, individual-level smoking, environmental tobacco smoke, dietary and lifestyle variables, marital status, other SES indicators |
322,159 |
All-cause: |
PM10: PMcoarse: |
All-cause: PMcoarse HR = 1.04 (0.98–1.10) |
Beelen et al., 2014b |
Cohort |
22 cohorts from 13 countries; general population Females (range): 63% (48%–100%) |
LUR model (residential address) PM10: Range of means (SD): PMcoarse: Range of means (SD): |
Age, sex, individual-level SES, area-level SES, individual-level smoking, environmental tobacco smoke, dietary and lifestyle variables, marital status, other SES indicators |
367,383 |
CSD: |
PM10: PMcoarse: |
CSD: |
CBVD: |
CBVD: |
|||||||
CHD: |
CHD: |
|||||||
MI: |
MI: |
|||||||
Dimakopoulou et al., 2014 |
Cohort |
16 cohorts from 11 countries; general population Females range: 47.7%–100% |
LUR model (residential address) PM10: Range of means (SD): PMcoarse: Range of means (SD): |
Age, sex, individual-level SES, area-level SES, individual-level smoking, environmental tobacco smoke, dietary and lifestyle variables, marital status, other SES indicators |
307,553 |
RD: |
PM10: PMcoarse: |
RD: PMcoarse: |
Badaloni et al., 2017 |
Cohort |
Adults aged ≥30 y who resided in Rome, Italy, ≥5 y Males: 45.4% |
LUR model (residential address) PM10:
|
Age, sex, individual-level SES, area-level SES, marital status, place of birth |
1,249,108 |
All-cause: |
PM10: |
All-cause: |
CSD: |
CSD: |
|||||||
CHD: |
CHD: |
|||||||
Nieuwenhuijsen et al., 2018 |
Cohort SIDIAP (2010–2014) |
Adults ≥18 y, registered in SIDIAP and living in Barcelona; SIDIAP represents 80% of total population of Catalonia (Spain) Males: 53% |
LUR model (census tract) PM10: Geometric mean (95% CI): 38.29 (38.28–38.30) µg/m3 |
Age, sex, area-level SES, individual-level smoking |
792,649 |
All-cause: |
PM10: |
All-cause: |
Carlsen et al., 2022 |
Malmo Diet and Cancer Cohort |
Random selection of individuals born between 1923 and 1950 in Malmo, Sweden Females: 60.3% |
Dispersion model (residential address) PM10:
|
Age, sex, individual-level SES, area-level SES, individual-level smoking, physical activity, health status, other lifestyle factors |
25,823 |
MI: |
PM10: |
MI: |
| Europe – Patient population | ||||||||
Maheswaran et al., 2010 |
Cohort |
Patients living in London, United Kingdom, in 2001 who experienced first-ever stroke 1995–2005 Females: 48.6%–50.8% |
Hybrid or other model (residential address) PM10: Mean (SD): 25 (1.3) µg/m3 |
Age, sex, area-level SES, individual-level smoking, ethnicity, lifestyle variables, comorbidities, medical variables |
3,320 |
All-cause: |
PM10: |
All-cause: |
Desikan et al., 2016 |
Cohort |
South London Stroke Register (United Kingdom), a population-based register of incident strokes Males: 52.3% |
Dispersion model (residential postcode) PM10:
PMcoarse:
|
Age, sex, area-level SES, ethnicity, stroke-specific variables |
1,800 |
All-cause: |
PM10: PMcoarse: |
All-cause: PMcoarse HR = 0.98 (0.87–1.10 |
Tonne et al., 2016 |
Cohort |
Patients >25 y from Greater London, United Kingdom, admitted to hospital with MI from hospitals that had >10 STEMI or non-STEMI admissions Males: 68% |
Dispersion model (residential postcode centroid) PM10 exhaust:
PM10 non-exhaust:
|
Age, sex, area-level SES, individual-level smoking, ethnicity, medical history, MI, and STEMI-specific variables |
18,138 |
All-cause: |
PM10 exhaust: PM10 non-exhaust: |
All-cause: PM10 non-exhaust HR = 1.05 (1.00–1.09) |
Abbreviations: BMI: body mass index; CBVD: cerebrovascular disease; CHD: coronary heart disease; CI: confidence interval; COPD: chronic obstructive pulmonary disease; CSD: circulatory system disease; ESCAPE: European Study of Cohorts for Air Pollution Effects; HR: hazard ratio; IQR: interquartile range; LUR: land-use regression; MI: myocardial infarction; OR: odds ratio; RD: respiratory disorder; SD: standard deviation; SES: socio-economic status; SIDIAP: Sistema d'Informació pel Desenvolupament de la Investigació en Atenció Primària; STEMI: ST-elevation myocardial infarction; y: year. |
||||||||
| Reference | Cohort (Study period) | Study population | Exposure assessment method and distribution | Confounders and/or covariates | Total N | Cases | Increment | Risk estimate (95% CI) |
|---|---|---|---|---|---|---|---|---|
| Canada – General population | ||||||||
Villeneuve et al., 2013 |
Ontario Tax Cohort |
Randomly selected income tax filing Canadians in 10 urban areas of Ontario, restricted to Toronto, aged ≥35 y Males: 50.4% |
LUR model (postal code)
|
Age, sex, individual-level SES, area-level SES, indirectly adjusted for smoking |
58,760 |
All-cause: |
0.13 µg/m3 |
All-cause: |
CSD: |
CSD: |
|||||||
RD: |
RD: |
|||||||
|
Abbreviations: CI: confidence interval; CSD: circulatory system disease; IQR: interquartile range; LUR: land-use regression; RD: respiratory disorder; SD: standard deviation; SES: socio-economic status; y: year. |
||||||||
| Reference | Cohort (Study period) | Study population | Exposure assessment method and distribution | Confounders and/or covariates | Total N | Cases | Increment | Risk estimate (95% CI) |
|---|---|---|---|---|---|---|---|---|
| Europe – General population | ||||||||
Rosenlund et al., 2006 |
Case-control Stockholm Heart Epidemiology Program (1992–1994) |
Population-based case-control in Stockholm, Sweden; first events of MI in population aged 45–70 y Males: Mean age (SD): |
Dispersion model (residential address) Cases: Controls: |
Age, sex, individual-level SES, individual smoking, diabetes, physical activity |
3,210 |
MI: |
300 µg/m3 |
MI: |
Rosenlund et al., 2009 |
Case-control |
Population-based case-control in Stockholm, Sweden; first events of MI in population 15–79 y Males: Fatal cases captured |
Dispersion model (residential address) Cases: Controls: |
Age, sex, individual-level SES, calendar year |
301,273 |
MI: |
300 µg/m3 |
MI: |
|
Abbreviations: CI: confidence interval; MI: myocardial infarction; OR: odds ratio; SES: socio-economic status; SD: standard deviation; STEMI: ST-elevation myocardial infarction; y: year. |
||||||||
| Reference | Cohort (Study period) | Study population | Exposure assessment method and distribution | Confounders and/or covariates | Total N | Cases | Increment | Risk estimate (95% CI) |
|---|---|---|---|---|---|---|---|---|
| Canada – General population | ||||||||
Gan et al., 2010 |
Cohort (1994–2002) |
Vancouver metropolitan residents, British Columbia, aged 45–85 y with provincial health insurance plan Males: 45%–47% |
GIS (residential postal code) Consistent exposure: ≤50 m from major road or ≤150 m from highway Reference group: living >150 m from highway or >50 m from major road |
Age, sex, area-level SES, pre-existing comorbidities |
414,793 |
CHD: |
Exposed vs. reference |
CHD: |
Chen et al., 2013 |
Ontario Tax Cohort |
Residents in Toronto, Hamilton, or Windsor, Ontario, 35–85 y, randomly selected from Ontario Tax Cohort For all 3 cities: |
GIS (postal code) Exposed group: ≤50 m from major road or <100 m from highway Reference group: living >50 m from major road or >100 m from highway |
Age, sex, individual-level SES, area-level SES, marital status |
205,440 (Hamilton, Toronto, Windsor) |
CSD: |
Exposed vs. reference |
CSD: |
CHD: |
CHD: |
|||||||
CBVD: |
CBVD: |
|||||||
Cakmak et al., 2019 |
Cohort |
Canadian residents aged ≥25 y at baseline who completed long-form census Males (per quartile of local road length): 49.3%–51.0% |
GIS (postal code centroid) Total length of local roads ≤200 m radius of residence: |
Age, sex, individual-level SES, area-level SES, additional social determinants |
2,644,370 |
All-cause: |
Total length of local roads ≤200 m radius of residence: |
All-cause: |
CSD: |
CSD: |
|||||||
CHD: |
CHD: |
|||||||
CBVD: |
CBVD: |
|||||||
RD: |
RD: |
|||||||
COPD: |
COPD: |
|||||||
| Canada – Patient population | ||||||||
Finkelstein et al., 2004 |
Cohort |
Adults aged ≥40 y who underwent pulmonary function testing at a clinic in Hamilton, Ontario Males (control; exposed): 45%; 42% Median age (control; exposed): 60.4 y; 63.6 y |
GIS (postal code) Exposed group: residence within 50 m of major road or 100 m of a highway Control group: living outside buffer |
None |
5,228 |
All-cause: |
Exposed vs. control |
All-cause: |
Finkelstein et al., 2005 |
Cohort |
Adults aged ≥40 y who underwent pulmonary function testing at a clinic in Hamilton, Ontario Males (control; exposed): 45%; 42% |
GIS (postal code) Exposed group: residence within 50 m of major road or 100 m of a highway Reference group: living outside buffer |
Age, sex, area-level SES, BMI, clinical variables |
5,228 |
CSD: |
Exposed vs. reference |
CSD: |
CBVD: |
CBVD: |
|||||||
RD: |
RD: |
|||||||
Jerrett et al., 2009 |
Cohort |
Adult patients from respiratory disease clinic in Toronto, Ontario Males: 48% |
GIS (postal code) Exposed group: residence within 50 m of major road or 100 m of a highway Control group: living outside buffer 24% of population lived <50 m from major road or <100 m from highway |
Age, sex, area-level SES, individual-level smoking, BMI, clinical variables |
2,360 |
All-cause: |
Exposed vs. control |
All-cause: |
CSD: |
CSD: |
|||||||
| USA – General population | ||||||||
Hart et al., 2013 |
Cohort |
Married female United States registered nurses from all 50 states, 30–55 y at enrolment Mean age (SD): 63.8 (8.6) – 64.4 (8.7) y (traffic quartiles) |
GIS (residential address) Close to trafficFootnote b: residence within 50 m of A3 road or within 150 m of A1 or A2 road (for the majority of cohort and their person-years) Far: outside buffer Reference group: consistently far |
Age, sex, individual-level SES, area-level SES, individual-level smoking, race, lifestyle variables, medical history, family background variables |
84,562 |
All-cause: |
Consistently close vs. reference Moved from far to close vs. reference Moved from close to far vs. reference |
All-cause:
|
Hart et al., 2014 |
Cohort |
Married female US registered nurses from all 50 states, 30–55 y at enrolment Mean age (SD): 64.3 (10.0) y |
GIS (residential address) Traffic proximity to nearest A1–A3 roadFootnote b Linear models for distances of 0 to 499 m compared with addresses ≥500 m away |
Age, sex, individual-level SES, area-level SES, individual-level smoking, race, lifestyle variables, medical history, co-morbidities, family background variables |
107,130 |
SCDFootnote c: |
Linear (per 100 m closer) |
SCD: |
Fatal CHD: |
Fatal CHD: |
|||||||
Kulick et al., 2018 |
Cohort |
Stroke-free multiethnic urban population aged ≥40 y residing in Northern Manhattan, New York Males: 37.2% |
GIS (residential address) Median distance from major roadway (A1 or A2)Footnote b: 248.1 m Reference group: ≥400 m 17% of cohort lived <100 m from a major roadway |
Age, sex, individual-level SES, area-level SES, individual-level smoking, race, lifestyle variables, activity lifestyles, medical variables |
3,287 |
All-cause: |
<100 m vs. reference 100 - <200 m vs. reference 200 - <400 m vs. reference log-transformed |
All-cause:
|
CSD: |
CSD:
|
|||||||
| USA – Patient population | ||||||||
Medina-Ramón et al., 2008 |
Cohort |
Adult residents of Greater Worcester, Massachusetts, hospitalized with heart failure and discharged alive in 2000 Males: 43.8% |
GIS (zip code) Distance to major roadway:
|
Age, sex, area-level SES, ethnicity, medical history, and clinical variables |
1,389 |
All-cause: |
Distance to major roadway: |
All-cause: |
Wilker et al., 2013 |
Cohort |
Patients aged ≥21 y admitted at Beth Israel Deaconess Medical Center with ischemic stroke; residents of greater Boston metropolitan area, Massachusetts Females: 54.55% |
GIS (residential address) Distance to roadway with >10,000 vehicles/day Reference group: >400 m |
Age, sex, area-level SES, individual-level smoking, medical history, comorbidities |
1,683 |
All-cause: |
≤100 m vs. reference >100–200 m vs. reference >200–400 m vs. reference |
All-cause:
|
| Europe – General population | ||||||||
Hoek et al., 2002 |
Cohort |
Adults aged 55–69 y residing in the Netherlands
|
GIS (residential address) Exposed group: residence within 100 m of a freeway or within 50 m of a major urban road |
Age, sex, individual-level SES, area-level SES, individual-level smoking, Quetelet index |
3,464 |
All-cause: |
Exposed (background concentration of black smoke [BS]) Exposed (background concentration of NO2) |
All-cause: |
CPD: |
CPD: |
|||||||
Gehring et al., 2006 |
Cohort |
Females in mid-50s of German nationality living in 10 areas in 7 cities in North Rhine-Westphalia, Germany Age: 50–59 y |
GIS (residential address) Distance to major roads (defined as roads with ≥10,000 cars/day) Exposed group: ≤50 m Reference group: >50 m |
Sex, individual-level SES, individual-level smoking |
4,230 |
All-cause: |
Exposed vs. reference |
All-cause: |
CPD: |
CPD: |
|||||||
Beelen et al., 2008 |
Cohort Full cohort analyses |
Adults aged 55–69 y living in 204 municipalities throughout the Netherlands Males (cases; non-cases): 65.5%; 45.4% |
GIS (residential address) Exposed group: living near a major road (≤100 m of motorway or ≤50 m of local road with traffic intensity >10,000 motor vehicles/24 h) Reference group: not living near a major road |
Age, sex, area-level SES, individual-level smoking |
117,528 |
All-cause: |
Exposed vs. reference Model include BS background concentration |
All-cause: |
CSD: |
CSD: |
|||||||
RD: |
RD: |
|||||||
Beelen et al., 2009 |
Cohort Full cohort analyses |
Adults aged 55–69 y living in 204 municipalities throughout the Netherlands Males (cases; non-cases): 69.1%; 47.2% |
GIS (residential address) Exposed group: living near a major road (≤100 m of motorway or ≤50 m of local road with traffic intensity >10,000 motor vehicles/24 h) Reference group: not living near a major road |
Age, sex, area-level SES, individual-level smoking |
117,528 |
CSD: |
Exposed vs. reference Model includes BS background concentration |
CSD: |
CHD: |
CHD: |
|||||||
CBVD: |
CBVD: |
|||||||
HF: |
HF: |
|||||||
Cardiac dysrhythmia: |
Cardiac dysrhythmia: |
|||||||
Brunekreef et al., 2009 (HEI report) |
Cohort Full cohort analyses |
Adults aged 55–69 y living in 203 municipalities throughout the Netherlands Males (cases; other subjects): 65.5%; 45.4% |
GIS (residential address) Median: 485 m Exposed group: living near a major road (≤100 m of a freeway or ≤50 m of a major road with 10,000 motor vehicles/day) Reference group: not living near a major road |
Age, sex, area-level SES, individual-level smoking, regional variation |
105,296 |
All-cause: |
Exposed vs. reference Model includes average BS background concentration |
All-cause: |
CSD: |
CSD: |
|||||||
RD: |
RD: |
|||||||
Huss et al., 2010 |
Swiss National Cohort |
Swiss National Cohort of persons aged 30+ y (Switzerland) Females (per distance to main road quartile) ranged from 52%–53% Median age (per distance to main road quartile) ranged from 50.2–51.2 y |
GIS (residential address) Distance to main road (major road network and interconnecting road networkFootnote e) Reference group: ≥200 m |
Age, sex, individual- and area-level SES factors |
4,580,311 |
CSD: |
<50 m vs. reference 50–99 m vs. reference 100–199 m vs. reference |
CSD:
|
Acute MI: |
Acute MI:
|
|||||||
Stroke: |
Stroke:
|
|||||||
Raaschou-Nielsen et al., 2012 |
Diet, Cancer, and Health Cohort Study (1993–2009) |
Adults aged 50–64 y living in the Copenhagen and Aarhus areas, born in Denmark, and with no previous cancer diagnosis Males: 47.5% |
GIS (residential address) Exposed group: living within 50 m of a major road (≥10,000 vehicles/day) Reference group: living >50 m % of participants living within 50 m: 8.0% |
Age, sex, individual-level SES, area-level SES, individual smoking, lifestyle and dietary variables, occupational exposure, marital status |
52,061 |
All-cause: |
Exposed vs. reference |
All-cause: |
CSD: |
CSD: |
|||||||
CHD: |
CHD: |
|||||||
CBVD: |
CBVD: |
|||||||
Cesaroni et al., 2013 |
Cohort |
Adults aged ≥30 y who resided in Rome, Italy, ≥5 y
|
GIS (residential address) Distance to high traffic road with >10,000 vehicles/ day Mean (SD): 232 (224) m Median: 165 m IQR: 228 (308–80) m Range: 2–946 m Reference group: ≥250 m |
Age, sex, individual-level SES, area-level SES, marital status, place of birth |
1,265,058 |
All-cause: |
|
All-cause:
|
CSD: |
CSD:
|
|||||||
CHD: |
CHD:
|
|||||||
CBVD: |
CBVD:
|
|||||||
RD: |
RD:
|
|||||||
Heinrich et al., 2013 |
Cohort |
Females in mid-50s of German nationality living in 10 areas in 7 cities in North Rhine-Westphalia, Germany Age: 50–59 y |
GIS (residential address) Proximity to major roadway (≥10,000 cars/day) Exposed group: ≤50 m Reference group: >50 m |
Age, sex, individual-level SES, individual-level smoking |
4,752 |
All-cause: |
Exposed vs. reference |
All-cause: |
CPD: |
CPD: |
|||||||
RD: |
RD: |
|||||||
| Europe – Patient population | ||||||||
Nawrot et al., 2011 |
Cohort |
Patients who underwent lung transplantation in 1997–2008 with long-term follow-up at UZ Leuven, Belgium Females (close to major road; farther away from major road): 53%; 41% Mean age (close to major road; farther away from major road): 47.5±14.3 y; 46.3±13.9 y |
GIS (residential address) Proximity to a major road (i.e., highways, national roads or large local roads) Exposed group: ≤171 m (assigned based on lowest tertile) Reference group: >171 m |
Age, sex, individual-level SES, transplantation-specific variables |
281 |
All-cause: |
Exposed vs. reference |
All-cause: |
Goeminne et al., 2014 |
Cohort |
Patients aged 18–65 y with non-cystic fibrosis bronchiectasis who visited outpatient clinic at University Hospital in Leuven, Belgium Females: 55% |
GIS (residential address) Distance to a major road (no additional information) |
Age, sex, individual-level SES, individual-level smoking, clinical variables |
183 |
All-cause: |
10-fold increase in distance (m) |
All-cause: |
Ruttens et al., 2017 |
Cohort Macrolide-free group |
Patients who underwent lung transplantation during study period in 13 major lung transplant centres across 10 European countries Males: 52% |
GIS (residential address) Distance to freeway: IQR: 1,233 m Distance to major road: Total road length within different buffers: IQR for:
|
Age, sex, transplantation-specific variables |
3,556 |
All-cause: |
Distance to freeway: 1,233 m Distance to major road: 241 m Total road length within buffers:
|
All-cause:
|
| Asia – General population | ||||||||
Hadley et al., 2022 |
Golestan Cohort Study (2004–2008) |
Adults aged 40–75 y residing across northeastern Golestan, Iran; ~80% from 326 rural villages (ranging in size from 20 to 150 residents); 20% randomly selected from Gonbad City (130,000 residents) Females: 57% |
GIS (geographic centre of village for rural residents; location of primary health centre for residents of Gonbad City) Proximity to traffic Exposed groupFootnote f: living within 100 m of a minor highway or within 500 m of a major highway Reference group: not exposed |
Age, sex, individual-level SES, area-level SES, individual-level smoking, ethnicity, marital status, medical history, substance use |
45,052 |
All-cause: |
Exposed vs. reference |
All-cause: |
CSD: |
CSD: |
|||||||
Abbreviations: BMI: body mass index; BS: black smoke; CanCHEC: Canadian Census Health and Environment Cohort; CBVD: cerebrovascular disease; CHD: coronary heart disease; CI: confidence interval; COPD: chronic obstructive pulmonary disease; CPD: cardiopulmonary disease; CSD: circulatory system disease; GIS: geographic information system; HF: heart failure; HR: hazard ratio; IQR: interquartile range; MI: myocardial infarction; MRR: mortality rate ratio; NLCS: Netherlands Cohort Study on Diet and Cancer; RD: respiratory disorder; RR: relative risk; SALIA: Study on the influence of air pollution on lung function, inflammation and ageing; SCD: sudden cardiac death; SD: standard deviation; SES: socio-economic status; y: year.
|
||||||||
| Reference | Cohort (Study period) | Study population | Exposure assessment method and distribution | Confounders and/or covariates | Total N | Cases | Increment | Risk estimate (95% CI) |
|---|---|---|---|---|---|---|---|---|
| USA – Patient population | ||||||||
Medina-Ramón et al., 2008 |
Cohort |
Adult residents of Greater Worcester, Massachusetts, hospitalized with heart failure and discharged alive in 2000 Males: 43.8% |
Traffic within 100 m of residence (vehicle-km/day)
Traffic within 300 m of residence (vehicle-km/day)
|
Age, sex, area-level SES, ethnicity, medical history, and clinical variables |
1,389 |
All-cause: |
Traffic within 100-m buffer: Traffic within 300-m buffer: |
All-cause:
|
Blount et al., 2017 |
Cohort |
All reported pediatric and adult tuberculosis cases in California Males: 60.8% and 58.3% for high and low traffic density, respectively Median age at diagnosis (IQR): 46.2 (30.5–62.2) y and 47.7 (30.8–64.5) y for high and low traffic density, respectively |
Traffic (vehicle-km/hr) around residence: Traffic at nearest major road around residence (vehicles/day): Traffic of highest-trafficked road (vehicles/day): |
Age, sex, individual-level SES, ethnicity, lifestyle variables, tuberculosis-specific variables |
32,875 |
All-cause: |
Traffic (vehicle-km/hr) around residence:
Traffic at nearest major road around residence (vehicles/day):
Traffic of highest-trafficked road (vehicles/day):
|
All-cause: Trend analyses
|
| Europe – General population | ||||||||
Beelen et al., 2008 |
Cohort Full cohort analyses |
Adults aged 55–69 y Males: 65.5% in case subjects; 45.4% in other subjects Median age: 64 y (range 54–70 y) in case subjects; 61 y (range 54–70 y) in other subjects |
Traffic on nearest road to residence (vehicles/day):
Sum of traffic in 100-m buffer around residence (vehicles/day):
|
Age, sex, area-level SES, individual-level smoking |
117,528 |
All-cause: |
Traffic on nearest road: Sum of traffic in 100-m buffer: |
All-cause: |
CSD: |
CSD: |
|||||||
RD: |
RD: |
|||||||
Beelen et al., 2009 |
Cohort Full cohort analyses |
Adults aged 55–69 y living in 204 municipalities throughout the Netherlands Males (cases; non-cases): 69.1%; 47.2% Median age (IQR) (cases; non-cases): 64 (61–67) y; 62 (58–65) y |
GIS (residential address) Using GIS and digital road network (from year 2001) to characterize traffic intensities in 1986 Mean (SD): 2,284 (3,767) motor vehicles/24 h |
Age, sex, area-level SES, individual-level smoking |
117,528 |
CSD: |
10,000 motor vehicles/day Model includes BS background concentration |
CSD: |
CHD: |
CHD: |
|||||||
CBVD: |
CBVD: |
|||||||
HF: |
HF: |
|||||||
Cardiac dysrhythmia: |
Cardiac dysrhythmia: |
|||||||
Brunekreef et al., 2009 |
Cohort Full cohort analyses |
Adults aged 55–69 y living in 203 municipalities (small rural communities and major cities) throughout the Netherlands Males: 65.5% in case subjects; 45.4% in other subjects Median age: 64 y (range 54–70 y) in case subjects; 61 y (range 54–70 y) in other subjects |
Traffic of nearest road to residence (vehicles/day): Sum of traffic in 100-m buffer around residence (vehicles/day): |
Age, sex, area-level SES, individual-level smoking, regional variation |
105,296 |
All-cause: |
Traffic on nearest road: Sum of traffic in 100-m buffer: |
All-cause:
|
CSD: |
CSD:
|
|||||||
RD: |
RD:
|
|||||||
Raaschou-Nielsen et al., 2012 |
Diet, Cancer and Health cohort study |
Adults aged 50–64 y living in Copenhagen and Aarhus areas, born in Denmark and no previous cancer diagnosis Males: 47.5% |
Traffic within 200-m buffer of residence (103 vehicle-km/day): |
Age, sex, individual-level SES, area-level SES, individual smoking, lifestyle and dietary variables, occupational exposure, marital status |
52,061 |
All-cause: |
Per doubling of traffic within 200-m buffer |
All-cause: |
CSD: |
CSD: |
|||||||
CHD: |
CHD: |
|||||||
CBVD: |
CBVD: |
|||||||
Cesaroni et al., 2013 |
Cohort |
Adults aged ≥30 y who resided in Rome, Italy, ≥5 y Males: 45.5% |
Traffic in 150-m buffer around residence (vehicle-m/day):
|
Age, sex, individual-level SES, area-level SES, marital status, place of birth |
1,265,058 |
All-cause: |
Traffic within 150-m buffer by quintile (vehicle-m/day) x 106:
|
All-cause:
|
CSD: |
CSD:
|
|||||||
CHD: |
CHD:
|
|||||||
RD: |
RD:
|
|||||||
Beelen et al., 2014a |
Cohort |
22 cohorts from 13 countries; general population Females: 47.7%–100% 20 cohorts included for traffic intensity on nearest road 21 cohorts included for traffic intensity on major roads within 100-m buffer |
Traffic of nearest road to residence (vehicle-km/day): Traffic on major roads within 100-m buffer (vehicle-km/day): |
Age, sex, individual-level SES, area-level SES, individual-level smoking, environmental tobacco smoke, dietary and lifestyle variables, marital status, other SES indicators |
Traffic on nearest road: Traffic on major roads in 100-m buffer: |
All-cause: |
Traffic on nearest road: Traffic on major roads in 100-m buffer: |
All-cause:
|
Beelen et al., 2014b |
Cohort |
22 cohorts from 13 countries; general population Females (range): 63% (48%–100%) |
Traffic of nearest road to residence (vehicle-km/day): Traffic on major roads within 100-m buffer (vehicle-km/day): |
Age, sex, individual-level SES, area-level SES, individual-level smoking, environmental tobacco smoke, dietary and lifestyle variables, marital status, other SES indicators |
Traffic on nearest road: Traffic on major roads in 100-m buffer: |
CSD: |
Traffic on nearest road: Traffic on major roads in 100-m buffer: |
CSD:
|
CBVD: |
CBVD:
|
|||||||
CHD: |
CHD:
|
|||||||
MI: |
MI:
|
|||||||
Dimakopoulou et al., 2014 |
Cohort |
16 cohorts from 11 countries; general population Females range: 47.7%–100% |
Traffic intensity on nearest road to residence Sum of traffic in 100-m buffer around residence (vehicles*road length/day): |
Age, sex, individual-level SES, area-level SES, individual-level smoking, environmental tobacco smoke, dietary and lifestyle variables, marital status, other SES indicators |
307,553 |
RD: |
Traffic on nearest road: Sum of traffic in 100-m buffer: |
RD:
|
| Europe – Patient population | ||||||||
Goeminne et al., 2014 |
Cohort |
Patients aged 18–65 y with non-cystic fibrosis bronchiectasis who visited outpatient clinic at University Hospital in Leuven, Belgium Females: 55% |
Distance-weighted traffic density in a 100- or 200-m buffer around residential address Exposure distribution not provided |
Age, sex, individual-level SES, individual-level smoking, clinical variables |
183 |
All-cause: |
10-fold increase distance-weighted traffic density |
All-cause: 200-m buffer: |
Tonne et al., 2016 |
Cohort |
Residents from Greater London, UK, aged >25 y admitted to hospital with MI from hospitals that had >10 STEMI or non-STEMI admissions Males: 68% |
Volume of heavy goods vehicles (HGV) on major roads within a buffer around postcode centroid (per 1,000 vehicle-km):
|
Age, sex, area-level SES, individual-level smoking, ethnicity, medical history, MI, and STEMI-specific variables |
18,138 |
All-cause: |
HGV traffic (per 1,000 vehicle-km): |
All-cause:
|
| Asia – General population | ||||||||
Pan et al., 2021 |
Cohort |
Adults aged 30–65 y in 1991 living in Taipei and Pingtung, Taiwan |
Total vehicle traffic at monitoring site nearest to residence: Median distance from residence to monitoring site: 1.56 km |
Age, sex, individual-level smoking, BMI and other health/lifestyle variables |
12,098 |
CSD: |
Log vehicle/day |
CSD: |
Abbreviations: BMI: body mass index; BS: black smoke; CBVD: cerebrovascular disease; CHD: coronary heart disease; CI: confidence interval; COPD: chronic obstructive pulmonary disease; CSD: circulatory system disease; ESCAPE: European Study of Cohorts for Air Pollution Effects; GIS: geographic information system; HGV: heavy goods vehicles; HF: heart failure; HR: hazard ratio; IQR: interquartile range; MI: myocardial infarction; MRR: mortality rate ratio; NLCS: Netherlands Cohort Study on Diet and Cancer; REVEAL-HBV: Risk Evaluation of Viral Load Elevation and Associated Liver Disease/ Cancer Hepatitis B Virus; RD: respiratory disorder; RR: relative risk; SES: socio-economic status; SD: standard deviation; STEMI: ST-elevation myocardial infarction; y: year. |
||||||||
Footnotes
- Footnote 1
-
The monetized values represent economic welfare values that consider the potential impacts associated with treatment costs, lost productivity, pain and suffering, and the impacts of changes in mortality risk (Judek et al., 2019).
- Footnote 2
-
A scoping review systematically maps the available literature on a broad topic, identifying key concepts, types and sources of information, and gaps in the research.