
Traffic-related air pollution: An umbrella review-based human health risk assessment on selected cancer types

Download in PDF format
(1.76 MB, 106 pages)
Organization: Health Canada
Date published: 2022-03
Cat.: H144-97/2022E-PDF
ISBN: 978-0-660-41681-6
Pub.: 210603
Table of contents
- Acknowledgements
- List of tables
- List of figures
- List of abbreviations
- Executive summary
- Chapter 1. Introduction
- Chapter 2. Methodology
- Chapter 3. Umbrella review
- Chapter 4. Biological evidence review
- Chapter 5. Risk characterization and evaluation of causality
- Chapter 6. Conclusion
- Key uncertainties and gaps
- References
- Appendices
- Appendix A. Refined search strategy for literature update
- Appendix B. Study quality assessment table using the AMSTAR 2 rating instrument adapted to environmental epidemiology studies
- Appendix C. List of cited studies across the reviews included in this assessment
- Appendix D. Summary table of the primary reviews considered in the umbrella review
- Footnotes
Acknowledgements
This risk assessment was reviewed by the following external scientific experts:
Trevor Dummer, M.Sc., Ph.D. (University of British Columbia)
Paul Villeneuve, Ph.D. (Carleton University)
List of tables
- Table 1.1. Summary of health outcomes and classification of causal associations from the HEI review (HEI Panel on the Health Effects of Traffic-Related Air Pollution 2010) a
- Table 1.2. Summary of health outcomes and classification of causal associations from Health Canada (2020)
- Table 2.1. Critical domains of the AMSTAR 2 rating instrument adapted for environmental epidemiology studies
- Table 2.2. Weight of evidence for determination of causality (derived from US EPA 2015)
- Table 3.1. Subgroup analysis: random-effects meta-analyses of the associations between traffic density and risk of leukemia as reported in Sun et al. (2014)
- Table 3.2. Subgroup analysis: random-effects meta-analyses of the associations between postnatal residential traffic exposure and childhood leukemia as reported in Boothe et al. (2014)
- Table 3.3. Subgroup analysis: random-effects meta-analyses of the associations between indicators of traffic and childhood leukemia as reported in Filippini et al. (2015)
- Table 3.4. Meta-analyses of the associations between childhood leukemia and traffic density or TRAP models as common sources or surrogates of benzene exposure (Carlos-Wallace et al. [2016])
- Table 3.5. Fixed-effects meta-analyses of the associations between TRAP and childhood leukemia as reported in Gong et al. (2019)
- Table 3.6. Stratified analysis: random-effects meta-analysesa of the associations between indicators of traffic and childhood leukemia in all children as reported in Filippini et al. (2019)
- Table 3.7. Subgroup analyses for the association between professional drivers and risk of lung cancer as reported in Tsoi and Tse (2012)
- Table 3.8. Pooled analysis for risk of lung cancer and TRAP pollutant as reported in Chen et al. (2015)
- Table 3.9. Pooled analysis for risk of lung cancer in professional drivers as reported in Chen et al. (2015)
- Table 3.10. Pooled estimates for the association between TRAP exposure and risk of lung cancer as reported in Hamra et al. (2015)
- Table 4.1. IARC Classifications for selected agents
List of figures
- Figure 2.1. Study selection process for the scoping review and the umbrella review
- Figure 5.1. Forest plot of pooled risk estimates from SR-MAs for exposure to traffic density and risk of childhood leukemia; n represents the number of studies included in the meta-analysis, and I2 or χ2 represents the heterogeneity
- Figure 5.2. Forest plot of pooled risk estimates from SR-MAs for exposure to traffic density and risk of childhood leukemia stratified by leukemia subtype and exposure window; n represents the number of studies included in the meta-analysis, and I2 represents the heterogeneity
- Figure 5.3. Forest plot of pooled risk estimates from SR-MAs for exposure to NO2 and childhood leukemia; n represents the number of studies included in the meta-analysis, and I2 represents the heterogeneity
- Figure 5.4. Forest plot of pooled risk estimates from SR-MAs for exposure to benzene and childhood leukemia; n represents the number of studies included in the meta-analysis, and I2 represents the heterogeneity
- Figure 5.5. Forest plot of pooled risk estimates from SR-MAs for ambient exposure to TRAP and risk of adult lung cancer based on an increment of 10 µg/m3 of NO2 or NOX; n represents the number of studies included in the meta-analysis, and I2 represents the heterogeneity
- Figure 5.6. Forest plot of pooled risk estimates from SR-MAs for exposure to TRAP and risk of adult lung cancer in professional drivers; n represents the number of studies included in the meta-analysis, and I2 represents the heterogeneity
List of abbreviations
- 8-OHdG
- 8-hydroxydeoxyguanosine
- ALL
- acute lymphocytic leukemia
- AML
- acute myeloid leukemia
- ANLL
- acute nonlymphocytic leukemia
- AMSTAR 2
- A Measurement Tool to Assess Systematic Reviews 2
- BC
- black carbon
- B[a]P
- benzo[a]pyrene
- CCME
- Canadian Council of Ministers of the Environment
- CI
- confidence interval
- DALY
- disability-adjusted life year
- DE
- diesel exhaust
- DEP
- diesel exhaust particles
- GBD
- Global Burden of Disease Study
- GE
- gasoline exhaust
- GEP
- gasoline exhaust particles
- HEI
- Health Effects Institute
- IARC
- International Agency for Research on Cancer
- ISA
- Integrated Science Assessment
- IT
- intratracheal
- LUR
- land-use regression
- MA
- meta-analysis
- MN
- micronucleus
- NO2
- nitrogen dioxide
- NOx
- nitrogen oxides
- NOS
- Newcastle-Ottawa Scale
- O3
- ozone
- OR
- odds ratio
- PAH
- polycyclic aromatic hydrocarbon
- PM
- particulate matter
- PM2.5
- particulate matter with a diameter less than 2.5 micrometres
- PM10
- particulate matter with a diameter less than 10 micrometres
- RoB
- risk of bias
- ROS
- reactive oxygen species
- RR
- relative risk
- SCE
- sister chromatid exchange
- SIR
- standardized incidence ratio
- SES
- socioeconomic status
- SO2
- sulphur dioxide
- SR-MA
- systematic review–meta-analysis
- STROBE
- Strengthening the Reporting of Observational Studies in Epidemiology
- TRAP
- traffic-related air pollution
- UFP
- ultrafine particles
- US EPA
- United States Environmental Protection Agency
- VOC
- volatile organic compound
Executive summary
Traffic, a major source of air pollutants, is a global issue. In urban areas of the world, including in Canada, the impacts of traffic are of particular concern. The mixture of vehicle exhausts, secondary air pollutants formed in the atmosphere from vehicle emissions, evaporative emissions from vehicles, and other non-combustion emissions (e.g., road dust, break wear, and tire wear) is referred to as traffic-related air pollution (TRAP). Two broad categories of exposure surrogates have widely been used in the TRAP literature to assess the contribution of traffic emissions to ambient air pollution: (1) assessment of individual traffic-related pollutants such as NO2, PM2.5, and, benzene; and (2) measures based on traffic and road network infrastructure such as distance to the nearest road and measures of traffic density. Of the individual TRAP components, NO2 is considered to be the most direct measure of TRAP, since local traffic sources have been reported to contribute up to 80% of ambient NO2. Alternatively, measures based on traffic, while simple and cost-effective, can vary substantially between studies, thus limiting the ability to readily compare and contrast the results of these studies.
The objective of this risk assessment is to evaluate the association of cancer with TRAP exposure in order to inform and support programs and policies designed to mitigate exposure to, and health impacts of, TRAP in Canada. TRAP best represents the real-world pollutant mixture that many Canadians are exposed to on a daily basis. An estimated 10 million people in Canada, which is almost 1/3 of the total population, live in elevated TRAP exposure zones (i.e., within 500 m of highways or 100 m of major urban roads). In addition, urban Canadians spend on average an hour or more of daily time in microenvironments influenced by moderate to heavy traffic, including travelling in a vehicle or being engaged in active transportation (e.g., walking, cycling).
An umbrella review approach was used to systematically search, organize, and evaluate existing epidemiological evidence from multiple systematic reviews or critical reviews, including reviews with quantitative synthesis, on the impact of TRAP exposure on cancer. Systematic reviews on genotoxicity were also considered as part of the evidence to support biological plausibility. For this risk assessment, 25 publications were reviewed and evaluated. The evidence synthesis also included mechanistic evidence gathered from a review of existing assessment documents for components of TRAP. Together, the umbrella review and the review of the biological evidence (including panel studies, controlled human exposure studies, animal toxicology studies, and in vitro studies) from recent systematic reviews and existing assessment documents were conducted to support a weight of evidence approach to determine the causal role of TRAP exposure on childhood leukemia and adult lung and breast cancers.
Based on a weight of evidence approach, it is concluded that:
- there is sufficient evidence that the relationship between TRAP exposure and childhood leukemia is likely to be causal;
- there is sufficient evidence of a causal relationship between TRAP exposure and lung cancer in adults;
- the evidence is suggestive of, but not sufficient to infer, a causal relationship between TRAP exposure and breast cancer in adults.
As the study of the health effects of TRAP is an active field of research, there may be a number of recent and relevant primary studies that have not been considered in the development of these conclusions. Additional research and analyses will lead to a greater understanding of the association between TRAP and cancer, especially with respect to breast cancer and other cancer types not evaluated in this assessment. As such, these conclusions may be updated and expanded in the future to include other cancer types.
Chapter 1 Introduction
1.1 Background
Air pollution is a global health concern. For 2019, the Global Burden of Disease Study (GBD) estimated that over 6.67 million deaths and 213 million disability-adjusted life years (DALYs) globally were attributable to air pollution (GBD Risk Factor Collaborators 2020; IHME 2019). Additionally, of the 87 risk factors considered in the GBD, ambient particulate matter (PM) was the only environmental risk factor in the top 10 risks. Using a methodology similar to the GBD, Health Canada has estimated that 15,300 premature deaths per year in Canada are linked to air pollution from PM with a median mass aerodynamic diameter less than 2.5 micrometres (PM2.5), nitrogen dioxide (NO2), and ozone (O3) (Health Canada 2021).
Around the world, traffic is a major source of air pollutants, especially in urban areas. The mixture of vehicle exhausts, secondary air pollutants formed in the atmosphere from vehicle emissions, evaporative emissions from vehicles, and other non-combustion emissions (e.g., road dust, brake wear, and tire wear) is referred to as traffic-related air pollution (TRAP). As a source of air pollution, TRAP is ubiquitous and predominates in urban areas. However, TRAP's high spatial and temporal variability, the lack of a unique marker for this source and differences in fleet composition over space and time make TRAP a particularly challenging exposure to study (Khreis and Nieuwenhuijsen 2017). Two broad categories of surrogates have been widely used in the TRAP literature to assess the contribution of traffic emissions to ambient air pollution: (1) assessment of individual traffic-related pollutants such as NO2, PM2.5, and, benzene; and (2) measures based on traffic and road network infrastructure such as distance to the nearest road and metrics of traffic density (Health Effects Institute [HEI] Panel on the Health Effects of Traffic-Related Air Pollution 2010). Of the individual TRAP components, NO2 is considered to be the most direct measure of TRAP exposure, since local traffic sources have been reported to contribute up to 80% of ambient NO2, while the traffic-attributable contributions to ambient PM2.5 are much lower at 9% to 66% (Khreis and Nieuwenhuijsen 2017). Although ambient benzene levels have decreased as a result of stringent regulations in Canada, on-road mobile sources constitute the principal source of atmospheric emissions of benzene (Canadian Council of Ministers of the Environment [CCME] 2012). Concentrations of benzene tend to be higher in vehicles and at urban roadsides, with levels decreasing with increasing distance from the source (e.g., levels decreasing from roadside, to urban areas, to rural areas) (CCME 2012; HEI 2010). In comparison to use of specific air pollutants, measures based on traffic and road network parameters, such as distance to roadway and traffic density, are intuitively specific to traffic sources and are simple and cost-effective to obtain (Khreis and Nieuwenhuijsen 2017). However, these metrics may not account for the volume of traffic or the types of vehicles (e.g., proportion of cars and trucks), which are key determinants for the relative concentrations of pollutants in the TRAP mixture. In addition, the traffic metrics can vary substantially between studies (e.g., differing distances to roadways; different road classifications), limiting the ability to readily compare and contrast the results. In 2010, the HEI published a critical review of the literature on emissions, exposure, and health effects of TRAP (HEI 2010). With respect to health effects, the epidemiological literature was evaluated to infer the presence of causal associations between TRAP exposure and health outcomes. In support of that evaluation, the toxicological literature was reviewed to identify any biological mechanism(s) for the purposes of understanding the role of traffic emissions in the effects observed in the epidemiological studies. The HEI review classified the causal associations between exposure to TRAP and a number of health outcomes (Table 1.1).
| Health outcome | Classification of causal association |
|---|---|
| Mortality and morbidity | |
| All-cause and cardiovascular mortality | Suggestive but not sufficient |
| Cardiovascular morbidity | Suggestive but not sufficient |
| Asthma and respiratory (children) | |
| Asthma incidence and prevalence | Sufficient, or suggestive but not sufficient |
| Exacerbations of symptoms with asthma | Sufficient |
| Exacerbations of symptoms without asthma | Inadequate and insufficient |
| Health care utilization | Inadequate and insufficient |
| Asthma and respiratory (adults) | |
| Adult-onset asthma | Inadequate and insufficient |
| Respiratory symptoms | Suggestive but not sufficient |
| Respiratory | |
| Pulmonary function (all ages) | Suggestive but not sufficient |
| Chronic obstructive pulmonary disease | Inadequate and insufficient |
| Allergy | Inadequate and insufficient |
| Other health outcomes | |
| Birth outcomes | Inadequate and insufficient |
| Cancer (not related to occupational exposure to diesel exhaust) | Inadequate and insufficient |
|
|
Since the publication of the HEI review, TRAP has remained an active area of environmental health research. To this end, Health Canada has evaluated the role of TRAP in adverse effects relating to asthma, allergy, and lung function (Health Canada 2020), the conclusions of which are provided in Table 1.2. Health Canada will subsequently publish several reports characterizing and evaluating exposure to TRAP, other health effects of TRAP exposure, and the associated health impacts for the Canadian context. This current report focuses on TRAP exposure and the risk of cancer.
| Health outcome | Classification of causal association |
|---|---|
| Asthma incidence (children) | Causal relationship |
| Asthma prevalence (children) | Causal relationship |
| Asthma incidence (adults) | Inadequate to infer a causal relationship |
| Asthma prevalence (adults) | Suggestive of, but not sufficient to infer, a causal relationship |
| Allergic sensitization and allergic responses | Suggestive of, but not sufficient to infer, a causal relationship |
| Lung function | Likely to be a causal relationship |
Previously, Health Canada conducted human health risk assessments of diesel exhaust (DE) (Health Canada 2016a) and gasoline exhaust (GE) (Health Canada 2017). These risk assessments identified considerable Canadian population health impacts associated with the incremental contribution to ambient criteria air contaminant concentrations resulting from emissions from on-road diesel and gasoline vehicles. In addition, Health Canada evaluated the weight of evidence that the mixture of DE and the mixture of GE are causal in the development of adverse health outcomes. Among the final conclusions of the DE assessment, it was concluded that DE causes acute respiratory effects and lung cancer and is likely to cause chronic respiratory effects, immunological effects, and acute cardiovascular effects. For lung cancer specifically, the causality conclusion was based on evidence from occupational epidemiologic studies with substantial supporting biological evidence. From the GE assessment, it was also determined that the evidence was suggestive of a causal relationship between exposure to the GE mixture and respiratory effects but was inadequate to infer a causal relationship for cancer and other health effects. For cancer specifically, the causality conclusion was based on insufficient study quantity, quality and relevance in the epidemiological and biological literature for evaluating carcinogenic effects associated with exposure to GE as a mixture.
Examination of the health effects of DE and GE using epidemiological study designs applied to general populations has been limited by the fact that populations are generally co-exposed to both GE and DE and that unique exposure surrogates for these mixtures have not been identified, complicating the exposure assessment. However, extensive epidemiological research has been conducted to elucidate the health effects of all on-road vehicle emissions (i.e., TRAP), which represent the real-world pollutant mixture that Canadians are exposed to on a daily basis. An estimated 10 million people, which is almost one-third of the total population, live within 500 m of highways or 100 m of major urban roads (Brauer et al. 2013). Additionally, urban Canadians spend over an hour a day of their daily time in microenvironments influenced by moderate to heavy traffic, including travelling in a vehicle or being engaged in active transportation (Matz et al. 2018). In Canada, traffic constitutes a major source of outdoor air pollution and also contributes to PM in outdoor air pollution, both of which have been evaluated by the International Agency for Research on Cancer (IARC 2016) and determined to be carcinogenic to humans (Group 1). IARC (2014) has also classified DE as carcinogenic to humans (Group 1) and GE as possibly carcinogenic to humans (Group 2B).
Building on the fuel-specific human health risk assessments for DE and GE and IARC's conclusions that outdoor air pollution, PM in outdoor air pollution, and DE are carcinogenic to humans (Group 1) and that GE is possibly carcinogenic to humans (Group 2B), this risk assessment investigates the association between TRAP exposure and cancer. This health endpoint has been evaluated and reported in the scientific literature in association with exposure to air pollution, including TRAP or its components.
1.2 Approach and objectives
For this risk assessment, an umbrella review approach was taken. Umbrella reviews systematically search, organize, and evaluate existing evidence from multiple systematic reviewsFootnote 1, with or without meta-analysesFootnote 2 (Aromataris et al. 2015). The most characteristic feature of umbrella reviews is that this type of evidence synthesis considers only the highest level of evidence for inclusion. Specifically, published systematic reviews with or without meta-analyses are the unit of analytical review in an umbrella review. This approach allows for a rapid review of the overall evidence base and highlights the consistency or contradictions within it. An umbrella review is ideal for assessing whether systematic reviews addressing similar questions independently make similar observations and reach generally similar conclusions. However, the literature base is only as recent as the most recent systematic review, and any recently published primary studies may not have been considered. Importantly, the objective of an umbrella review is not to repeat the process of identifying, evaluating, and synthesizing the primary studies included in the systematic reviews with or without meta-analyses that make up the umbrella review. Rather, the objective is to provide a summary of the existing research syntheses to develop an overall interpretation of a broad topic area.
For this umbrella review–based risk assessment, systematic reviews, systematic review–meta-analyses (SR-MAs), and critical reviews (i.e., a comprehensive review of the literature) were included. While these critical reviews were not conducted as systematic reviews, they nonetheless provided a comprehensive overview of the research findings for the purpose of determining the existence of a causal relationship between exposure and health effects and were therefore considered informative for this risk assessment.
The objective of this risk assessment is to use an umbrella review approach to evaluate the associations between TRAP exposure and cancer, based on reviews of the epidemiological literature. From this evaluation, a weight of evidence approach was used to determine the causal role of TRAP in the health outcome endpoints of childhood leukemia and lung cancer and breast cancer in adults. Other cancer types were not assessed due to a lack of systematic reviews upon which to base the umbrella review. Furthermore, mechanistic evidence gathered from a review of systematic reviews and from existing risk assessment documents for components of TRAP was considered to assess the biological plausibility of the associations identified in the umbrella review and to support the determination of causality.
This risk assessment document is organized as follows:
- Chapter 1 provides background information and describes the approach and objectives;
- Chapter 2 describes the methodology undertaken for this risk assessment in detail;
- Chapter 3 presents the epidemiological evidence assessed in the umbrella review;
- Chapter 4 presents supporting biological evidence;
- Chapter 5 critically evaluates the evidence from Chapters 3 and 4 for determination of causality;
- Chapter 6 presents the conclusions of the risk assessment and identifies the key uncertainties and gaps.
Chapter 2 Methodology
In this chapter, the methodology undertaken for this risk assessment is described in detail. Section 2.1 outlines the scoping review process utilized to identify the relevant epidemiological literature relating to TRAP exposure and adverse health outcomes, as well as the subsequent literature search update specific to the health endpoints (cancer) considered in the umbrella review. Section 2.2 details the process used to appraise the quality of the review articles for the umbrella review of the epidemiological evidence. Section 2.3 describes how the biological evidence related to TRAP and the health endpoints of interest was used to assess the biological plausibility and identifies the sources of this evidence. Lastly, Section 2.4 presents the criteria used to determine the level of causality in the weight of evidence approach.
2.1 Scoping review and literature search update
As a first step, a scoping reviewFootnote 3 of the epidemiological literature on the human health effects of TRAP was conducted (Matz et al. 2019). The primary research question for this scoping review was as follows: What is the current body of scientific literature regarding the association between TRAP exposure and adverse human health endpoints, including effects in various systems: respiratory, cardiovascular, immunological, reproductive/developmental, and nervous, as well as other health endpoints such as cancer and mortality? The scoping review included primary epidemiological research articles and some review types (as described below) that were published in peer-reviewed journals and address the scoping review objectives. The observational study designs that were included were case-control, cohort, cross-sectional, panel, ecological, time-series, and case-crossover designs. Biological studies were included only if human subjects were involved in the study (i.e., controlled human exposure studies). Review types included in the scoping review were systematic reviews, meta-analyses, scoping reviews, and critical reviews that included an evaluation of causal association. With respect to TRAP and traffic exposure metrics, the inclusion criteria were adapted from the critical review of TRAP by the HEI Panel on the Health Effects of Traffic-Related Air Pollution (2010). These criteria allowed the reviewers to identify the studies that were TRAP- or traffic-centric from a larger body of general air pollution studies. Exposure metrics meeting the inclusion criteria included distance to roadways; measures of traffic density; modelling (e.g., land-use regression [LUR] and dispersion) that estimated traffic-specific exposure; traffic-based source apportionment; occupations characterized by traffic exposure (e.g., taxi drivers and truckers); subjects in locations characterized by level of traffic exposure (e.g., high- vs. low-exposure sites); and monitoring of TRAP-related pollutants (e.g., NO2 and BC) when the measurements could be reasonably related to traffic sources (e.g., roadway-specific monitoring). To limit any confounding due to gasoline vapours (due to the volatile nature of gasoline fuel), studies that characterized exposure based on proximity to gas stations or service stations were excluded from the scoping review.
The literature searches were conducted by a Health Canada librarian in two databases, Ovid Embase and Ovid MEDLINE, and covered the period from January 1, 2000, to April 4, 2018. The detailed search strategy and inclusion criteria are described in Matz et al. (2019). The references identified from the literature search were screened independently by two reviewers for eligibility, first by title and abstract and then by full text; disagreements were resolved by a consensus approach. To generate the evidence map, data extraction included study design parameters and human health outcomes. Descriptive summary tables were developed to provide a high-level summary of the number and types of articles evaluating the different types of health effects and cross-tabulations by study design parameters. The entire review process was managed using DistillerSR (Evidence Partners, Ottawa, ON).
From the scoping review, the association between TRAP exposure and cancer was identified as a candidate for an umbrella review–based assessment. Specifically, for childhood cancer, three SR-MAs and three systematic reviews that included an evaluation of causal association were noted; all reviews provided risk estimates for childhood leukemia. For adult cancers, three SR-MAs and one critical review pertaining to lung cancer, as well as one SR-MA and one systematic review evaluating a causal association between TRAP and genotoxicity, were also identified following the scoping review. An additional five articles with pooled risk estimates, but no systematic review analysis, were also captured but were subsequently excluded following full-text evaluation (i.e., pooled analysis only). For the purposes of this umbrella review-based assessment, a literature update using a refined search strategy that limited the scope of the studies to cancer was conducted on September 24-25, 2019; this refined search strategy is provided in Appendix A. Seven new review articles meeting the inclusion criteria (i.e., criteria established for the scoping review as described in Matz et al. [2019]) were identified as a result of the updated literature search; they include two SR-MAs on childhood leukemia, two systematic reviews on adult breast cancer, and three critical reviews on adult cancers and/or genotoxicity. As per the results of the scoping review and the subsequent literature update, childhood leukemia, adult lung cancer and adult breast cancer were identified as candidates for the umbrella review.
The study selection process is depicted in Figure 2.1.

Figure 2.1 - Text description
Figure 2.1 depicts the flow of information through the different phases of a systematic review and maps out the number of records identified, included and excluded, and the reasons for exclusions. For the scoping review: 16,328 records were identified through database searching, of which 11,797 records remained after the duplicates were removed. 11,797 records were then screened for title and abstract screening, at which point 9,435 records were excluded and the full-text of 2,362 primary and review articles were assessed for eligibility. Of these full-text articles, 1,334 were excluded with reason leaving 956 primary articles and 72 review articles in the evidence map.: 17 of the 72 review articles were eligible for cancer and genotoxicity. 1 article was identified from secondary searches. Following full-text evaluation, 7 articles were excluded and an additional 5 articles were excluded on quality appraisal.
A subset of 3 articles were separated as Genotoxicity (molecular epidemiology) articles identified for experimental evidence review. A literature search update was conducted which included 992 additional records for which 7 were included as eligible articles while 985 records were excluded, leaving 11 articles in the umbrella review.
2.2 Umbrella review: appraisal of review quality
For the umbrella review, the methodological quality of each of the SR-MAs, systematic reviews, and critical reviews identified during the scoping review was appraised using the revised A Measurement Tool to Assess Systematic Reviews (AMSTAR 2) rating instrument (Shea et al. 2017). This critical appraisal tool for systematic reviews was developed to enable the appraisal of systematic reviews of randomized and non-randomized studies of health care interventions – a field that benefits from a comprehensive guide for review authors (Higgins et al. 2019). Although the tool includes 16 domains for the assessment of reviews, it is not designed to generate an overall score. It is recommended that users of the tool identify critical domains that determine the validity of a review and the confidence that can be placed in it. Using an overall-score approach may disguise flaws and weaknesses in the critical domains.
For this umbrella review–based risk assessment, the AMSTAR 2 tool was evaluated to identify the most relevant and applicable critical domains for environmental epidemiology studies. A total of eight critical domains were identified (see Table 2.1): five domains were applicable to all reviews, and an additional three domains were applicable to quantitative syntheses only. Each review was evaluated with respect to the critical domains, and scoring the critical domains was considered a reasonable means to determine review quality. Each item was given a score of 1 if the specific criterion was met, a partial score of 0.5 if not all aspects of the criterion were met, or a score of 0 if the criterion was not met, was unclear, or was not applicable. Thus, the higher the score, the fewer the critical flaws or weaknesses that are present in the review impacting the validity of the review and the confidence that can be placed in it. Since three of the eight questions pertained to meta-analyses only, the SR-MAs were evaluated based on a maximum score of eight, while the systematic reviews without meta-analysis and the critical reviews were evaluated based on a maximum score of five. The included reviews were assessed independently by two evaluators; disagreements were resolved by a consensus approach. Review quality was characterized as low, medium, or high based on the score from the evaluation of the critical domains (see Appendix B for more information). The scoring was used to identify reviews with low scores (i.e., critical weaknesses and flaws were noted in a majority of the critical domains, resulting in low confidence in and low validity of the review); these low-quality reviews were then excluded from consideration in the umbrella review. The umbrella review entails a full evaluation of all included reviews (i.e., reviews with medium or high scores).
Table 2.1. Critical domains of the AMSTAR 2 rating instrument adapted for environmental epidemiology studies
AMSTAR 2 critical domains most relevant for environmental epidemiology studies
- Did the review authors use a comprehensive literature search strategy?
- Did the review authors describe the included studies in adequate detail?
- Did the review authors use a satisfactory technique for appraising study quality or assessing the Risk of Bias (RoB) in individual studies included in the review?
- Did the review authors account for study quality or RoB in the individual studies when interpreting/discussing the results of the review?
- Did the review authors provide a satisfactory explanation for, and discussion of, any heterogeneity observed in the results of the review?
- If meta-analysis was performed, did the review authors use appropriate methods for statistical combination of results?
- If meta-analysis was performed, did the review authors assess the potential impact of study quality or RoB in individual studies on the results of the meta-analysis or other evidence synthesis?
- If they performed a quantitative synthesis, did the review authors carry out an adequate investigation of publication bias (small-study bias) and discuss its likely impact on the results of the review?
2.3 Biological evidence
In order to evaluate the biological evidence, as well as to assess the biological plausibility of the associations between TRAP exposure and cancer identified in the umbrella review, a review of the evidence from recent systematic reviews as well as a review of assessments from internationally recognized organizations, including Health Canada, the HEI, the United States Environmental Protection Agency (US EPA), and IARC was conducted. The systematic reviews, as well as the relevant biological sections of the assessments, include reviews of panel studies, controlled human exposure studies, experimental animal studies, and in vitro studies, and were reviewed for their analysis and evaluation of the associations between TRAP exposure and cancer, including genotoxicity. Of note, in comparison to epidemiological studies, these biological studies were typically conducted with specific exposure concentrations and durations and considered exposures of TRAP components (i.e., NO2, PM2.5) and mixtures known to contribute to TRAP (i.e., DE and GE). Although many of the studies considered short-term exposure periods or elevated exposure concentrations (i.e., concentrations higher than those experienced by the general population), the biological responses observed are informative in that they provide mechanistic insights into possible pathways that can lead to the effects observed in the long-term epidemiology studies.
2.4 Determination of causality
In combination with the quality appraisal of the review articles, the quantitative syntheses from the SR-MAs were considered to provide the highest level of evidence, while the qualitative syntheses from the systematic and critical reviews provided support in the evidence base for the determination of causality. The biological evidence was used to support the associations observed in the epidemiological literature as well as to support a determination of causality.
In the weight of evidence approach used in this assessment to determine the causal role of TRAP in the development of specific health effects, consideration is given to a number of criteria, including those of causal inference developed by Bradford Hill (1965). The criteria, widely used in reviews of epidemiological literature and considered collectively in the weight of evidence evaluation, are as follows:
- Biological plausibility: there is a plausible mechanism between the exposure and the effect;
- Temporal sequence: the exposure precedes the health outcome;
- Consistency of the association: the association is reported by different researchers, for different study designs, in different populations, etc.;
- Coherence: evidence from toxicological studies, controlled human exposure studies, and epidemiological studies of various types provides support for the effects observed and potential modes of action;
- Biological gradient: there is evidence of an exposure–response relationship;
- Strength of the association: the greater the magnitude of the risk estimate, the less likely that the relationship is due to uncontrolled residual confounding; and
- Robustness of the association: the associations are robust to model specifications and adjustment for potential confounders such as weather, temporal trends, and co-occurring pollutants.
These criteria are used to inform a conclusion as to whether the relationship between TRAP exposure and a health effect is causal, likely to be causal, suggestive of a causal relationship, inadequate to infer a causal relationship, or not likely to be causal. The definitions of each of these determinations of causality are derived from the US EPA (2015) and are provided in Table 2.2. Health Canada has previously used this causality framework in the risk assessments of DE (2016a), NO2 (2016b), and GE (2017), which were based largely on evaluations of the primary literature. For this umbrella review–based assessment, similar to a previous one undertaken by Health Canada that evaluated the role of TRAP in adverse effects relating to asthma, allergy, and lung function (Health Canada 2020), the causality framework was applied while recognizing that each review publication (i.e., the unit of analysis of an umbrella review) represented a synthesis of multiple primary studies.
| Relationship | Description |
|---|---|
| Causal relationship | Evidence is sufficient to conclude that there is a causal relationship with relevant pollutant exposures (e.g., doses or exposures generally within one to two orders of magnitude of recent concentrations). That is, the pollutant has been shown to result in health effects in studies in which chance, confounding, and other biases could be ruled out with reasonable confidence. For example: (1) controlled human exposure studies that demonstrate consistent effects, or (2) observational studies that cannot be explained by plausible alternatives or that are supported by other lines of evidence (e.g., animal studies or mode of action information). Generally, the determination is based on multiple high-quality studies conducted by multiple research groups. |
| Likely to be a causal relationship | Evidence is sufficient to conclude that a causal relationship is likely to exist with relevant pollutant exposures. That is, the pollutant has been shown to result in health effects in studies where results are not explained by chance, confounding, and other biases, but uncertainties remain in the evidence overall. For example: (1) observational studies show association, but co-pollutant exposures are difficult to address and/or other lines of evidence (controlled human exposure, animal, or mode of action information) are limited or inconsistent, or (2) animal toxicological evidence from multiple studies from different laboratories demonstrates effects, but limited or no human data are available. Generally, the determination is based on multiple high-quality studies. |
| Suggestive of, but not sufficient to infer, a causal relationship | Evidence is suggestive of a causal relationship with relevant pollutant exposures but is limited because chance, confounding, and other biases cannot be ruled out. For example: (1) when the body of evidence is relatively small, at least one high-quality epidemiologic study shows an association with a given health outcome and/or at least one high-quality toxicological study shows effects relevant to humans in animal species, or (2) when the body of evidence is relatively large, evidence from studies of varying quality is generally supportive but not entirely consistent, and there may be coherence across lines of evidence (e.g., animal studies or mode of action information) to support the determination. |
| Inadequate to infer a causal relationship | Evidence is inadequate to determine that a causal relationship exists with relevant pollutant exposures. The available studies are of insufficient quantity, quality, consistency, or statistical power to permit a conclusion regarding the presence or absence of an effect. |
| Not likely to be a causal relationship | Evidence indicates there is no causal relationship with relevant pollutant exposures. Several adequate studies, covering the full range of levels of exposure that human beings are known to encounter and considering at-risk populations and life stages, are mutually consistent in not showing an effect at any level of exposure. |
Chapter 3 Umbrella review
3.1 Characteristics of the included reviews
The scoping review process and the subsequent literature search update identified 18 and sixFootnote 4 relevant epidemiological review articles, respectively. An additional relevant epidemiological review (Sun et al. 2014) was identified while screening the reference lists of included review articles. Following full-text evaluation, 16 epidemiological review articles underwent quality appraisal, and 11 review articles were included in the umbrella review. Quality appraisal of the reviews was conducted using the adapted AMSTAR 2 tool (described in section 2.2). Five reviews (Brugge et al. 2007, Pyatt and Hays 2010, Boothe 2008, Leng et al. 2019, Sahay et al. 2019) were excluded because they were categorized as unacceptable for inclusion in the risk assessment due to low quality (i.e., low validity of and low confidence in the results of the review) after evaluation of the critical domains. Six reviews (Tsoi and Tse 2012; Boothe et al. 2014; Sun et al. 2014; Chen et al. 2015; Filippini et al. 2015, 2019) were deemed to be of high quality, and the remainder (Raaschou-Nielsen and Reynolds 2006; Hamra et al. 2015; Carlos-Wallace et al. 2016; White et al. 2018; Gong et al. 2019) were found to be of medium quality. Most reviews did not account for the Risk of Bias (RoB) in the individual studies that were included in them. All studies of high or medium quality were included for evaluation in the umbrella review. Additional details and individual scores are found in the study quality assessment table in Appendix B.
Regarding the general methodology, two of the studies were systematic reviews and nine were SR-MAs. All six SR-MAs and systematic reviews on childhood cancers pertained to leukemia while all three SR-MAs on adult cancers focused on lung cancer. One systematic review on breast cancer was also identified. Overall, the reviews used were published during the period from 2006 to 2019 and included 100 unique primary studies published between 1988 and 2018. Of these unique primary studies, 34 pertained to childhood leukemia and included case-control studies (26 studies), ecological studies (six studies), and cohort studies (two studies). Of the 100 unique primary studies, 54 examined lung cancer as a health endpoint: 22 were case-control studies by design and 32 were cohort studies. Twelve of the 100 unique primary studies were reviewed in the systematic review on breast cancer and included six case-control studies and six cohort studies.
The level of overlap between the reviews, in terms of the primary studies that examined the health endpoints considered in this synthesis, was also determined in order to evaluate the breadth of the primary literature and is depicted in Table C.1 and Table C.2 of Appendix C for childhood leukemia and lung cancer, respectively. The partial overlap and variability observed in the citation of primary studies included in the reviews can be attributed to the specific objective of each review, its inclusion and exclusion criteria, and its publication date. Three primary studies (Raaschou-Nielsen et al. 2001; Langholz et al. 2002; Crosignani et al. 2004) were the most cited; they were each cited in all seven reviews pertaining to childhood leukemia. For lung cancer, while no primary study was cited in all three reviews focusing on this health endpoint, almost half of the primary studies (21 primary studies) were cited in two reviews. A summary table of these 16 review articles is provided in Table D.1 and Table D.2 of Appendix D for childhood leukemia and adult cancers, respectively.
The risk estimates included in the pooled analyses for TRAP and cancer were developed from diverse exposure assessment methods, including traffic density, specific pollutants (e.g., benzene and NO2), and occupation (i.e., employment as a professional driver). For childhood cancer, many of the primary studies utilized categorical variables to assess exposure to TRAP, including traffic density metrics and pollutant concentration. With this approach, risk estimates were evaluated based on groups with high levels of exposure compared to groups with low levels of exposure. While there may be variations between the primary studies with respect to absolute concentrations in the exposure categories, the exposure contrasts used to calculate the individual risk estimates are applicable within a given study and then appropriately pooled in the quantitative syntheses of the SR-MAs. For the adult cancers, the primary studies that considered general population exposures calculated risk estimates based on an incremental increase in pollutant concentration (e.g., per 10 µg/m3 NO2). In comparison, the occupational studies evaluated risks for workers in traffic or TRAP-dominated occupations (e.g., professional drivers) compared to appropriate control occupations (e.g., office workers).
3.2 Childhood leukemia
Childhood cancers are rare, accounting for less than 1% of all new cancer cases in Canada (Canadian Cancer Society 2021a). Leukemia, which originates in blood stem cells, is the most common type of cancer that occurs in childhood. There are many different types of leukemia; they are grouped based on the type of blood stem cell they developed from as well as on how quickly the leukemia develops and grows. Of the types of leukemia associated with childhood cancers, acute lymphoblastic leukemia (ALL) is the most common type diagnosed, representing about 75% of the diagnoses, and acute myelogenous leukemia (AML; also less commonly referred to as acute nonlymphocytic leukemia [ANLL]) is less common, representing about 20% of the diagnoses (Canadian Cancer Society 2021b). ALL occurs more frequently in young children (aged 1 to 4 years) and is more common in boys than girls. Several risk factors have been identified for childhood leukemia including: genetic syndromes, having a sibling with leukemia, radiation exposure, chemotherapy exposure, and high birth weight. Other possible risk factors include: low-level radiation, electromagnetic fields, pesticides, cigarette smoke, alcohol, benzene, and maternal exposure to paint (Canadian Cancer Society 2021b).
All of the review articles included in this risk assessment that pertained to childhood cancers focused on childhood leukemia. Of the six SR-MAs evaluating the association between TRAP and childhood leukemia, three SR-MAs (Boothe et al. 2014; Filippini et al. 2015; Carlos-Wallace et al. 2016) were identified during the scoping review, two SR-MAs (Filippini et al. 2019; Gong et al. 2019) were identified following the literature search update, and one SR-MA (Sun et al. 2014) was identified while screening the reference list of included review articles. These six SR-MAs are reviewed in chronological order in Section 3.2.1. One systematic review (Raaschou-Nielsen and Reynolds 2006) evaluating the association between TRAP exposure and childhood leukemia was also identified during the scoping review. While all review articles evaluated leukemia in children, many conducted subgroup analyses on the two main types of leukemia (ALL and AML) or restricted their inclusion criteria to these two types of leukemia only.
3.2.1 SR-MAs
Sun et al. (2014)
Using systematic review methodology, Sun et al. (2014) conducted a meta-analysis to characterize the association between local traffic density and the risk of childhood leukemia. The authors limited their analysis to original studies published in English with a case-control study design in children aged 15 years or less. The included primary studies also had to provide a clear definition of traffic density and have an odds ratio (OR) or relative risk (RR) estimate characterizing the relationship between traffic density and leukemia. For rare outcomes where the incidence is less than 10%, such as childhood cancers, the OR approximates the RR and allows for quantitative combining of primary studies (Zhang and Yu 1998). Eleven primary studies with 12 effect estimates were included in the meta-analysis. The included studies were published between 1989 and 2013 and the duration of the studies ranged from two to 27 years. They were conducted in the USA (seven studies) and Europe (four studies). The primary studies used different definitions of traffic density: number of vehicles per day (six studies), vehicle miles traveled per square mile (three studies), cumulative lengths of class 1 and 2 roads within 500 m of subjects' place of residence (one study), and number of vehicles per day multiplied by the total kilometers of roads per square kilometer (one study). The type of leukemia considered in the primary studies also differed: ALL/ANLL (four studies); ALL/AML (one study); ALL (one study); and unknown (five studies). Study quality was assessed using the Newcastle-Ottawa Scale (NOS); six primary studies scored 7 or 8 while five primary studies scored 5 or 6 out of a total of 9 stars. None of the primary studies represented a high RoB (scored less than five stars). Although Sun et al. (2014) indicated that adjusted ORs were extracted from each study to estimate the pooled OR, they did not provide additional information including how the ORs were selected (e.g., highest compared to lowest, categorical or continuous) from each of the primary studies and how potential confounding was accounted for in the primary studies. Heterogeneity was evaluated using I2 statistic and the Cochrane Q test (a chi-squared test; p-value). Since the pooled risk estimates were considered to be affected by heterogeneity (i.e., p < 0.05 or I2 > 50%), they were calculated using the random-effects model.
For the quantitative analyses, Sun et al. (2014) pooled ORs representing different definitions of traffic density and indicated that they assessed the effects of traffic density regardless of the definition used. Random-effects meta-analysis revealed a positive association that was borderline significantFootnote 5 between exposure to traffic density and childhood leukemia with a pooled OR of 1.03 (95% confidence interval [CI]: 0.98–1.09). Heterogeneity for this pooled estimate was moderate to substantial (I2 = 63.3%, p = 0.002) thus, confirming the appropriateness of the random-effects model for the quantitative synthesis. Sensitivity analyses, in which each individual study was excluded in turn, indicated that the pooled estimate was robust. There was also no indication of a publication bias by the Begg's and Egger's tests and the funnel plot was symmetrical.
Subgroup analysis by country, study duration, NOS score, and definition of traffic density was also conducted by Sun et al. (2014) and is depicted in Table 3.1. Positive associations, with mostly moderate to substantial heterogeneity, were observed for all pooled estimates resulting from this analysis but no comparison was made between the subgroup pooled ORs for a given variable. When the analysis was limited to primary studies in which traffic density was defined as vehicles per day (n = 6), the association was statistically significant (OR = 1.31: 95% CI: 1.02 – 1.67); all other associations were borderline significant.
| Group | Subgroup | Number of primary studies included in the meta-analysis | Pooled OR (95% CI) | Heterogeneity | |
|---|---|---|---|---|---|
| I2 | p-value | ||||
| All studies | N/A | 12 | 1.03 (0.98–1.09) | 63.3% | 0.002 |
| Country | USA | 7 | 1.02 (0.99–1.05) | 46.30% | 0.071 |
| Europe | 4 | 1.22 (0.98–1.53) | 81.50% | 0.001 | |
| Study duration | < 10 years | 6 | 1.06 (1.00–1.13) | 36.70% | 0.162 |
| ≥ 10 years | 5 | 1.01 (0.95–1.07) | 74.10% | 0.002 | |
| NOS score | ≤ 6 | 5 | 1.04 (0.95–1.15) | 68.20% | 0.008 |
| ≥ 7 | 6 | 1.05 (0.96–1.15) | 58.80% | 0.033 | |
| Definition of traffic density | Vehicles per day | 6 | 1.31 (1.02–1.67) | 74.40% | 0.002 |
| Other definitionsFootnote a | 5 | 1.02 (0.99–1.05) | 47.60% | 0.089 | |
N/A: not applicable |
|||||
|
|||||
Overall, a borderline significant positive association was observed between local traffic density and childhood leukemia in Sun et al. (2014). The pooled estimate was robust through sensitivity analyses and had no observed publication bias. Subgroup analyses also resulted in positive associations that were borderline or statistically significant. In particular, vehicles per day was the commonly used metric of traffic density and yielded the largest association. The moderate to substantial heterogeneity observed for the pooled estimates was attributed to variation in methods of assessment of traffic density, type of leukemia studied, characteristics of the study population, study duration, and adjustment for potential confounders across the different primary studies. To incorporate the heterogeneity, the authors used a random-effects model for meta-analysis. Several limitations in the study were also identified by the authors, including the introduction of recall and selection bias attributed to the case-control design of the study and the presence of confounding factors that were inherent in the primary studies (e.g., living conditions, education level of parents, and lifestyle factors of parents).
Boothe et al. (2014)
Boothe et al. (2014) conducted an SR-MA to examine the association between residential traffic exposure (based on distance to roads and traffic density) and childhood cancer in countries designated by the World Bank as a "high-income economy." The search was limited to English-language articles (e.g., peer-reviewed journal articles, abstracts, scientific reports, and dissertations) published and indexed from January 1980 to July 2011. Additionally, the articles were subjected to the following inclusion criteria: 1) individual-level analytic design with a control group (i.e., cross- sectional, case-control, or cohort design); 2) traffic exposure assessed at the residential address (i.e., not the postal code or census tract level); and 3) provide or be able to compute an effect size that estimates the association between residential traffic exposure and a health outcome (e.g., OR, RR, and standardized incidence ratio [SIR]). Of the 11 peer-reviewed journal articles that met the inclusion criteria, nine unique childhood cancer primary studies were retained: eight were case-control studies that reported ORs and one was a population-based study that reported SIRs as the effect measure. The latter primary study is not considered in the synthesis below and was used by the review authors in the sensitivity analyses only. All eight case-control studies considered childhood leukemia (i.e., leukemia, acute leukemia, or ALL). Although three of these primary studies also examined other childhood cancers, no quantitative analysis was conducted on these other endpoints due to an insufficient number of studies (i.e., less than four primary studies); these endpoints were also not further discussed qualitatively. Seven primary studies used population-based controls and one primary study used hospital-based controls. The primary studies were conducted in the USA (four studies) and Europe (four studies) with a study time frame (i.e., year of diagnosis) ranging from 1968 to 2004; the age at diagnosis ranged from 0 to 14 years (six studies), 0 to 10 years (one study), and 0 to 4 years (one study). Potential confounding was addressed in all eight primary studies with respect to known individual risk factors of age and gender; some primary studies also adjusted for potential confounding by socioeconomic status (SES; three studies), race (two studies), and/or ethnicity (two studies); only one study adjusted for maternal smoking. Study quality was assessed by applying a scale developed using elements of existing scales and methodological factors specific to the review (e.g., type of observational study design, quality of traffic exposure assessment, and quality of health outcome assessment). Primary studies were categorized as either high or low quality for subgroup analyses based on how they scored with respect to the median.
With respect to exposure, only one traffic exposure measure from each of the eight primary studies met the inclusion criteria; three primary studies used "multiple road measures" (e.g., cumulative traffic density within a 500-ft radius or distance-weighted traffic density within a 1500-ft buffer) and five primary studies used "single road" measures (e.g., distance to the nearest major road or traffic density on the street of residence). Exposure was ascertained based on self-reports in one primary study. Five of the primary studies assessed exposure using a single residential location (e.g., address at the time of birth, at diagnosis, or of longest duration between birth and diagnosis), while three primary studies assessed exposure during different exposure windows (e.g., birth address, diagnosis address, time-weighted lifetime average [i.e., childhood period], pregnancy, and/or childhood periods).
For the quantitative analysis, one effect estimate per health outcome was selected based on various considerations including, longest exposure duration, best characterized traffic exposure, compared highest to the lowest exposure category, addressed confounding by sociodemographic and behavioural factors, and was not adjusted for measured or modelled concentrations of traffic-related air pollutants (i.e., to avoid possible over-adjustment). Of note, the definitions of high and low traffic density varied across the primary studies but the exposure contrasts were applicable within a given study; the review authors did not standardize the risk estimates for pooled analysis. The random-effects model was chosen a priori, as exposure metrics, populations, and contexts were expected to vary substantially between primary studies.
Random-effects meta-analysis revealed a statistically significant positive association between childhood leukemia and residential traffic exposure with a weighted pooled OR of 1.39 (95% CI: 1.03–1.88). Moderate to substantial heterogeneity (I2 =57.4%, p = 0.02) was observed for the pooled estimate. A statistically-significant positive association (weighted pooled OR: 1.53; 95% CI: 1.12–2.10) was also observed when the analysis was restricted to the seven primary studies that used a postnatal window (i.e., childhood period, diagnosis address, or address of longest duration) to assess exposure; heterogeneity, in this instance, was low to moderate (I2 =37.8%, p = 0.14). Various analyses stratified by study characteristics were conducted to further examine the postnatal exposure window and are depicted in Table 3.2. Some of these analyses included a low number (two or three) of primary studies. The pooled estimates resulting from the subgroup analyses showed an increased risk of leukemia following postnatal residential traffic exposure. This increased risk was statistically significant when the analysis was restricted to primary studies with one of the following characteristics: study location limited to the USA, study period limited to pre-1995, exposure assessed by single road, cancer type restricted to leukemia, control for SES, and high score with respect to study quality. However, no statistically significant difference was observed between the subgroup pooled ORs for a given variable. Of note, heterogeneity was moderate to substantial (I2 = 42-62%) for the subgroup that included one particular primary study and low (I2 = 0-15%) for the other subgroup.
| Group | Subgroup | Number of primary studies included in the meta-analysis | Subgroup Pooled ORFootnote a (95% CI) | p-value between subgroupsFootnote b | Heterogeneity (I2)Footnote c |
|---|---|---|---|---|---|
| All postnatal studies | N/A | 7 | 1.53 (1.12–2.10) | N/A | 37.8% |
| Study location | USA | 3 | 1.84 (1.08–3.13) | 0.42 | 60.1% |
| Europe | 4 | 1.39 (0.91–2.13) | N/A | 15.3% | |
| Study time period | Pre-1995 | 4 | 1.89 (1.18–3.02) | 0.24 | 42.0% |
| 1995 or later | 3 | 1.31 (0.89–1.93) | N/A | 9.7% | |
| Type of exposure metric | Multiple road | 2 | 1.48 (0.79–2.78) | 0.81 | 0.0% |
| Single road | 5 | 1.62 (1.06–2.48) | N/A | 54.5% | |
| Cancer typeFootnote d | Leukemia | 4 | 1.83 (1.22–2.75) | 0.59 | 42.0% |
| Acute leukemia | 2 | 1.26 (0.91–1.75) | N/A | 54.8% | |
| Control for SES | Yes | 4 | 1.87 (1.12–3.11) | 0.35 | 61.1% |
| No | 3 | 1.36 (0.90–2.07) | N/A | 1.0% | |
| Quality score | High | 4 | 1.84 (1.22–2.78) | 0.18 | 42.2% |
| Low | 3 | 1.23 (0.81–1.88) | N/A | 0.0% | |
N/A: not applicable |
|||||
|
|||||
Sensitivity analysis for the postnatal exposure window, where each individual study was excluded in turn, was robust; all weighted pooled ORs remained positive and statistically significant. One primary study was found to be responsible for all heterogeneity, thus suggesting that the study's large effect estimate was an outlier. As such, Booth et al. (2014) conducted further sensitivity analyses using a smaller, more conservative OR from the same primary study and found the weighted pooled OR to be only slightly reduced, from 1.53 to 1.48 (95% CI = 1.13–1.92), and heterogeneity to decrease to an I2 = 20.8%, thus indicating that no single study was overly influential in determining the weighted pooled OR. In addition, inclusion of the SIR from the population-based primary study in the meta-analysis slightly increased the weighted pooled OR (1.57, 95% CI = 1.17–2.12). While there was indication of a publication bias by the Begg's and Egger's tests and by visual inspection of the funnel plot, Orwin's fail-safe N calculation determined that 19 missing primary studies reporting a null effect would be needed to reduce the fixed-effects pooled OR from 1.41 to 1.10.
Residential traffic exposure during a prenatal window was also considered by Boothe et al. (2014). Random-effects meta-analysis of the four primary studies that considered this exposure window resulted in borderline significant reduction in risk, with a weighted pooled OR of 0.92 (95% CI: 0.78–1.09). No heterogeneity (I2 = 0.0%, p = 0.81) or publication bias was observed. Stratified analyses were also conducted, but no data were presented. The review authors reported no statistically significant difference between subgroup pooled ORs for any of the study characteristics examined, but these analyses were likely based on a low number of primary studies.
Overall, Boothe et al. (2014) found a positive and statistically significant association between childhood leukemia and high residential traffic exposure during the postnatal period but not during the prenatal period. This increased risk during the postnatal period was also evident in all the analyses stratified by study characteristics for this exposure period, but some of these analyses were based on only two or three primary studies. Sensitivity analysis for this exposure window was robust but there was evidence of publication bias. Several methodological limitations in the included primary studies, and therefore the findings of the SR-MA, were identified by Boothe et al. (2014), including: 1) use of inconsistent traffic exposure measures across primary studies, which hindered any conclusions with respect to specific distance or traffic density associated with the pooled estimates; 2) potential exposure misclassification resulting from residential mobility, particularly when exposure was estimated using a single point-in-time birth or diagnosis address; 3) aggregation of childhood leukemia subtypes as a single outcome in the majority of primary studies and consequently in this SR-MA; 4) variations across the primary studies with respect to the confounders considered and inconsistent influence of the confounders on analysis (e.g., the effect of SES adjustments varied by study location and time period, study design, and type of SES measure used); and, 5) the relatively small number of primary studies included in the analysis, which prevented a thorough examination of potentially important sources of heterogeneity.
Filippini et al. (2015)
Filippini et al. (2015) conducted an SR-MA to evaluate the association between long-term exposure to motorized traffic exhausts and risk of childhood leukemia. Of the six ecological studies and 20 case-control studies that met the inclusion criteria, 18 case-control studies were included in the quantitative analyses and used proxies of traffic exhaust (i.e., traffic density and measured or modelled levels of NO2 and benzene, two frequently reported traffic-related air pollutants) consistent with Matz et al. (2019). An additional two case-control studies assessed exposure to exhausts through the proximity and density of petrol stations and repair garages and were not considered in the present risk assessment, as these sources were not considered sufficiently specific to TRAP. These 18 traffic-specific case-control studies were conducted in the USA (nine primary studies), Europe (eight primary studies), and Taiwan (one primary study); they were published between 1989 and 2014 with a time of diagnosis ranging from 1960 to 2009. Thirteen primary studies included children aged 0 to 14/15 years old or 0 to 10 years old and five primary studies focused on children younger than 6 years old. Fourteen primary studies collected data from national or regional cancer registries while four primary studies used the International Classification of Diseases codes to identify cases from hospital registries or death certificates. With the exception of three primary studies, all studies used the same exposure assessment method for cases and controls, had a population-based design, attempted to control for potential confounders (of which age, sex, SES, and ethnicity were the most common) and/or included sex, age or date of birth in matching variables. Four primary studies also attempted to control for (electro)magnetic fields or wire-code but environmental tobacco smoke was not listed as an adjustment factor for any of the primary studies. The exposure ranges of the different pollutants measured in the included primary studies were not provided by Filippini et al. (2015). Study quality and RoB were evaluated using the NOS tool; the median NOS value of all case-control studies included in Filippini et al. (2015) was 8, thus indicating that most of these studies were of good quality.
Although exposure window (i.e., prenatal and postnatal) was not considered in the inclusion criteria, when more than one assessment time window was available in the same primary study, priority was given in the following order: residence at diagnosis, longest continual place of residence, maternal residence at child's birth, and maternal residence during pregnancy. Most primary studies utilized residence at diagnosis (eight studies) or residence at birth (six studies), but residence of longest duration, "usual residence," residence at more than one time-point (i.e., birth, diagnosis, and lifetime average), and residence lived for at least one year within 300 m from power lines were also considered by one study each. In the 13 primary studies (corresponding to 11 unique studies) that evaluated traffic density, seven studies used a buffer ranging from approximately 150 to 500 m from home addresses while six studies considered the crude distance to major roads. For the primary studies that evaluated NO2 or benzene, when the exposure range was provided, there was no consistent reporting of exposure and different cut-off points were used to classify exposure in the individual studies. For their quantitative analyses, Filippini et al. (2015) focused on the highest versus the lowest category independently of the exposure cut-points used in the primary studies and used the most adjusted regression model when more than one was reported in the primary studies. They did not, however, normalize their analyses to any incremental increase in pollutant levels or distance.
Random-effects meta-analyses revealed positive associations that were borderline significant for traffic density (11 primary studies), NO2 (six primary studies), and benzene (four primary studies), and risk of childhood leukemia with ORs of 1.09 (95% CI = 0.96–1.23; I2 = 57.0%), 1.14 (95% CI = 0.94–1.39; I2 = 74.5%), and 1.64 (95% CI = 0.91–2.95; I2 = 50.7%), respectively; heterogeneity was moderate to substantial (p-value not provided) for the three indicators of traffic.
Subgroup analyses were done to further characterize the link between the three indicators of traffic and childhood leukemia and are depicted in Table 3.3. Limiting the quantitative analyses to primary studies with a low RoB (NOS score to ≥7) slightly decreased the heterogeneity and still yielded positive associations that were borderline significant. Although positive associations were also observed when the meta-analyses were restricted to the major leukemia subtypes (i.e., ALL and AML), these analyses included only two ORs each with the exception of traffic density and ALL, which was comprised of four ORs and displayed a borderline significant association. Additional pooled analyses to further characterize the association between traffic density and childhood leukemia depicted positive associations when the primary studies were stratified according to study location. In particular, the increased risk of childhood leukemia was statistically significant when only European studies with a low RoB were pooled; no heterogeneity was observed for this association. A strong, positive association (i.e., pooled OR of 1.49 [1.21-1.85]) that is of statistical significance was also revealed between traffic density and childhood leukemia when the analysis was restricted to postnatal exposure (i.e., residence at diagnosis or longest-lived residence); no heterogeneity was observed. In contrast, the association was null when exposure was restricted to the prenatal period (i.e., maternal residence at birth or during pregnancy).
| Traffic Indicator | Main Group | Subgroup | Number of primary studies included in the meta-analysis | Subgroup Pooled ORFootnote a (95% CI) | Heterogeneity | |
|---|---|---|---|---|---|---|
| I2 | p-value | |||||
| Traffic density | All studies | NOS score ≥7 | 8Footnote b | 1.07 (0.93–1.24) | 61.7% | 0.007 |
| ALL subtype | 4 | 1.25 (0.92–1.69) | 53.7% | 0.091 | ||
| AML subtype | 2 | 1.08 (0.53–2.19) | 44.4% | 0.180 | ||
| USA | All studies | 5 | 1.11 (0.92-1.35) | 56.3% | 0.057 | |
| NOS score ≥7 | 4 | 1.08 (0.88-1.33) | 60.1% | 0.057 | ||
| Europe | All studies | 6 | 1.34 (0.96-1.87) | 45.7% | 0.101 | |
| NOS score ≥7 | 4 | 1.56 (1.08-2.25) | 0.0% | 0.434 | ||
| Exposure window | PrenatalFootnote c | 5 | 0.97 (0.89-1.06) | 42.1% | 0.141 | |
| PostnatalFootnote d | 8 | 1.49 (1.21-1.85) | 0.0% | 0.483 | ||
| NO2 | All studies | NOS score ≥7 | 5 | 1.21 (0.97–1.52) | 78.1% | 0.001 |
| ALL subtype | 2 | 1.21 (1.04–1.41) | 0.0% | 0.872 | ||
| AML subtype | 2 | 1.06 (0.51–2.21) | 74.2% | 0.049 | ||
| Benzene | All studies | NOS score ≥7 | 4Footnote eFootnote f | 1.64 (0.91–2.95) | 50.7% | 0.001 |
| ALL subtype | 2 | 1.09 (0.67–1.77) | 0.0% | 0.630 | ||
| AML subtype | 2 | 2.28 (1.09–4.75) | 0.0% | 0.684 | ||
|
||||||
The pooled risk estimates from the random-effects meta-analyses were generally robust to sensitivity analyses (i.e., removing most influential study from each of the analyses) but there was evidence of publication bias as demonstrated by the asymmetric distribution of funnel plots across different exposure assessment methods.
Four ecological studies that met Matz et al. (2019)'s TRAP inclusion criteria were also qualitatively reviewed by Filippini et al. (2015). These ecological studies were conducted in Europe and the USA in children aged 0 to 14/15 or 0 to 20/24 years old with a time of diagnosis ranging from 1975 to 2004; each primary study included 438 to 7,143 cases. Three of the four primary studies found positive associations between car density, indicators of traffic density, or modelled benzene and 1,3-butadiene outdoor air levels and the risk of childhood leukemia. These ecological studies were not considered for the risk characterization.
Overall, the results of this SR-MA suggest that TRAP exposure may increase the risk of childhood leukemia, both for all leukemias and the major subtypes (i.e., ALL and AML), and these findings are consistent across different indicators of exposure (i.e., traffic density and TRAP pollutants) and study locations (i.e., USA and Europe). The regional variations observed were attributed by Filippini et al. (2015) to the higher frequency of residential mobility in the USA, as well as variations in pollutant mixtures and genetic variations. The pooled estimates were robust to sensitivity analyses but there was indication of publication bias. Benzene exposure appears to be a strong predictor of disease risk with an OR of 1.6, but this is based on only four primary studies. Exposure to traffic density during the postnatal exposure window was also a more important indicator of disease risk compared to exposure during the prenatal period. Several limitations were identified by Filippini et al. (2015) including unmeasured confounding, the use of different cut-points for the highest level of exposure across the primary studies, the low number of studies for some of the quantitative analyses, and the "rough" nature of traffic density as a proxy of exposure (i.e., does not generally consider type and speed of vehicles, fuel type, meteorological conditions, the influence of chemical reactions between specific emissions and other environmental agents, and the contribution of minor roads to air pollution from traffic).
Carlos-Wallace et al. (2016)
In an SR-MA investigating the association between benzene exposure and childhood leukemia, Carlos-Wallace et al. (2016) evaluated various metrics of benzene exposure including occupational and household use of benzenes and solvents, traffic density, and TRAP. Cohort and case-control primary studies published in peer-reviewed journals that provided an RR estimate, an estimate of variance, and an assessment of benzene exposure or related surrogates were included. Primary studies that assessed exposure after cancer diagnosis, or that pertained to mortality and not incidence, were excluded. Only studies and results pertaining to TRAP, as defined by Matz et al. (2019), were captured in the present risk assessment. They were subjected to the following selection order by the review authors: ambient air benzene measurements, TRAP models, and traffic density. Of the 41 primary studies that met the review authors' inclusion criteria for quantitative analyses, 12 case-control studies pertained to traffic density (five studies) or used TRAP models (i.e., land-use regression [LUR] modelling, dispersion modelling, or air monitoring of benzene, NO2, or composite; seven studies). These primary studies were conducted in Europe (eight studies) and the USA (four studies) and were published between 1999 and 2014 with a time of diagnosis ranging from 1968 to 2009. Most of the studies (eight primary studies) were conducted in children aged 0 to 14/15 years; one primary study included children aged 0 to 19 while three studies focused on younger age groups (0 to 10 years old or 0 to 5 years old). Exposure was most commonly assessed at diagnosis (seven primary studies), but also at all residences during childhood (two primary studies), at birth (one primary study), at residence of longest duration (one primary study), and during lifetime (never moved; one primary study). No exposure range was provided by the review authors. Most of the primary studies included in the SR-MA were adjusted or matched for age and sex; potential confounding by SES was evaluated in subgroup analysis. Only a few of the primary studies were adjusted for tobacco smoking. Due to the possible inclusion of three primary studies evaluating the residential proximity to gas stations in most of the quantitative analyses pertaining to TRAP, only pooled estimates specific to traffic density and TRAP models are captured in this risk assessment. Study quality was not assessed in this SR-MA. Heterogeneity was evaluated by the χ2 statistic.
For the quantitative analyses, Carlos-Wallace et al. (2016) extracted the risk estimate for the highest exposure level. Results of the meta-analyses pertaining to traffic density and TRAP models, as a common source or surrogate of benzene exposure, are provided in Table 3.4. To account for the observed heterogeneity (χ2 statistic greater than the degrees of freedom [number of primary studies minus 1]), two models of meta-analysis were used: 1) the random-effects model; and 2) the fixed-effects model to calculate the pooled RRs and the Shore-adjusted model to calculate the 95% CI (Shore et al. 1993). The latter allowed the studies to be weighed directly on precision while still adjusting for between-study heterogeneity. While the pooled RR estimates for the different exposure metrics and for primary studies limited to the USA were positive and either borderline significant or statistically significant using the random-effects model, only those using TRAP models as their exposure metric and those conducted in the USA were positive and significantly positive using the fixed-effects, Shore-adjusted model. A null association was noted for traffic density using the fixed-effects, Shore-adjusted model but when the study contributing 69% of the total weight was excluded from the analysis, the association between traffic density and childhood leukemia was positive. Although the review authors conducted additional subgroup analyses, including by leukemia subtype, time of exposure, and adjustment by SES, these analyses are not included here as they were potentially confounded by the inclusion of primary studies evaluating the residential proximity to gas stations.
| Group | Number of primary studies included in the meta-analysis | Fixed-effects, Shore adjustedFootnote aFootnote b Pooled RR (95% CI) | Random-effects Pooled RR (95% CI)Footnote a | Heterogeneity | |
|---|---|---|---|---|---|
| χ2 | p-value | ||||
| Traffic density | 11 | 0.97 (0.82–1.15) | 1.25 (0.96–1.62) | 29.92 | <0.01 |
| Traffic density (excluding one primary study)Footnote c | 10 | 1.17 (0.89–1.55) | 1.38 (0.96–1.62) | 23.26 | 0.01 |
| TRAP modelsFootnote d | 7 | 1.70 (1.16–2.49) | 1.77 (1.17–2.68) | 9.38 | 0.15 |
| TRAP studies conducted in USAFootnote e | 4 | 2.02 (1.20–3.38) | 2.13 (1.25–3.64) | 5.02 | 0.17 |
|
|||||
Overall, positive associations were noted between studies using TRAP models and childhood leukemia in Carlos-Wallace et al. (2016) and these pooled RRs were higher than those elucidated for traffic density. Although there was possible evidence of publication bias in the funnel plot of primary studies that used TRAP models, there was no indication of bias in the Begg's and Egger's tests, and removal of the largest study resulted in a pattern less consistent with publication bias. The review authors did not report on publication bias for primary studies using traffic density as their exposure metric.
Gong et al. (2019)
Gong et al. (2019) utilized a systematic review methodology to conduct a meta-analysis to investigate the association between TRAP exposure and risk of childhood leukemia. In addition to reporting an OR and 95% CI of TRAP and childhood leukemia, the primary studies had to have a case-control study design, be published in English, and be limited to non-smokers who were diagnosed with childhood leukemia. Twenty-one primary studies met the inclusion criteria and were included in the quantitative analyses. The control groups were matched for age, sex, and ethnic background with the case groups. The primary studies were conducted in the USA (11 primary studies), Europe (nine primary studies), and Taiwan (one primary study) and were published between 1989 and 2017. Characteristics of the primary studies including the age group considered, the year of diagnosis, and information on exposure beyond the metrics by which it was measured (i.e., traffic density, NO2, and benzene) were not captured by the review authors. Study quality was also not evaluated in this meta-analysis and potential confounding factors were not discussed. Similarly, levels of exposure (i.e., low, moderate, and high) were not quantitatively defined (i.e., range of exposure covered by each subgroup) in the subgroup analysis.
Gong et al. (2019), unlike other SR-MAs, did not select or prioritize a risk estimate from a primary study, instead including multiple estimates from the same primary study for inclusion in the meta-analysis. Pooled estimates of the associations between various measures of TRAP and childhood leukemia as well as those resulting from subgroup analyses stratified by the level of exposure are provided in Table 3.5. The fixed-effects model for meta-analysis was used for all the quantitative analyses after it was determined that the data were homogeneous (i.e., χ2 test for p-value > 0.05 and the I2 test value ≤50%). A small increase in the risk of childhood leukemia was observed for traffic density with an OR of 1.01; this risk increased (OR = 1.04) when considering only the studies that had a subgroup analysis for a high exposure group. Both associations were borderline significant. Also from the subgroup analysis, low and moderate levels of traffic density yielded null associations with childhood leukemia. Similarly, null associations were observed for the other measures of TRAP. Subgrouping these measures by level of exposure yielded positive associations at moderate levels of exposure only; there was no association detected for childhood leukemia at high levels of NO2 and benzene. For all quantitative analyses, greater heterogeneity was observed for NO2 (low or low to moderate) compared to traffic density and benzene, which had no or low heterogeneity.
| Indicator of TRAP | Exposure Group/SubgroupFootnote a | Number of primary studies included in the meta-analysis | Subgroup Pooled OR (95% CI) | Heterogeneity | |
|---|---|---|---|---|---|
| I2 | p-value | ||||
| Traffic density | All studies | 13 | 1.01 (0.98–1.04) | 0.0% | 0.725 |
| Low | 6 | 0.98 (0.90-1.07) | 0.0% | 0.789 | |
| Moderate | 7 | 0.97 (0.82-1.12) | 0.0% | 0.777 | |
| High | 9 | 1.04 (0.91-1.17) | 0.0% | 0.483 | |
| NO2 | All studies | 7 | 0.98 (0.93–1.02) | 24.7% | 0.134 |
| Low | 4 | 0.98 (0.90–1.07) | 26.9% | 0.116 | |
| Moderate | 7 | 1.02 (0.93–1.10) | 35.3% | 0.147 | |
| High | 7 | 0.94 (0.86–1.01) | 41.3% | 0.082 | |
| Benzene | All studies | 6 | 0.94 (0.84–1.04) | 17.2% | 0.261 |
| Low | 4 | 0.89 (0.71–1.06) | 0.0% | 0.789 | |
| Moderate | 3 | 1.04 (0.71–1.37) | 0.0% | 0.659 | |
| High | 5 | 0.94 (0.81–1.08) | 0.0% | 0.777 | |
|
|||||
Overall, despite none of the pooled estimates being significant, Gong et al. (2019) concluded that the current evidence suggests that childhood leukemia is associated with traffic density, and only with moderate exposure to NO2 and benzene. However, the absence of pertinent information in Gong et al. (2019) and the fact that the analyses were not normalized to any incremental increase in pollutant levels or distance limit the interpretation and significance of the weak associations reported by this SR-MA. Significant publication bias was detected for traffic density by an asymmetric funnel plot and the Begg's and Egger's tests. Potential publication bias was not reported for NO2 and benzene. Several limitations were also identified by the review authors including: 1) inclusion of only case-control studies; 2) differences in the inclusion and exclusion criteria of the primary studies; 3) lack of information on previous diseases and treatments of cases; 4) inclusion of older primary studies; 5) inclusion of only English publications, which can introduce a source of bias; and 6) use of pooled data for analysis because individual patient data were unavailable.
Filippini et al. (2019)
In the most recent and comprehensive SR-MA reviewed in Section 3.2.1, Filippini et al. (2019) examined the exposure-response relationship between outdoor air pollution exposure through traffic density, air monitoring data, and dispersion air pollutant models based on motorized traffic and risk of childhood leukemia. Twenty-six case-control and three cohort studies met the inclusion criteria and were incorporated in the quantitative syntheses. The primary studies were conducted in North America (12 studies), Europe (15 studies), and Asia (two studies); they were published between 1989 and 2018 with a time of diagnosis ranging from 1960 to 2012. Twenty-seven primary studies had a population-based design, of which 19 did not rely on the voluntary participation of the children or their families, and two primary studies used a hospital-based design (i.e., controls were recruited from the hospital population). While most of the primary studies included children aged 0 to 10, 14/15, or 19 years old, seven primary studies limited the study population to children aged less than 6 years old and another seven primary studies conducted age-stratified analysis.
Most primary studies assessed exposure using residential address at time of diagnosis (17 studies) or the address retrieved from the death certificate (two studies), 12 primary studies used residential address during pregnancy or at birth, and two primary studies evaluated exposures both at and after birth. Exposure was assessed by only one method in 16 primary studies while the remaining 13 primary studies utilized two or more methods of exposure assessment. Of the 20 primary studies that assessed traffic density, six studies assessed traffic count, six studies assessed road density, seven studies assessed residential distance from a major road, and six studies assessed a combination of them. Another 16 primary studies measured or modelled levels of traffic-related air pollutants, including NO2 (10 studies), benzene (eight studies), 1,3-butadiene (two studies), and PM (four studies). The exposure ranges of the different pollutants measured in the included primary studies were not provided by Filippini et al. (2019).
Study quality was assessed through the NOS tool. The primary studies were considered to be of very good quality and of substantially low RoB based on the median value of the overall score of 9 for all primary studies, which constitutes the highest level of this scale. Potential confounding was addressed in all but two primary studies with respect to known individual risk factors of age and gender, and all but four primary studies included a measure of SES in the regression model. Seven primary studies adjusted for (electro)magnetic fields, distance to power line, and/or wire-code but only two primary studies adjusted for paternal or parental smoking.
For the quantitative analyses, risk ratios were computed from the primary studies for each of the exposure categories by extracting the risk estimates (i.e., ORs, hazard ratios, or rate ratios), as well as the number of cases or events and controls or person-years in each of the exposure categories. The pooled risk ratios were estimated using random-effects meta-analysis to compare the highest and lowest exposure categories for each exposure metric. Although cut-points for exposure category identification differed across studies to some extent, the ranges of exposure levels for most studies were roughly comparable and the exposure contrasts were applicable within a given study. For the dose-dependent meta-analysis, the trend from the risk ratios across categories of pollutant exposure levels and their approximate pointwise 95% CI based on asymptotic normality was estimated. For the five primary studies that had no value assigned to open-ended categories (i.e., mean, median, or extreme values) at the end of the exposure scale, a value of 20% higher or lower than the closest cut points was entered. One-stage or two-stage dose-response meta-analysis was also conducted to investigate the shape of the relationship between traffic or traffic-related air pollutant exposures and the risk of childhood leukemia. Heterogeneity was estimated using I2 and τ2; this risk assessment focused on the I2 results for consistency across SR-MAs.
Random-effects meta-analysis comparing highest to lowest exposure categories revealed positive associations that were mostly borderline or statistically significant between the different indicators of traffic and risk of leukemia in all primary studies. The pooled risk ratios were 1.09 (95% CI: 1.00–1.20), 1.27 (95% CI: 1.03–1.56), 1.04 (95% CI: 0.90–1.19), 1.05 (95% CI: 0.94–1.16), 1.20 (0.70–2.04), and 1.45 (1.08–1.95) for traffic density, benzene, NO2, PM2.5, PM10, and 1,3-butadiene, respectively, as depicted in Table 3.6. Heterogeneity (I2) was moderate or moderate to substantial (43.5–56.2%) for all traffic indicators with the exception of PM2.5 and 1,3-butadiene, which had no or low heterogeneity, respectively. Pooled estimates from the stratified analyses by leukemia subtype, exposure timing, and region for all children are provided for each traffic indicator in Table 3.6. Quantitative analyses that included only one primary study were not reported in the table. For traffic density, while analyses by leukemia subtype resulted in generally similar, positive risk ratios, a stronger association was observed for Europe compared to North America and the risk ratios for exposure timing differed markedly; the pooled estimate for exposure at birth was null but that for exposure at diagnosis was positive and statistically significant. This contrast in the pooled estimates for exposure timing was not observed for the other traffic indicators; pooled estimates for exposure at birth were positive and either borderline or statistically significant for the other traffic indicators. For benzene, all pooled risk estimates resulting from the stratified analyses were positive and mostly borderline or statistically significant; they were generally similar to the overall pooled risk estimate (all studies) with the exception of leukemia subtype, where they differed markedly (i.e., risk ratios of 1.09 for ALL and 1.84 for AML). Benzene exposure was associated with the strongest associations with childhood leukemia for main group and subgroup analyses, compared to traffic density and NO2, the traffic indicators with the greatest number of studies included in the quantitative synthesis. For NO2, the risk estimates were generally positive though weak, with the exception of analyses stratified according to the AML leukemia subtype and Europe, and none were statistically significant. Stratified analyses for PM2.5, PM10, and 1,3-butadiene were limited in terms of the number of analyses performed and the confidence of the pooled risk estimates due to the small number of primary studies (three studies or fewer) available for these traffic indicators. For PM2.5 and PM10, the pooled risk estimates ranged from 1.00 to 1.20, with some having borderline significance. The risk ratios for 1,3-butadiene were positive and statistically significant; however, they were based on only two primary studies. Heterogeneity was absent for PM2.5, low for 1,3-butadiene, and generally moderate to substantial for the other traffic indicators. In addition, less heterogeneity was usually observed for exposure at birth and AML subtype compared to the other analyses.
| Traffic Indicator | Main Group | Subgroup | Number of primary studies included in the meta-analysis | Pooled risk ratio (95% CI)Footnote b | Heterogeneity | |
|---|---|---|---|---|---|---|
| I2 | τ2 | |||||
| Traffic density | All studies | N/A | 16 | 1.09 (1.00–1.20) | 56.2% | 0.012 |
| Leukemia subtype | ALL subtype | 9 | 1.05 (0.96–1.16) | 34.7% | 0.005 | |
| AML subtype | 5 | 1.09 (0.86–1.38) | 70.0% | 0.034 | ||
| Exposure timing | At birth | 5 | 0.98 (0.90–1.06) | 30.9% | 0.003 | |
| At diagnosis | 14 | 1.32 (1.12–1.55) | 50.7% | 0.033 | ||
| Region | Europe | 9 | 1.25 (1.05–1.49) | 50.4% | 0.026 | |
| North America | 6 | 1.02 (0.89–1.16) | 65.4% | 0.014 | ||
| Benzene | All studies | N/A | 7 | 1.27 (1.03–1.56) | 52.4% | 0.043 |
| Leukemia subtype | ALL subtype | 7 | 1.09 (0.88–1.36) | 51.8% | 0.034 | |
| AML subtype | 5 | 1.84 (1.31–2.59) | 0.0% | 0.000 | ||
| Exposure timing | At birth | 3 | 1.21 (1.04–1.41) | 0.0% | 0.000 | |
| At diagnosis | 4 | 1.36 (0.92–2.00) | 65.2% | 0.125 | ||
| Region | Europe | 4 | 1.36 (0.92–2.00) | 65.2% | 0.125 | |
| North America | 3 | 1.21 (1.04–1.41) | 0.0% | 0.000 | ||
| NO2 | All studies | N/A | 8 | 1.04 (0.90–1.19) | 55.5% | 0.023 |
| Leukemia subtype | ALL subtype | 4 | 1.02 (0.89–1.18) | 55.6% | 0.011 | |
| AML subtype | 4 | 0.97 (0.79–1.19) | 0.0% | 0.000 | ||
| Exposure timing | At birth | 4 | 1.07 (0.96–1.19) | 0.0% | 0.000 | |
| At diagnosis | 4 | 1.17 (0.82–1.67) | 74.9% | 0.093 | ||
| Region | Europe | 4 | 0.91 (0.82–1.00) | 0.0% | 0.000 | |
| North America | 3 | 1.06 (0.95–1.18) | 0.0% | 0.000 | ||
| PM2.5 | All studies | N/A | 3 | 1.05 (0.94–1.16) | 0.0% | 0.000 |
| Leukemia subtype | ALL subtype | 2 | 1.11 (0.95–1.31) | 0.0% | 0.000 | |
| AML subtype | 2 | 1.00 (0.87–1.13) | 0.0% | 0.000 | ||
| Exposure timing | At birth | 3 | 1.05 (0.94–1.16) | 0.0% | 0.000 | |
| Region | North America | 2 | 1.05 (0.94–1.17) | 0.0% | 0.000 | |
| PM10 | All studiesFootnote c | N/A | 2 | 1.20 (0.70–2.04) | 43.5% | 0.075 |
| 1,3-butadiene | All studiesFootnote d | N/A | 2 | 1.45 (1.08–1.95) | 28.0% | 0.025 |
| Leukemia subtype | ALL subtype | 2 | 1.31 (1.11–1.54) | 0.0% | 0.000 | |
N/A: not applicable |
||||||
|
||||||
Filippini et al. (2019) also conducted age of diagnosis-stratified analyses, separating preschool children (< 6 years old) from school-aged children (≥ 6 years old). For preschool children, with the exception of traffic density, random-effects meta-analysis revealed positive associations that were mostly borderline or statistically significant between the different indicators of traffic and risk of leukemia with pooled risk ratios of 1.00 (95% CI: 0.93–1.09), 1.39 (95% CI: 1.03–1.87), 1.03 (95% CI: 0.90–1.18), 1.04 (95% CI: 0.94–1.16), 1.09 (0.66–1.80), and 1.45 (1.08–1.95) for traffic density (seven primary studies), benzene (four primary studies), NO2 (four primary studies), PM2.5 (three primary studies), PM10 (two primary studies), and 1,3-butadiene (two primary studies), respectively. Heterogeneity was low (12.3 to 28%) for four out of the six traffic indicators, high (67.0%) for traffic density and nil for PM2.5. For school-aged children, positive associations were also observed for the only two traffic indicators with a sufficient number of studies to conduct meta-analyses, with risk ratios of 1.05 (95% CI: 0.96–1.15) and 1.08 (95% CI: 0.64–1.82) for traffic density (three primary studies) and benzene (two primary studies), respectively. No or low (10.0%) heterogeneity was observed for benzene and traffic density, respectively. Further subgroup analysis for school-aged children was limited due to the lack of sufficient primary studies available (i.e., mainly one study).
Exposure-response meta-analyses to describe the shape of the curve were also conducted for the different indicators of traffic density, benzene, and NO2. Based on four primary studies, there was little association observed between leukemia risk ratio and the number of vehicles per day (1,000 to 30,000) in the street closest to the residential address except at the highest exposure levels, where the review authors noted a small and statistically imprecise excess risk, owing to a large confidence interval. The shape of the curve suggested a threshold up to approximately 10,000 vehicles per day. A similar trend was also observed for road density (0 to 30 km/km2), with a possible threshold up to 5 km/km2, and a small increase in risk from 5 to 30 km/km2) based on three primary studies. In contrast, based on six primary studies that evaluated distance from a major nearby road (0 to 600 m), there was little association observed with leukemia risk ratio from 600 m to 150 m from the edge of the road; then, from 150 m a higher risk ratio emerged and increased steeply with decreasing distance. Exposure-response meta-analysis for benzene (1 to 15 µg/m3) revealed an approximately linear increase in risk ratio starting from the lowest levels of benzene exposure based on six primary studies. In subgroup analyses by leukemia type, the association was markedly stronger between benzene exposure and risk of AML (five primary studies) compared to benzene exposure and risk of ALL (six primary studies). For NO2 (0 to 60 µg/m3), there was evidence of an excess risk between 40 and 60 µg/m3 based on six primary studies, but the review authors noted that the increase was statistically unstable. This excess risk at higher NO2 exposure levels was also observed for ALL (three primary studies) but not for AML (three primary studies) in subgroup analyses by leukemia type. At concentrations from approximately 5 to 40 µg/m3 NO2, there was a reduced risk for leukemia and the ALL subtype; while no association was evident for AML in this exposure range.
Sensitivity analyses in which each primary study was systematically excluded in turn from the meta-analysis were also done and did not appreciably change the various pooled risk ratios. Similarly, there was little effect on the results of the exposure-response meta-analysis when a value of ±15% was used instead of ±20% for primary studies that had no value assigned to open-ended categories at the end of the exposure scale. Publication bias could not be entirely ruled out based on the slightly asymmetric distribution observed in the funnel plots for the different exposure assessment methods, especially for traffic and benzene. In addition, the review authors acknowledged that some degree of unmeasured confounding may have occurred in the primary studies due to sources of outdoor pollution (e.g., oil and gas development [two primary studies] and industrial sources [two primary studies]), indoor air pollution (e.g., heating sources and dust [two primary studies]), passive smoking (in two primary studies), magnetic field exposure (in one primary study), and SES factors (in one primary study).
Overall, Filippini et al. (2019) found positive associations between TRAP exposure and risk of childhood leukemia. Of the different exposure metrics, benzene attributable to motorized traffic was most consistently associated with an increased risk and the strongest associations were observed for AML. No minimal threshold of exposure was identified for benzene in the shape of the exposure-response evaluation. In contrast, evidence of such a threshold was apparent for both traffic density (i.e., less than 150 m of a major road) and NO2 (i.e., greater or equal to 40 µg/m3). The increase in leukemia risk associated with NO2 levels greater or equal to 40 µg/m3 was limited to ALL only. Of note, when quantitatively analysed, exposure to the various traffic indicators during the postnatal window (i.e., at diagnosis) resulted in higher pooled risk ratios than the perinatal window (i.e., at birth). Although the number of primary studies evaluating school-aged children was limited, exposure to benzene and NO2 were associated with a higher excess risk in preschool children compared to school-aged children, while the converse was observed for traffic density. Positive associations were also observed for the other traffic-related pollutants (i.e., 1,3-butadiene, PM2.5, and PM10), but a limited number of studies were available for these pollutants. In particular, the associations for 1,3-butadiene were comparatively strong and statistically significant. Thus, Filippini et al. (2019) concluded that TRAP, particularly exposure to benzene, was associated with an increased risk of childhood leukemia and noted that disease subtype, windows of exposure, and the child's age modified these associations.
3.2.2 Systematic reviews
Raaschou-Nielsen and Reynolds, 2006
Only one systematic review was identified following the scoping review and updated literature search (Raaschou-Nielsen and Reynolds, 2006). Although Raaschou-Nielsen and Reynolds (2006) conducted a systematic review that examined the association between ambient air pollution and childhood cancers, their hypothesis and the primary studies captured in this article focused almost entirely on TRAP exposure. Of the 15 primary articles that met their inclusion criteria, there were eight case-control and seven ecological studies. The review authors subjectively assessed study quality by implementing a self-made untallied scoring system that focused on key methodological issues (e.g., number of cases, selection bias) and noted that very few primary studies provided high quality evidence, rendering an overall evidence of an association inconclusive. Due to the inherent limitations of the ecological study design, these seven primary ecological studies, along with a case-control study that did not provide a risk estimate for TRAP exposure and childhood leukemia, were not further considered in this risk assessment.
The remaining seven case-control studies were conducted in the USA (three primary studies) and Europe (four primary studies). Their publication dates ranged from 1989 to 2004. They reported nine distinct effect estimates specific to TRAP and leukemia, presented as RRs with 95% CIs. Three of these effect estimates pertained to traffic-related air pollutants (i.e., NO2 and benzene) and the remaining six used various metrics of traffic exposure (e.g., traffic density, distance to roadway, traffic counts); the effect estimates ranged from 0.4–3.9 and 0.9–4.7, respectively. The majority of the nine RRs indicated evidence of an effect: six reported a positive association, three of which were statistically significant. The primary studies with statistically significant results evaluated TRAP based on traffic counts (2 studies) and modelled concentrations of benzene in outdoor air (1 study). Similar results were observed when grouped by TRAP proxy.
While the majority of case-control studies had appropriate case ascertainment, such as from cancer registers, and had selected controls randomly through various registers, Raaschou-Nielsen and Reynolds (2006) discussed the potential for selection bias in three of the primary studies. In particular, contact with study participants, random digit dialing and non-participation may have led to an uneven distribution of baseline characteristics between case and control groups. The review authors additionally noted that, although differential misclassification of exposure was unlikely as residential addresses were obtained through objective sources, non-differential misclassification was inevitably present, albeit expected to bias associations towards the null.
The review authors also noted several sources of heterogeneity, including exposure levels and variations, subtypes of childhood leukemia, TRAP proxy, and exposure assessment. They considered exposure assessment the main methodological challenge. Although all primary studies assessed exposure at residential address, the timing (e.g., exposure from the time of birth to longest address during childhood, and exposure at latest address only) as well as the methods (e.g., traffic counts, distance-weighted traffic counts, and TRAP models) of assessment differed between the studies.
The review authors indicated that confounding was well accounted for as matching and adjustment for age and sex were done in all seven case-control studies, with most primary studies further adjusting for various other risk factors (e.g., SES, electromagnetic fields, ethnicity, and maternal age). However, a number of limitations were noted including publication bias and the potential for exposure misclassification. Overall, the review authors concluded that the evidence for an association between TRAP exposure and childhood leukemia was weak, while noting that the limited number of studies, methodological limitations, and lack of consistency in the study results did not support a conclusion of an absence of an association.
3.2.3 Summary/conclusion
Six SR-MAs evaluated the association between TRAP and leukemia; they differed in their specific objectives, their selection of traffic indicators, and their publication year and therefore included a different number (i.e., nine to 29 primary studies) and selection of primary studies in their quantitative analyses. There was, however, substantial overlap in the primary studies considered. Sun et al. (2014) conducted a meta-analysis to characterize the association between local traffic density and the risk of childhood leukemia in children aged 15 years or less. Boothe et al. (2014) investigated the association between residential traffic exposure (based on distance to roads and traffic density) and childhood cancer in countries designated by the World Bank as a "high-income economy." Although they did not limit their search to a specific cancer type, leukemia was the only cancer type with a sufficient number of studies for analysis. Filippini et al. (2015) focused on the potential associations between long-term exposure to motorized traffic exhausts and risk of childhood leukemia and used the following proxies of traffic exhaust that were consistent with Matz et al. (2019): traffic density and measured or modelled levels of NO2 and benzene. Carlos-Wallace et al. (2016) evaluated the association between benzene exposure and childhood leukemia and used various metrics of benzene exposure including traffic density and TRAP models to probe this association. Gong et al. (2019) utilized a systematic review methodology to conduct a meta-analysis of case-control primary studies to examine the association between TRAP and risk of childhood leukemia. Finally, in the most recent and comprehensive SR-MA, Filippini et al. (2019) investigated the exposure-response relation between outdoor air pollution exposure through traffic density, air monitoring data, and dispersion air pollutant models based on motorized traffic and risk of childhood leukemia.
Despite identifying several limitations in the meta-analyses (e.g., the use of primary studies that employed different inclusion and exclusion criteria, used inconsistent traffic exposure measures, potentially introduced recall and selection bias due to the case-control design of the study, and differed in confounder adjustments including for cigarette smoke and unmeasured confounding), all the SR-MAs reported a positive association between childhood leukemia and indicators of TRAP. Sun et al. (2014) reported a borderline significant small positive association between local traffic density and childhood leukemia. The pooled estimate was robust through sensitivity analyses and had no observed publication bias. Subgroup analyses by country, study duration, study quality score, and definition of traffic density also resulted in positive associations that were borderline or statistically significant. In particular, vehicles per day, the most commonly used metric of traffic density, yielded the largest association. Similarly, Boothe et al. (2014) found a positive and statistically significant association between childhood leukemia and high residential traffic exposure; a statistically significant increase in risk was also evident during the postnatal period. Of note, statistically significant positive associations were also revealed when SES was controlled for, when the analysis was restricted to high quality primary studies, or when the exposure metric was limited to single roads. Sensitivity analysis for this exposure window was robust but there was evidence of publication bias. The results of Filippini et al. (2015) also suggest that TRAP increased the risk of childhood leukemia, both among all leukemia and the major subtypes (i.e., ALL and AML), and these findings were mostly positive across different indicators of exposure (i.e., traffic density, NO2, and benzene) and study locations (i.e., USA and Europe). The strongest predictors of disease risk were benzene exposure (for AML subtype) as well as exposure based on traffic density during the postnatal exposure window (compared to the prenatal exposure window). The pooled estimates were robust to sensitivity analyses but there was indication of publication bias. Positive associations were noted between studies using modelled estimates of TRAP exposure and childhood leukemia in Carlos-Wallace et al. (2016) and these pooled RRs were higher than those elucidated for traffic density. Gong et al. (2019) also suggested that childhood leukemia is associated with traffic density and with moderate exposure to NO2 and benzene. In particular, weak positive associations were reported for traffic density when all studies were considered and when the analysis was limited to a high level of exposure only, while weak positive associations were only observed at moderate exposure to NO2 and benzene. The absence of pertinent information in the SR-MA, the significant publication bias detected for traffic density, and the fact that risk estimates from a given primary study were not selected or prioritized, instead including multiple estimates from the same primary study for inclusion in the meta-analysis, limit the interpretation and significance of the associations reported by this SR-MA. Similar to the other SR-MAs, Filippini et al. (2019) concluded that TRAP, especially exposure to benzene, was associated with an increased risk of childhood leukemia; furthermore, the review authors noted that disease subtype, windows of exposure, and the child's age modified these associations. Associations were also identified with other TRAP exposure measures, including traffic density, NO2, and 1,3-butadiene. No minimal threshold of benzene exposure was identified for the increase in risk by the dose-response meta-analysis. In contrast, evidence of such a threshold was apparent for both traffic density (i.e., less than 150 m of a major road) and NO2 (i.e., greater or equal to 40 µg/m3). Unlike for benzene where the strongest positive association was observed for AML, the increase in leukemia risk associated with NO2 levels was limited to ALL only. Exposure to the various traffic indicators during the postnatal window (i.e., at diagnosis) resulted in higher pooled risk ratios than the perinatal window (i.e., at birth). Although the number of primary studies evaluating school-aged children was limited, exposure to benzene and NO2 was associated with a higher excess risk in preschool children compared to school-aged children, while the converse was observed for traffic density.
Only one systematic review, with a publication date older than the SR-MAs reviewed in this section, was identified for this risk assessment. Raaschou-Nielsen and Reynolds (2006) examined the association between TRAP exposure (i.e., traffic metrics and traffic-related air pollutants) and childhood leukemia, and noted positive associations for the majority (i.e., six out of nine) of the RRs reported in the included case-control studies. The degree of significance of the RRs was however variable, and similar results were observed when grouped by TRAP proxy.
3.3 Adult cancers
As indicated in Section 2.1, only two types of adult cancers were identified as candidates for this umbrella-review based risk assessment: lung cancer and breast cancer.
Lung cancer is the most commonly diagnosed cancer in Canada and the leading cause of cancer deaths for both men and women (PHAC 2019a). Lung cancers are grouped based on cell type: (1) small cell lung cancer usually starts in the cells that line the bronchi, grows quickly, and often spreads to other parts of the body; and (2) non-small cell lung cancer is more common, grows more slowly, and includes several subtypes including adenocarcinoma, squamous cell carcinoma, and sarcoma (Canadian Cancer Society 2021c). Lung cancer risk increases with age and men have a higher risk than women (Canadian Cancer Society 2021d). The main risk factor for lung cancer is smoking, including environmental tobacco smoke. There are many other risk factors for lung cancer including: personal or family history of lung cancer, air pollution, radon, asbestos, occupational exposure to some chemicals, and exposure to radiation (Canadian Cancer Society 2021d, PHAC 2019a).
Breast cancer is the most common cancer in women (excluding non-melanoma skin cancers) and is the second leading cause of death from cancer in Canada (Canadian Cancer Society 2021e). Nearly all cases of breast cancer start in the glandular tissue. The cancerous cells may start in the cells that line the ducts (referred to as ductal carcinoma) or in the cells of lobules (referred to as lobular carcinoma) (PHAC 2019b). Although breast cancer can occur in both men and women, the risk is greater in women. Other risk factors for breast cancer include age, personal and family history of breast cancer, genetic factors including BRCA gene mutations, reproductive history, exposure to radiation, oral contraceptives, alcohol consumption, obesity, and physical inactivity (Canadian Cancer Society 2021f).
Three SR-MAs and one systematic review pertaining to adult cancers were eligible for inclusion in the current umbrella review; the SR-MAs were selected during the scoping review while the systematic review was identified from the literature search update. All three SR-MAs (Tsoi and Tse, 2012; Chen et al. 2015; Hamra et al. 2015) evaluated the association between exposure to TRAP and risk of lung cancer in adults. In contrast, the systematic review (White et al. 2018) examined the relationship between TRAP exposure and breast cancer in women.
3.3.1 Lung cancer SR-MAs
Tsoi and Tse (2012)
Tsoi and Tse (2012) conducted an SR-MA of professional drivers and lung cancer risk. The authors identified case-control and cohort studies published between January 1996 and January 2011, and included only studies published in English. A total of 19 primary studies were included in the meta-analyses, comprised of seven retrospective cohort studies, one prospective cohort study, and 11 case-control studies. The primary studies were conducted in nine countries, mainly in Europe and North America. Professional driver occupations considered included bus, truck, and taxi drivers, and most of the study subjects were male. The exposure level of the professional drivers was not reported. Quality of the primary studies was evaluated using a checklist developed by Downs and Black (1998). For this SR-MA, each of the primary studies was scored and the better quality studies had a score equal to or greater than the median score, while those below the median score were considered low quality. Eleven of the 19 primary studies were considered better quality, and typically scored higher for assessment of confounding bias and reported rate of loss to follow-up. The low quality primary studies had methodological issues (no details provided by review authors) and low statistical power.
Effect estimates for lung cancer incidence and mortality, including smoking-adjusted and smoking-unadjusted estimates (where available), were extracted from the primary studies. The authors estimated the pooled effect estimate using a fixed-effects model if no significant heterogeneity was present, and a random-effects model when the Cochran Q test for heterogeneity (p-value) was <0.1 and/or I2 index was >50%. Publication bias was assessed using a funnel plot which was symmetrical indicating a lack of obvious publication bias.
The pooled analysis of the 19 studies indicated a significantly increased risk of lung cancer in professional drivers compared with the non-driver control group with a pooled RR of 1.21 (95% CI: 1.10–1.32) with substantial heterogeneity between studies (I2 = 68.6%; p < 0.00001 for Cochran Q test). Significant pooled estimates were also determined in the subgroup analyses by study type, smoking adjustment, and study quality (Table 3.7). The authors also reported that risk of lung cancer was increased with longer duration of employment, as the pooled RR for smoking-adjusted studies with a minimum 10 years of employment duration as a professional driver (10 studies) was 1.19 (95% CI: 1.06–1.34), compared to a single study with a shorter employment duration (6 years) with an RR of 1.00 (95% CI: 0.92-1.09); heterogeneity was not reported.
| Group | Subgroup | Number of primary studies included in meta-analysis | Pooled RR (95% CI) | Heterogeneity (I2) | p-value for Cochran Q test |
|---|---|---|---|---|---|
| All studies | N/A | 19 | 1.21 (1.10–1.32) | 68.6% | <0.00001 |
| Study design | Case-control | 11 | 1.26 (1.02–1.56) | 55.2% | 0.01 |
| Cohort | 8 | 1.19 (1.07–1.32) | 79.4% | <0.0001 | |
| Adjustment | For smoking | 13 | 1.18 (1.05–1.33) | 48.0% | 0.03 |
| Not for smoking | 6 | 1.23 (1.05–1.44) | 83.1% | <0.0001 | |
| Study quality | Better quality | 11 | 1.22 (1.09–1.36) | 52.1% | 0.02 |
| Low quality | 8 | 1.17 (1.03–1.32) | 63.2% | 0.008 | |
N/A: not applicable |
|||||
This SR-MA has several limitations, including lack of a quantification or measurement of TRAP exposure and full confounder adjustment in the primary studies. Many of primary studies evaluated the risk based on ever employment as a professional driver compared to non-driver occupational control groups. As such, assessment of level or intensity of TRAP exposure were not incorporated into the risk evaluation. Although some primary studies accounted for smoking, the primary studies did not account for other confounders, such as employment in other occupations with an elevated risk of lung cancer or exposures to known carcinogens (e.g., occupational exposure to asbestos or other chemicals). Additionally, substantial heterogeneity was noted in the main and subgroup analyses, which were addressed using a random-effects model. Sources of heterogeneity included differences in study design, occupations, study quality, inclusion of confounders, location, and study period.
Chen et al. (2015)
Chen et al. (2015) conducted an SR-MA to evaluate the association between TRAP exposure and lung cancer. The authors included case-control, cohort, and nested case-control studies of lung cancer incidence or lung cancer mortality published in English or Chinese, up to December 2013. Additionally, the authors included both ambient and occupational exposure to TRAP. The quality of the primary studies was evaluated using the Strengthening the Reporting of Observational Studies in Epidemiology (STROBE) checklist (von Elm et al. 2008). Studies fulfilling less than 60% of STROBE criteria were considered poor quality and excluded. A total of 36 primary studies were included in the pooled analyses, including 14 studies of ambient exposure to TRAP and 22 studies of occupational exposure. Effect estimates were pooled using a fixed-effects model when heterogeneity was <50% and the Cochran Q test for heterogeneity (p-value) was >0.1, otherwise a random-effects model was used.
For ambient exposure, the studies were conducted in Europe (seven studies), North America (five studies), and Asia (two studies). Methods of exposure assessment were varied and included LUR models, monitoring data, and dispersion models. There was no consistent reporting of exposure levels in the primary studies (i.e., mean, median, or range). Length of exposure period or follow-up was not identified in the review. From the primary studies, the review authors extracted the per pollutant effect estimates, corresponding to the model that most fully adjusted for covariates and confounders. Most of the primary studies accounted for age (n = 12), sex (n = 10), SES indicators (n = 14), smoking (n = 11), and body-mass index (n = 7). Cases of lung cancer were identified from records/registries (nine studies) or histology (five studies).
Pooled ORs for each TRAP pollutant are presented in Table 3.8. Significant, positive associations were determined for nitrogen oxides (NOX) and sulphur dioxide (SO2), while for NO2 and PM2.5, the associations were positive and borderline significant. Moderate to substantial heterogeneity was observed for each pollutant, except for SO2. Of note, the review authors identified numerous other primary studies evaluating the association between TRAP pollutants and lung cancer, with effects sizes reported based on other incremental amounts of a pollutant (e.g., 20 µg/m3). However, the authors did not standardize these effect estimates to 10 µg/m3 pollutant increment for inclusion in the meta-analysis; thus limiting the number of studies included in and the strength of the quantitative analysis. Furthermore, three primary studies of PM10 were identified, each using a different increment; thus, no pooled estimate was generated by the review authors for this pollutant.
| Pollutant (incremental increase) | Number of primary studies | Pooled OR (95% CI) | Heterogeneity (I2), Cochran Q p-value | p-value for overall effect | |
|---|---|---|---|---|---|
| Total number | Positive associations | ||||
| NO2 (10 µg/m3) | 5 | 4 | 1.06 (0.99–1.13) | 59%, p = 0.05 | 0.08 |
| NOX (10 µg/m3) | 2 | 2 | 1.04 (1.01–1.07) | 46%, p = 0.17 | 0.01 |
| PM2.5 (10 µg/m3) | 6 | 5 | 1.11 (1.00–1.22) | 64%, p = 0.02 | 0.05 |
| SO2 (10 µg/m3) | 5 | 3 | 1.03 (1.02–1.05) | 0%, p = 0.48 | <0.0001 |
For occupational exposure, the studies were also conducted in Europe (11 studies), North America (10 studies), and Asia (one study). The types of professional drivers meeting inclusion criteria were bus drivers, truck drivers, taxi drivers, and chauffeurs. Duration of employment was variable between the primary studies, though 10 of these studies indicated a minimum of 10 years of employment. Outcomes of lung cancer were identified from records/registries (14 studies), histology (six studies), and histology and clinical records (one study); the method was unclear in one study. From the primary studies, the review authors extracted covariate adjusted effect estimates, with most studies adjusting for age (n = 19) and smoking (n = 16). Only some of the primary studies included adjustments for employment duration (n = 3), education (n = 4), and asbestos exposure (n = 2).
The pooled ORs for risk of lung cancer in professional drivers are presented in Table 3.9. Significant positive associations were determined for both lung cancer incidence and lung cancer mortality in professional drivers. As the CIs for each of these were overlapping, the review authors combined both outcomes into a larger synthesis, also resulting in a significant positive association. Moderate to substantial heterogeneity was observed for each pooled OR.
| Lung cancer | Number of primary studies or subgroups | Pooled OR (95% CI) | Heterogeneity, Cochran Q p-value | p-value for overall effect | |
|---|---|---|---|---|---|
| Total number | Positive associations | ||||
| Incidence | 18 | 17 | 1.27 (1.19–1.36) | 44%, p = 0.02 | < 0.00001 |
| Mortality | 11 | 8 | 1.14 (1.04–1.26) | 52%, p = 0.02 | 0.08 |
| Incidence and mortality combined | 28 | 24 | 1.22 (1.14–1.31) | 65%, p < 0.00001 | < 0.00001 |
This SR-MA reported an increase risk of lung cancer associated with ambient exposure to TRAP pollutants, with pooled estimates ranging from 1.03–1.11 per 10 µg/m3 of pollutant (i.e., NO2, NOX, PM2.5, and SO2). Occupational exposure to TRAP was also associated with increased risk of lung cancer incidence and/or mortality, with pooled estimates ranging 1.14–1.27. The elevated risks for occupational exposure are plausible, given these exposure scenarios are often for longer durations and may be at elevated levels of pollutants compared to non-occupational exposures. Additionally, given the widespread nature of TRAP, people employed in TRAP-impacted occupations are also exposed to TRAP pollutants in non-work related environments (i.e., ambient exposure), thus contributing to their total exposure.
The review authors did not evaluate any potential publication bias, nor investigate the contributing factors to the observed heterogeneity. For the evaluation of lung cancer risk and ambient exposure to TRAP, sources of heterogeneity would be anticipated to include (but not be limited to): study design; exposure assessment method; outcome assessment; study location; and, covariate adjustment. For the evaluation of lung cancer risk and occupational exposure to TRAP, sources of heterogeneity would be anticipated to include (but not be limited to): study design; study duration; employment duration; outcome assessment; study location; and, covariate adjustment.
Hamra et al. (2015)
Hamra et al. (2015) conducted a more recent SR-MA on lung cancer and TRAP exposure. They identified 20 eligible primary studies through the literature search, and added three primary studies after either discussion with co-authors or after searching the reference lists of included studies. Twenty of the 23 primary studies that met the inclusion criteria for the systematic review were included in the quantitative analyses. At a minimum, all primary studies adjusted for age and sex; other key confounders that were adjusted for include smoking, SES or income, education, and occupation. All effect estimates for pollutants (i.e., NO2 or NOX) were standardized to incremental increases of 10 µg/m3.
The primary studies were conducted in North America (seven studies), Europe (10 studies), and Asia (three studies). Although their publication dates ranged from 1999 to 2014, the majority of the primary studies were published in the last ten years. Most primary studies used a cohort study design (15 studies) and the remaining five studies used a case-control study design. Eleven primary studies used lung cancer mortality as their endpoint of interest, and the remaining nine studies evaluated incidence. The exposure assessment method varied between primary studies and included fixed-site monitors (six studies), spatiotemporal models (five studies), LUR modelling (four studies), air dispersion models (four studies), and inverse distance weighting (one study). NO2 was the predominant choice of TRAP exposure proxy as it was used by 15 primary studies; in contrast, NOX and traffic metrics were used for five and seven primary studies, respectively. The mean annual NO2 and NOX reported in the primary studies ranged from 10.7-63.4 µg/m3 and 8.7-107.3 µg/m3, respectively. Due to differences in the traffic metrics employed in the primary studies, Hamra et al. (2015) limited the quantitative analyses to NO2 and NOX.
Random-effects meta-analysis resulted in statistically significant positive associations between lung cancer and TRAP exposure, using NO2 and NOX as exposure metrics. The results of the meta-analysis are presented in Table 3.10. Overall, results from the main analysis suggest that the association of NO2 and NOX with lung cancer is positive and statistically significant. Hamra et al. (2015) also conducted subgroup analyses for exposure to NO2 by region, exposure assessment method, and confounder adjustment, as presented in Table 3.10. Results from the subgroup analyses suggest that there were regional differences in the magnitude of an association between lung cancer and NO2, whereas the association remained robust to differences in confounder adjustment and methods of exposure assessment.
| Pollutant (standardized incremental increase) | Subgroup | Number of primary studies | Pooled RR (95% CI) | Heterogeneity (I2), p-valueFootnote a | p-value for overall effectFootnote b | |
|---|---|---|---|---|---|---|
| NO2 (10 µg/m3) | Overall | 15 | 1.04 (1.01–1.08) | 72.8%, p = 0.000 | <0.05 | |
| Region | Europe | 7 | 1.02 (0.99–1.06) | 41.1%, p = 0.117 | Not reported | |
| North America | 6 | 1.07 (1.01–1.14) | 77.1%, p =0.001 | |||
| Asia | 2 | 1.11 (1.03–1.20) | 32.5%, p = 0.224 | |||
| Exposure assessment method | Fixed-site monitor | 6 | 1.05 (0.98–1.13) | 80.7% | ||
| OtherFootnote c | 8 | 1.04 (1.00–1.08) | 60.5% | |||
| Confounder adjustment | Smoking status | 11 | 1.04 (1.00–1.08) | 71.8% | ||
| SES or Income | 7 | 1.04 (0.98–1.11) | 68.8% | |||
| Education | 8 | 1.03 (1.00–1.07) | 68.2% | |||
| NOX (10 µg/m3) | Overall | 5 | 1.03 (1.01–1.05) | 33.3%, p = 0.202 | <0.05 | |
|
||||||
Hamra et al. (2015) also qualitatively examined the association between lung cancer and traffic metrics, noting that most effect estimates were positive associations with borderline significance. The traffic metrics used in the different primary studies were diverse with each having a unique exposure contrast, thus the review authors did not derive a meta-estimate. Of the 16 effect estimates reported in the seven primary studies using traffic metrics, one effect estimate reported a significant positive association, nine effect estimates reported borderline significant positive associations, two effect estimates reported non-significant positive associations, and the remaining four effect estimates reported no association. The primary study with a statistically significant positive association estimated TRAP exposure as distance from traffic. There did not appear to be any underlying relationship between traffic metric (i.e., traffic volume vs. distance to traffic) and likelihood to result in a positive association. The review authors noted that these traffic metrics have limitations in assessing individual-level exposure and can often be markers of SES, which may influence the analyses.
Hamra et al. (2015) concluded that the evidence presented in the SR-MA indicates a positive relationship between lung cancer and TRAP exposure. The positive association was consistent across subgroups. There were other potential sources of heterogeneity that were not addressed in the subgroup analyses such as exposure lags to account for the latency of cancer (e.g., 0 to 20 years) and outcome measure (i.e., incidence vs. mortality). The review authors noted that NO2 exposures estimated from models assigned to residence were only an approximation of actual individual exposure; however, the meta-analysis results were robust to stratification by exposure assessment method. Although Hamra et al. (2015) did not assess primary study quality and a potential publication bias was detected, this SR-MA serves as a valuable source of epidemiological evidence for the relationship between TRAP exposure and lung cancer owing to the thoroughness and transparency of the evidence synthesis.
3.3.2 Breast cancer systematic review
White et al. (2018)
White et al. (2018) conducted a systematic review that examined the association between air pollution exposure and incidence of breast cancer in women. Although the review authors considered air pollution from several sources, TRAP was an exposure of interest for the review. Twelve primary studies were identified evaluating the association between TRAP exposure and breast cancer incidence. These primary studies were published from 1996-2017, with the majority in the past decade. The studies were conducted in North America (nine primary studies) and Europe (three primary studies). Six of the 12 primary studies on TRAP exposure used a case-control design, and the remaining six used a cohort study design. TRAP exposure was assessed using several metrics including nitrogen oxides (i.e., NO2 and NOX), benzo[a]pyrene (B[a]P), and PM2.5 based on LUR models or satellite-derived estimates, and traffic metrics (i.e., proximity to roadway and traffic density), with both continuous and categorical variables used to define the exposures. The exposure ranges of the different pollutants measured in the included studies were not provided. Confounders and covariates used in the primary studies were not identified. Of the 15 risk estimates from cohort studies for the risk of breast cancer associated with TRAP exposure, 11 were positive associations, of which one was significant and six were borderline significant, and four estimates indicating no association. For these cohort studies, nine of the risk estimates ranged from 0.90–1.16 per increment of pollutant concentration based on modelled exposures to NO2, NOX, or PM2.5. For traffic metrics, each of the four risk estimates reported in the review were positive ranging from 1.14–1.60, two of which were borderline significant. However, the review authors noted that two cohort studies did not observe any association between breast cancer and traffic metrics (risk estimates not indicated in the review). From the main analysis of the case-control studies, six of the seven risk estimates were positive, with four having borderline significance. An additional 10 risk estimates from various subgroup analyses were reported, eight were positive, three of which were significant and two of which were borderline significant. These subgroup analyses varied between the studies and considered such factors as stage of menopause and tumour subtype. For NO2 and B[a]P, the risk estimates ranged from 1.08–1.32 (six estimates) and 0.82–2.58 (nine estimates), respectively, and one study using traffic count reported risk estimates from 0.89–1.29 (two estimates). Of note, three Canadian case-control studies were included in this SR evaluating the association with NO2; each of these risk estimates was positive with borderline significance, ranging 1.08–1.31 per increment of NO2.
Overall, White et al. (2018) reported that there was evidence of an association between TRAP exposure and incidence of breast cancer, with particularly consistent results in primary studies that used NO2, NOX, or B[a]P as the proxy measure for TRAP exposure. There was little to no evidence of an association in primary studies that used traffic metrics (i.e., distance to nearest road or traffic density) as a proxy measure for TRAP exposure, due to multiple studies reporting no association, and the presence of wide CIs in the few studies reporting an association. The review authors identified several sources of heterogeneity, such as exposure assessment methods, estrogen receptor/progesterone receptor tumour subtype, and stage of menopause (i.e., pre- vs. post-menopausal). There were a few limitations to this review by White et al. (2018), as the review authors did not assess study quality and did not describe details on confounder adjustment for key risk factors (e.g., age and obesity). Additionally, six of the primary studies had a case-control study design, which cannot be used to ascertain incidence. White et al. (2018) findings provide relevant evidence for an association between TRAP exposure and incidence of breast cancer; however, publication of an SR-MA would further solidify the association.
3.3.3 Summary/conclusion
The three SR-MAs identified an increased risk of lung cancer with TRAP exposure (Chen et al. 2015; Hamra et al. 2015; Tsoi and Tse et al. 2012). For ambient exposure, the magnitude of the pooled risk estimate ranged from 1.03–1.06 per 10 µg/m3 increase of TRAP pollutant, including NO2, NOX, and PM2.5. Occupational exposure to TRAP, based on employment as a professional driver, was associated with a larger increased risk of lung cancer, ranging from 1.14–1.26. The elevated risk associated with occupational exposure to TRAP is plausible, as occupational exposures are associated with elevated levels of pollutants often at longer durations compared to non-occupational exposures. Of the SR-MAs, Hamra et al. (2015) also qualitatively considered studies using different traffic metrics (e.g., traffic density) to assess TRAP exposure. Although most of the primary studies reported a positive association, differences in traffic metrics precluded quantitative synthesis. Although most of the primary studies included adjustment for smoking, a main limitation of these SR-MAs evaluating lung cancer risk was the inconsistent accounting for other confounders, especially in the occupational exposure studies (e.g., exposure to asbestos, SES, and duration of employment). Furthermore, the occupational exposure studies predominantly included only male subjects and did not quantify exposure.
Additionally, one systematic review was identified that evaluated the association between TRAP exposure and risk of breast cancer. White et al. (2018) identified that an increased risk of breast cancer was reported in a majority of the primary studies that had evaluated exposure based on modelled TRAP pollutant levels, including NO2, NOX, and B[a]P, while other traffic metrics (e.g., traffic density) did not indicate an association.
Chapter 4: Biological evidence review
To further evaluate the relationship between TRAP exposure and cancer identified in the umbrella review, recent systematic reviews of the biological evidence, as well as relevant biological evidence from the assessment of traffic exhaust, the main components of TRAP, or both by Health Canada (2013, 2016a, 2016b, 2017), the HEI (2010), the US EPA (2016, 2019), and IARC (2014, 2016, 2018) were reviewed. Biological evidence included panel studies, controlled human exposure studies, animal toxicology studies, and in vitro studies. Although these study designs consider short-term exposure periods and may be at exposure levels higher than those experienced by the Canadian general population, the biological responses observed are informative in that they provide mechanistic insight into possible pathways that can lead to effects observed in long-term epidemiology studies. A summary of the findings providing biological and mechanistic evidence relevant to TRAP exposure and cancer or genotoxicity is presented below to evaluate the biological plausibility of this relationship.
4.1 Systematic review articles
From the scoping review process and literature search update (described in Section 2.1), three systematic reviews of biological evidence in humans (e.g., molecular epidemiology) were identified. These publications (DeMarini 2013; Sahay et al. 2019; Gromadzinska and Wasowicz 2019) were considered for quality appraisal using the AMSTAR 2 tool; however, the tool was determined to be ineffective to evaluate these publications. Of note, this tool was designed to evaluate the steps that are expected in systematic reviews of health care interventions (Shea et al. 2017) and these practices are not necessarily implemented or reported to the same degree in other areas of research. The AMSTAR 2 tool was adapted for evaluation of environmental epidemiological systematic reviews and SR-MAs included in this assessment (described in Section 2.2), as these articles had incorporated various elements of systematic review practices. Although the systematic reviews of the biological evidence did not adequately correspond to the AMSTAR 2 tool, they were considered for inclusion in the evaluation of the biological evidence, as each provided an overview and evaluation of human biological evidence and had incorporated some key elements of systematic reviews, such as description of literature searches and inclusion and exclusion criteria (each of the three articles), and tabulation of data from included studies (two of the articles). A total of 67 primary studies were considered in these review articles. There was minimal overlap of citations, with only four primary articles included in two of the systematic reviews and the remainder included in one of the systematic reviews. A table of overlapping citations is provided in Table C.3 of Appendix C. The systematic reviews were critically reviewed to support an evaluation of biological plausibility for the association between TRAP exposure and cancer by providing mechanistic and biological evidence, such as genotoxicity.
4.1.1 Review of systematic review articles
DeMarini (2013)
DeMarini (2013) systematically reviewed the genotoxicity biomarkers, including DNA damage and chromosomal changes that were evaluated in TRAP-exposed subjects relative to control subjects. The literature search identified 63 primary articles, covering 12 different biomarkers, approximately 20 different occupations in subjects from 20 different countries, though some primary studies considered non-occupational exposures. The literature search period was not identified in the review article. The main biomarkers evaluated in the primary studies were classified as either DNA damage or cytogenic endpoints. DNA damage endpoints included measurement of DNA adducts, comet assay, and 8-hydroxydeoxyguanosine (8-OHdG). Cytogenic endpoints included chromosome aberrations, micronucleus (MN), and sister chromatid exchange (SCE).
A total of 19 primary studies evaluated DNA adducts in peripheral blood lymphocytes in relation to traffic or TRAP exposure, and all except two studies identified a significant increase. The comparison groups, in the primary studies, were mainly comprised of: traffic police vs. indoor workers; outdoor police vs. office workers; professional drivers vs. non-driving occupational groups; roadside workers vs. general residents; urban school children vs. rural school children; and, urban workers vs. suburban workers. Additionally, an association between level of exposure and level of DNA adducts was reported in seven of the studies. The review author noted that the other studies did not evaluate the exposure-response relationship.
The comet assay is used to detect a variety of DNA damage including strand breaks, apurinic or apyrimidinic sites, and oxidized or fragmented bases. Each of the seven primary studies identified in the literature search, reported a significant increase in DNA damage in association with traffic or TRAP using the comet assay, and three of the primary studies had an exposure-response relationship. These primary studies conducted the comet assay using blood cells, buccal cells, or nasal epithelial cells. In this group of studies, the comparison groups were: traffic police vs. office workers; traffic police vs. general residents; urban school children vs. rural school children; and, outdoor cyclists vs. indoor cyclists.
8-OHdG is measured to evaluate oxidative DNA damage and is considered a potentially pre-mutagenic lesion. Each of the six primary studies measuring 8-OHdG in traffic-exposed groups reported a significant increase of this biomarker, with two of the studies identifying an exposure-response relationship. For these studies, 8-OHdG was measured in urine or nasal epithelial cells. Comparisons considered in these studies include: traffic police vs. office workers; urban school children vs. rural school children; urban bus drivers vs. rural/suburban bus drivers; taxi drivers vs. non-urban residents; and, gate guards post-shift vs. pre-shift.
Chromosomal aberrations and MN are considered predictive of an increased cancer risk. Chromosomal aberrations were more commonly assessed prior to the year 2000, and with time have largely been replaced by measures of MN due to the comparative ease of performing and evaluating the MN assay. Both techniques use peripheral blood lymphocytes as the test material. The review author noted that significantly increased chromosomal aberrations was noted in each of the five studies identified, though none observed an exposure-response relationship with traffic exposure. For MN, six of the seven studies reported a significant increase in MN associated with traffic exposure and one reported an exposure-response relationship. In these sets of primary studies, the comparison groups included: traffic police vs. office workers; traffic police vs. other police; traffic police vs. non-traffic police; urban bus drivers vs. rural/suburban bus drivers; and mail carriers vs. office workers.
SCE is a sensitive biomarker for exposure to genotoxic agents but alone is not predictive of a cancer risk. The review author identified eight studies, each based on traffic police as the exposure group compared to office workers, university students, or outdoor workers away from traffic. Seven studies reported a significant increase in SCE in lymphocytes collected from the traffic police compared to the control group. No exposure-response relationship was reported.
DiMarini (2013) also identified 12 other studies that evaluated other biomarkers associated with genotoxicity, including telomere length, expression of oxidative stress response genes, or DNA repair and methylation. Primary studies conducted in the USA, China, and Italy reported decreased telomere length in people living near traffic sources or those employed in traffic-related occupational groups, indicating an increased risk of chronic disease. Increased expression of oxidative stress response genes was noted in three controlled human exposure studies evaluating diesel exhaust or ultrafine particles (UFP). And, alterations in DNA repair and methylation were reported in one study each, associated with exposure to traffic or TRAP. The review author noted that some of the studies included in the review evaluated genetic polymorphisms in the study groups, but that at the time the data were limited and inconsistent.
Overall, the results of the primary studies indicate a consistent increase in genotoxic effects in people or groups exposed to heavy traffic. Additionally, DeMarini (2013) noted that these biomarkers of DNA damage and cytogenic effects provide mechanistic support to epidemiological studies noting increased risk of cancer in populations that work or live near high traffic environments. However, any reporting of or elaboration on adjustments for confounders (e.g., smoking, diet, etc.) or potential biases in the primary studies was not included in the review by DeMarini (2013).
Gromadzinska and Wasowicz (2019)
Gromadzinska and Wasowicz (2019) conducted a systematic review of exposures to pollutants and biomarkers in professional drivers to assess the hazards associated with occupational exposure to traffic and vehicle exhausts. The literature search covered January 2000 – September 2018, and 62 articles were identified for inclusion in the review; however, only 20 of these articles evaluated occupational exposure to traffic and vehicle exhaust. The remainder of the articles identified for inclusion by the review authors provide pertinent information, such as a mechanistic link between a given type of biomarker and its effect, but do not directly evaluate occupational exposure to traffic and vehicle exhausts. Also, the review authors only included primary studies that reported a significant difference in biomarkers between exposure and control groups; the number of studies excluded based on this criterion was not identified. The majority of the studies were conducted in Europe, Asia, and North America, with a small number coming from South America and Australia. The primary studies evaluated differences in various biomarkers between a TRAP-exposed group and a reference group, or in the same group before and after a work shift, in a TRAP-influenced environment.
The review authors identified 13 studies that had quantified exposures to TRAP pollutants in occupational settings, such as taxi drivers and bus drivers. Elevated exposures were reported for volatile organic compounds (VOCs), including benzene, polycyclic aromatic hydrocarbons (PAHs), and heavy metals. Although the review did not identify if these primary studies had assessed any health-related impacts directly, the studies provide empirical evidence of elevated exposure to TRAP pollutants in occupational settings for professional drivers compared to exposure of reference groups.
For biomarkers associated with DNA damage, a limited number of studies were included. Increased DNA damage, measured using the comet assay, was reported in two studies; increased urinary levels of 8-oxo-2′-deoxyguanosine, a marker of oxidative DNA damage, was reported in three studies; and shortening of telomeres, a marker of oxidative stress and cellular aging, was reported in two studies.
Overall, this review identified that professional drivers are exposed to higher levels of TRAP pollutants during work activities, and that biomarkers associated with DNA damage are elevated in these occupational groups, based on a limited number of studies demonstrating a biological effect. However, synthesis and overall interpretation of the primary literature were lacking in this review, and Gromadzinska and Wasowicz (2019) did not address any confounders or potential biases. Specifically, the review authors did not assess any exposure-response relationships or identify any causative agents for the observed biological responses.
Sahay et al. (2019)
Sahay et al. (2019) conducted a systematic review to evaluate the relationship between TRAP exposure and breast cancer, with an emphasis on evidence for an epigenetic mechanism for tumorigenesis. The review of the epidemiological evidence in this publication was not considered of sufficient reliability for inclusion in the umbrella review (Section 3.1). However, the systematic review of the biological evidence was considered appropriate for inclusion in this assessment. The literature search considered primary studies published after 2000 and the authors identified three studies that evaluated molecular epidemiology at the intersection of TRAP exposure, breast cancer development, and epigenetic changes. Alterations in DNA methylation (i.e., epigenetic changes) were evaluated in either breast cancer tissue samples or peripheral blood cells from women with breast cancer. The primary studies, comprised of one cohort study and two case-control studies, covered a wide range of exposures including LUR modelling for PM2.5 and NO2, geospatial traffic models for vehicular traffic, and dispersion modelling for PAHs. There was no consistent association between DNA methylation levels and the different measures of TRAP between studies. Significant changes in DNA methylation were reported in breast cancer tissues for traffic and PAH exposure, while no association was reported in a study that used a geographic based model to measure traffic. In studies using peripheral blood cells, one study reported significant reductions in DNA methylation for PM2.5 and NO2 for study participants from Italy, while evaluation of study participants from the Netherlands did not identify any changes in DNA methylation. In another study, PAH exposure was not associated with DNA methylation changes. Overall, the available literature on epigenetic changes associated with TRAP exposure and breast cancer is limited and lacks consistency.
4.1.2 Summary of systematic review articles
Of the three systematic articles, DeMarini (2013) provided the most comprehensive and insightful review of the biological literature to provide mechanistic support for a link between TRAP exposure and cancer. This systematic review demonstrated a consistent increase in genotoxic effects, including DNA damage and cytogenic effects in humans, associated with exposure to elevated levels of traffic or TRAP. Some of the studies identified an exposure-response relationship, though this was not consistently evaluated in the primary studies. The systematic review by Gromadzinska and Wasowicz (2019) identified that professional drivers are exposed to higher levels of TRAP during work activities, and that biomarkers of DNA damage are also elevated in this occupational group; however, this review evaluated a limited number of studies and only considered those demonstrating a biological effect. Sahay et al. (2019) conducted a focused systematic review, restricted to the association between TRAP exposure and epigenetic changes associated with breast cancer. As such, only a small number of primary studies was reviewed and the results were inconsistent.
4.2 Other Assessments
4.2.1 HEI
The HEI's assessment of TRAP (2010) reviewed the available biological evidence relating to cancers and mutagenicity, and included in vitro mutagenicity studies of exposure to the traffic mix, DE, and organic components of TRAP, as well as animal tumourigenicity studies of DE and GE. The in vitro studies demonstrated mutagenicity of PM samples collected from areas of high traffic, though there was no clear correlation between traffic intensity and the level of mutagenicity. For DE, DE particles (DEP) and organic extracts of DEP were associated with DNA damage and mutagenicity in in vitro studies. The assessment also noted that TRAP contains several organic compounds, including benzene, formaldehyde, acetaldehyde, and PAHs, which are considered to be carcinogenic in some animals and are classified by IARC as carcinogens with varying levels of certainty (i.e., carcinogenic, probably carcinogenic, or possibly carcinogenic to humans). However, the levels of exposure associated with carcinogenicity for these compounds are greater than levels associated with ambient TRAP exposure. For animal tumourigenicity, DE inhalation studies in rats demonstrated lung tumour development at high concentrations. These tumours were associated with particle overload in the lungs, which was not considered applicable at the concentrations to which humans are typically exposed. Additionally, removal of the particles also eliminated the carcinogenic effect of DE. In mouse studies, dermal application of extracts of DE and GE induced tumours; however, the relevance of these exposure scenarios to humans was limited. Overall, the HEI suggested that TRAP-induced oxidative stress and DNA damage could lead to mutagenesis and cancer.
4.2.2 Health Canada
Health Canada's assessment of DE (2016a) identified that there was extensive evidence demonstrating that DE and DEP were genotoxic and mutagenic in experimental animals and in cell culture, providing biological plausibility that DE is carcinogenic in humans. In experimental animals, DE and DEP were demonstrated to induce oxidative DNA damage, strand breaks, and adduct formation. In vitro studies indicated that the organic component of DEP can generate reactive oxygen species (ROS), as a possible mechanism for the observed genotoxic effects. DE and DEP also contain compounds that are known or likely carcinogens, especially PAHs which are associated with the particle component. This risk assessment also noted that lung tumour development in rats was only observed at high exposure levels and was associated with particle overload leading to chronic inflammation. As such, it was not considered relevant to general population exposures to DE. Additionally, the risk assessment identified three molecular epidemiology studies evaluating occupational exposure to non-traffic sources of DE (i.e., construction, mining, and engine inspection work activities). Although these studies reported genotoxic effects (e.g., DNA strand breaks, oxidation of DNA, and MN formation), the evidence was considered limited due to potential confounding exposures and methodological issues.
Health Canada's assessment of GE (2017) indicated that the majority of the evidence for the genotoxicity and mutagenicity of GE is derived from in vitro studies using organic extracts of GE particles (GEP) which contain many PAHs. Studies in cell culture reported DNA strand breaks, oxidative DNA damage, MN formation, SCEs, and chromosomal aberrations. A smaller number of studies also reported genotoxic effects and mutagenicity using condensates of the gaseous phase of GE. In experimental animals, genotoxic effects (i.e., MN formation and DNA strand breaks) were reported following GE inhalation as well as intratracheal (IT) instillation of GEP or organic extracts of GE. The observed genotoxic and mutagenic effects in vitro and in vivo were attributed, at least in part, to oxidative damage. Carcinogenicity of GE condensate and organic extracts of GEP was reported in a few animal studies using non-inhalational routes of exposure (e.g., lung implantation, dermal application, IT instillation); however, chronic inhalation of GE was not demonstrated to induce tumour formation in several animal models.
Health Canada's assessment of NO2 (2016b) identified a limited number of biological studies on the genotoxicity and mutagenicity of NO2. A small number of studies demonstrated some genotoxic and mutagenic effects in vitro, while in vivo studies were mixed and often associated with higher than ambient exposure levels. In animal carcinogenicity tests, NO2 was identified as a possible tumour promoter, rather than a complete carcinogen, in co-exposure studies with other inhaled oxidants. Additionally, NO2 exposure was suggested to increase proliferation of metastases, possibly through interactions with endothelial cells or reduced immune defense. Overall, the assessment noted that NO2 may induce cancer-related effects in biological studies, but that the mechanism was unclear.
Health Canada's assessment of PM2.5 (2013) noted that PM2.5 from a variety of sources, including traffic and vehicle emissions, can induce mutations and DNA damage in vitro. Further studies attributed these effects to the PAH content of PM2.5 samples as well as ROS generation and oxidative stress associated with metals in PM2.5 samples. Additionally, relative genotoxic and mutagenic potency of ambient PM2.5 samples was influenced by the source (e.g., traffic, industrial, and home heating) and the size of the particles. Although the number of studies in animal models was limited, inhalation of PM2.5 induced DNA strand breaks, adduct formation, MN formation, and an increase in heritable mutations. In a series of rat studies, lung tumours were reported following exposure to high levels of PM2.5 via inhalation or IT instillation. The assessment noted that many of these studies used various granular dust samples or chemical compounds that had limited environmental relevance and may not apply to ambient sources of PM2.5. Also, the elevated exposure levels used in these granular dust studies limited the relevance.
4.2.3 US EPA
The US EPA Integrated Science Assessment (ISA) of NO2 (2016) indicated that toxicological studies have not clearly identified that NO2 exposure induces mutations or genotoxic effects, with only a limited number of studies assessing environmentally relevant concentrations. Even at high concentrations, results were mixed with some studies reporting chromosomal aberrations, MN formation, or DNA damage in different experimental models, while other studies did not report any effects. Specifically, for lung cancer, the experimental studies in animals did not demonstrate that NO2 can induce lung tumours itself. Also, the evidence was inconsistent that relevant NO2 exposures can promote lung tumours when co-exposed with a known carcinogen. However, the evidence suggested that NO2 may facilitate metastases of tumours and can induce genotoxic effects (i.e., DNA strand breaks and MN formation) in cultured airway cells.
The US EPA ISA of PM (2019) noted that a large body of evidence exists demonstrating that ambient PM and PM from combustion sources are mutagenic and genotoxic in vitro. The endpoints measured in these studies included mutagenesis, DNA strand breaks, MN formation, oxidative damage, and altered DNA methylation. Additionally, inhalation studies in rodents indicated that PM2.5 can induce oxidative DNA damage, alter methylation of a tumour suppressor gene in the lung, up-regulate expression of biotransformation genes, and enhance tumour promotion. Molecular epidemiology studies have also identified some degree of association between PM2.5 exposure and formation of DNA adducts, DNA damage, altered gene expression, and changes in DNA methylation. The suggested mechanisms of action for PM2.5 to lead to cancer development included: (i) genotoxicity, including DNA damage leading to mutations and cytogenic effect, and (ii) epigenetic effects, altering DNA methylation of a tumour suppressor gene. The assessment also noted that the body of evidence was much larger for PM2.5 than other sizes of PM, including PM10-2.5 and UFP. Despite the limited number of studies, it has been demonstrated that PM10-2.5 and UFP cause genotoxic effects and oxidative stress in experimental studies.
4.2.4 IARC
The IARC monographs critically review the available data, including epidemiological studies, animal studies, and mechanistic data, to evaluate cancer hazards to determine if an agent is capable of causing cancer, and the agent is categorized based on the level of evidence. IARC has evaluated several mixtures or compounds (i.e., agents) of interest for this assessment, including diesel and gasoline vehicle exhaust (2014), outdoor air pollution and PM in outdoor air pollution (2016), and benzene (2018). The IARC classifications for these agents are summarized in Table 4.1. Of the different agents included here, each has been classified as carcinogenic to humans (Group 1), except for GE, which has been classified as possibly carcinogenic to humans (Group 2B). This is due to differences in the levels of evidence and strength of data reviewed by IARC. For this risk assessment of TRAP and cancer, the content of the IARC monographs regarding biological and mechanistic evidence was reviewed to evaluate biological plausibility as a part of the weight of evidence.
| Agent | IARC Classification | IARC Evaluation |
|---|---|---|
| DE | Group 1 – carcinogenic to humans |
|
| GE | Group 2B – possibly carcinogenic to humans |
|
| Outdoor air pollution | Group 1 – carcinogenic to humans |
|
| PM in outdoor air pollution | Group 1 – carcinogenic to humans |
|
| Benzene | Group 1 – carcinogenic to humans |
|
IARC's assessment of DE and GE (2014) identified that these are the main emissions from motor vehicles while noting that there are many differences between diesel and gasoline fuel and their respective engines. Additionally, the composition of vehicle exhaust is variable depending on many factors including the fuel, type of engine, operating conditions, and presence of emission control systems. For DE, IARC (2014) concluded that there was sufficient evidence in experimental animals for the carcinogenicity of whole DE, DEP, and extracts of DEP, and inadequate evidence in experimental animals for the carcinogenicity of the gas-phase of DE (i.e., particles removed). Several inhalation studies of whole DE by rats reported an increase in incidence of lung tumours; however, no increase was observed in studies with mice, hamsters, or monkeys. No increase in tumours was observed in animals exposed to the gas-phase of DE (i.e., particles removed). Studies using IT instillation of DEP reported an increase in lung tumours in rats, but not in mice or hamsters. Dermal application and subcutaneous injection of organic extracts of DEP were associated with an increased incidence of tumours in some studies with mice and rats. Intrapulmonary implantation of DEP extracts was associated with increased lung tumours in rats. For mechanistic evidence, studies in humans exposed to DE reported an increase in expression of genes associated with oxidative stress and inflammation. Additionally, humans exposed to DE-induced formation of DNA adducts, MN formation, and biomarkers of DNA damage. In vivo and in vitro studies in a wide range of animals and cell lines have demonstrated that DE, DEP, and extracts of DEP induce DNA damage, mutations, DNA strand breaks, chromosomal alterations, and morphological cell transformation. Studies in animals have also reported an upregulation in expression of genes associated with numerous pathways including oxidative stress, inflammation, DNA damage, antioxidant responses, cell cycle, cell transformation, and apoptosis. IARC (2014) determined that there was strong mechanistic evidence that DE and many of its components can induce lung cancer in humans through genotoxic mechanisms, including DNA damage, gene mutations, changes in gene expression, production of ROS, and inflammatory response. Additionally, the presence of known carcinogens, co-carcinogens, and tumour-promoting compounds in DE likely contribute to the carcinogenicity. Overall, IARC (2014) concluded that DE is carcinogenic to humans (Group 1).
For GE, IARC (2014) concluded that there was inadequate evidence in experimental animals for carcinogenicity of whole GE, and sufficient evidence in experimental animals for the carcinogenicity of condensates of GE. None of the studies in mice, rats, hamsters, or dogs reported an increase in respiratory tract tumours following inhalation of whole GE. Using condensates of GE, an increase in tumour was reported in experimental animals following topical application, intrapulmonary implantation, and IT instillation. In experimental animals, GE exposure resulted in genotoxic effects including chromosomal damage, as well as altered expression of genes associated with xenobiotic metabolism and inflammatory responses. GE condensates and the organic extracts of the condensates induced DNA damage (e.g., DNA strand breaks, oxidative lesions, and DNA adducts), chromosomal alterations, and morphological cell transformation in animal and human cell lines, and gene mutations in bacteria. Studies in human cell lines exposed to organic extracts of GE condensates also identified upregulation of gene pathways including inflammation, xenobiotic metabolism, tumour progression, metastasis, and cell cycle. IARC (2014) concluded that there was strong evidence of a genotoxic mechanism for the carcinogenicity of the organic extracts of GE condensates, while the available data from human and experimental studies of whole GE exposure were insufficient to formulate a mechanism. Overall, IARC (2014) concluded that GE was possibly carcinogenic to humans (Group 2B).
IARC's assessment of outdoor air pollution (2016) noted that air pollution is a mixture of mixtures, and that the composition and levels of substances present varies from location to location. The assessment also noted that outdoor air pollution can be described based on components (e.g., PM) or based on sources (e.g., traffic). Additionally, the IARC working group evaluated PM in outdoor air pollution as an indicator of the air pollution mixture as well as a causative agent, as much of the evidence for the association between outdoor air pollution and cancer comes from studies of PM. IARC (2016) concluded that there was sufficient evidence in experimental animals for the carcinogenicity of organic solvent extracted material from particles collected from outdoor air; particulate matter in outdoor air pollution; and outdoor air pollution itself. These conclusions were based on the studies of increased incidence of lung tumours in animals following inhalation exposure to emissions from combustion of coal and wood, DE, and TRAP. The gas phase of DE (i.e., after removal of DEP) did not increase lung tumours in the animal models. Other routes of exposure, including dermal application or subcutaneous injection of organic solvent extracts of coal soot, DEP, and outdoor PM, and of GE condensates resulted in increased tumours in animal models. IARC (2016) also determined that there was strong mechanistic evidence to support the carcinogenicity of outdoor air pollution and PM. This conclusion was based on studies demonstrating human exposure to elevated air pollution or PM and an associated increase in genetic damage. Studies of people in occupations with increased exposure to air pollution (e.g., traffic police, mail carriers) or those living in areas of elevated outdoor air pollution have reported increased frequencies of chromosomal aberrations and MN formation in lymphocytes. These studies have been conducted in several countries and together indicate an increase in biological endpoints associated with an increased risk of cancer. Other molecular epidemiology studies have indicated increased DNA adducts, epigenetic changes, and telomere shortening in humans exposed to elevated levels of air pollution. Animal studies have also indicated that air pollution, especially the PM component, induces mutations, cytogenic damage, DNA adducts, DNA strand breaks, and oxidative DNA lesions. In vitro studies in human and animal cells have reported strong evidence of the mutagenic and cytogenic effects of organic extracts, aqueous extracts or suspensions of outdoor PM samples, with significant effects associated with mobile-source and residential heating emissions. Studies in bacterial cells provided strong evidence that organic extracts of outdoor PM induce mutations, with greater mutagenic activity associated with urban, mobile, and industrial sources. Mutagenic activity has also been associated with higher levels of NOX, PAHs, nitrated PAHs, lead, and SO2. Mechanistic studies identified that exposure to PM or organic extracts of PM resulted in changes in expression of genes associated with metabolism and bioactivation of mutagenic carcinogens, responses to DNA damage and oxidative stress, alterations of cell-cycle control, and inflammation. Based on the biological effects, IARC suggested that outdoor air pollution, and many of its components including PM, may initiate development of cancer via a genotoxic mechanism and by promoting cancer progression via oxidative stress, biochemical responses to oxidative stress, and sustained inflammation. Overall, IARC (2016) concluded that outdoor air pollution is carcinogenic to humans (Group 1) and that PM in outdoor air pollution is carcinogenic to humans (Group 1).
Benzene was utilized as an exposure metric in some of the SR-MAs evaluated in relation to childhood leukemia (Section 3.2.1). IARC (2018) determined that there was sufficient evidence in experimental animals for the carcinogenicity of benzene, based on increased incidence of neoplasms and tumours following exposure via inhalation, oral gavage, intraperitoneal injection, and dermal application. Studies in mice and rats exposed to benzene via inhalation reported increases in neoplasms of haematopoietic and lymphoid tissues, as well as lung and stomach tumours. IARC (2018) also determined that the mechanistic data provided strong evidence that benzene has the characteristics of carcinogens. Specifically, the report identified that benzene is metabolized to active electrophilic species, which can lead to DNA adducts in bone marrow and haematopoietic cells; induces oxidative stress and oxidative DNA damage; is genotoxic and alters DNA repair; and, is immunosuppressive and causes haematotoxicity, which are associated with a risk of developing a haematological malignancy. The mechanistic evidence was demonstrated in occupationally exposed individuals, experimental animals, and/or in human cell systems. Exposure-response gradients were also noted for studies of exposed humans for several endpoints: MN formation, chromosomal aberrations, and leukocyte counts. Overall, IARC (2018) concluded that benzene is carcinogenic to humans (Group 1) based on the totality of evidence from studies of cancer in humans and in experimental animals, with support from the mechanistic data.
4.2.5 Summary of other assessments
The biological evidence and mechanistic data reviewed in the other comprehensive assessments have identified that TRAP contains mixtures and chemical compounds that have been established to have genotoxic (e.g., DNA adducts, DNA strand breaks, oxidative DNA damage) or mutagenic effects in several animal models and cellular test systems. Additionally, some components of TRAP have been demonstrated to be carcinogenic in animal models; the amount and strength of evidence are variable between the different components of TRAP. Specifically, there is large body of evidence for each of DE, PM, and benzene. In comparison, the biological evidence for GE and NO2 is limited.
Potential mechanisms of action include a genotoxic mechanism either via direct DNA damage or indirectly through generation of ROS and/or induction of inflammatory responses, and the resultant oxidative stress causing DNA damage. In turn, this DNA damage, including mutations and cytogenic effects, can lead to cancer development. Additionally, epigenetic modifications and changes in gene expression may lead to tumour promotion or reduced tumour suppression. Lastly, benzene exposure is specifically associated with development of haematological cancers, which may be mediated via DNA damage in both the bone marrow and the haematopoietic cells, and immunosuppression. Both DNA damage and immunosuppression can cause haematotoxicity, thus increasing the risk of cancer development.
Chapter 5: Risk characterization and evaluation of causality
5.1 Evidence from the umbrella review
5.1.1 Childhood leukemia
Six SR-MAs evaluating the potential link between TRAP and leukemia were identified in the scoping review, the literature search update, or while screening the reference list of included review articles. Primary studies included in those SR-MAs were generally case-control studies, either through the SR-MA's inclusion criteria or study availability, in children aged 0 to 14/15 years. They were mostly conducted in Europe and North America; only Filippini et al. (2015, 2019) and Gong et al. (2019) included primary studies (one or two studies each) conducted in Asia. As such, the results from the SR-MAs were considered relevant to a Canadian assessment, given the general similarities in air pollution mixture, standard of living, health care and climate, between Canada, the USA, and European countries. The primary studies were mostly population-based and while the exposure metric used was primarily traffic density, how traffic density was measured across the primary studies varied considerably (e.g., number of vehicles per day, cumulative traffic density within a certain buffer, road density, distance to the nearest major road, or a combination of them). Filippini et al. (2015, 2019) and Gong et al. (2019) also used specific TRAP pollutants (i.e., NO2 and benzene) as indicators of traffic in their SR-MAs. Study quality was assessed by the review authors in all but two SR-MAs (Carlos-Wallace et al. [2016] and Gong et al. [2019]) and most of the primary studies included in the analyses were found to be of good quality. Similarly, potential confounders were addressed in all but two SR-MAs (Sun et al. [2014] and Gong et al. [2019]). Specifically, the primary studies were adjusted or matched for age and gender; additionally, many included adjustments for SES, and some studies included adjustments for smoking, (electro)magnetic fields, distance to power line, and/or wire-code. Of note, all but one of the primary studies included in the quantitative analyses of Sun et al. (2014) and Gong et al. (2019) were included in Filippini et al. (2019), in which potential confounders were addressed.
Overall, all the SR-MAs reported a positive association between childhood leukemia and indicators of TRAP demonstrating consistency in the associations reported by different researchers in studies conducted in various regions. Forest plots of the pooled risk estimates for childhood leukemia were constructed to examine the consistency and strength of the associations between this health effect and TRAP. As noted above, the primary studies were generally of a case-control study design, which is limited in its ability to establish the temporality of the association compared to a cohort study design; however, many of the studies considered exposure from birth as a means to address this limitation. The forest plots for traffic density, traffic density stratified by leukemia subtype and exposure window, NO2, and benzene are provided in Figures 5.1 through 5.4, respectively. The pooled risk estimates for traffic density and childhood leukemia ranged from 0.97 to 1.39, of which 14 of the 17 pooled estimates indicated positive associations and all of these positive associations were statistically significant or borderline significant (Figure 5.1). Of note, higher risk estimates, representing stronger associations, were observed in school-aged children compared to preschoolers (Filippini et al. 2019), in high exposure levels compared to low and moderate exposure levels (Gong et al. 2019), and when traffic density was defined as vehicles per day compared to other definitions (Sun et al. 2014). Furthermore, use of only high quality studies in the quantitative analysis did not substantially change the risk estimate as depicted in Sun et al. (2014) and Filippini et al. (2015). Analyses of traffic density were also stratified by leukemia subtype and exposure window by more than one SR-MA; the pooled estimates of these analyses are represented in a separate forest plot (Figure 5.2). With respect to leukemia subtype, the pooled risk estimates for traffic density ranged from 1.05 to 1.25 for ALL and from 1.08 to 1.09 for AML, but only those for ALL were borderline significant. While no association was observed during the prenatal exposure period (i.e., pooled risk estimates ranged from 0.92 to 0.98), all nine pooled risk estimates for the postnatal exposure period indicated positive associations and ranged from 1.26 to 1.87, of which seven of the nine pooled estimates were statistically significant. For the TRAP pollutants NO2 and benzene, the pooled risk estimates for childhood leukemia ranged from 0.94 to 1.21 and from 0.94 to 1.64, respectively (Figure 5.3 and 5.4, respectively). Seven of the 10 associations were positive for NO2, of which six were statistically or borderline significant. Similarly, eight of the 11 associations were positive for benzene, of which six were statistically or borderline significant. Of note, for both NO2 and benzene, all null or negative associations were limited to only one SR-MA (Gong et al. 2019) and, similar to traffic density, higher risk estimates were observed for the postnatal exposure window compared to the prenatal exposure window (Filippini et al. 2019). However, unlike for traffic density, positive associations were also detected for the prenatal exposure window for the TRAP pollutants. A higher pooled risk estimate was also derived for benzene in preschoolers compared to school-aged children (Filippini et al. 2019); a similar comparison could not be made for NO2 due to insufficient data (i.e., no pooled risk estimate for school-aged children). In stratified analyses by Filippini et al. (2015, 2019), exposure to benzene resulted in positive associations for both leukemia subtypes (i.e., ALL and AML) but a statistically significant higher risk was observed for AML, with pooled risk estimates ranging from 1.89 to 2.28. In contrast, the pooled risk estimates for NO2 indicated a potentially higher risk for ALL compared to AML, with a range from 1.02 to 1.21, but only one of the two estimates was statistically significant.

Figure 5.1 - Text description
Figure 5.1 depicts a forest plot of pooled risk estimates from SR-MAs for exposure to traffic density and risk of childhood leukemia. The x-axis representing pooled estimates and 95% CI ranges from 0.8 to 2.0. The following information is depicted in this figure:
| Data marker | Pooled risk estimate | 95% confidence interval | n | I2 | Reference |
|---|---|---|---|---|---|
| A1 (main analysis) | 1.09 | 1.00-1.20 | 16 | 56.2% | Filippini et al. (2019) |
| A2 (preschoolers) | 1.00 | 0.93-1.09 | 7 | 67.10% | Filippini et al. (2019) |
| A3 (school-aged children) | 1.05 | 0.96-1.15 | 3 | 10.0% | Filippini et al. (2019) |
| B1 (main analysis) | 1.01 | 0.98-1.04 | 13 | 0.0% | Gong et al. (2019) |
| B2 (high exposure) | 1.04 | 0.91-1.17 | 9 | 0.0% | Gong et al. (2019) |
| B3 (moderate exposure) | 0.97 | 0.82-1.12 | 7 | 0.0% | Gong et al. (2019) |
| B4 (low exposure) | 0.98 | 0.90-1.07 | 6 | 0.0% | Gong et al. (2019) |
| C | 1.25 | 0.96-1.62 | 11 | 29.92 (χ2) | Carlos-Wallace et al. (2016) |
| D1 (main analysis) | 1.09 | 0.96-1.23 | 11 | 57.0% | Filippini et al. (2016) |
| D2 (high quality primary study) | 1.07 | 0.93-1.24 | 8 | 61.7% | Filippini et al. (2016) |
| E | 1.39 | 1.03-1.88 | 8 | 57.4% | Boothe et al. (2014) |
| F1 (main analysis) | 1.03 | 0.98-1.09 | 11 (12 study estimates) | 63.3% | Sun et al. (2014) |
| F2 (high quality primary study [i.e., NOS≥7]) | 1.05 | 0.96-1.15 | 6 | 58.80% | Sun et al. (2014) |
| F3 (study duration <10 years) | 1.06 | 1.00-1.13 | 6 | 36.70% | Sun et al. (2014) |
| F4 (study duration ≥10 years) | 1.01 | 0.95-1.07 | 5 | 74.10% | Sun et al. (2014) |
| F5 (vehicles per day) | 1.31 | 1.02-1.67 | 6 | 74.40% | Sun et al. (2014) |
| F6 (other definitions of traffic) | 1.02 | 0.99-1.05 | 5 | 47.60% | Sun et al. (2014) |

Figure 5.2 - Text description
Figure 5.2 depicts a forest plot of pooled risk estimates from SR-MAs for exposure to traffic density and risk of childhood leukemia stratified by leukemia subtype (at the top) and exposure window (at the bottom). The x-axis representing pooled estimates and 95% CI ranges from 0.4 to 3.0. The following information is depicted in this figure:
| Health endpoint | Data marker | Pooled risk estimate | 95% Confidence interval | n | I2 | Reference |
|---|---|---|---|---|---|---|
| Childhood leukemia subtype | A1 (ALL subtype) | 1.05 | 0.96-1.16 | 9 | 34.7% | Filippini et al. (2019) |
| Childhood leukemia subtype | B1 (ALL subtype) | 1.25 | 0.92-1.69 | 4 | 53.7% | Filippini et al. (2016) |
| Childhood leukemia subtype | A2 (AML subtype) | 1.09 | 0.86-1.38 | 5 | 70.0% | Filippini et al. (2019) |
| Childhood leukemia subtype | B2 (AML subtype) | 1.08 | 0.53-2.19 | 2 | 44.4$ | Filippini et al. (2016) |
| Exposure window | A3 (prenatal exposure, i.e., at birth) | 0.98 | 0.90-1.06 | 5 | 30.9% | Filippini et al. (2019) |
| Exposure window | A4 (postnatal exposure, [i.e., at diagnosis]) | 1.32 | 1.12-1.55 | 14 | 50.7% | Filippini et al. (2019) |
| Exposure window | B3 (prenatal exposure) | 0.97 | 0.89-1.06 | 5 | 42.1% | Filippini et al. (2016) |
| Exposure window | B4 (postnatal exposure) | 1.49 | 1.21-1.85 | 8 | 0.0% | Filippini et al. (2016) |
| Exposure window | C1 (prenatal exposure) | 0.92 | 0.78-1.09 | 4 | 0.0% | Boothe et al. (2014) |
| Exposure window | C2 (postnatal exposure, main analysis) | 1.53 | 1.12-2.10 | 7 | 37.8% | Boothe et al. (2014) |
| Exposure window | C3 (postnatal exposure, high quality primary studies) | 1.84 | 1.22-2.78 | 4 | 42.2% | Boothe et al. (2014) |
| Exposure window | C4 (postnatal exposure, SES-controlled primary studies) | 1.87 | 1.12-3.11 | 4 | 61.1% | Boothe et al. (2014) |
| Exposure window | C5 (postnatal exposure, leukemia) | 1.83 | 1.22-2.75 | 5 | 42.0% | Boothe et al. (2014) |
| Exposure window | C6 (postnatal exposure, acute leukemia) | 1.26 | 0.91-1.75 | 2 | 54.8% | Boothe et al. (2014) |
| Exposure window | C7 (postnatal exposure, single road) | 1.62 | 1.06-2.48 | 5 | 54.5% | Boothe et al. (2014) |
| Exposure window | C8 (postnatal exposure, multiple roads) | 1.48 | 0.79-2.78 | 2 | 0.0% | Boothe et al. (2014) |
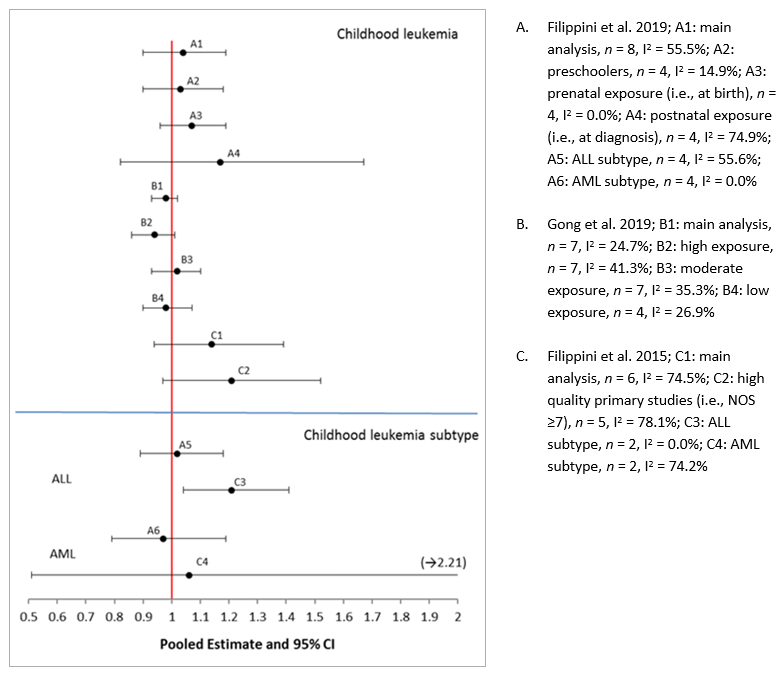
Figure 5.3 - Text description
Figure 5.3 depicts a forest plot of pooled risk estimates from SR-MAs for exposure to NO2 and childhood leukemia stratified by childhood leukemia (at the top) and childhood leukemia subtype (at the bottom). The x-axis representing pooled estimates and 95% CI ranges from 0.5 to 2.0. The following information is depicted in this figure:
| Health endpoint | Data marker | Pooled risk estimate | 95% Confidence interval | n | I2 | Reference |
|---|---|---|---|---|---|---|
| Childhood leukemia | A1 (main analysis) | 1.04 | 0.90-1.19 | 8 | 55.5% | Filippini et al. (2019) |
| Childhood leukemia | A2 (preschoolers) | 1.03 | 0.90-1.18 | 4 | 14.9% | Filippini et al. (2019) |
| Childhood leukemia | A3 (prenatal exposure [i.e., at birth]) | 1.07 | 0.96-1.19 | 4 | 0.0% | Filippini et al. (2019) |
| Childhood leukemia | A4 (postnatal exposure [i.e., at diagnosis]) | 1.17 | 0.82-1.67 | 4 | 74.9% | Filippini et al. (2019) |
| Childhood leukemia | B1 (main analysis) | 0.98 | 0.93-1.02 | 7 | 24.7% | Gong et al. (2019) |
| Childhood leukemia | B2 (high exposure) | 0.94 | 0.86-1.01 | 7 | 41.3% | Gong et al. (2019) |
| Childhood leukemia | B3 (moderate exposure) | 1.02 | 0.93-1.10 | 7 | 35.3% | Gong et al. (2019) |
| Childhood leukemia | B4 (low exposure) | 0.98 | 0.90-1.07 | 4 | 26.9% | Gong et al. (2019) |
| Childhood leukemia | C1 (main analysis) | 1.14 | 0.94-1.39 | 6 | 74.5% | Filippini et al. (2015) |
| Childhood leukemia | C2 (high quality primary studies [i.e., NOS≥7]) | 1.21 | 0.97-1.52 | 5 | 78.1% | Filippini et al. (2015) |
| Childhood leukemia subtype | A5 (ALL subtype) | 1.02 | 0.89-1.18 | 4 | 55.6% | Filippini et al. (2019) |
| Childhood leukemia subtype | C3 (ALL subtype) | 1.21 | 1.04-1.41 | 2 | 0.0% | Filippini et al. (2015) |
| Childhood leukemia subtype | A6 (AML subtype) | 0.97 | 0.79-1.19 | 4 | 0.0% | Filippini et al. (2019) |
| Childhood leukemia subtype | C4 (AML subtype) | 1.06 | 0.51-2.21 | 2 | 74.2% | Filippini et al. (2015) |

Figure 5.4 - Text description
Figure 5.4 depicts a forest plot of pooled risk estimates from SR-MAs for exposure to benzene and childhood leukemia stratified by childhood leukemia (at the top) and childhood leukemia subtype (at the bottom). The x-axis representing pooled estimates and 95% CI ranges from 0.5 to 3.1. The following information is depicted in this figure:
| Health endpoint | Data marker | Pooled risk estimate | 95% Confidence interval | n | I2 | Reference |
|---|---|---|---|---|---|---|
| Childhood leukemia | A1 (main analysis) | 1.27 | 1.03-1.56 | 7 | 52.4% | Filippini et al. (2019) |
| Childhood leukemia | A2 (preschoolers) | 1.39 | 1.03-1.87 | 4 | 27.9% | Filippini et al. (2019) |
| Childhood leukemia | A3 (school-aged children) | 1.08 | 0.64-1.82 | 2 | 0.0% | Filippini et al. (2019) |
| Childhood leukemia | A4 (prenatal exposure [i.e., at birth]) | 1.21 | 1.04-1.41 | 3 | 0.0% | Filippini et al. (2019) |
| Childhood leukemia | A5 (postnatal exposure [i.e., at diagnosis]) | 1.36 | 0.92-2.00 | 4 | 65.2% | Filippini et al. (2019) |
| Childhood leukemia | B1 (main analysis) | 0.94 | 0.84-1.04 | 6 | 17.2% | Gong et al. (2019 |
| Childhood leukemia | B2 (high exposure) | 0.94 | 0.81-1.08 | 5 | 0.0% | Gong et al. (2019 |
| Childhood leukemia | B3 (moderate exposure) | 1.04 | 0.71-1.37 | 3 | 0.0% | Gong et al. (2019 |
| Childhood leukemia | B4 (low exposure) | 0.89 | 0.71-1.06 | 4 | 0.0% | Gong et al. (2019 |
| Childhood leukemia | C1 (main analysis) | 1.64 | 0.91-2.95 | 6 | 74.5% | Filippini et al. (2015) |
| Childhood leukemia | C2 (high quality primary study [i.e., NOS≥7]) | 1.64 | 0.91-2.95 | 5 | 78.1% | Filippini et al. (2015) |
| Childhood leukemia subtype | A6 (ALL subtype) | 1.09 | 0.88-1.36 | 7 | 51.8% | Filippini et al. (2019) |
| Childhood leukemia subtype | C3 (ALL subtype) | 1.09 | 0.67-1.77 | 2 | 0.0% | Filippini et al. (2015) |
| Childhood leukemia subtype | A7 (AML subtype) | 1.84 | 1.31-2.59 | 5 | 0.0% | Filippini et al. (2019) |
| Childhood leukemia subtype | C4 (AML subtype) | 2.28 | 1.09-4.75 | 2 | 74.2% | Filippini et al. (2015) |
The majority of the risk estimates chosen from the primary studies for the SR-MAs represented high vs. low exposure contrasts; typically, associations are initially evaluated in groups with high levels of exposure compared to groups with low levels of exposure. In addition, the definitions of exposure levels for TRAP pollutants and traffic densities likely varied between the primary studies, and the methods used for exposure assessment (i.e., comparison of high vs. low categories of exposure) are less precise than one based on a standardized pollutant concentration (e.g., per 10 µg/m3). As the review authors did not standardize the exposures, the relative magnitudes of the exposure contrasts were likely distinct between the primary studies; however, the exposure contrasts were relevant within a given study and appropriately pooled in the quantitative syntheses. While, this approach to pooling risk estimates does not permit the direct evaluation of a biological gradient, two of the SR-MAs (Filippini et al. 2019; Gong et al. 2019) investigated the exposure-response relationship of the association. The exposure-response shape of the curve meta-analyses conducted by Filippini et al. (2019) further supported the positive associations observed between childhood leukemia and indicators of TRAP. In particular, Filippini et al. (2019) found no minimal threshold of benzene exposure for an increase in risk in childhood leukemia. Evidence of such a threshold was however apparent for both distance to roadways (one of the three indicators of traffic density evaluated) and NO2. For distance to roadways, there was little association observed with leukemia risk ratio at distances greater than 150 m from the edge of the road, below which a higher risk ratio emerged and increased steeply with decreasing distance. For NO2, there was evidence of an excess risk between 40 and 60 µg/m3, but the review authors noted that the increase was statistically unstable. Of note, the association between disease risk and other indicators of traffic density (i.e., vehicles per day and road density) was small except at the highest exposure levels. While these findings could not be adequately compared to the only SR-MA (Gong et al. 2019) that considered exposure levels (i.e., low, moderate, and high) due to a lack of information (e.g., no details provided on exposure beyond the metrics by which it was measured), pooled risk estimates from Gong et al. (2019) support the exposure-response meta-analysis for the indicators of traffic density only. Notably, a positive association with childhood leukemia was only observed at high levels of traffic density, but no association with risk estimates of similar magnitude was observed at low and moderate exposure levels of traffic density. In contrast, pooled risk estimates for benzene did not progressively increase with exposure levels and only moderate exposure levels to NO2 resulted in a positive association. This absence of a linear relationship at the different exposure levels of the TRAP pollutants was not discussed by Gong et al. (2019).
With the exception of Gong et al. (2019), moderate to substantial heterogeneity was reported in most of the analyses for all three TRAP metrics when all the primary studies were considered. In subgroup analyses, heterogeneity was generally less or absent. The moderate to substantial heterogeneity may be due to methodological differences among the primary studies, including exposure assessment methodologies, distinct inclusion and exclusion criteria, and adjustment for confounders and covariates. Additionally, the range of exposures and magnitude of the exposure contrast were variable between the primary studies and contributed to the heterogeneity. To address this heterogeneity, results from the random-effects meta-analyses were considered most appropriate and all but one SR-MA used this methodology (i.e., Gong et al. [2019] utilized fixed-effects meta-analysis as heterogeneity was not significant in this SR-MA). In addition to conducting random-effects meta-analyses, Carlos-Wallace et al. (2016) also calculated pooled risk estimates using fixed-effects meta-analyses but included the Shore adjustment to account for between-study heterogeneity. The majority of the SR-MAs used the risk estimates that accounted for key confounders (e.g., age, sex, and SES) when the adjusted risk estimates were available from the primary studies, and all but two primary studies had some level of adjustment. Nonetheless, the differences in confounder adjustments between the primary studies are anticipated to reduce the precision of (i.e., result in wider CIs for) the pooled effect estimates. An additional key limitation of the primary studies is the potential introduction of inherent selection bias due to the case-control design of the study.
Only one systematic review (Raaschou-Nielsen and Reynolds, 2006), with a publication date older than all the SR-MAs reviewed above, was identified for this risk assessment. The majority (i.e., 6 out of 9) of the RRs between TRAP exposure (i.e., traffic metrics and traffic-related air pollutants) and childhood leukemia that were reported in the included case-control primary studies indicated positive associations, similar to the findings from the pooled analyses reported in the SR-MAs.
5.1.2 Lung cancer
Three SR-MAs evaluating the potential association between lung cancer and TRAP exposure were identified during the scoping review. Primary studies included in these SR-MAs were mostly cohort studies, with the remainder having a case-control study design. They were mostly conducted in Europe and North America; only a small number of primary studies were conducted in Asia. As such, the results from the SR-MAs were considered relevant to a Canadian assessment, given the general similarities in air pollution mixture, standard of living, healthcare, climate, and so on between Canada, the USA, and European countries. Just over half the primary studies were occupational-based, focusing on professional drivers such as bus, truck, and taxi drivers. The rest of the primary studies considered general populations and ambient exposure to TRAP, based on exposure to TRAP pollutants (e.g., NO2, NOX, and PM) or on traffic metrics (e.g., distance to roadway and traffic density). Primary study quality was assessed in both Tsoi and Tse (2012) and Chen et al. (2015), with Chen et al. (2015) excluding studies on the basis of low quality. Each of the SR-MAs considered primary studies with adjustment for smoking, a key confounder in lung cancer studies. While the majority of the primary studies pooled in Chen et al. (2015) had accounted for smoking, Tsoi and Tse (2012) and Hamra et al. (2015) also performed subgroup analyses limited to studies that included adjustments for smoking to account for this confounder. Additionally, Chen et al. (2015) and Hamra et al. (2015) identified that most primary studies included in the quantitative syntheses had also included adjustments for age, sex, and SES indicators. The SR-MAs included primary studies that assessed lung cancer incidence and mortality, and these outcomes were combined in the quantitative synthesis. The authors may have chosen this approach as lung cancer has a high case-fatality rate and determined it was reasonable to combine the outcomes (Hamra et al. 2014). Furthermore, Chen et al. (2015) identified that the incidence and mortality studies from professional drivers were combined to generate a larger quantitative synthesis, given the overlapping CIs of the pooled risk estimates from the separate meta-analysis.
Overall, the SR-MAs indicated a positive association between TRAP exposure and risk of lung cancer. Forest plots of the pooled risk estimates for TRAP exposure based on ambient exposure and occupation as a professional driver are provided in Figures 5.5 and 5.6, respectively. These forest plots demonstrate the strength and consistency of the relationship in both exposure settings. Figure 5.5 also demonstrates the biological gradient of the relationship based on incremental exposure to NO2 or NOX.

Figure 5.5 - Text description
Figure 5.5 depicts a forest plot of pooled risk estimates from SR-MAs for ambient exposure to TRAP and risk of adult lung cancer based on an increment of 10µg/m3 of NO2 (at the top) or NOx (at the bottom) The x-axis representing pooled estimates and 95% CI ranges from 0.9 to 1.2. The following information is depicted in this figure:
| Health effect | Data marker | Pooled risk estimate | 95% Confidence interval | n | I2 | Reference |
|---|---|---|---|---|---|---|
| NO2 | A1 (main analysis [NOx]) | 1.04 | 1.01-1.08 | 15 | 72.8% | Hamra et al. (2015) |
| NO2 | A2 (adjusted for the indicaed confounders [NO2], smoking) | 1.04 | 1.00-1.08 | 11 | 71.8% | Hamra et al. (2015) |
| NO2 | A3 (adjusted for the indicaed confounders [NO2], SES or income) | 1.04 | 0.98-1.11 | 7 | 68.8% | Hamra et al. (2015) |
| NO2 | A4 (adjusted for the indicaed confounders [NO2], education) | 1.03 | 1.00-1.07 | 8 | 68.2% | Hamra et al. (2015) |
| NO2 | A5 (adjusted for the indicaed confounders [NO2], occupation) | 1.02 | 0.99-1.04 | 8 | 40.9% | Hamra et al. (2015) |
| NO2 | B1 (main analysis [NO2]) | 1.06 | 0.99-1.13 | 5 | 59% | Chen et al. (2015) |
| NOx | A6 (main analysis [NOx]) | 1.03 | 1.01-1.05 | 5 | 33.3% | Hamra et al. (2015) |
| NOx | B2 (main analysis [NOx]) | 1.04 | 1.01-1.07 | 2 | 46% | Chen et al. (2015) |

Figure 5.6 - Text description
Figure 5.6 depicts a forest plot of pooled risk estimates from SR-MAs for exposure to TRAP and risk of adult lung cancer in professional drivers. The x-axis representing pooled estimates and 95% CI ranges from 0.9 to 1.6. The following information is depicted in this figure:
| Data marker | Pooled risk estimate | 95% Confidence interval | n | I2 | Reference |
|---|---|---|---|---|---|
| A1 (main analysis) | 1.22 | 1.14-1.31 | 28 | 65% | Chen et al. (2015) |
| A2 (incidence only) | 1.27 | 1.19-1.36 | 28 | 44% | Chen et al. (2015) |
| A3 (mortality only) | 1.14 | 1.04-1.26 | 11 | 52% | Chen et al. (2015) |
| B1 (main analysis) | 1.21 | 1.10-1.32 | 19 | 68.6% | Tsoi and Tse (2012) |
| B2 (better quality studies) | 1.22 | 1.09-1.36 | 11 | 52.1% | Tsoi and Tse (2012) |
| B3 (adjusted for smoking) | 1.18 | 1.05-1.33 | 13 | 48.0% | Tsoi and Tse (2012) |
| B4 (adjusted for smoking and >10 years of employment) | 1.19 | 1.06-1.34 | NA | NA | Tsoi and Tse (2012) |
| B5 (cohort studies) | 1.19 | 1.07-1.32 | 8 | 79.4% | Tsoi and Tse (2012) |
| B6 (case-control studies) | 1.26 | 1.02-1.56 | 11 | 55.2% | Tsoi and Tse (2012) |
Focusing on population-based studies and ambient exposure to TRAP, from the forest plot (Figure 5.5) the pooled risk estimates from the main analyses and subgroup analyses were all positive and ranged from 1.02-1.06, per increment of 10 µg/m3 of NO2 or NOX. Although only a few of the pooled risk estimates were statistically significant, the remainder were borderline significant. Furthermore, when Hamra et al. (2015) conducted subgroup analysis, the magnitude and associated precision (i.e., 95% CI) of the pooled risk estimates did not deviate from the main analysis when restricting analysis to primary studies that had accounted for smoking or SES. Thus, results from Hamra et al. (2015) indicate that the main pooled estimate was robust to these confounders, as the primary studies that did not account for these confounders did not overly influence the main analysis. Additionally, for North America, Hamra et al. (2015) reported a pooled risk estimate of 1.07 (95% CI: 1.01-1.14) per 10 µg/m3 NO2, which of the available analyses, is most generalizable to represent the risk for the Canadian population. Although the SR-MAs considered both cohort and case-control studies, the majority had a cohort design, providing supporting evidence of a temporal association between exposure to TRAP and lung cancer. For the population-based studies, heterogeneity in the pooled risk estimate was moderate to substantial, which may be attributed to differences in study design, study population, exposure assessment methodologies, case ascertainment methodologies, and confounder and covariate adjustments in the primary studies, as well as differences in inclusion or exclusion criteria in the SR-MAs. Both Hamra et al. (2015) and Chen et al. (2015) employed random-effects models to address the heterogeneity in their analyses. Additionally, both SR-MAs identified that the majority of the primary studies accounted for key confounders such as age, sex, SES indicators and smoking. Hamra et al. (2015) also observed publication bias; Chen et al. (2015) did not include an evaluation of publication bias. Overall, the SR-MAs provided strong epidemiological evidence of a positive association between ambient exposure to TRAP and risk of lung cancer in adults.
Compared to the population-based studies, a stronger association for lung cancer was observed from the occupational studies of professional drivers (Figure 5.6). The pooled risk estimates ranged from 1.14-1.27 and each was statistically significant. Elevated risk estimates from occupational studies are plausible, as in these settings, exposures to TRAP are anticipated to be more intense, typically occurring for longer durations and possibly at higher concentrations compared to the general population. This limits the generalizability of the risks determined from these studies to the general population who experience exposure to ambient levels of TRAP. Additionally, the occupational studies predominantly included only male subjects, further limiting their generalizability. Tsoi and Tse (2012) also reported that a longer employment duration was associated with an elevated risk of lung cancer, indicating an exposure-response relationship. However, each of the SR-MAs was limited by the lack of quantification or measurement of TRAP exposure in the primary studies. Exposure assessment was frequently limited to those who had ever been employed as a professional driver irrespective of the duration of their employment. Additionally, although most of the occupational-based primary studies addressed some confounders (e.g., age and smoking), there was inconsistent accounting for other key confounders such as asbestos exposure or other known lung carcinogens, employment duration, and SES. The heterogeneity was moderate to substantial in these pooled risk estimates, which may be attributable to differences in outcome ascertainment, occupations considered, exposure distributions, study design, and confounders and covariates considered in the primary studies, as well as different inclusion and exclusion criteria by the review authors. Overall, the pooled analysis of occupational-based studies indicates an increased risk of lung cancer associated with employment as a professional driver. However, the lack of TRAP exposure quantification, the greater intensity of the TRAP exposure scenarios, and unaddressed confounding limit the applicability and generalizability of this increased risk to the general public and exposure to TRAP at ambient levels.
5.1.3 Breast Cancer
Only one publication evaluating risk of breast cancer was identified for inclusion in the umbrella review during the literature search, a systematic review by White et al. (2018). The primary articles considered were from North America and Europe, as such, the results were considered relevant to a Canadian assessment, given general similarities in air pollution mixture, standard of living, health care, climate, and so on between Canada, the USA, and European countries. The review authors identified consistent evidence of an association between breast cancer and TRAP exposure, when exposure was estimated from models or satellite-derived estimates to quantify NO2, NOX, PM2.5, or B[a]P as markers of TRAP, with these studies also indicating a biological gradient. The risk estimates were mostly positive, and most of these significant or borderline significant. In particular, three case-control studies conducted in Canada each reported a positive and borderline significant association for NO2 and breast cancer ranging 1.08–1.31 per increment of NO2. In contrast, there was no evidence of an association when traffic metrics, such as proximity to roadway and traffic density, were employed to assess exposure. This systematic review provides relevant evidence for an association between TRAP exposure and risk of breast cancer. However, as a quantitative synthesis was not performed by the authors, the magnitude of the association that could be determined from a pooled estimate is unknown.
5.2 Biological evidence from systematic reviews and other assessments
There is substantial evidence in the literature demonstrating genotoxic and mutagenic effects of TRAP or its components in studies of humans, experimental animals, and in vitro systems. Together these studies provide biological plausibility of causal association between TRAP exposure and cancer. Human molecular epidemiology studies have provided consistent evidence of genotoxic or cytogenic effects in people working in or living near environments with elevated levels of TRAP, with some evidence of a biological gradient of exposure-response. Components of TRAP, including DE, GE, PM, and benzene, have been extensively evaluated for genotoxic, mutagenic, and carcinogenic impacts. IARC has classified DE, PM in outdoor air pollution (of which traffic is an important source in urban environments), and benzene as Group 1 human carcinogens, based on an evaluation of sufficient evidence in humans, experimental animals, and mechanistic data. Due to limitations and inadequacy in the literature database, GE has been classified as a Group 2B possible human carcinogen. From the comprehensive assessments by Health Canada, US EPA, and HEI, the genotoxic and mutagenic properties of TRAP components have been well demonstrated. Some components of TRAP have been demonstrated to be carcinogenic in experimental animals, though the level and strength of evidence is variable between the components of TRAP, with a larger body of evidence for DE, PM, and benzene, while the biological evidence for GE and NO2 is limited.
Multiple potential mechanisms of action for TRAP-induced carcinogenicity have been developed based on the biological evidence. TRAP may act through a genotoxic mechanism, either from direct DNA damage or indirectly through oxidative stress leading to DNA damage. The oxidative stress may result from generation of ROS by TRAP and/or activation of an inflammatory response by TRAP. The resultant DNA damage, including mutations and cytogenic effects may lead to cancer development. Additionally, TRAP may induce epigenetic changes, which alter gene expression, resulting in increased tumour promotion or reduced tumour suppression. Also, benzene is specifically associated with development of haematological cancers, which may be mediated via DNA damage to bone marrow and immunosuppression.
5.3 Determination of causality
5.3.1 Childhood leukemia
Based on the following lines of evidence— (i) the positive association between TRAP exposure and childhood leukemia determined in each of the six SR-MAs evaluated (Boothe et al. 2014; Sun et al. 2014; Filippini et al. 2015, 2019; Carlos-Wallace et al. 2016; Gong et al. 2019), with most of the pooled risk estimates being statistically or borderline significant, and a consistent and stronger association identified for postnatal exposure to TRAP from three SR-MAs (Boothe et al. 2014; Filippini et al. 2019, 2015). (ii) There is some evidence of a biological gradient from the shape of the curve analysis conducted by Filippini et al. (2019), with some support from the exposure-response evaluation by Gong et al. (2019). (iii) While the epidemiological evidence has some limitations in establishing temporality, as it was derived from case-control studies, an exposure window from birth onwards was considered thus supporting temporality of the association. And, (iv) the supporting biological evidence demonstrating genotoxic and mutagenic effects of TRAP or its components in studies of humans, experimental animals, and in vitro systems from: (a) the systematic review conducted by DeMarini (2013); (b) comprehensive risk assessments by Health Canada (2013, 2016a, 2016b, 2017), US EPA (2016, 2019), and HEI (2010); and (c) evaluations of carcinogenicity by IARC (2014, 2016, 2018). Overall, it is concluded that there is sufficient evidence that the relationship between TRAP exposure and childhood leukemia is likely to be causal.
5.3.2 Lung cancer
Based on the following lines of evidence—(i) the significant and borderline significant positive associations between TRAP exposure at ambient levels and lung cancer in adults from the SR-MA by Hamra et al. (2015), that was based mainly on cohort studies including adjustments for smoking (a key confounder for lung cancer) and supported by the SR-MA by Chen et al. (2015). (ii) There are consistent significant positive associations indicating a stronger relationship between occupational exposure to TRAP and lung cancer from the SR-MAs by Tsoi and Tse (2012) and Chen et al. (2015); however, the studies based on occupational exposures are limited in establishing a risk for the general public given the differences in integrated exposure (i.e., duration and frequency in TRAP microenvironments), and the primary studies inconsistently accounted for confounders. And, (iii) the supporting biological evidence demonstrating genotoxic and mutagenic effects of TRAP or its components in studies of humans, experimental animals, and in vitro systems from: (a) the systematic reviews conducted by DeMarini (2013) and Gromadzinska and Wasowicz (2019); (b) comprehensive risk assessments by Health Canada (2013, 2016a, 2016b, 2017), US EPA (2016, 2019), and HEI (2010); and (c) evaluations of carcinogenicity by IARC (2014, 2016, 2018). Overall, it is concluded that there is sufficient evidence of a causal relationship between TRAP exposure and lung cancer in adults.
5.3.3 Breast cancer
Based on the following lines of evidence—(i) the positive associations between breast cancer in adults and TRAP exposure from the systematic review by White et al. (2018), with consistent results when TRAP exposure was based on pollutant concentrations also indicating a biological gradient in the relationship; however, no quantitative synthesis was conducted to ascertain the strength and consistency of the association. And, (ii) the supporting biological evidence demonstrating genotoxic and mutagenic effects of TRAP or its components in studies of humans, experimental animals, and in vitro systems from: (a) the systematic review conducted by DeMarini (2013); (b) comprehensive risk assessments by Health Canada (2013, 2016a, 2016b, 2017), US EPA (2016, 2019), and HEI (2010); and (c) evaluations of carcinogenicity by IARC (2014, 2016, 2018). Overall, it is concluded that the evidence is suggestive of, but not sufficient to infer, a causal relationship between TRAP exposure and breast cancer in adults.
Chapter 6: Conclusion
Using an umbrella review approach, this risk assessment evaluated the association between long-term exposure to TRAP and childhood leukemia as well as lung cancer and breast cancer in adults. These associations were assessed along with relevant biological evidence gathered from systematic reviews on TRAP and a review of existing assessment documents for TRAP or its components, as part of a weight of evidence approach to determine the causal role of long-term TRAP exposure in the health endpoint of childhood leukemia, lung cancer in adults, and breast cancer in adults.
Based on the overall weight of evidence, it is concluded that:
- there is sufficient evidence that the relationship between TRAP exposure and childhood leukemia is likely to be causal;
- there is sufficient evidence of a causal relationship between TRAP exposure and lung cancer in adults;
- the evidence is suggestive of, but not sufficient to infer, a causal relationship between TRAP exposure and breast cancer in adults.
Key uncertainties and gaps
The conclusions of this risk assessment were formed in consideration of the epidemiological and biological literature evaluating the health effects associated with exposure to TRAP pollutants. For the cancer endpoints considered in this assessment, the scientific evidence was mainly based on various markers of TRAP exposure including NO2, benzene, traffic density, and employment as a professional driver. Although these markers are used to assess or quantify TRAP exposure, a definitive causative agent for the health impacts was not identified from the studies. Given the expected high degree of correlation between the individual TRAP components, further studies and use of multi-pollutant models would be required to identify the causative agent or agents within the TRAP mixture responsible for the health effects. Notably, the TRAP mixture contains many constituents known to have genotoxic and/or carcinogenic properties.
The scoping review and literature search update identified SR-MAs and systematic reviews based on a substantial body of primary literature. Despite the size of the evidence base, key areas of uncertainty remain regarding the association between TRAP exposure and cancer, which are discussed below.
For the evaluation of childhood leukemia, the epidemiological evidence was based on six SR-MAs (published 2014-2019) and one systematic review that was published several years previous to any of the quantitative syntheses. Given the similarity in research question, the six SR-MAs had a high degree of overlap in the primary studies considered. However, different approaches were used by the review authors to conduct the statistical analyses, including random-effects models, fixed-effects models, and fixed-effect models with Shore adjustment to address between-study heterogeneity. Although varied approaches were taken for the exposure assessments and statistical analyses, the SR-MAs were consistent in their findings, thus giving strength to the conclusions of this umbrella review. A key limitation in the literature database for the association between TRAP exposure and childhood leukemia is that only two of the studies had a cohort design. The primary literature considered by the review articles was mostly based on case-control studies. Although potential TRAP exposure from birth or even prenatal periods and onwards was considered, the evidence has some limitations in establishing temporality. Although some potential confounders (e.g., age, gender, and SES) were addressed in the majority of the SR-MAs, the confounders taken into consideration varied in number and specification between the primary studies and many primary studies did not adjust for smoking. Additionally, there were limited evaluations of biological gradient from the epidemiological literature and only one SR-MA (Filippini et al. 2019) conducted a shape of the curve analysis to evaluate exposure-response. In many of the primary studies, categorical variables were used to assess exposure to TRAP (i.e., high vs. low exposures with no inter-study standardization of the exposure contrast) resulting in variability in the definitions of the exposure levels between primary studies and reduced precision in the pooled estimates. Alternatively, exposure assessments that quantify exposure to TRAP as continuous variables (i.e., incremental increases in pollutant concentration) are preferable to better identify and describe the exposure-response relationship. Another limitation in the literature database is that most of the primary studies estimated TRAP exposures at the residential address; only a few considered the mobility of the children and/or residential address changes. The literature database indicates that the postnatal exposure to TRAP is associated with an increased risk of childhood leukemia. Further studies would be required for further refinement of the susceptible period or periods from infancy through adolescence. Additional studies assessing the leukemia subtypes individually would also be valuable to further elucidate the association with TRAP exposure given the variability in etiology, disease progression, and survival of the subtypes.
For lung cancer, the literature database was based on evaluations of ambient exposure or occupational exposure to TRAP. For ambient exposure, the majority of the primary studies had a cohort design, though some case-control studies were included in the quantitative synthesis. However, the case-control studies lack temporal association, and combining of the study design types by the review authors may have been a source of heterogeneity. Additional investigation and publication of results (regardless of direction or magnitude of association) would be required to confirm and address this potential bias. In this risk assessment, the analyses of occupational exposure to TRAP served to support the evaluations based on ambient exposures, due to inherent limitations in the primary studies. The occupational studies themselves were limited by lack of generalizability, as the exposure duration and frequency are anticipated to be greater than experienced by the general public, and the studies almost exclusively considered male subjects. Additionally, the occupational studies were limited by a lack of exposure quantifications and incomplete accounting for confounders in some instances.
For breast cancer, although the association with TRAP exposure is a growing area of epidemiological research, the literature database included only one systematic review of 12 primary articles, and did not include a quantitative synthesis. This lack of quantitative syntheses in the literature limited the application of the umbrella-review approach to evaluate the association and determine the causal relationship. Furthermore, additional research and SR-MAs of breast cancer and other cancer types would be beneficial to better characterize and understand the association between TRAP exposure and cancer development.
The epidemiological evidence in this risk assessment was evaluated using an umbrella review approach, which although providing several advantages has inherent limitations. As the basis of evaluation was published reviews, any primary literature published after the most recent review would not have been captured. The study of the health effects of air pollution is an active field of research, and there may be a number of recent primary studies that have not been considered in the development of the conclusions. However, for this assessment, the most recent primary articles included in the reviews were published in 2018. Additionally, any errors made by the review authors when synthesizing the primary literature would be incorporated into the umbrella review. This potential source of error is limited by considering only peer-reviewed publications in the umbrella review, and also that there is some level of overlap in the primary literature considered in the review articles. Although this overlap of primary literature constitutes a strength of umbrella review, as it aids in determining whether systematic reviews addressing similar questions independently made similar observations and reached generally the same conclusions, the overlap also introduces a potential bias from the inclusion of the same primary studies in multiple reviews, leading to a potential over-representation of a given study or studies. This potential bias is presented in Appendix C, indicating that there was some level of overlap between the publications considered. For any umbrella review, overlap of primary studies is anticipated, as the review articles have addressed similar or closely related research questions. Additionally, as an umbrella review-approach focuses on SRs and SR-MAs, this risk assessment was limited to childhood leukemia, lung cancer, and breast cancer. This does not preclude any associations between TRAP exposure and other cancer types, which were not evaluated in any of the SRs or SR-MAs retrieved, and as such were not included in this risk assessment.
For this assessment, the biological evidence was also based on an umbrella review approach and on a review of existing assessments by Health Canada, the HEI, the US EPA, and IARC. The primary literature included in the systematic review was published in 2018 or earlier, and the other assessments were published in 2010-2019. A detailed review of the mechanistic literature published since the completion of these assessments or publication of the systematic reviews was not conducted. As such, the mechanistic understanding of how TRAP exposure can lead to carcinogenesis may be more developed than described in this assessment. From the biological evidence reviewed for this risk assessment, a few potential mechanisms of action for TRAP-induced carcinogenicity have been proposed. Further research into the mechanisms of action would help to identify the component or components of TRAP that are the causative agent or agents. This information could be useful to inform programs or policies that would reduce or mitigate exposure to one or more specific pollutants.
References
- Aromataris E, Fernandez R, Godfrey CM, Holly C, Khalil H, Tungpunkom P. Summarizing systematic reviews: Methodological development, conduct and reporting of an umbrella review approach. Int J Evid Based Healthc 2015;13(3):132–40.
- Boothe VL, Boehmer TK, Wendel AM, Yip FY. Residential traffic exposure and childhood leukemia: A systematic review and meta-analysis. Am J Prev Med 2014;46(4):413-22.
- Boothe VL, Shendell DG. Potential health effects associated with residential proximity to freeways and primary roads: Review of scientific literature, 1999-2006. J Environ Health 2008;70(8):33–41,55–6.
- Bradford Hill A. The environment and disease: Association or causation? Proc R Soc Med 1965;58(5):295–300.
- Brauer M, Reynolds C, Hystad P. Traffic-related air pollution and health in Canada. CMAJ 2013;185(18):1557–8.
- Brugge D, Durant JL, Rioux C. Near-highway pollutants in motor vehicle exhaust: A review of epidemiologic evidence of cardiac and pulmonary health risks. Environ Health 2007;6:23.
- Canadian Cancer Society. Childhood cancer statistics. Canadian Cancer Society, 2021a. Available online at: https://www.cancer.ca/en/cancer-information/cancer-101/childhood-cancer-statistics/
- Canadian Cancer Society. Risk factors for childhood leukemia. Canadian Cancer Society, 2021b. Available online at: https://www.cancer.ca/en/cancer-information/cancer-type/leukemia-childhood/risks/
- Canadian Cancer Society. What is lung cancer? Canadian Cancer Society, 2021c. Available online at: https://www.cancer.ca/en/cancer-information/cancer-type/lung/lung-cancer/
- Canadian Cancer Society. Risk factors for lung cancer. Canadian Cancer Society, 2021d. Available online at: https://www.cancer.ca/en/cancer-information/cancer-type/lung/risks
- Canadian Cancer Society. Breast cancer statistics. Canadian Cancer Society, 2021e. Available online at: https://www.cancer.ca/en/cancer-information/cancer-type/breast/statistics/
- Canadian Cancer Society. Breast cancer statistics. Canadian Cancer Society, 2021f. Available online at: https://www.cancer.ca/en/cancer-information/cancer-type/breast/risks/
- Carlos-Wallace FM, Zhang L, Smith MT, Rader G, Steinmaus C. Parental, in utero, and early-life exposure to benzene and the risk of childhood leukemia: a meta-analysis. Am J of Epidemiol 2016;183(1):1-14.
- CCME. Canada-wide Standard for Benzene 2010 Final Report. Winnipeg, MB, Canada: CCME; 2012. https://www.ccme.ca/files/Resources/air/benzene/2010_benzene_rpt_final_e.pdf
- Chen G, Wan X, Yang G, Zou X. Traffic-related air pollution and lung cancer: A meta-analysis. Thorac Cancer 2015;6(3):307-18.
- Crosignani P, Tittarelli A, Borgini A, Codazzi T, Rovelli A, Porro E, Contiero P, Bianchi N, Tagliabue G, Fissi R, Rossitto F, Berrino F. Childhood leukemia and road traffic: a population-based case-control study. Int J Cancer 2004;108(4):596-9.
- Demarini DM. Genotoxicity biomarkers associated with exposure to traffic and near-road atmospheres: A review. Mutagenesis 2013;28(5):485-505.
- Filippini T, Hatch EE, Rothman KJ, Heck JE, Park AS, Crippa A, Orsini N, Vinceti M. Association between outdoor air pollution and childhood leukemia: A systematic review and dose-response meta-analysis. Environ Health Perspect 2019;127(4):46002.
- Filippini T, Heck JE, Malagoli C, Giovane CD, Vinceti M. A review and meta-analysis of outdoor air pollution and risk of childhood leukemia. J Environ Sci Health C Environ Carcinog Ecotoxicol Rev 2015;33(1):36-66.
- GBD 2019 Risk Factors Collaborators. Global burden of 87 risk factors in 204 countries and territories, 1990-2019: a systematic analysis for the Global Burden of Disease Study 2019. Lancet 2020;396(10258):1223-1249.
- Gong Z-H, Li J, Wang X-Y, Yu Y, Ren M-M, Zhou J. A Meta-analysis of traffic-related air pollution and risk of childhood leukemia. J Pediatr Hematol Oncol 2019;41(4):267-74.
- Gromadzinska J, Wasowicz W. Health risk in road transport workers. Part I. Occupational exposure to chemicals, biomarkers of effect. Int J Occup Med Environ Health 2019;32(3):267-80.
- Hamra GB, Laden F, Cohen AJ, Raaschou-Nielsen O, Brauer M, Loomis D. Lung cancer and exposure to nitrogen dioxide and traffic: A systematic review and meta-analysis. Environ Health Perspect 2015;123(11):1107-12.
- Hamra GB, Guha N, Cohen A, Laden F, Raaschou-Nielsen O, Samet JM, Vineis P, Forastiere F, Saldiva P, Yorifuji T, Loomis D. Outdoor particulate matter exposure and lung cancer: a systematic review and meta-analysis. Environ Health Perspect 2014;122(9):906-11. Erratum in: Environ Health Perspect 2014;122(9):A236.
- Health Canada. Traffic-related air pollution: asthma, allergies, and lung function. Ottawa, ON, Canada: Health Canada; 2020. http://publications.gc.ca/site/eng/9.887339/publication.html
- Health Canada. Health impacts of air pollution in Canada: Estimates of morbidity and premature mortality outcomes, 2019 report. Ottawa, ON, Canada: Health Canada; 2019. http://publications.gc.ca/site/eng/9.874080/publication.html.
- Health Canada. Human health risk assessment for gasoline exhaust. Ottawa, ON, Canada: Health Canada; 2017. http://publications.gc.ca/collections/collection_2017/sc-hc/H144-52-2017-eng.pdf.
- Health Canada. Human health risk assessment for diesel exhaust. Ottawa, ON, Canada: Health Canada; 2016a. http://publications.gc.ca/collections/collection_2016/sc-hc/H129-60-2016-eng.pdf.
- Health Canada. Human health risk assessment for ambient nitrogen dioxide. Ottawa, ON, Canada: Health Canada; 2016b. http://publications.gc.ca/collections/collection_2016/sc-hc/H114-31-2016-eng.pdf.
- Health Canada. Canadian smog science assessment, volume 2: Health effects. Ottawa, ON, Canada: Health Canada; 2013. http://publications.gc.ca/collections/collection_2014/sc-hc/En88-5-2-2013-eng.pdf.
- HEI Panel on the Health Effects of Traffic-Related Air Pollution. Traffic-related air pollution: A critical review of the literature on emissions, exposure, and health effects. HEI Special Report 17. Boston, MA: Health Effects Institute; 2010.
- Higgins JPT, Thomas J, Chandler J, Cumpston M, Li T, Page MJ, Welch VA (editors). Cochrane handbook for systematic reviews of interventions version 6.0 (updated July 2019). Cochrane, 2019. Available online at: www.training.cochrane.org/handbook.
- IARC (2018). Benzene. IARC Monographs on the Evaluation of Carcinogenic Risks to Humans, Vol. 120. International Agency for Research on Cancer, Lyon, France. 309 pp. Available online at: https://publications.iarc.fr/Book-And-Report-Series/Iarc-Monographs-On-The-Identification-Of-Carcinogenic-Hazards-To-Humans/Benzene-2018
- IARC (2016). Outdoor air pollution. IARC Monographs on the Evaluation of Carcinogenic Risks to Humans, Vol. 109. International Agency for Research on Cancer, Lyon, France. 454 pp. Available online at: https://publications.iarc.fr/Book-And-Report-Series/Iarc-Monographs-On-The-Identification-Of-Carcinogenic-Hazards-To-Humans/Outdoor-Air-Pollution-2015
- IARC (2014). Diesel and gasoline engine exhausts and some nitroarenes. IARC Monographs on the Evaluation of Carcinogenic Risks to Humans, Vol. 105. International Agency for Research on Cancer, Lyon, France. 714 pp. Available online at: https://publications.iarc.fr/Book-And-Report-Series/Iarc-Monographs-On-The-Identification-Of-Carcinogenic-Hazards-To-Humans/Diesel-And-Gasoline-Engine-Exhausts-And-Some-Nitroarenes-2013
- IHME (2019). Air Pollution – level 2 risk. Institute for Health Metrics and Evaluation. Available online at: http://www.healthdata.org/results/gbd_summaries/2019/air-pollution-level-2-risk
- Langholz B, Ebi KL, Thomas DC, Peters JM, London SJ. Traffic density and the risk of childhood leukemia in a Los Angeles case-control study. Ann Epidemiol 2002;12(7):482-7.
- Khreis H, Nieuwenhuijsen MJ. Traffic-related air pollution and childhood asthma: Recent advances and remaining gaps in the exposure assessment methods. Int J Environ Res Public Health 2017;14(3):312.
- Leng J, Peruluswami P, Bari S, Gaur S, Radparvar F, Parvez F, Chen Y, Flores C, Gany F. South Asian health: inflammation, infection, exposure, and the human microbiome. J Immigr Minor Health 2019;21(Suppl 1):26-36.
- Matz CJ, Stieb DM, Egyed M, Brion O, Johnson M. Evaluation of daily time spent in transportation and traffic-influenced microenvironments by urban Canadians. Air Qual Atmos Health 2018;11(2):209–20.
- Matz CJ, Egyed M, Hocking R, Seenundun S, Charman N, Edmonds N. Human health effects of traffic-related air pollution (TRAP): A scoping review protocol. Syst Rev 2019;8:223.
- PHAC. Lung Cancer. Public Health Agency of Canada, 2019a. Available online at: https://www.canada.ca/en/public-health/services/chronic-diseases/cancer/lung-cancer.html
- PHAC. Breast Cancer. Public Health Agency of Canada, 2019b. Available online at: https://www.canada.ca/en/public-health/services/chronic-diseases/cancer/breast-cancer.html
- Pyatt D, Hays S. A review of the potential association between childhood leukemia and benzene. Chem Biol Interact 2010;184(1-2):151-64.
- Raaschou-Nielsen O, Reynolds P. Air pollution and childhood cancer: A review of the epidemiological literature. Int J Cancer 2006;118(12):2920-9.
- Raaschou-Nielsen O, Hertel O, Thomsen BL, Olsen JH. Air pollution from traffic at the residence of children with cancer. Am J Epidemiol 2001;153(5):433-43.
- Sahay D, Terry MB, Miller R. Is breast cancer a result of epigenetic responses to traffic-related air pollution? A review of the latest evidence. Epigenomics 2019;11(6):701-14.
- Shea BJ, Reeves BC, Wells G, Thuku M, Hamel C, Moran J, Moher D, Tugwell P, Welch V, Kristjansson E, Henry DA. AMSTAR 2: A critical appraisal tool for systematic reviews that include randomised or non-randomised studies of healthcare interventions, or both. BMJ 2017;358:j4008.
- Shore RE, Gardner MJ, Pannett B. Ethylene oxide: an assessment of the epidemiological evidence on carcinogenicity. Br J Ind Med. 1993;50(11):971–997.
- Sun X-X, Zhang S-S, Ma X-L. No association between traffic density and risk of childhood leukemia: a meta-analysis. Asian Pac J Cancer Prev 2014;15(13):5229-32.
- Tsoi CT, Tse LA. Professional drivers and lung cancer: A systematic review and meta-analysis. Occup Environ Med 2012;69(11):831-6.
- US EPA. Integrated Science Assessment for Particulate Matter (final report, 2019). EPA/600/R-19/188. Washington, DC: United States Environmental Protection Agency; 2019. http://ofmpub.epa.gov/eims/eimscomm.getfile?p_download_id=539935.
- US EPA. Preamble to the Integrated Science Assessments (ISA). EPA/600/R-15/067. Washington, DC: United States Environmental Protection Agency; 2015.
- US EPA. Integrated Science Assessment for oxides of nitrogen – Health criteria (final report, 2016). EPA/600/R-15/068. Washington, DC: United States Environmental Protection Agency; 2016. http://ofmpub.epa.gov/eims/eimscomm.getfile?p_download_id=526855.
- von Elm E, Altman DG, Egger M, Pocock SJ, Gøtzsche PC, Vandenbroucke, JP, STROBE Initiative. The Strengthening the Reporting of Observational Studies in Epidemiology (STROBE) statement: guidelines for reporting observational studies. J Clin Epidemiol 2008, 61(4), 344–349.
- White AJ, Bradshaw PT, Hamra GB. Air pollution and breast cancer: a review. Curr Epidemiol Rep 2018;5(2):92-100.
Appendices
Appendix A. Refined search strategy for literature update
Embase
Database(s): Embase 1974 to September 25, 2019
Search strategy:
| # | Searches | Results |
|---|---|---|
| 1 | exhaust gas/ | 18630 |
| 2 | exp motor vehicle/ | 38851 |
| 3 | car driving/ | 14113 |
| 4 | exp traffic/ | 130515 |
| 5 | "traffic and transport"/ | 13988 |
| 6 | nitrogen oxide/ | 10419 |
| 7 | nitrogen dioxide/ | 11583 |
| 8 | carbon moNOXide/ | 35153 |
| 9 | carbon dioxide/ | 89053 |
| 10 | ozone/ | 26887 |
| 11 | volatile organic compound/ | 16854 |
| 12 | black carbon/ | 2337 |
| 13 | particulate matter/ | 40230 |
| 14 | exp polycyclic aromatic hydrocarbon/ | 72758 |
| 15 | exp air pollution/ | 147415 |
| 16 | ((distanc* or proximit* or close*) adj3 (traffic* or road* or highway* or transitway*)).tw,kw. | 2224 |
| 17 | traffic exposure*.tw,kw. | 344 |
| 18 | fume/ | 2038 |
| 19 | ((automobile* or automotive* or autocar* or autobus* or motor* or vehic* or taxi* or diesel* or gasoline* or engine? or car or cars or truck* or bus or buses or bussing or highway* or high way* or motorway* or motor way or road* or parkade* or parking* or carpark* or car park* or traffic*) adj4 (exhaust? or emission* or pollut* or vapor* or vapour* or volatile* or effluvia* or smoke* or fume? or haze? or smog* or nitrogen oxide* or NOX or 11104-93-1 or carbon moNOXide* or 630-08-0 or carbon dioxide or 124-38-9 or volatile organic compounds or VOC or VOCs or Peroxyacetyl nitrate or 2278-22-0 or polycyclic aromatic hydrocarbon* or arene* or PAH or polyaromatic hydrocarbon* or polynuclear aromatic hydrocarbon*)).tw,kw. | 20438 |
| 20 | 1 or ((or/2-5) and (or/6-18)) or 19 [TRAP] | 32802 |
| 21 | exp health/ | 656611 |
| 22 | public health/ | 166553 |
| 23 | "physical disease by etiology and pathogenesis"/ or acute disease/ or exp aplasia/ or exp ascites/ or exp atrophy/ or exp bleeding/ or exp calcification/ or exp channelopathy/ or chemically induced disorder/ or exp chronic disease/ or exp complication/ or critical illness/ or exp cyst/ or exp deformity/ or exp degeneration/ or exp diverticulosis/ or exp dysplasia/ or exp dystrophy/ or exp ectopic tissue/ or exp edema/ or exp effusion/ or exp emphysema/ or endemic disease/ or environmental disease/ or epidemic/ or exp fibrosis/ or exp fistula/ or exp "genetic and familial disorders"/ or exp healing impairment/ or exp hernia/ or exp hyperplasia/ or exp hypertrophy/ or exp hypoplasia/ or exp hypotrophy/ or exp iatrogenic disease/ or idiopathic disease/ or exp infection/ or exp inflammation/ or exp ischemia/ or exp "lesions and defects"/ or exp malnutrition/ or exp metaplasia/ or exp necrosis/ or neglected disease/ or neointima/ or exp neoplasm/ or exp "neovascularization (pathology)"/ or non communicable disease/ or exp occupational disease/ or pandemic/ or exp pseudotumor/ or rare disease/ or recurrent disease/ or relapse/ or reversal reaction/ or exp sclerosis/ or exp "stenosis, occlusion and obstruction"/ or exp stone formation/ or exp storage disease/ or exp swelling/ or syndrome/ or systemic disease/ or terminal disease/ or exp thromboembolism/ or exp torsion/ or exp "toxicity and intoxication"/ or exp ulcer/ | 13520378 |
| 24 | exp mental disease/ | 2080019 |
| 25 | physical disease/ or exp physical disease by anatomical structure/ or exp physical disease by body function/ or exp "physical disease by composition of body fluids, excreta and secretions"/ or exp physical disease by developmental age/ | 16871752 |
| 26 | diseases/ | 145567 |
| 27 | exp mortality/ | 1016331 |
| 28 | mortality risk/ | 15114 |
| 29 | exp epidemiology/ | 3237378 |
| 30 | exp epidemiological monitoring/ | 1847 |
| 31 | exp epidemiological data/ | 3279540 |
| 32 | environmental health/ | 29975 |
| 33 | genotoxicity/ | 32248 |
| 34 | genetic damage/ | 2166 |
| 35 | mutagenic activity/ | 2573 |
| 36 | mutagenicity/ | 18722 |
| 37 | exp postnatal development/ | 68731 |
| 38 | exp toxicity/ | 659919 |
| 39 | exp biological functions/ | 22276304 |
| 40 | environmental health/ | 29975 |
| 41 | environmental stress/ | 8931 |
| 42 | "quality of life"/ | 442386 |
| 43 | hospitalization/ or hospital admission/ | 506557 |
| 44 | (IQR or interquartile range* or inter quartile range*).tw,kw. | 120683 |
| 45 | ((population* or human* or citizen* or nation* or public or communit* or individual* or people* or person* or man or men or woman* or women* or child* or infan* or toddler* or newborn* or neonat* or baby or babies or adolecen* or teenage* or preteen* or preadolescen* or premenarch* or pre menarch* or adult* or elderly or seniors) adj3 (health* or disease*)).tw,kw. | 1347360 |
| 46 | or/21-45 [Health Effects] | 28558492 |
| 47 | limit 46 to ((english or french) and yr="2000 -Current") | 18118554 |
| 48 | 20 and 47 [TRAP + Human Health] | 16072 |
| 49 | limit 48 to human | 8395 |
| 50 | (human* or person* or people* or man or men? or wom?n or child* or infan* or toddler* or newborn* or neonat* or baby or babies or adolecen* or teenage* or preteen* or preadolescen* or premenarch* or pre menarch* or adult* or elderly or seniors).tw,kw. | 9087645 |
| 51 | exp human/ | 20203276 |
| 52 | 48 and (50 or 51) | 9901 |
| 53 | nonhuman/ | 5965543 |
| 54 | 48 not 53 | 13378 |
| 55 | 49 or 52 or 54 | 14540 |
| 56 | limit 55 to conference abstract status | 1851 |
| 57 | 55 not 56 | 12689 |
| 58 | 57 and (2000* or 2001* or 2002* or 2003* or 2004* or 2005* or 2006* or 2007* or 2008* or 2009* or 2010* or 2011* or 2012* or 2013* or 2014* or 2015* or 2016* or 2017* or "201801" or "201802" or "201803").dd,dc. [Previously Retrieved Results] | 10854 |
| 59 | exp malignant neoplasm/ | 3260320 |
| 60 | exp "oncogenesis and malignant transformation"/ | 847628 |
| 61 | exp "precancer and cancer-in-situ"/ | 83623 |
| 62 | exp oncological parameters/ | 1259931 |
| 63 | exp cancer diagnosis/ | 561504 |
| 64 | cancer registry/ or carcinogen testing/ | 35180 |
| 65 | (adamantinoma* or adenoacanthoma* or adenocanthoma* or adenocarcinoma* or adenomatos* or adenomyoepithelioma* or adenomyoma* or adenosarcoma* or aesthesioneuroblastoma* or ameloblastoma* or androblastoma* or angioblastoma* or angioendothelioma* or angiofibrosarcoma* or angiosarcoma* or argentaffinoma* or arrhenoblastoma* or astroblastoma* or astrocytoma* or astroglioma* or baltoma or basiloma* or basalioma* or blastoma? or Buschke-Lowenstein or cancer* or carcinogen* or carcinoid? or carcinoma* or carcinosarcoma* or chloroma* or cholangiocarcinoma* or cholangiohepatoma* or cholangiosarcoma* or chondroblastoma* or chondrosarcoma* or chorioadenoma* or chorioangioma or choriocarcinoma* or chorioepithelioma* or chorionepithelioma* or comedocarcinoma* or cystadenocarcinoma* or cystosarcoma* or dermatofibrosarcoma* or dictyoma* or dysgerminoma* or ectomesenchymoma* or ependymoblastoma* or erythroleukaemia* or erythroleukemia* or erythroplakia* or esthesioneuroblastoma* or esthesioneuroepithelioma* or fibroadenosarcoma* or fibrochondrosarcoma* or fibroepithelioma* or fibroliposarcoma* or fibrosarcoma* or fibroxanthoma* or fibroxanthosarcoma* or ganglioblastoma* or ganglioneuroblastoma* or glioblastoma* or gliomatos* or gliosarcoma* or haemangioblastoma* or haemangiopericytoma* or haemangiosarcoma* or hemangioblastoma* or hemangioendothelioma* or hemangioendotheliosarcoma* or hemangiopericytoma* or hemangiosarcoma* or hepatoblastoma* or hepatocarcinoma* or hepatocholangiocarcinoma* or hepatoma? or hodgkin* or hypernephroma* or immunocytoma* or keratoacanthoma* or leiomyosarcoma* or leukaemia* or leukemia* or liposarcoma* or lymphoma? or lymphangiosarcoma* or lymphoepithelioma* or macroglobulinemia* or malignan* or maltoma* or medulloblastoma* or medullomyoblastoma* or melanoameloblastoma* or melanoma* or meningioblastoma* or mesenchymoma* or mesonephroma* or mesothelioma* or metasta* or microglioma* or myelodysplas* or myeloma* or myelomatos* or myeloproliferat* or myosarcoma* or myxoliposarcoma* or nephroblastoma* or neuroblastoma* or neurofibrosarcoma* or nonhodgkin* or nonseminoma* or oligodendroglioma* or oncocytoma* or oncogen* or oncolog* or orchioblastoma* or osteoblastoma* or osteochondrosarcoma* or osteofibrosarcoma* or osteosarcoma* or pancreatoblastoma* or paraganglioma* or paraneoplastic or pinealblastoma* or pinealoblastoma* or pineoblastoma* or pneumoblastoma* or polyembryoma* or polyhistioma* or porocarcinoma* or precancer* or preleukaemia* or preleukemia* or premalignant* or preneoplastic* or reticuloendothelioma* or retinoblastoma* or rhabdomyosarcomas* or rhabdosarcoma* or sarcoma* or seminoma* or somatostatinoma* or teratocarcinoma* or waldenstrom* or xanthosarcoma*).tw,kw. | 4205268 |
| 66 | exp mutagenesis/ | 115253 |
| 67 | mutagenic activity/ | 2573 |
| 68 | exp genetic damage/ | 168775 |
| 69 | genotoxicity/ | 32248 |
| 70 | (genotox* or nanogenotox* or mutagen*).tw,kw. | 164928 |
| 71 | ((gene* or genomic* or dna or chromosom*) adj3 (damag* or repair* or adduct? or aberrat* or break* or fragment* or loss* or non-disjunction* or nondisjunction* or necro* or apoptos* or cytostas*)).tw,kw. | 357914 |
| 72 | (single strand break* or double strange break* or point mutation* or point deletion*).tw,kw. | 54626 |
| 73 | (comet assay* or ames test* or micronucle* or MN assay* or MN test*).tw,kw. | 31735 |
| 74 | or/59-73 [Cancer + Genotox] | 5170119 |
| 75 | 20 and 74 [TRAP + Cancer/Genotox] | 4208 |
| 76 | limit 75 to ((english or french) and yr="2000 -Current") | 2941 |
| 77 | limit 76 to human | 1942 |
| 78 | 76 and (50 or 51) | 2238 |
| 79 | 76 not 53 | 2348 |
| 80 | 77 or 78 or 79 [Human Limit] | 2700 |
| 81 | limit 80 to conference abstract status | 352 |
| 82 | 80 not 81 | 2348 |
| 83 | 82 not 58 [New Results Only] | 601 |
Medline
Database(s): Ovid MEDLINE®ALL 1946 to September 24, 2019
Search strategy:
| # | Searches | Results |
|---|---|---|
| 1 | Vehicle Emissions/ | 9494 |
| 2 | exp motor vehicles/ | 19935 |
| 3 | transportation/ | 9673 |
| 4 | Automobile Driving/ | 18350 |
| 5 | Parking Facilities/ | 354 |
| 6 | exp Nitrogen Oxides/ | 109686 |
| 7 | Carbon MoNOXide/ | 17586 |
| 8 | Carbon Dioxide/ | 85398 |
| 9 | Ozone/ | 14038 |
| 10 | Volatile Organic Compounds/ | 8399 |
| 11 | Soot/ | 1356 |
| 12 | particulate matter/ or exp dust/ or smog/ | 37040 |
| 13 | exp Polycyclic Aromatic Hydrocarbons/ | 432802 |
| 14 | air pollution/ or air pollution, indoor/ | 41275 |
| 15 | ((distanc* or proximit* or close*) adj3 (traffic* or road* or highway* or transitway*)).tw,kf. | 1703 |
| 16 | traffic exposure*.tw,kf. | 255 |
| 17 | ((automobile* or automotive* or autocar* or autobus* or motor* or vehic* or taxi* or diesel* or gasoline* or engine? or car or cars or truck* or bus or buses or bussing or highway* or high way* or motorway* or motor way or road* or parkade* or parking* or carpark* or car park* or traffic*) adj4 (exhaust? or emission* or pollut* or vapor* or vapour* or volatile* or effluvia* or smoke* or fume? or haze? or smog* or nitrogen oxide* or NOX or 11104-93-1 or carbon moNOXide* or 630-08-0 or carbon dioxide or 124-38-9 or volatile organic compounds or VOC or VOCs or Peroxyacetyl nitrate or 2278-22-0 or polycyclic aromatic hydrocarbon* or arene* or PAH or polyaromatic hydrocarbon* or polynuclear aromatic hydrocarbon*)).tw,kf. | 13263 |
| 18 | 1 or ((or/2-5) and (or/6-16)) or 17 [TRAP] | 17743 |
| 19 | exp Health/ | 345756 |
| 20 | exp "diseases (non mesh)"/ | 14374936 |
| 21 | exp Mental Disorders/ | 1191963 |
| 22 | exp morbidity/ | 526606 |
| 23 | exp mortality/ | 365366 |
| 24 | exp Epidemiology/ | 26066 |
| 25 | Epidemiological Monitoring/ | 6721 |
| 26 | exp "growth and development"/ | 1360569 |
| 27 | "Quality of Life"/ | 181498 |
| 28 | exp Hospitalization/ | 225809 |
| 29 | (IQR or interquartile range* or inter quartile range*).tw,kf. | 57729 |
| 30 | (health* or disease* or illness* or mortalit* or morbidit* or disorder* or sick*).tw,kf. | 6964210 |
| 31 | or/19-30 [Health Effects] | 17659998 |
| 32 | limit 31 to ((english or french) and yr="2000 -Current") | 9229392 |
| 33 | 18 and 32 [TRAP + Human Health] | 6455 |
| 34 | limit 33 to human | 4465 |
| 35 | (human* or person* or people* or man or men? or wom?n or child* or infan* or toddler* or newborn* or neonat* or baby or babies or adolecen* or teenage* or preteen* or preadolescen* or premenarch* or pre menarch* or adult* or elderly or seniors).tw,kf. | 7256656 |
| 36 | exp human/ | 17993869 |
| 37 | 33 and (34 or 35) | 5192 |
| 38 | exp models animal/ | 545272 |
| 39 | exp animal experimentation/ | 9168 |
| 40 | 33 not (37 or 38) | 1193 |
| 41 | 34 or 37 or 40 | 6385 |
| 42 | 41 and ((2000* or 2001* or 2002* or 2003* or 2004* or 2005* or 2006* or 2007* or 2008* or 2009* or 2010* or 2011* or 2012* or 2013* or 2014* or 2015* or 2016* or 2017* or "201801" or "201802" or "201803").ed. or (2000* or 2001* or 2002* or 2003* or 2004* or 2005* or 2006* or 2007* or 2008* or 2009* or 2010* or 2011* or 2012* or 2013* or 2014* or 2015* or 2016* or 2017* or "2018 01" or "2018 02" or "2018 03").dt.) [Previously Retrieved Articles] | 5531 |
| 43 | exp Neoplasms/ | 3219339 |
| 44 | Carcinogenicity Tests/ | 4551 |
| 45 | exp carcinogenesis/ or exp neoplasm metastasis/ | 281168 |
| 46 | (adamantinoma* or adenoacanthoma* or adenocanthoma* or adenocarcinoma* or adenomatos* or adenomyoepithelioma* or adenomyoma* or adenosarcoma* or aesthesioneuroblastoma* or ameloblastoma* or androblastoma* or angioblastoma* or angioendothelioma* or angiofibrosarcoma* or angiosarcoma* or argentaffinoma* or arrhenoblastoma* or astroblastoma* or astrocytoma* or astroglioma* or baltoma or basiloma* or basalioma* or blastoma? or Buschke-Lowenstein or cancer* or carcinogen* or carcinoid? or carcinoma* or carcinosarcoma* or chloroma* or cholangiocarcinoma* or cholangiohepatoma* or cholangiosarcoma* or chondroblastoma* or chondrosarcoma* or chorioadenoma* or chorioangioma or choriocarcinoma* or chorioepithelioma* or chorionepithelioma* or comedocarcinoma* or cystadenocarcinoma* or cystosarcoma* or dermatofibrosarcoma* or dictyoma* or dysgerminoma* or ectomesenchymoma* or ependymoblastoma* or erythroleukaemia* or erythroleukemia* or erythroplakia* or esthesioneuroblastoma* or esthesioneuroepithelioma* or fibroadenosarcoma* or fibrochondrosarcoma* or fibroepithelioma* or fibroliposarcoma* or fibrosarcoma* or fibroxanthoma* or fibroxanthosarcoma* or ganglioblastoma* or ganglioneuroblastoma* or glioblastoma* or gliomatos* or gliosarcoma* or haemangioblastoma* or haemangiopericytoma* or haemangiosarcoma* or hemangioblastoma* or hemangioendothelioma* or hemangioendotheliosarcoma* or hemangiopericytoma* or hemangiosarcoma* or hepatoblastoma* or hepatocarcinoma* or hepatocholangiocarcinoma* or hepatoma? or hodgkin* or hypernephroma* or immunocytoma* or keratoacanthoma* or leiomyosarcoma* or leukaemia* or leukemia* or liposarcoma* or lymphoma? or lymphangiosarcoma* or lymphoepithelioma* or macroglobulinemia* or malignan* or maltoma* or medulloblastoma* or medullomyoblastoma* or melanoameloblastoma* or melanoma* or meningioblastoma* or mesenchymoma* or mesonephroma* or mesothelioma* or metasta* or microglioma* or myelodysplas* or myeloma* or myelomatos* or myeloproliferat* or myosarcoma* or myxoliposarcoma* or nephroblastoma* or neuroblastoma* or neurofibrosarcoma* or nonhodgkin* or nonseminoma* or oligodendroglioma* or oncocytoma* or oncogen* or oncolog* or orchioblastoma* or osteoblastoma* or osteochondrosarcoma* or osteofibrosarcoma* or osteosarcoma* or pancreatoblastoma* or paraganglioma* or paraneoplastic or pinealblastoma* or pinealoblastoma* or pineoblastoma* or pneumoblastoma* or polyembryoma* or polyhistioma* or porocarcinoma* or precancer* or preleukaemia* or preleukemia* or premalignant* or preneoplastic* or reticuloendothelioma* or retinoblastoma* or rhabdomyosarcomas* or rhabdosarcoma* or sarcoma* or seminoma* or somatostatinoma* or teratocarcinoma* or waldenstrom* or xanthosarcoma*).tw,kw,kf. | 3173485 |
| 47 | exp Mutagenesis/ | 238648 |
| 48 | exp DNA Damage/ | 93347 |
| 49 | exp Mutagenicity Tests/ | 28656 |
| 50 | (genotox* or nanogenotox* or mutagen*).tw,kw,kf. | 138221 |
| 51 | ((gene* or genomic* or dna or chromosom*) adj3 (damag* or repair* or adduct? or aberrat* or break* or fragment* or loss* or non-disjunction* or nondisjunction* or necro* or apoptos* or cytostas*)).tw,kw,kf. | 291773 |
| 52 | (single strand break* or double strange break* or point mutation* or point deletion*).tw,kw,kf. | 43988 |
| 53 | (comet assay* or ames test* or micronucle* or MN assay* or MN test*).tw,kw,kf. | 25002 |
| 54 | or/43-53 [Cancer + Genotox] | 4528506 |
| 55 | 18 and 54 [TRAP + Cancer/Genotox] | 2798 |
| 56 | limit 55 to ((english or french) and yr="2000 -Current") | 1833 |
| 57 | limit 56 to human | 1211 |
| 58 | 56 and (34 or 35) | 1364 |
| 59 | 56 not (37 or 38) | 687 |
| 60 | 57 or 58 or 59 [Human] | 1827 |
| 61 | 60 not 42 | 707 |
Appendix B. Study quality assessment table using the AMSTAR 2 rating instrument adapted to environmental epidemiology studies
| Childhood leukemia SR-MAs and systematic reviews | Adult cancers SR-MAs and systematic reviews | |||||||||||||||
|---|---|---|---|---|---|---|---|---|---|---|---|---|---|---|---|---|
| Raaschou-Nielsen and Reynolds 2006 | Boothe 2008 | Pyatt and Hays 2010 | Boothe et al. 2014Footnote a | Sun et al. 2014Footnote a | Filippini et al. 2015Footnote a | Carlos-Wallace et al. 2016Footnote a | Filippini et al. 2019Footnote a | Gong et al. 2019Footnote a | Brugge et al. 2007 | Tsoi and Tse 2012Footnote a | Chen et al. 2015Footnote a | Hamra et al. 2015Footnote a | White et al. 2018 | Leng et al. 2019 | Sahay et al. 2019 | |
| 1. Did the review authors use a comprehensive literature search strategy? | 0.5 | 0 | 1 | 0.5 | 0.5 | 0 | 1 | 1 | 1 | 0 | 1 | 1 | 0.5 | 0.5 | 0.5 | 0.5 |
| 2. Did the review authors describe the included studies in adequate detail? | 1 | 1 | 0.5 | 1 | 1 | 1 | 1 | 1 | 0 | 0 | 1 | 1 | 1 | 1 | 0 | 0.5 |
| 3. Did the review authors use a satisfactory technique for appraising study quality or assessing the Risk of Bias (RoB) in individual studies included in the review? | 0.5 | 0 | 0 | 0.5 | 1 | 1 | 0 | 1 | 0 | 0 | 1 | 1 | 0.5 | 0 | 0 | 0 |
| 4. Did the review authors account for study quality or RoB in the individual studies when interpreting/discussing the results of the review? | 1 | 0 | 0 | 1 | 1 | 0.5 | 0 | 0.5 | 0 | 0 | 1 | 1 | 0 | 0 | 0 | 0 |
| 5. Did the review authors provide a satisfactory explanation for, and discussion of, any heterogeneity observed in the results of the review? | 0.5 | 0.5 | 0 | 1 | 1 | 1 | 0.5 | 0.5 | 1 | 0.5 | 1 | 0 | 1 | 0.5 | 0 | 0 |
| 6. If meta-analysis was performed, did the review authors use appropriate methods for statistical combination of results? | N/A | N/A | N/A | 1 | 1 | 1 | 1 | 1 | 1 | N/A | 1 | 1 | 1 | N.A. | N.A. | N.A. |
| 7. If meta-analysis was performed, did the review authors assess the potential impact of study quality or RoB in individual studies on the results of the meta-analysis or other evidence synthesis? | N/A | N/A | N/A | 1 | 1 | 1 | 0 | 1 | 0 | N/A | 1 | 1 | 0 | N.A. | N.A. | N.A. |
| 8. If they performed a quantitative synthesis, did the review authors carry out an adequate investigation of public bias (small-study bias) and discuss its likely impact on the results of the review? | N/A | N/A | N/A | 1 | 1 | 1 | 1 | 1 | 0.5 | N/A | 1 | 0.5 | 1 | N.A. | N.A. | N.A. |
| Total score | 3.5Footnote c | 1.5Footnote d | 1.5Footnote d | 7Footnote b | 7.5Footnote b | 6.5Footnote b | 4.5Footnote c | 7Footnote b | 3.5Footnote c | 0.5Footnote d | 8Footnote b | 6.5Footnote b | 5Footnote c | 2Footnote c | 0.5Footnote d | 1Footnote d |
N/A: not applicable |
||||||||||||||||
|
||||||||||||||||
Appendix C. List of cited studies across the reviews included in this assessment
Lists of cited studies across the reviews included in this assessment for childhood leukemia, lung cancer, and biological evidence from systematic reviews are found in sections C.1., C.2., and C.3., respectively. No such list was prepared for breast cancer as only one systematic review was identified in this assessment for this health outcome.
C.1. Childhood leukemia
| Author(s), year | Journal | Study design | TRAP metric | No. of times cited | Systematic reviews that include meta-analysis (SR-MAs) | Systematic reviews with no meta-analysis | |||||
|---|---|---|---|---|---|---|---|---|---|---|---|
| Filippini et al. 2019 | Gong et al. 2019 | Carlos-Wallace et al. 2016 | Filippini et al. 2015 | Sun et al. 2014 | Booth et al. 2014 | Raaschou-Nielsen and Reynolds 2006 | |||||
| Raaschou-Nielsen et al. 2018 | Int J Cancer | case-control | benzene | 1 | X | - | - | - | - | - | - |
| Tamayo-Uria et al. 2018 | Environ Int | case-control | traffic density | 1 | X | - | - | - | - | - | - |
| Janitz et al. 2017 | Environ Res | case-control | benzene | 2 | X | X | - | - | - | - | - |
| Lavigne et al. 2017 | Environ Int | cohort | NO2, PM2.5 | 1 | X | - | - | - | - | - | - |
| Janitz et al. 2016 | Environ Res | case-control | traffic density, NO2 | 2 | X | X | - | - | - | - | - |
| Magnani et al. 2016 | Arch Med Res | case-control | traffic density | 1 | X | - | - | - | - | - | - |
| Symanski et al. 2016 | Environ Health | case-control | benzene, 1,3-butadiene, polycyclic organic matter | 1 | X | - | - | - | - | - | - |
| Houot et al. 2015 | Am J Epidemiol | case-control | traffic density, NO2, benzene | 2 | X | X | - | - | - | - | - |
| Spycher et al. 2015 | Eur J Epidemiol | cohort | distance from heavy traffic roads | 1 | X | - | - | - | - | - | - |
| Heck et al. 2014 | Int J Hyg Environ Health | case-control | PAHs, benzene, etc. | 4 | X | X | X | X | - | - | - |
| Badaloni et al. 2013 | Occup Environ Med | case-control | traffic density, NO2, PM10, O3, PM2.5 | 4 | X | X | X | X | - | - | - |
| Ghosh et al. 2013 | Am J Epidemiol | case-control | NO, NO2, NOX | 3 | X | X | - | X | - | - | - |
| Heck et al. 2013 | Environ Health Perspect | case-control | traffic density, CO, PM2.5 | 4 | X | X | - | X | X | - | - |
| Vinceti et al. 2012 | Eur J Epidemiol | case-control | benzene, PM10 | 4 | X | X | X | X | - | - | - |
| Amigou et al. 2011 | Environ Health Perspect | case-control | traffic density, NO2 | 6 | X | X | X | X | X | X | - |
| Bräuner et al. 2010 | Cancer Causes Control | case-control | traffic density, radon | 1 | - | - | - | - | X | - | - |
| Rahman et al. 2008 | Asian Pac J Cancer Prev | case-control | traffic density | 1 | X | - | - | - | - | - | - |
| Von Behren et al. 2008 | Cancer Epidemiol Biomarkers Prev | case-control | traffic density | 5 | X | X | - | X | X | X | - |
| Weng et al. 2008 | J Toxicol Environ Health A | case-control | NO2 | 3 | X | X | - | X | - | - | - |
| Whitworth et al. 2008 | Environ Health Perspect | ecological | benzene, 1,3-butadiene | 2 | - | - | X | X | - | - | - |
| Crosignani et al. 2004 | Int J Cancer | case-control | traffic density, benzene | 7 | X | X | X | X | X | X | X |
| Reynolds et al. 2004 | Epidemiology | case-control | traffic and road density | 6 | X | X | - | X | X | X | X |
| Steffen et al. 2004 | Occup Environ Med | case-control | traffic density | 6 | X | X | X | X | - | X | X |
| Visser et al. 2004 | Cancer Causes Control | ecological | traffic density | 4 | X | - | X | - | - | X | X |
| Langholz et al. 2002 | Ann Epidemiol | case-control | traffic density | 7 | X | X | X | X | X | X | X |
| Reynolds et al. 2002 | Cancer Causes Control | ecological | vehicle density | 3 | - | - | - | X | X | - | X |
| Raaschou-Nielsen et al. 2001 | Am J Epidemiol | case-control | traffic density, benzene, NO2 | 7 | X | X | X | X | X | X | X |
| Reynolds et al. 2001 | Bioelectromagnetics | case-control | traffic density | 3 | X | X | - | - | X | - | - |
| Pearson et al. 2000 | J Air Waste Manag Assoc | case-control | traffic density | 3 | X | X | X | - | - | - | - |
| Harrison et al. 1999 | Occup Environ Med | ecological | traffic density | 5 | X | X | X | X | - | - | X |
| Feychting et al. 1998 | Scand J Work Environ Health | case-control | NO2 | 4 | X | X | - | X | - | - | X |
| Nordliner and Jarvholm 1997 | Int Arch Occup Environ Health | ecological | car density | 1 | - | - | - | X | - | - | - |
| Alexander et al. 1996 | Paediatr Perinat Epidemiol | ecological | car ownership | 1 | - | - | - | X | - | - | - |
| Savitz and Feingold 1989 | Scand J Work Environ Health | case-control | traffic density | 6 | X | X | - | X | X | X | X |
X: Cited |
|||||||||||
C.2. Lung cancer
| Author(s), year | Journal | Study design | TRAP metric | No. of times cited | Systematic reviews that include meta-analysis (SR-MAs) | ||
|---|---|---|---|---|---|---|---|
| Chen et al. 2015 | Hamra et al. 2015 | Tsoi and Tse 2012 | |||||
| Puett et al. 2014 | Environ Health Perspect | cohort | NO2, distance to roadways | 1 | - | X | - |
| Villeneuve et al. 2014 | Am J Epidemiol | case-control | NO2 | 1 | - | X | - |
| Carey et al. 2013 | Am J Respir Crit Care Med | cohort | NO2 | 1 | - | X | - |
| Cesaroni et al. 2013 | Environ Health Perspect | cohort | NO2, distance to roadways, traffic density, PM2.5 | 2 | X | X | - |
| Heinrich et al. 2013 | Occup Environ Med | cohort | NO2, distance to roadways | 1 | - | X | - |
| Hystad et al. 2013 | Epidemiology | case-control | NO2, distance to roadways, PM2.5, O3 | 2 | X | X | - |
| Jerrett et al. 2013 | Am J Respir Crit Care Med | cohort | NO2, PM2.5, O3 | 1 | X | - | - |
| Raaschou-Nielsen et al. 2013 | Lancet Oncol | case-control | NOX, traffic density, PM10, PM2.5, NO2 | 2 | X | X | - |
| Yorifuji et al. 2013 | Sci Total Environ | cohort | NO2 | 2 | X | X | - |
| Cao et al. 2011 | J Hazard Mater | cohort | NOX, SO2, total suspended particles | 2 | X | X | - |
| Hart et al. 2011 | Am J Respir Crit Care Med | cohort | NO2 | 1 | - | X | - |
| Katanoda et al. 2011 | J Epidemiol | cohort | NO2 | 1 | - | X | - |
| Lipsett et al. 2011 | Am J Respir Crit Care Med | cohort | NO2 | 1 | - | X | - |
| Raaschou-Nielsen et al. 2011 | Environ Health Perspect | case-control | NO2, distance to roadways, traffic density | 1 | - | X | - |
| Birdsey et al. 2010 | AAOHN J | cohort | truck drivers | 2 | X | - | X |
| Consonni et al. 2010 | Am J Epidemiol | case-control | bus and truck drivers | 2 | X | - | X |
| Merlo et al. 2010 | Occup Environ Med | cohort | bus drivers | 2 | X | - | X |
| Petersen et al. 2010 | Am J Ind Med | cohort | bus drivers | 1 | X | - | - |
| Raaschou-Nielsen et al. 2010 | Cancer Epidemiol Biomarkers Prev | cohort | NOX | 1 | - | X | - |
| Krewski et al. 2009 | Res Rep Health Eff Inst | cohort | NO2 | 1 | - | X | - |
| Beelen et al. 2008 | Epidemiology | cohort | NO2, distance to roadways, traffic density, black smoke, SO2, PM2.5 | 2 | X | X | - |
| Garshick et al. 2008 | Environ Health Perspect | cohort | long-haul drivers | 2 | X | - | X |
| Laden et al. 2007 | Environ Health Perspect | cohort | combined drivers | 1 | - | - | X |
| Laden et al. 2006 | Am J Respir Crit Care Med | cohort | PM2.5 | 1 | X | - | - |
| Richiardi et al. 2006 | Ann Oncol | case-control | professional drivers and transport conductors | 2 | X | - | X |
| Vineis et al. 2006 | Int J Cancer | case-control | NO2, PM10, SO2 | 1 | X | - | - |
| Filleul et al. 2005 | Occup Environ Med | cohort | NO2, SO2, total suspended particles, NO, black smoke | 2 | X | X | - |
| Jerrett et al. 2005 | Epidemiology | cohort | PM2.5 | 1 | X | - | - |
| Richiardi et al. 2004 | Cancer Causes Control | case-control | bus and truck drivers | 1 | - | - | X |
| Elci et al. 2003 | Monaldi Arch Chest Dis | case-control | unspecified drivers | 2 | X | - | X |
| Jarvholm and Silverman 2003 | Occup Environ Med | cohort | truck drivers | 2 | X | - | X |
| Menvielle et al. 2003 | Occup Environ Med | case-control | bus, lorry, and van drivers | 1 | - | - | X |
| Nafstad et al. 2003 | Thorax | cohort | NOX, SO2 | 2 | X | X | - |
| Soll-Johanning et al. 2003 | Occup Med (Lond) | case-control | bus drivers or tramway employees | 2 | X | - | X |
| Pope et al. 2002 | JAMA | cohort | PM2.5 | 1 | X | - | - |
| Bruske-Hohlfeld et al. 2000 | Am J Epidemiol | case-control | professional drivers | 1 | - | - | X |
| Nyberg et al. 2000 | Epidemiology | case-control | NO2, SO2 | 2 | X | X | - |
| Abbey et al. 1999 | Am J Respir Crit Care Med | cohort | NO2 | 1 | - | X | - |
| Aronson et al. 1999 | Occup Environ Med | cohort | lorry drivers | 1 | - | - | X |
| Bruske-Hohlfeld et al. 1999 | Am J Ind Med | case-control | professional drivers | 1 | X | - | - |
| Pezzotto and Poletto 1999 | Am J Ind Med | case-control | unspecified drivers | 2 | X | - | X |
| Hansen et al. 1998 | Occup Environ Med | case-control | lorry, bus, taxi, and unspecified drivers | 2 | X | - | X |
| Jockel et al. 1998 | Int J Epidemiol | case-control | truck drivers | 1 | - | - | X |
| Muscat et al. 1998 | Environ Res | case-control | unspecified drivers | 2 | X | - | X |
| Soll-Johanning et al. 1998 | Occup Environ Med | cohort | bus drivers, tramway employees | 1 | - | - | X |
| Jakobsson et al. 1997 | Occup Environ Med | cohort | taxi drivers, long and short distance lorry drivers | 2 | X | - | X |
| Borgia et al. 1994 | Am J Ind Med | cohort | taxi drivers | 1 | X | - | - |
| Alfredsson et al. 1993 | Int J Epidemiol | cohort | bus drivers | 1 | X | - | - |
| Burns and Swanson 1991 | Am J Ind Med | case-control | unspecified drivers | 1 | X | - | - |
| Boffetta et al. 1990 | Am J Ind Med | case-control | truck drivers | 1 | X | - | - |
| Steenland et al. 1990 | Am J Public Health | case-control | long and short haul drivers | 1 | X | - | - |
| Hayes et al. 1989 | Am J Ind Med | case-control | truck, bus, taxi drivers, and chauffeurs | 1 | X | - | - |
| Paradis et al. 1989 | Int J Epidemiol | cohort | bus drivers | 1 | X | - | - |
| Boffetta et al. 1988 | Am J Ind Med | cohort | truck drivers | 1 | X | - | - |
X: Cited |
|||||||
C.3. Biological evidence from systematic reviews
| Author(s), year | Journal | Number of times cited | Systematic reviews with no meta-analysis | ||
|---|---|---|---|---|---|
| Gromadzinska and Wasowicz 2019 | Sahay et al. 2019 | DeMarini 2013 | |||
| Barnes et al. 2018 | Int J Environ Res Public Health | 1 | X | - | - |
| Callahan et al. 2018 | Environ Res | 1 | - | X | - |
| Shraideh et al. 2018 | Int J Occup Med Environ Health | 1 | X | - | - |
| Barth et al. 2017 | Environ Sci Pollut Res Int | 1 | X | - | - |
| Gruzieva et al. 2017 | Environ Health Perspect | 1 | - | X | - |
| Lai et al. 2017 | Sci Total Environ | 1 | X | - | - |
| Plusquin et al. 2017 | Environ Int | 1 | - | X | - |
| Miller-Schultze et al. 2016 | J Environ Sci | 1 | X | - | - |
| White et al. 2015 | Cancer Causes Control | 1 | - | X | - |
| Goethel et al. 2014 | Mutat Res Genet Toxicol Environ Mutagen | 1 | X | - | - |
| Brucker et al. 2013 | Sci Total Environ | 1 | X | - | - |
| Prasad et al. 2013 | Inhal Toxicol | 1 | - | - | X |
| Ciarrocca et al. 2012 | J Environ Monit | 1 | X | - | - |
| Hou et al. 2012 | Environ Int | 2 | X | - | X |
| Huang et al. 2012 | PLoS One | 1 | - | - | X |
| Pettit et al. 2012 | Inhal Toxicol | 1 | - | - | X |
| Ayi-Fanou et al. 2011 | Environ Toxicol | 1 | - | - | X |
| Anbazhagan et al. 2010 | Int J Hum Genet | 1 | - | - | X |
| Han et al. 2010 | Chemosphere | 1 | X | - | - |
| Huang et al. 2010 | Inhal Toxicol | 1 | - | - | X |
| Li et al. 2010 | J Environ Occupat Med | 1 | - | - | X |
| McCracken et al. 2010 | Environ Health Perspect | 1 | - | - | X |
| Hallare et al. 2009 | Environ Monit Assess | 1 | - | - | X |
| Baccarelli et al. 2009 | Am J Respir Crit Care Med | 1 | - | - | X |
| Hoxha et al. 2009 | Environ Health | 2 | X | - | X |
| Li et al. 2009 | Sci Total Environ | 1 | X | - | - |
| Pederson et al. 2009 | Environ Res | 1 | - | - | X |
| Sree Devi et al. 2009 | Indian J Med Res | 1 | - | - | X |
| Wei et al. 2009 | Environ Sci Technol | 1 | - | - | X |
| Palli et al. 2008 | Sci Total Environ | 1 | - | - | X |
| Rossner et al. 2008 | Mutat Res | 1 | X | - | - |
| Villarini et al. 2008 | J Toxicol Environ Health A | 1 | - | - | X |
| Peretz et al. 2007 | Inhal Toxicol | 1 | - | - | X |
| Rossner et al. 2007 | Mutat Res | 1 | X | - | - |
| Ruchirawat et al. 2007 | Toxicol Lett | 1 | - | - | X |
| Tuntawiroon et al. 2007 | Carcinogenesis | 1 | - | - | X |
| Cavallo et al. 2006 | Toxicology | 1 | - | - | X |
| Manini et al. 2006 | Toxicol Lett | 1 | X | - | - |
| Soogarun et al. 2006 | Southeast Asian J Trop Med Public Health | 1 | - | - | X |
| Bai et al. 2005 | Carcinogen Teratogen Mutagen | 1 | - | - | X |
| Maffei et al. 2005 | Mutat Res | 1 | X | - | - |
| Vinzents et al. 2005 | Environ Health Perspect | 1 | - | - | X |
| Hansen et al. 2004 | Mutat Res | 2 | X | - | X |
| Chuang et al. 2003 | Chemosphere | 2 | X | - | X |
| Rahman et al. 2003 | Int Arch Occup Environ Health | 1 | - | - | X |
| Reidiker et al. 2003 | Environ Sci Technol | 1 | X | - | - |
| Zhu et al. 2003 | Chin J Ind Hyg Occup Dis | 1 | - | - | X |
| Burgaz et al. 2002 | Chemosphere | 1 | - | - | X |
| Palli et al. 2001 | Int J Cancer | 1 | - | - | X |
| Zagury et al. 2000 | Occup Environ Med | 1 | X | - | - |
| Chen et al. 1999 | J Hyg Res | 1 | - | - | X |
| Karahalil et al. 1999 | Mutat Res | 1 | - | - | X |
| Knudsen et al. 1999 | Cancer Epidemiol Biomarkers Prev | 1 | - | - | X |
| Loft et al. 1999 | Mutat Res | 1 | - | - | X |
| Peluso et al. 1998 | Cancer Epidemiol Biomarkers Prev | 1 | - | - | X |
| Zhao et al. 1998 | Mutat Res | 1 | - | - | X |
| Bolognesi et al. 1997 | Environ Mol Mutagen | 1 | - | - | X |
| Bolognesi et al. 1997 | Mutat Res | 1 | - | - | X |
| Merlo et al. 1997 | J Environ Pathol Toxicol Oncol | 1 | - | - | X |
| Chandrasekaran et al. 1996 | Hum Exp Toxicol | 1 | - | - | X |
| Nielsen et al. 1996 | Carcinogenesis | 1 | - | - | X |
| Nielsen et al. 1996 | Toxicol Lett | 1 | - | - | X |
| Yang et al. 1996 | Chem Biol Interact | 1 | - | - | X |
| Hou et al. 1995 | Carcinogenesis | 1 | - | - | X |
| Hemminki et al. 1994 | Carcinogenesis | 1 | - | - | X |
| Hemminki et al. 1994 | Toxicol Lett | 1 | - | - | X |
| Anwar et al. 1988 | Mutat Res | 1 | - | - | X |
X: Cited |
|||||
Appendix D. Summary table of the primary reviews considered in the umbrella review
D.1. Childhood leukemia
| Author | Purpose/Objective | Search Period | Number of Primary Studies/Breakdown of Primary Studies | Main Results | Authors' Conclusions | Other Considerations |
|---|---|---|---|---|---|---|
| Systematic reviews–meta-analyses (SR–MA) | ||||||
| Sun et al. 2014 | SR-MA that examined the association between local traffic density and risk of childhood leukemia | 1979 –2013 | 11 studies, all included in meta-analysis (MA) Studies included in MA:
|
Childhood leukemia and traffic density: pooled OR = 1.03 (95% CI: 0.98–1.09); I2 = 63.3%, p = 0.002 |
No significant association between traffic density and risk of childhood leukemia; similar conclusions were reached for subgroup analyses. | AMSTAR 2: High quality Data extraction for MA: Authors extracted adjusted effect estimates but did not indicate whether it was most adjusted effect estimates or not. Study quality assessment: NOS Scale. Confounders: Did not provide details on adjusted for confounders in the extracted effect estimates. Heterogeneity: If evidence of heterogeneity, used random-effects (p < 0.05, I2 > 50%), else implemented fixed-effects model. Used random-effects. Subgroup analyses: Reported subgroup analyses by study region (USA, Europe), study duration (<10 y, ≥10 y), NOS score (≥7, ≤6), and definition of traffic density. Sensitivity analyses: Excluded each study one-by-one; findings suggested robust summary estimates. Publication bias: Little evidence for publication bias; Begg's test (p = 0.15), Egger's test (p = 0.068), funnel plot was symmetrical. |
| Boothe et al. 2014 | SR-MA that examined the association between residential traffic exposure and risk of childhood cancers, particularly leukemia. | 1980 –2011 | 9 unique studies, 8 included in MA, 1 used in sensitivity analyses only Studies included in MA:
|
Childhood leukemia and TRAP: pooled OR = 1.39 (95% CI: 1.03– 1.88); I2 = 57.4%, p = 0.02 Childhood leukemia and TRAP, postnatal window: pooled OR = 1.53 (95% CI: 1.12– 2.10); I2 = 37.8%, p = 0.14 Childhood leukemia and TRAP, prenatal window: pooled OR = 0.92 (95% CI: 0.78– 1.09); I2 = 0.0%, p = 0.81 |
TRAP exposure during postnatal period is associated with increased risk of childhood leukemia, but not during prenatal period. | AMSTAR 2: High quality Data extraction for MA: Authors used effect estimate with longest exposure window, best characterized traffic exposure, compared highest to lowest exposure category, had most confounders adjusted, and did not adjust for measured or modelled TRAP (to avoid over-adjustment). Study quality assessment: Developed own study quality scale (17 items) using elements of existing scales and methodological factors specific to the review. Confounders: All studies adjusted for age and gender, some additionally adjusted for SES. Heterogeneity: Used random-effects. Subgroup analyses: Reported stratified analyses by study location, study time period, type of exposure metric, exposure window, cancer type, control for SES, and study quality score. Sensitivity analysis: Used one-study-removed sensitivity analysis; suggested robust effect estimates. Publication bias: Funnel plot suggested some evidence as Begg and Mazumdar test and Egger's test were both significant: p = 0.02 and p < 0.01, respectively. However, Orwin's fail-safe N analysis indicated that 19 missing studies reporting null effects would be needed to reduce the pooled OR to 1.10. |
| Filippini et al. 2015 | SR-MA that examined the association between long-term exposure to motorized traffic exhausts and risk of childhood leukemia. | Up to July 2014 | 26 studies, 18 included in MA Studies included in MA:
|
Childhood leukemia and traffic density: pooled OR = 1.09 (95% CI: 0.96– 1.23); I2 = 57.0% Childhood leukemia and NO2: pooled OR = 1.14 (95% CI: 0.94– 1.39); I2 = 74.5% Childhood leukemia and benzene: pooled OR = 1.64 (95% CI: 0.91–2.95); I2 = 50.7% |
TRAP exposure is associated with increased risk of childhood leukemia, among all leukemia and its major subtypes (i.e., ALL and AML). The association was consistent across different indices of exposure and study region. | AMSTAR 2: High quality Data extraction for MA: Authors used the most adjusted effect estimates in their MA. Study quality assessment: NOS Scale. Confounders: Provided details on confounding adjustment; most studies adjusted for sex, age, and/or date of birth. Heterogeneity: Since I2 > 50%, authors used random-effects. Subgroup analyses: Reported stratified analyses by disease subtype, study region, and exposure window. Sensitivity analyses: Included only studies with low risk of bias (NOS ≥ 7), removed most influential study from each analysis; suggested robust summary estimates. Publication bias: Strong evidence for publication bias; funnel plots asymmetric. |
| Carlos-Wallace et al. 2015 | SR-MA that examined the association between benzene, including TRAP and traffic density as proxy measures of benzene exposure, and risk of childhood leukemia. Only results pertaining to TRAP and traffic density are captured in this table. | 1999 –2014 | 12 studies, all included in MA Studies included in MA:
|
Childhood leukemia and traffic density: pooled RR = 1.25 (95% CI: 0.96–1.62); χ2 = 29.92, p < 0.01 Childhood leukemia and TRAP models: pooled RR = 1.77 (95% CI: 1.17–2.68); χ2 = 9.38, p = 0.15 |
Benzene exposure, as measured using traffic density and TRAP, is associated with increased risk of childhood leukemia. | AMSTAR 2: Moderate quality Data extraction for MA: Authors selected most adjusted effect estimate that also had most relevant factors: direct exposure metric (ambient air benzene measurement > TRAP models > traffic density), leukemia subtype, exposure period, etc. Confounders: Most studies adjusted or matched for age and sex. Heterogeneity: Used fixed-effects, Shore-adjusted, and random-effects methods. The presented results in this table are for the meta-analyses using random-effects. Subgroup analyses: Reported stratified analyses by exposure metric, adjustments, area, exposure window (birth, postnatal, at diagnosis only). Not all analyses were included due to possible inclusion of 3 primary studies evaluating residential proximity to gas stations in most of the quantitative analyses pertaining to TRAP. Publication bias: Suggested potential bias for more details TRAP models from funnel plot, but concluded likely not the case (and described reasons). No study quality assessment, but did thorough interpretation of potential biases in their discussion. No sensitivity analyses. |
| Gong et al. 2019 | SR-MA that examined the association between TRAP exposure and risk of childhood leukemia. | Up to Sept 2017 | 21 studies, all included in MA Studies included in MA:
|
Childhood leukemia and traffic density: pooled OR = 1.01 (95% CI: 0.98–1.04); I2 = 0.0%, p = 0.725 Childhood leukemia and NO2: pooled OR = 0.98 (95% CI: 0.93– 1.02); I2 = 24.7%, p = 0.134 Childhood leukemia and benzene: pooled OR = 0.94 (95% CI: 0.84–1.04); I2 = 17.2%, p = 0.261 |
Childhood leukemia is associated with traffic density and moderate exposure to NO2 and benzene. | AMSTAR 2: Moderate quality Confounders: The review authors did not discuss potential confounding factors. Heterogeneity: If evidence of heterogeneity (χ2 test p ≤0.05, I2 >50%), then used random-effects, else used fixed-effects. Used fixed-effects model. Subgroup analyses: Subgroup analyses for exposure level (low, moderate, high) of traffic density, NO2, and benzene. Sensitivity analyses: Review authors indicate that results were confirmed across sensitivity analyses; no other information provided. Publication bias: Suggested significant publication bias; funnel plot of traffic density was notably asymmetric, Begg and Mazumdar's rank test and Egger's test were significant with Z = 2.43, p = 0.015 and p = 0.047, respectively. No study quality assessment; review authors indicate that study quality assessed through publication bias. |
| Filippini et al. 2019 | SR-MA that examined the association between outdoor air pollution exposure, particularly TRAP, and risk of childhood leukemia. | Up to Mar 2019 | 29 studies, all included in MA Studies included in MA:
|
MAs comparing highest to lowest exposure categories for: Childhood leukemia and traffic density: pooled RR = 1.09 (95% CI: 1.00–1.20); I2 = 56.2%, τ2 = 0.012 Childhood leukemia and benzene: pooled RR = 1.27 (95% CI: 1.03–1.56); I2 = 52.4%, τ2 = 0.043 Childhood leukemia and NO2: pooled RR = 1.04 (95% CI: 0.90–1.19); I2 = 55.5%, τ2 = 0.023 Childhood leukemia and PM2.5: pooled RR = 1.05 (95% CI: 0.94– 1.16); I2 = 0.0%, τ2 = 0.000 Childhood leukemia and PM10: pooled RR = 1.20 (95% CI: 0.70– 2.04); I2 = 43.5%, τ2 = 0.075 Childhood leukemia and 1,3-butadiene: pooled RR = 1.45 (95% CI: 1.08–1.95); I2 = 28.0%, τ2 = 0.025 ALL subtype and benzene: pooled RR = 1.09 (95% CI: 0.88–1.36); I2 = 51.8%, τ2 = 0.034 AML subtype and benzene: pooled RR = 1.84 (95% CI: 1.31–2.59); I2 = 0.0%, τ2 = 0.000 |
TRAP exposure is associated with increased risk of childhood leukemia, particularly for benzene emissions from motorized traffic. The association is strongest for AML subtype. | AMSTAR 2: High quality Data extraction for MA: Authors used the most adjusted effect estimates in their MA. Study quality assessment: NOS Scale. Confounders: Provided details on confounding adjustment for each study; all but 2 adjusted for sex and age, all but 4 adjusted for SES. Heterogeneity: Used random-effects model. Subgroup analyses: Reported stratified analyses by age at diagnosis (<6 y, ≥6 y), disease subtype (ALL, AML), exposure window (at birth, at diagnosis), and study region. Sensitivity analyses: Used one-study-removed sensitivity analysis; suggested robust summary estimates. Publication bias: Suggested potential for publication bias; funnel plot slightly asymmetric. |
| Systematic Reviews | ||||||
| Raaschou‐Nielsen and Reynolds (2006) | Systematic review that examined the association between ambient air pollution exposure, particularly TRAP, and risk of childhood cancer, particularly leukemia. | Up to Sept 2005 | 15 studies:
Of the 7 case-controls:
|
Childhood leukemia and TRAP: The 7 case-control studies provided 9 distinct RRs, of which 6 reported positive associations. Three were statistically significant. Risk estimates (3) ranged from 0.4–3.9 for traffic-related air pollutants (i.e., NO2 and benzene). Risk estimates (6) ranged from 0.9–4.7 for various metrics of traffic exposure (e.g., traffic density, distance to roadway, traffic counts). |
The current state of the evidence is weak; cannot form a conclusion on the association between TRAP exposure and increased risk of childhood leukemia. | AMSTAR 2: Moderate quality Study quality assessment: Used their own set of criteria, including indices such as: >200 cases, low potential for selection bias, precise address, matching. Confounders: Most studies adjusted or matched for at least age and sex, and half provided further matching or adjustment. Discussion: Review authors discussed sources of bias and heterogeneity of included studies, namely selection bias, method of exposure assessment, differential and nondifferential misclassification of exposure, variation in exposure levels, and confounding. |
D.2 Adult Lung and Breast Cancers
| Author | Purpose/Objective | Search Period | Number of Primary Studies/Breakdown of Primary Studies | Main Results | Authors' Conclusions | Other Considerations |
|---|---|---|---|---|---|---|
| Systematic Reviews with Meta-Analysis (SR-MA) on Lung Cancer | ||||||
| Tsoi and Tse 2012 | SR-MA that examined the association between diesel exhaust-exposed professional driving and risk of lung cancer. | 1996 –2011 | 20 studies, 19 included in MA Studies included in MA:
Professional driver occupations included bus, truck, and taxi drivers, and most of the study subjects were male. |
Lung cancer and professional driving: pooled RR = 1.21 (95% CI: 1.10–1.32); I2 = 68.6, p < 0.00001 Lung cancer and professional driving (smoking-adjusted): pooled RR = 1.18 (95% CI: 1.05–1.33); I2 = 48.0, p = 0.03 |
Exposure to diesel exhaust is associated with an 18% excess risk of lung cancer in professional drivers, after adjustment for the confounding effect of smoking. | AMSTAR 2: High quality Data extraction for MA: Authors extracted both the smoking-adjusted and -unadjusted effect estimates separately. Study quality assessment: Used Downs and Black checklist. Confounders: Provided details on confounding adjustment for smoking. Heterogeneity: If heterogeneity present (Q-test p > 0.1, I2 > 50%), used random-effect, else used fixed-effect. Subgroup analyses: Performed subgroup analyses by employment duration (≥10 y), study design, smoking adjustment, study quality. Sensitivity analyses: Type of driver, excluded studies without a clear definition of employment duration of professional divers; suggested robust effect estimates. Publication bias: Funnel plot was relatively symmetrical, suggesting little evidence of publication bias. |
| Chen et al. 2015 | SR-MA that examined the association between TRAP exposure, through ambient exposure or professional driving, and risk of lung cancer. | Up to Dec 2013 | 36 studies, all included in MA Studies included in MA for ambient exposure (14):
Studies included in MA for professional drivers (22):
STROBE criteria classification: 22 level A, 14 level B |
Lung cancer and NO2: pooled OR = 1.06 (95% CI: 0.99–1.13); I2 = 59%, p = 0.05 Lung cancer and NOX: pooled OR = 1.04 (95% CI: 1.01–1.07); I2 = 46%, p = 0.17 Lung cancer and SO2: pooled OR = 1.03 (95% CI: 1.02–1.05); I2 = 0%, p = 0.48 Lung cancer and PM2.5: pooled OR = 1.11 (95% CI: 1.00–1.22); I2 = 64%, p = 0.02 Lung cancer and professional driving: pooled OR = 1.22 (95% CI: 1.14–1.31); I2 = 65%, p < 0.00001 |
Exposure to traffic-related NO2, NOX, SO2, and PM2.5 is associated with increased risk of lung cancer. Traffic-exposed professional driving is significantly associated with risk of lung cancer. |
AMSTAR 2: High quality Study quality assessment: Use of STROBE statement checklist cohort, case-control, and cross-sectional studies, version 4. Excluded studies classified as level C (i.e., < 60% criteria fulfilled). Confounders: Provided full details on confounding adjustment. Heterogeneity: If evidence of heterogeneity (p > 0.10, I2 > 50%), used random-effects, else used fixed-effects. Subgroup analyses: Performed subgroup analyses in studies on professional drivers by outcome endpoint (incidence, mortality). Sensitivity analyses and publication bias not done. |
| Hamra et al. 2015 | SR-MA that examined the association between TRAP exposure and adult lung cancer. | Up to Jan 2014 | 23 studies, 20 included in MA Studies included in MA:
7 studies on traffic metrics (e.g., volume of traffic); pooled analysis not conducted for these studies |
Lung cancer and NO2 (10 µg/m3 increase): pooled RR = 1.04 (95% CI: 1.01–1.08); I2 = 72.8%, p = 0.000 Lung cancer and NOX (10 µg/m3 increase): pooled RR = 1.03 (95% CI: 1.01–1.05); I2 = 33.3%, p = 0.202 |
TRAP exposure is associated with increased risk of lung cancer, most consistently when NO2 is used as the proxy measure for TRAP. | AMSTAR 2: Moderate quality Data extraction for MA: Authors used the "most effectively" adjusted effect estimates in their MA (i.e., least biased effect estimates, which were often the main models), and chose estimates from the single-pollutant models. Confounders: Provided details on confounding adjustment; all studies adjusted for age and sex at a minimum. Heterogeneity: Used random-effects model. Subgroup analyses: Reported stratified analyses by continent, exposure assessment method (fixed-site monitor, other), and confounder adjustment (smoking status, SES, education, occupation). Sensitivity analyses: Influence analyses (excluding one study at a time); suggested robust summary estimates. Publication bias: Funnel plot was visually asymmetrical, trim-and-fill analyses suggest 5 hypothetical studies are needed to make plot symmetrical. No study quality assessment done. |
| Systematic Reviews on Breast Cancer | ||||||
| White et al. 2018 | Systematic review that examined the association between air pollution (indoor, outdoor, TRAP) and risk of breast cancer. | Not specified | 12 studies on TRAP
|
Breast cancer and TRAP: The 6 cohort studies provided 9 distinct effect estimates, of which 5 were positive and borderline significant, 3 were positive and insignificant, and 1 demonstrated no association. Risk estimates ranged 0.90-1.16 based on modelled exposures to NO2, NOX, or B[a]P, and 1.14-1.60 for traffic metrics. The 6 case-control studies provided 6 distinct effect estimates, of which 4 were positive and borderline significant and 2 were positive and insignificant. Risk estimates ranged 1.08-1.32 for modelled NO2, 0.82-2.58 for modelled B[a]P, and 0.89-1.29 for traffic count. |
TRAP exposure is associated with increased risk of breast cancer. Studies using NO2 or NOX as a proxy measure for TRAP exposure indicated the strongest results. | AMSTAR 2: Moderate quality Discussion: Authors discussed sources of bias and heterogeneity of included studies (e.g., menopausal status of included women). No study quality assessment done. Did not provide details on confounding adjustment. |
Footnotes
- Footnote 1
-
A systematic review uses systematic methods to identify, appraise, and qualitatively synthesize the findings of primary research.
- Footnote 2
-
A systematic review–meta-analysis is a systematic review that quantitatively synthesizes the findings of primary research using meta-analysis techniques.
- Footnote 3
-
A scoping review systematically maps the available literature on a broad topic, identifying key concepts, types and sources of information, and gaps in the research.
- Footnote 4
-
Six of the seven articles identified from the literature update were considered relevant for the umbrella review and the remaining article was considered for the biological evidence review.
- Footnote 5
-
Borderline significance: for risk estimates > 1, 0.9 ≤ lower 95% confidence limit ≤ 1.0; for risk estimates < 1, 1.0 ≤ upper 95% confidence interval ≤ 1.1.