
Distribution of French-speaking immigrants outside Quebec
Download the report: Distribution of French-speaking immigrants outside Quebec (PDF, 265 KB)
Definition: For the purpose of this study, French-speaking immigrants living outside Quebec comprise those with only French as their first official language spoken (French FOLS) and those with both French and English (French-English FOLS). When French FOLS and French-English FOLS immigrants are examined as separate sub-populations of French-speaking immigrants in Canada, differences emerge in the representation and composition of the French-speaking immigrant population outside Quebec.
Proportion of French-Speaking Immigrants Outside Quebec
According to the 2011 National Household Survey (NHS), French-speaking immigrants outside Quebec accounted for nearly 17% of the total 696,000 immigrants in Canada with French as their first official language (including both French FOLS and French-English FOLS), while 83% were concentrated in the province of Quebec. French-speaking immigrants outside of Quebec also constituted only 2% of immigrants in Canada living outside Quebec in 2011.
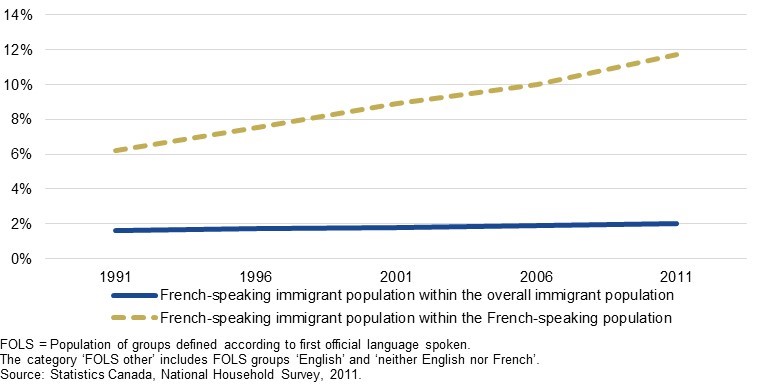
The smaller proportion of French-speaking immigrants outside Quebec has been a consistent pattern over the last two decades. As Chart 1 shows, between 1991 and 2011, the percentage of French-speaking immigrants living in the provinces and territories other than Quebec remained at roughly 17%. Likewise, French-speaking immigrants have regularly made up a small proportion of the overall immigrant population outside Quebec, but moderately increased their relative share within the immigrant population as a whole, from 1.6% in 1991 to 2.0% in 2011.
Outside Quebec, French-speaking immigrants make up a comparably smaller proportion of the overall French-speaking population, accounting for 11.7% in 2011. However, there has been a steady and sizeable increase in the representation of French-speaking immigrants within the French-speaking population, with their relative weight rising 5.5 percentage points between 1991 and 2011, from 6.2% to 11.7% (Chart 1).
Changes in official language composition of French-speaking immigrants
In 2011, French-English FOLS made up 52% of all French-speaking immigrants, while immigrants with only French FOLS accounted for 48%. Between 2006 and 2011, the number of immigrants with French as their FOLS grew by 16,000, representing an increase of 22.3%. On the other hand, the French-English FOLS immigrant group outside Quebec only increased by 3,000, reflecting a growth rate of 4.3%.
Weight within immigrant and French-speaking populations varies according to province.
French-speaking immigrants living in the provinces and territories outside Quebec are also unevenly distributed. The vast majority are in Ontario, where close to 70% of French-speaking immigrants lived in 2011. The second largest share is found in British Columbia, home to roughly 14%, followed by Alberta in third, with roughly 10%. The distribution of French-speaking immigrants reflects the distribution of the overall immigrant population in Canada, with these three provinces also being home to the largest share of immigrants residing outside Quebec in 2011.
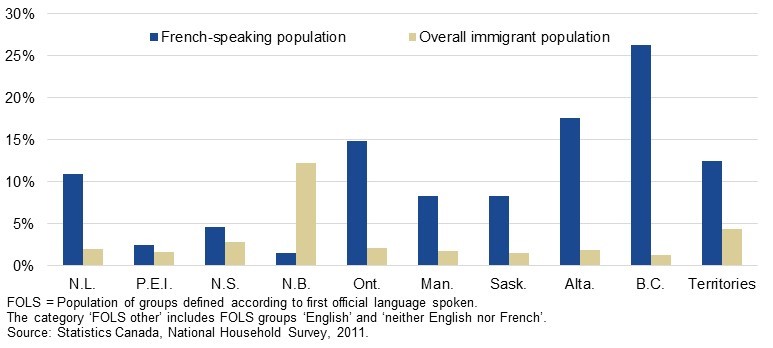
As Chart 2 demonstrates, the relative weight of French-speaking immigrants within the immigrant population is low in the provinces where the majority live. In 2011, French-speaking immigrants accounted for 2.1% of the immigrant population in Ontario, 1.3% in British Columbia, and 1.8% in Alberta. In comparison, French-speaking immigrants accounted for the largest share of the immigrant population in New Brunswick, at 12.2% in 2011.
The three provinces (Ontario, British Columbia and Alberta) with the largest French-speaking immigrant populations are also the provinces where immigrants for whom French is an official language make up the largest proportion of the overall French-speaking population (Chart 2). However, French-speaking immigrants represented 26.2% of British Columbia’s total French official language population in 2011, despite Ontario being the province with the largest French-speaking immigrant population outside of Quebec (Chart 2). The weight of French-speaking immigrants in the French-speaking population has also been increasing over time in all three provinces, with the largest increase also occurring in British Columbia (17.4% in 1991 vs. 26.2% in 2011).
Majority live in three urban centers: Toronto, Ottawa and Vancouver
In 2011, French-speaking immigrants in Ontario and British Columbia accounted for roughly 81% of the French-speaking immigrant population outside Quebec, can be attributed to the large urban Centers in these provinces. Nearly 75% of immigrants outside Quebec with French as an official language lived in Toronto, Ottawa and Vancouver.
The cities of Toronto, Ottawa and Vancouver are among the urban areas with the largest populations of immigrants, reflecting the high concentration of French-speaking immigrants as well. Within these cities, in 2011, French speaking immigrants accounted for the largest proportion of the French-speaking population in the city of Toronto (43%), followed by Vancouver (33%) and then Ottawa (15%).
Chart 1: Proportion of French-speaking immigrant population within the French-speaking population and within the overall immigrant population, Canada less Quebec, 1991-2011
Text version: Chart 1: Proportion of French-speaking immigrant population within the French-speaking population and within the overall immigrant population, Canada less Quebec, 1991-2011
| French-speaking immigrant population within the overall immigrant population | French-speaking immigrant population within the French-speaking population | |
|---|---|---|
| 1991 | 1.6% | 6.2% |
| 1996 | 1.7% | 7.5% |
| 2001 | 1.8% | 8.9% |
| 2006 | 1.9% | 10.0% |
| 2011 | 2.0% | 11.7% |
FOLS = Population of groups defined according to first official language spoken.
The category ‘FOLS other’ includes FOLS groups ‘English’ and ‘neither English nor French’.
Source: Statistics Canada, National Household Survey, 2011.
Chart 2: Proportion of French-speaking immigrants within the French-speaking population and within the overall immigrant population by province, Canada less Quebec, 2011
Text version: Chart 2: Proportion of French-speaking immigrants within the French-speaking population and within the overall immigrant population by province, Canada less Quebec, 2011
| French-speaking population (%) | Overall immigrant population (%) | |
|---|---|---|
| N.L. | 10.9% | 2.0% |
| P.E.I. | 2.4% | 1.6% |
| N.S. | 4.6% | 2.8% |
| N.B. | 1.5 | 12.2 |
| Ont. | 14.8% | 2.1% |
| Man. | 8.3% | 1.7% |
| Sask. | 8.3% | 1.5% |
| Alta. | 17.5% | 1.8% |
| B.C. | 26.2 | 1.3 |
| Territories | 12.4% | 4.3% |
FOLS = Population of groups defined according to first official language spoken.
The category ‘FOLS other’ includes FOLS groups ‘English’ and ‘neither English nor French’.
Source: Statistics Canada, National Household Survey, 2011.
Source: Houle, R., Pereira, D., & Corbeil, J. P. (2014). Statistical Portrait of the French-speaking Immigrant Population Outside Quebec (1991-2011). Ottawa: CIC.