
Immigration and housing prices across municipalities in Canada
Feng Hou is with the Social Analysis and Modelling Division, Analytical Studies and Modelling Branch, at Statistics Canada.
Évamé Koumaglo and Haozhen Zhang are with the Research and Knowledge Mobilization Division, Research and Data Branch, at Immigration, Refugees and Citizenship Canada.
June 20, 2025
This study was jointly conducted by Immigration, Refugees and Citizenship Canada and Statistics Canada.
Project reference number: R6-2023
Table of Contents
Abstract
The potential impact of immigration on housing prices is a pressing concern in major immigrant-receiving countries. The complex interplay between immigration and housing prices is particularly noticeable in Canada, characterized by its high immigration level, the concentrated settlement patterns of immigrants, and the large variation in housing price trends across local housing markets. This study analyzes the empirical relationship between the influx of new immigrants and housing prices in Canada from 2006 to 2021, drawing on municipal-level panel data from the long-form census. The estimates employ first-difference fixed-effects instrumental variable models to address possible bias from omitted variables and endogeneity.
The modeling results indicate that, over the study period, the rise in the influx of new immigrants, who landed in Canada within five years, was associated with 11% of the rise in both median house values for owner-occupied properties and median monthly rental rates across municipalities with populations over 1,000. This association tended to be more pronounced in larger municipalities. Furthermore, the relationship between immigration and housing prices varied with time and by region, thus policy assessments of immigration impacts should consider both the spatial and temporal dimensions.
Introduction
The potential impact of immigration on housing prices is a pressing concern in major immigrant-receiving countries. This issue often sparks intense debate, especially when a sharp increase in immigration coincides with significant rises in housing prices. At the heart of this debate lies the tension between supply and demand and the role that public policy can play. While the ability of policymakers to influence the housing supply may be limited, they wield greater control over immigration levels. There is a broad consensus in the literature that immigration does indeed affect housing prices, but the magnitude and direction of this impact can differ markedly from one country to another, and even within different regions of the same country, depending on factors such as the level of immigration, the geographic distribution of immigrants, and the elasticity of local housing supply (Cochrane & Poot, 2021). The complex interplay between immigration and housing prices is particularly noticeable in Canada, characterized by its high immigration level, the concentrated settlement patterns of immigrants, and the large variation in housing price trends across local housing markets.
In Canada, the influence of immigration on housing prices has become an important topic in public discourse. Some argue that high housing prices and low housing affordability have persisted in Canada for decades, even during periods of low immigration levels. Many challenges in housing affordability stem from a mix of economic, policy, and market-related factors (see Bernhard, 2023; Filipowicz & Lafleur, 2023). Influences beyond immigration, such as supply constraints, low interest rates, and speculative investment, play pivotal roles in shaping housing market dynamics. Addressing these complex factors often takes considerable time. Furthermore, immigration can play a crucial role in mitigating labour shortages within the construction industry, with skilled immigrants such as construction workers, engineers, architects, and tradespeople filling gaps in the labour market and helping to build new homes and residential developments.
A counterargument posits that the substantial rise in immigration contributes to the escalation of housing prices (see Caranci, Orlando, & Sondhi, 2023; Marion, 2023). The rapid population growth from immigration can intensify the demand for housing, especially during periods of existing shortages and in urban centers where new immigrants are concentrated. This increased demand can strain the existing housing stock, potentially leading to shortages and heightened competition among renters and homebuyers (Fortin, 2023). Notably, with many newcomers depending on the rental market, a sizeable influx can escalate demand for rental properties, affecting vacancy rates and possibly causing rent increases in certain regions (Bank of Canada, 2024).
The ongoing debates on immigration’s role in housing price dynamics often lack definitive empirical evidence, and establishing such evidence is a challenging task. It is difficult to disentangle the specific impact of immigration from a multitude of factors that shape housing markets. Regional variations in housing markets are substantial, and the connection between immigration and housing prices can vary widely due to local economic conditions, housing supply constraints, and other region-specific factors. Additionally, immigrants are attracted to areas with strong economic performance and promising housing market potential, suggesting that rising housing prices may be more a side effect of a flourishing economy, which draws immigrants, rather than a direct consequence of immigration.
This study aims to enhance our understanding of the empirical relationship between immigration and housing prices in Canada. The research focuses on two key outcomes: changes in median house values for owned homes and changes in median rents among rental dwellings. It investigates the empirical association between these outcomes and the growth in new immigrants.Footnote 1
Utilizing municipal-level panel data from the 2006, 2016, and 2021 censuses, as well as the 2011 National Household Survey, this study departs from many previous studies by focusing on the changes in the number of new immigrants over time, rather than their inflows at a single time point. Employing a first-difference fixed effects instrumental variables (FE-IV) model, this study advances the econometric analysis of how housing markets react to immigration. It addresses methodological challenges such as omitted variables and the endogeneity of immigrant inflows, as well as the selective distribution of immigrants across different areas and unobserved factors that may impact housing price changes within specific municipalities. The analysis is conducted nationally, provincially, and across municipalities of different population sizes. This approach not only discerns potential regional variation in the link between immigration and housing prices but also provides insights for policy discussions at different levels of government.
The next section of this article provides an overview of prior empirical studies investigating the influence of immigration on housing prices. It is followed by a section discussing the data, measures, and methods employed in the analysis. The subsequent section presents the empirical results. The article concludes with a summary and discussion of the key empirical findings.
Previous studies on the effects of immigration on housing prices
Numerous factors influence the demand and supply of housing, subsequently affecting housing prices (Cochrane & Poot, 2021). Factors like population growth, mortgage rates, household incomes, unemployment rates, age composition, and location preferences can affect housing demand through various channels (Cochrane & Poot, 2021). For instance, immigration-driven population growth can stimulate housing demand, while low mortgage rates increase access to housing finance, thus driving up demand. Preferences for local amenities, such as parks and schools, can also boost housing demand (Saiz, 2007; CMHC, 2021, 2023).
On the supply side, construction costs, labour shortages, and housing regulations can play important roles. Rising construction costs or a shortage of construction workers would limit new home supply, while restrictive land-use rules can deter developers from initiating new housing projects (Paciorek, 2011; CMHC, 2021, 2023; Khan et al., 2021).
In housing markets where supply lags behind demand, housing prices tend to increase. The magnitude and duration of the price or rent hikes depend on the rate of vacancy in existing units or construction of new ones. Ultimately, a new equilibrium is reached in the long run (Cochrane & Poot, 2021). These demand and supply factors often occur simultaneously and are interrelated. This complexity makes it challenging to isolate the main contributor to housing price changes.
In Canada, very few empirical studies have examined the impact of immigration on housing prices. Ley and Tutchener (2001) found a positive correlation between housing prices and immigration in Toronto and Vancouver from 1971–1996. Akbari and Aydede (2012) estimated a small effect of immigration on housing prices at the national level. Using census data from 1996–2006, they showed that a 1% increase in the percentage of immigrants in the total population of a census division was associated with an increase in housing prices of 0.10% to 0.12%. Latif (2015) used provincial-level panel to study the effect of immigration on rents and found that a 1% increase in the number of immigrants in a province increased the average rent by 0.14% to 0.17% over the 1983–2010 period.
Studies in other countries show mixed results regarding the relationship between immigration and housing costs. In the United States, several papers found that an increase in the percentage of immigrants in local housing markets positively impacted rents and house prices, with an effect between four and thirteen times higher than those observed in Canada (Ottaviano & Peri, 2005; Saiz, 2007; Mussa et al., 2017). Conversely, in the United Kingdom, Sá (2015) found that inflows of immigrants were associated with lower housing prices, while Aitken (2015) observed a positive effect on rents. In New Zealand, Stillman and Maré (2008) reported declining housing prices with rising immigration.
The inconsistent findings in previous studies regarding the impact of immigration on housing markets partly stem from methodological challenges as summarized by Saiz (2007). First, an observed correlation between immigration inflows and housing costs may be spurious if both factors are affected by omitted variables. For instance, immigrants may gravitate toward cities with strong economic growth, and economic growth can also drive house value appreciation. In this case, the impact of immigration on housing prices may be overestimated. Second, immigration inflows might prompt non-immigrants to relocate, thus dampening housing demand and leading to an underestimation of immigration’s impact. Third, immigration inflows could be endogenous if immigrants prefer cities with more affordable housing, biasing the association between immigration and housing prices downward.
Researchers have employed various econometric techniques to tackle these methodological challenges. Some studies have utilized natural experiments to address endogeneity concerns (Pavlov and Somerville, 2020; Saiz, 2003). For instance, Saiz (2003) compared rent increases in Miami after the Mariel boatlift to cities that did not experience significant immigrant influxes. Similarly, Pavlov and Somerville (2020) examined how the unexpected suspension of a popular investor immigration program in Canada was associated with changes in house prices in Vancouver neighbourhoods that were likely favoured by investor immigrants.
Other studies have applied instrumental variables (IV) estimation to address the possible endogeneity of immigrants’ locational choices (Ottaviano & Peri, 2006; Saiz 2007; Sharpe, 2019; Unal, Hayo & Isil Erol, 2022). One commonly used instrument is the shift-share approach, which leverages the local shares of immigrants in the past and national shifts in the size and source-country composition of new immigrants as a source of exogenous variation. The validity of this shift-share approach depends on whether the past locational choices of immigrants are correlated with unobserved local factors that may affect future housing prices (Jaeger, Ruist, & Stuhler, 2018; Sharpe, 2019). To alleviate such validity concerns, Sharpe (2019) controlled for additional city-specific initial conditions that might have both attracted immigrants in the past and predisposed cities to future growth in a model with the shift-share instrument.Footnote 2 His analysis also showed that the results of an IV model with controls for city-specific initial conditions are similar to those derived from a fixed effects (FE) model.Footnote 3 Following a modeling strategy initially used by Burchardi, Chaney, and Hassan (2019), Bian, Coulson, and Sun (2023) made further improvement by estimating a fixed effects instrumental variables (FE-IV) model. While the IV estimator aims to mitigate bias due to endogeneity of immigrant inflows to a specific city, the fixed effects component controls for city-specific initial conditions and other omitted variables that may affect city-specific changes in housing prices.
Using municipal-level panel data, this study relies on first-difference FE-IV models to address the challenges of omitted variables and endogeneity. With a few exceptions (Bian, Coulson, & Sun, 2023; Sá, 2015), previous studies on the impact of immigration using local housing market panel data have applied first-difference models with or without IVs, or an IV estimator without fixed effects (see Akbari & Aydede, 2012; Saiz 2007; Sharpe, 2019; Tyrcha, 2020), or IV estimators with fixed effects but at a broader geographic level rather than at the local housing market level (see Peri & Shih 2013; Unal, Hayo & Isil Erol, 2022).Footnote 4 Therefore, this study adopts the most robust analytical approach in the literature.
Additionally, this study follows best practices in examining the association between changes in new immigrant inflows (i.e., the difference in the number of new immigrants between time t and time t-5) and changes in housing prices. This differs from most previous studies that examine the association between the inflow of new immigrants (the number of new immigrants in time t)Footnote 5 and changes in housing prices. A city may consistently receive a larger number of new immigrants, but as long as its housing supply growth adjusts to accommodate this steady demand, it may not necessarily undergo more changes in housing prices than cities that traditionally receive fewer new immigrants. However, large changes in the influx of new immigrants relative to previous periods, whether an increase or decrease, could disturb the balance between housing demand and supply, at least in the short term. Consequently, this imbalance may lead to changes in housing prices. This nuanced approach to analyzing immigrant impacts on housing prices has been explored only in a select few studies (see Peri & Shih, 2013; Sá, 2015; Saiz, 2007 in one model specification).
Data, measures and methods
Data
This study is based on municipal-level panel data derived from the 2006, 2016 and 2021 Census of Population and the 2011 National Household Survey (NHS). The analysis also uses 2001 census data for the purpose of constructing instrumental variables. Municipalities (Census subdivisions [CSDs])Footnote 6 are chosen as the unit of analysis because they represent local housing markets where municipal governments play a large role in affecting housing supply and demand through zoning regulations, land-use planning, development approvals, infrastructure development, affordable housing programs and property taxation.
The boundaries and statuses of municipalities can change over time due to municipal restructuring in response to demographic and economic shifts and administrative needs. To create municipal-level panel data, this study harmonized CSD boundaries by applying 2021 CSD boundaries to previous censuses using concordance files at the dissemination area level, created by Statistics Canada.
With consistent boundaries, each municipality has four repeated measures of outcomes and explanatory variables from four census years. The changes in these variables between two adjacent census years are used in the analysis. The three panels of change data —2006 to 2011, 2011 to 2016, and 2016 to 2021—are pooled together in regression analysis. While taking the difference between adjacent censuses accounts for the tendency of immigrants to settle in municipalities with high housing prices, pooling the three panels of changes in regression analysis allows the inclusion of fixed effects for changes unique to specific municipalities. This approach addresses the possibility that immigrants may be more likely to settle in municipalities with growing economic opportunities and the associated potential for housing price increases. The analytical techniques are explained in the Methods section below.
The analysis excludes CSDs that had a population less than 1,000 in two adjacent census years to improve the reliability of municipal-level measures.Footnote 7 There were 1,939 CSDs that met the minimum population size requirement in the 2006 to 2011 period, 1,949 CSDs in the 2011 to 2016 period, and 1,939 CSDs in the 2016 to 2021 period. The pooled dataset includes 5,827 combinations of CSDs and periods.
Measures
Based on CSDs with consistent boundaries, this study creates municipal-level housing and sociodemographic variables from each census. Two outcome variables are median house values (in 2020 constant dollars) for owner-occupied dwellingsFootnote 8 and median monthly rents (in 2020 constant dollars) for rental dwellings.Footnote 9 The main variable of interest is the number of new immigrants who arrived in Canada within the past five years.
The logarithmic transformation of these measures is used in the analysis of the association between housing prices and immigration. Such a transformation can make the distribution more symmetric, reduce the influence of outliers, and linearize the relationship between housing prices and immigration.
Six control variables include the initial share of the Canadian-born population in the municipality, the change in the number of dwellings, the change in the percentage of seniors aged 65 or older in the municipal population, the change in the percentage of people in the 19 to 34 age groups in the municipal population, the change in median adult-equivalent adjusted economic family incomeFootnote 10 (in 2020 constant dollars), and the change in unemployment rates.
The initial share of the Canadian-born population controls for the tendency of new immigrants to be attracted to cities with large, established immigrant communities. The changes in the other five variables have been used in previous studies to capture changes in the housing demand and supply (see Akbari & Aydede, 2012). An increase in the number of dwellings could reflect an increase in both housing supply and demand. While more dwelling units add to the available housing stock, an increase in dwelling units may be a response to rising demand in housing development activities. In a slow or weak real estate market, developers may anticipate lower demand for new properties and thus delay or scale back construction. An increase in the population share of seniors is likely associated with reduced housing needs since seniors tend to downsize. Conversely, an increase in the share of young adults in a local community may increase housing demand. When young adults leave their parents’ homes and form their own households, they need to either find rental accommodations or purchase homes. The rising level of family income in an area reflects increased aggregate purchasing capacity. High unemployment rates can erode consumer confidence, leading to reluctance to make major purchases like homes.
Methods
The analysis begins by examining simple correlations between changes in housing prices (median house values and monthly rents) and changes in the number of new immigrants between two consecutive censuses (which occur at five-year intervals) at the municipal level. Subsequently, the analysis provides an intuitive description of these correlations by listing changes in housing prices and the number of new immigrants in major municipalities.
Multivariate models are used to control for factors that may confound the association between housing prices and the growth in the number of new immigrants. The multivariate estimates are based on the following first-difference model, which also controls for changes in unmeasured municipality-specific attributes between two censuses:
(1)
Where ΔYi,p refers to changes in log median house values or log median rents in municipality i in period p, ΔNEWimi,p refers to changes in the log number of new immigrants, and ΔZj,i,p refers to changes in the selected covariate j. Period dummies (γp) capture national-level time trends and aggregate shocks affecting house values and rents nationwide, such as changes in mortgage rates and macroeconomic conditions. The municipality fixed effects (γi) account for changes in unobserved municipality characteristics correlated with changes in house values and rents.
While the first differencing of the outcomes and explanatory variables eliminates the influence of municipality’s time-invariant characteristics (such as municipal fees, development charges, land availability) that are correlated with house values or rents, the municipality fixed effects deal with the possible impact of changes in some unmeasured characteristics of a particular municipality. For instance, a municipality may change its regulations regarding the development and use of land, which could facilitate or impede the supply of new housing.
The coefficient β1 provides an estimate of the correlation between changes in log house values and changes in the log number of new immigrants after adjusting for municipality-specific changes, aggregate time trends, and the selected covariates. It can be interpreted approximately as the percent increase in house values for every 1% increase in the number of new immigrants. For example, if β1 = 0.032, a 1% increase in the number of new immigrants is associated with 0.032% increase in median house values.
The above modeling approach leverages the panel data structure, making efficient use of repeated observations for each municipality. Although this modeling approach provides estimates that are superior to those of an OLS model or a first-difference model, it is not immune to biases resulting from endogeneity and is therefore insufficient to identify a causal relationship between increases in the number of new immigrants and housing prices. For instance, municipalities with slower growth in housing prices may be more attractive to individuals who are able and willing to move for more affordable housing.
To deal with possible endogeneity, this study follows the shift-share approach used in the studies by Bian, Coulson, and Sun (2023) and Burchardi, Chaney, and Hassan (2019), and creates instruments for the change in the number of new immigrants.
The first step derives the expected number of new immigrants from source region rFootnote 11, arriving in municipality i, in the previous five years before census year t, using the following regression:
(2)
Here, represents the geographic distribution of all immigrants by source region across municipalities five years before census year t. IMr,i,t-5 is the number of all immigrants from region r, living in municipality i in the previous census, while IMt-5 is the number of all immigrants living in Canada in the previous census. NEWimr,g-i,t is the number of new immigrants arriving in the province (g) during the previous five years minus the number of new immigrants arriving in the municipality i. Xi,t-5 represents some characteristics of a municipality five years before the census year t that may affect its attraction to new immigrants, including median family income and population density. γr denotes immigrant source region fixed effects, while γd denotes the fixed effects of the census division in which a municipality is located.
The above regression model assumes that the number of new immigrants from source region r arriving in municipality i in the five years preceding census year t is jointly determined by the geographic distribution of earlier immigrants and the total number of new immigrants from a source region arriving in the province, and the tendency of new immigrants from a source region to prefer certain initial municipal conditions. The predicted number of new immigrants in year t should not be affected by changes in housing prices after year t.
In the second step, the expected numbers of new immigrants by source region and municipality are aggregated to the municipality level, i.e., .
The difference between two census years in the log of the expected number of new immigrants, log (E_Newimi,t+5) - log (E_Newimi,t), is used as the instrument for ΔNEWimi,p in equation (1) in a two-stage least squares model. In the first-stage model for pooling data from three periods at the national level, the F-value is 43. In analyses for subsets of the data by different municipal population size groups, the first-stage model F-value ranges from 15 to 86. However, for subset models by province or region, the first-stage model F-value is generally lower than 10, indicating a weak instrument. For this reason, IV models are not estimated at the provincial level.
The model estimation is conducted both with and without weights. In weighted models, the average population size of each municipality in two adjacent censuses is used as the weight. The unweighted regression assumes that the theoretical effect of immigration is the same across all municipalities (Saiz, 2007). If the effect varies with municipality size, the results from unweighted and weighted regressions will be different. In that case, from a policy perspective, the weighted results are more meaningful because new immigrants tend to settle in large municipalities.
In the regression analysis, standard errors are clustered by municipality to account for serial correlation within a municipality.
Empirical findings
Correlations between changes in housing prices and population growth by immigration status
As shown in Table 1, the correlations between changes in housing prices and population growth of new immigrants varied across time periods. Changes in median house values across municipalities were positively and significantly correlated with changes in the log number of new immigrants in the 2006–2011 and 2016–2021 periods, but this correlation was negative and significant in the 2011–2016 period. When three five-year periods were pooled together, changes in median house values had a positive and moderate correlation with changes in the log number of new immigrants.
Similar to the pattern for house values, changes in rents were positively and significantly associated with increases in the log number of new immigrants in the 2006–2011 and 2016–2021 periods, but in the 2011–2016 period the correlation was much weaker. When pooling the three periods, changes in rents were positively correlated with the growth in new immigrants.
The correlation between changes in median house values and growth in the number of new immigrants is visually presented in Chart 1 for the 2006–2011 period, Chart 2 for 2011–2016 period, and Chart 3 for the 2016–2021 period among municipalities with a population of at least 100,000. The three charts reveal that the correlations between changes in log median house values and changes in the log number of new immigrants were mostly linear, justifying the choice of a linear function between the outcome variable and the focal explanatory variable in the regression models as specified in the Method section. These charts also showed that the variations in both changes in median house values and growth in new immigrants were smaller in the 2011 to 2016 period than in the other two periods, which was likely the reason for the weak correlation between the two variables in the 2011–2016 period.
Table 1
Simple correlation between changes in housing prices and changes in the number of new immigrants across municipalities with at least 1,000 population, 2006 to 2021
| Change in log number of new immigrants (correlation coefficient) |
||||
|---|---|---|---|---|
| 2006 to 2011 | 2011 to 2016 | 2016 to 2021 | pooled three periods | |
| change in log median house values | 0.267Table footnote *** | -0.122Table footnote *** | 0.278Table footnote *** | 0.163Table footnote *** |
| change in log median rents | 0.204Table footnote *** | 0.047Table footnote * | 0.159Table footnote *** | 0.145Table footnote *** |
Note: There are 1,939 municipalities for the 2006 to 2011 period, 1,949 for the 2011 to 2016 period, and 1,939 for the 2016 to 2021 period, and 5,827 combinations of municipalities and periods for the pooled data.
Sources: Statistics Canada, 2006, 2016 and 2021 Census of Population, and 2011 National Household Survey
Changes in the log number of new immigrants and changes in median house values in municipalities with over 100,000 population, 2006 to 2011
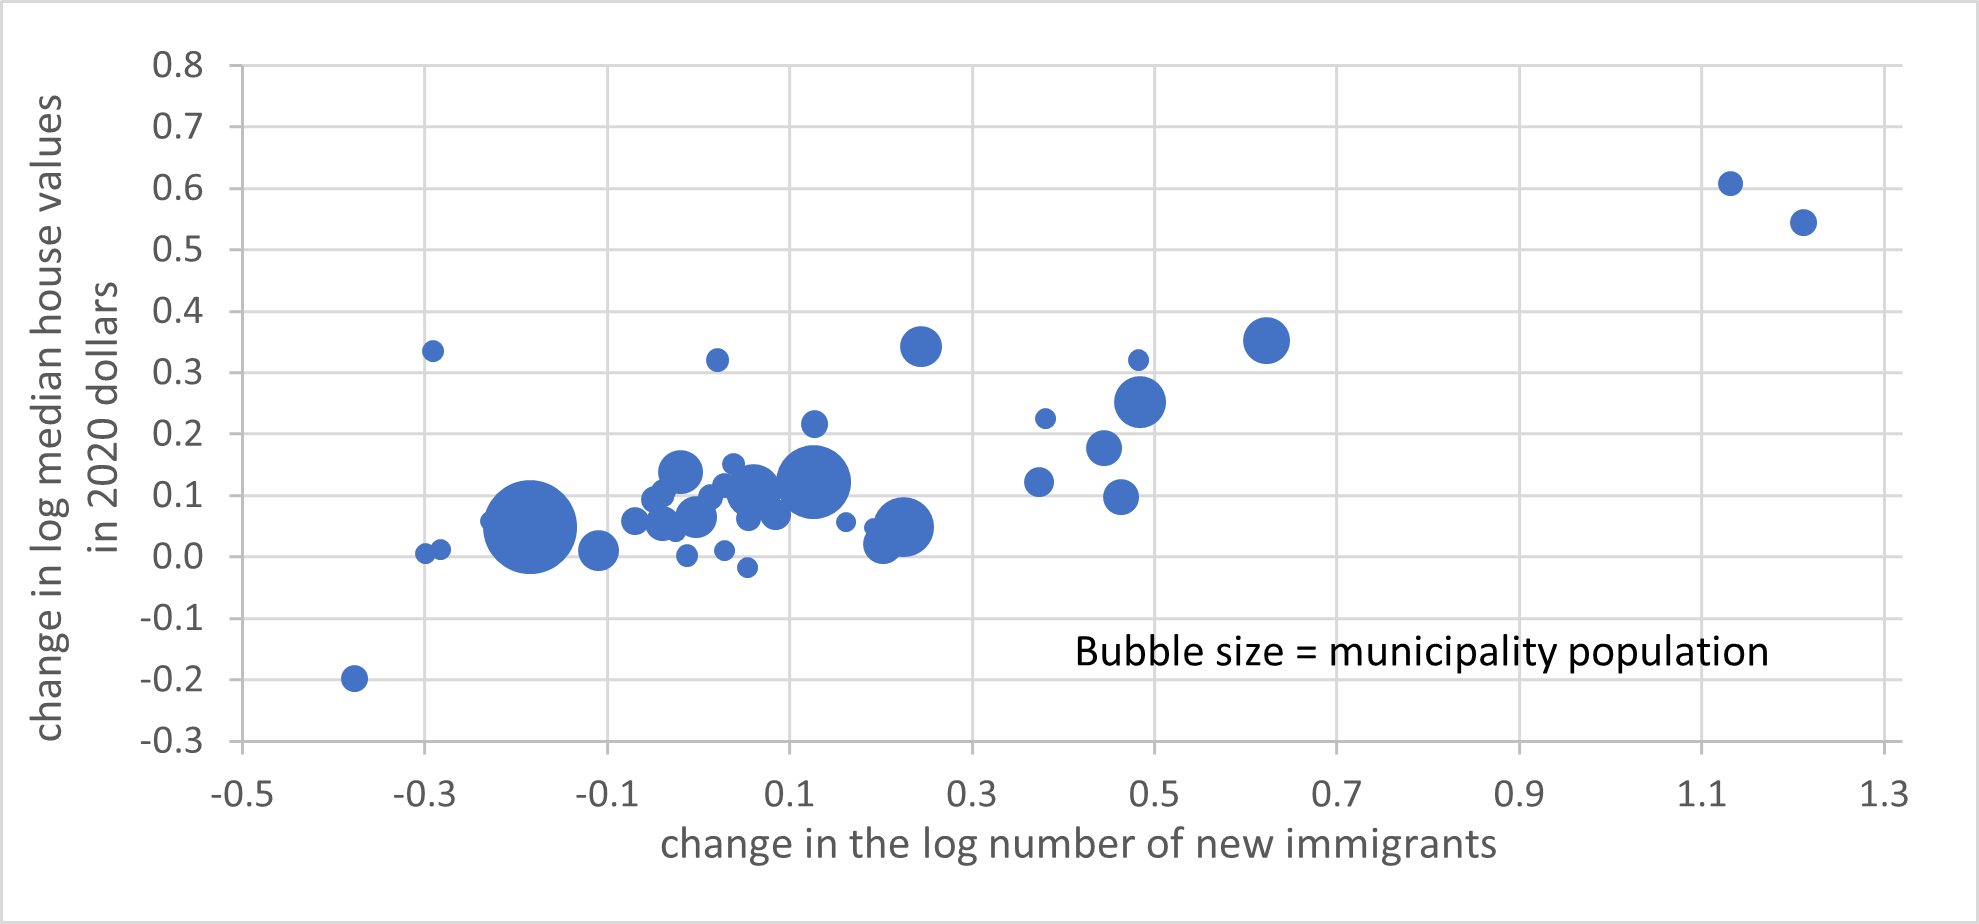
Sources: Statistics Canada, 2006 Census of Population and 2011 National Household Survey
Text version of chart 1
| change in the log number of new immigrants | change in log median house values in 2020 dollars | Municipality population |
|---|---|---|
| 1.211 | 0.544 | 218,319 |
| 1.131 | 0.608 | 189,742 |
| 0.623 | 0.352 | 649,996 |
| 0.484 | 0.251 | 796,242 |
| 0.482 | 0.320 | 135,835 |
| 0.463 | 0.097 | 383,755 |
| 0.444 | 0.177 | 392,724 |
| 0.381 | 0.225 | 126,978 |
| 0.373 | 0.121 | 261,666 |
| 0.244 | 0.342 | 502,596 |
| 0.225 | 0.048 | 1,082,231 |
| 0.202 | 0.020 | 463,339 |
| 0.192 | 0.048 | 105,950 |
| 0.162 | 0.057 | 114,570 |
| 0.127 | 0.216 | 227,971 |
| 0.126 | 0.121 | 1,612,642 |
| 0.085 | 0.069 | 286,303 |
| 0.079 | 0.097 | 107,859 |
| 0.060 | 0.106 | 867,089 |
| 0.055 | 0.063 | 180,430 |
| 0.054 | -0.017 | 130,950 |
| 0.038 | 0.151 | 150,255 |
| 0.028 | 0.116 | 184,368 |
| 0.028 | 0.010 | 133,517 |
| 0.021 | 0.320 | 157,765 |
| 0.013 | 0.097 | 189,305 |
| -0.003 | 0.064 | 521,315 |
| -0.012 | 0.002 | 147,678 |
| -0.019 | 0.138 | 300,137 |
| -0.019 | 0.138 | 590,207 |
| -0.025 | 0.040 | 120,288 |
| -0.039 | 0.107 | 173,491 |
| -0.039 | 0.097 | 124,454 |
| -0.040 | 0.055 | 360,718 |
| -0.049 | 0.094 | 215,951 |
| -0.070 | 0.058 | 220,258 |
| -0.110 | 0.010 | 509,638 |
| -0.184 | 0.048 | 708,726 |
| -0.185 | 0.048 | 2,576,026 |
| -0.219 | 0.079 | 118,929 |
| -0.229 | 0.058 | 120,553 |
| -0.283 | 0.012 | 125056 |
| -0.291 | 0.335 | 141,332 |
| -0.299 | 0.006 | 128,769 |
| -0.377 | -0.198 | 208,017 |
| -0.762 | -0.078 | 101,679 |
Changes in the log number of new immigrants and changes in median house values in municipalities with over 100,000 population, 2011 to 2016
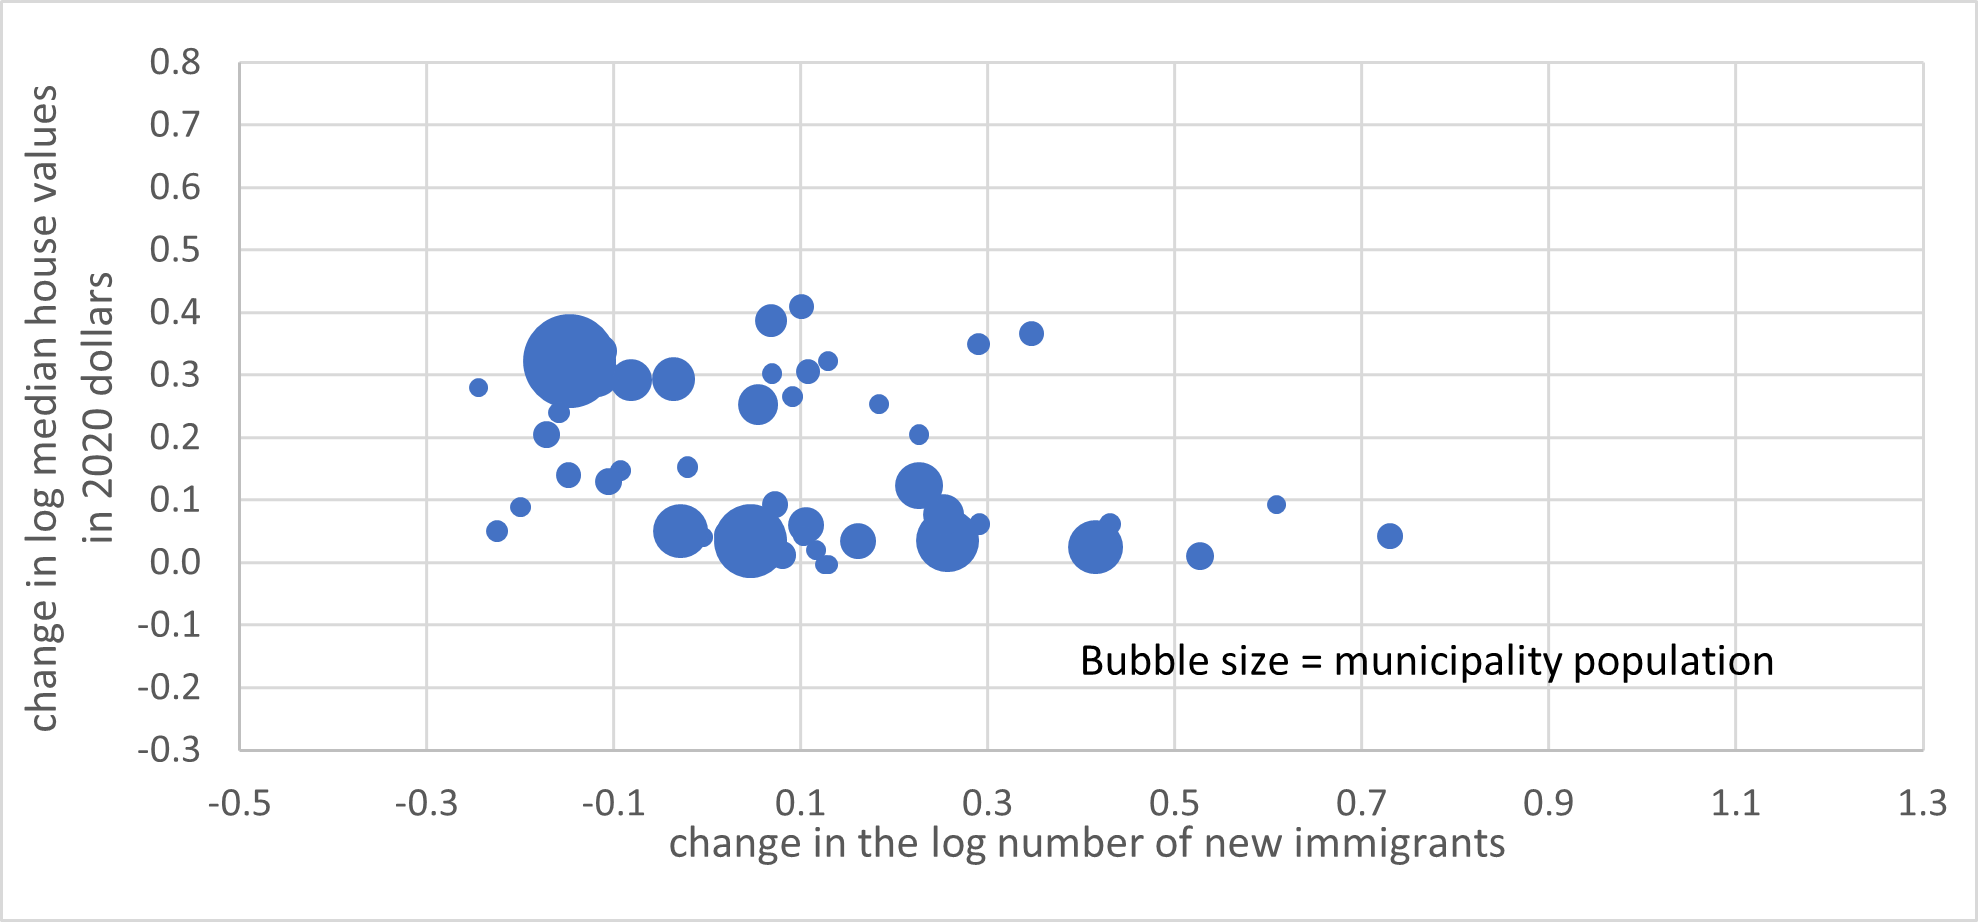
Sources: Statistics Canada, 2011 National Household Survey and 2016 Census of Population
Text version of chart 2
| change in the log number of new immigrants | change in log median house values in 2020 dollars | Municipality population |
|---|---|---|
| 0.730 | 0.042 | 211,781 |
| 0.608 | 0.093 | 107,092 |
| 0.527 | 0.010 | 241,416 |
| 0.431 | 0.061 | 158,665 |
| 0.415 | 0.025 | 914,193 |
| 0.346 | 0.367 | 191,718 |
| 0.291 | 0.061 | 140,247 |
| 0.290 | 0.350 | 157,630 |
| 0.257 | 0.035 | 1,222,404 |
| 0.252 | 0.077 | 516,249 |
| 0.226 | 0.123 | 690,004 |
| 0.226 | 0.205 | 130,087 |
| 0.183 | 0.253 | 115,834 |
| 0.161 | 0.035 | 397,394 |
| 0.130 | -0.003 | 110,857 |
| 0.129 | 0.322 | 119,178 |
| 0.125 | -0.003 | 111,833 |
| 0.116 | 0.020 | 124,136 |
| 0.108 | 0.306 | 180,126 |
| 0.105 | 0.060 | 410,848 |
| 0.101 | 0.409 | 193,802 |
| 0.091 | 0.265 | 137,589 |
| 0.080 | 0.012 | 234,957 |
| 0.072 | 0.093 | 213,984 |
| 0.069 | 0.303 | 126,783 |
| 0.068 | 0.387 | 327,401 |
| 0.054 | 0.253 | 511,541 |
| 0.045 | 0.017 | 156,260 |
| 0.040 | 0.039 | 378,040 |
| 0.023 | 0.045 | 271,848 |
| -0.005 | 0.041 | 120,218 |
| -0.021 | 0.153 | 138,555 |
| -0.029 | 0.050 | 916,857 |
| -0.036 | 0.294 | 590,948 |
| 0.046 | 0.034 | 1,663,221 |
| -0.082 | 0.292 | 527,931 |
| -0.093 | 0.147 | 127,838 |
| 0.103 | 0.042 | 129,008 |
| -0.106 | 0.129 | 230,002 |
| -0.113 | 0.338 | 304,145 |
| -0.119 | 0.300 | 618,210 |
| -0.136 | 0.322 | 715,474 |
| -0.147 | 0.322 | 2,691,665 |
| -0.148 | 0.140 | 196,662 |
| -0.159 | 0.240 | 139,058 |
| -0.172 | 0.205 | 230,079 |
| -0.200 | 0.088 | 129,846 |
| -0.225 | 0.050 | 142,222 |
| -0.245 | 0.280 | 105,223 |
Changes in the log number of new immigrants and changes in median house values in municipalities with over 100,000 population, 2016 to 2021
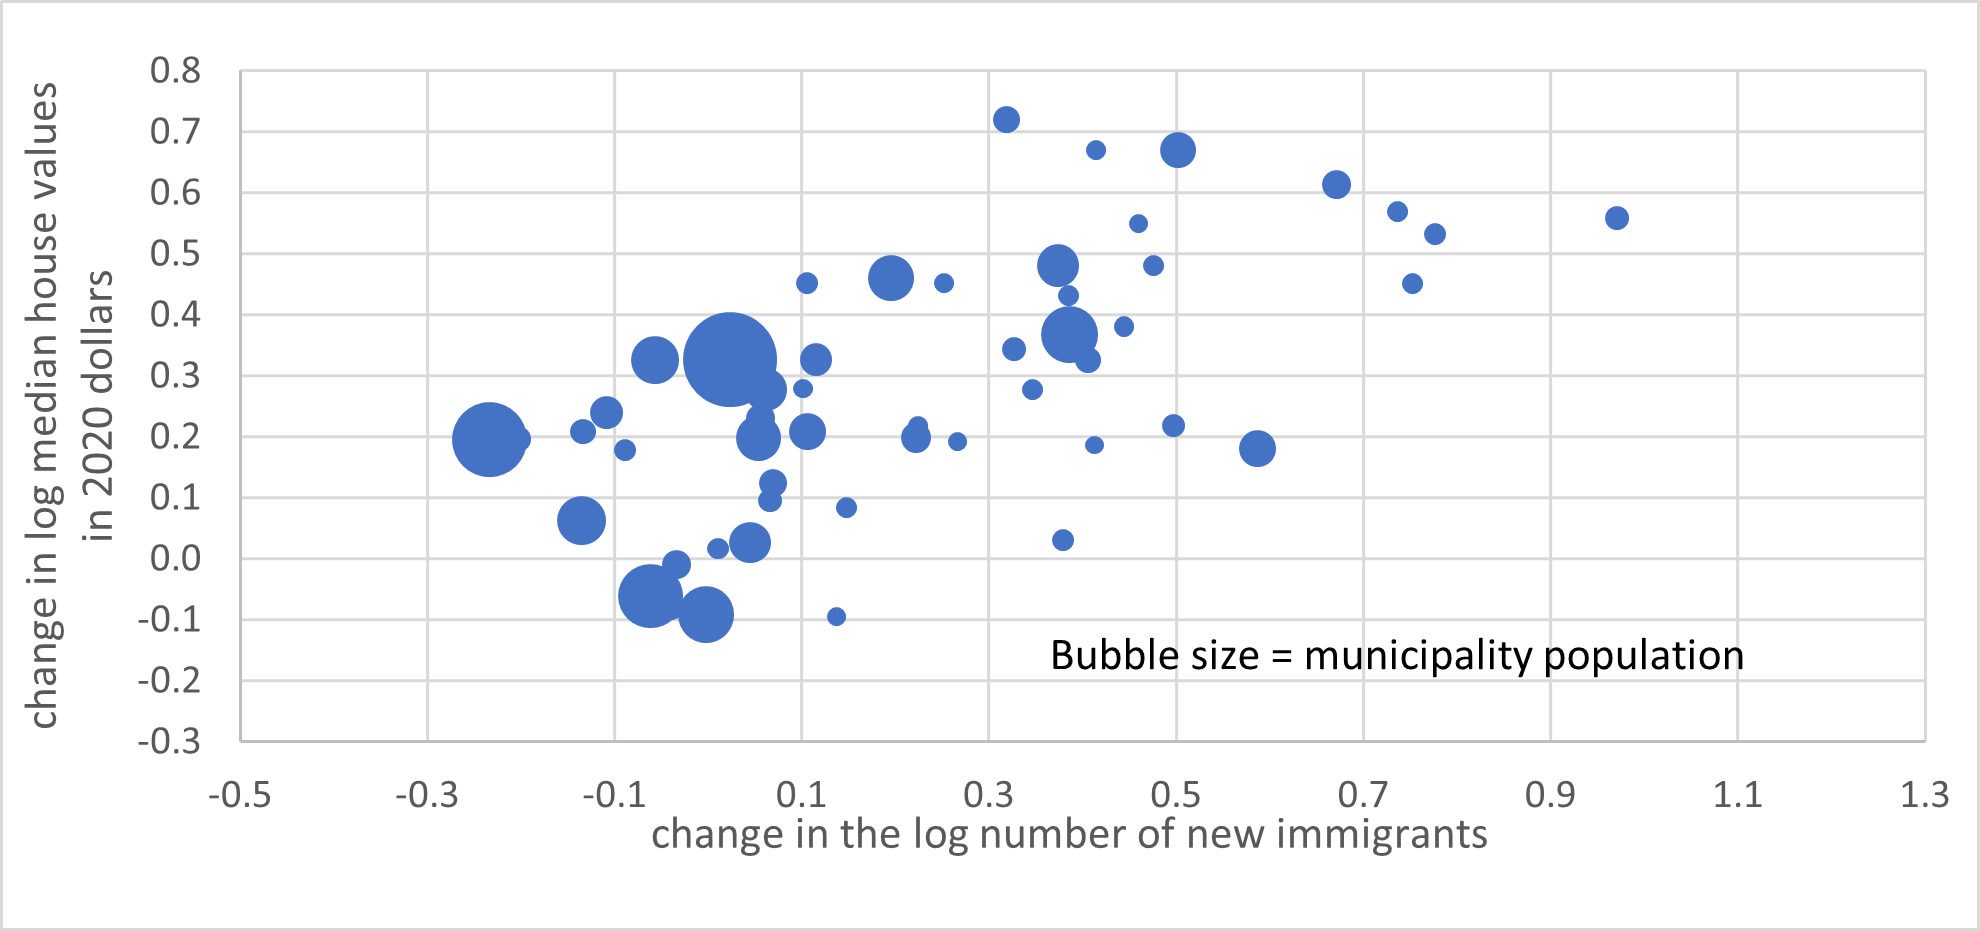
Sources: Statistics Canada, 2016 and 2021 Census of Population
Text version of chart 3
| change in the log number of new immigrants | change in log median house values in 2020 dollars | Municipality population |
|---|---|---|
| 0.971 | 0.559 | 174,010 |
| 0.777 | 0.532 | 145,386 |
| 0.753 | 0.452 | 136,665 |
| 0.737 | 0.569 | 137,120 |
| 0.671 | 0.614 | 254,146 |
| 0.587 | 0.181 | 435,290 |
| 0.502 | 0.670 | 416,265 |
| 0.497 | 0.218 | 163,030 |
| 0.476 | 0.481 | 141,834 |
| 0.460 | 0.550 | 118,390 |
| 0.444 | 0.381 | 131,430 |
| 0.414 | 0.670 | 134,336 |
| 0.413 | 0.187 | 106,643 |
| 0.406 | 0.327 | 212,057 |
| 0.391 | 0.376 | 141,757 |
| 0.386 | 0.367 | 1,000,936 |
| 0.385 | 0.432 | 129,112 |
| 0.379 | 0.030 | 146,235 |
| 0.374 | 0.481 | 560,916 |
| 0.347 | 0.278 | 130,960 |
| 0.327 | 0.344 | 183,956 |
| 0.319 | 0.720 | 226,462 |
| 0.266 | 0.192 | 107,270 |
| 0.252 | 0.452 | 126,248 |
| 0.224 | 0.218 | 118,046 |
| 0.222 | 0.199 | 285,714 |
| 0.195 | 0.460 | 650,163 |
| 0.148 | 0.084 | 133,675 |
| 0.137 | -0.095 | 107,657 |
| 0.115 | 0.327 | 321,314 |
| 0.106 | 0.209 | 429,553 |
| 0.105 | 0.452 | 150,800 |
| 0.101 | 0.279 | 115,506 |
| 0.069 | 0.124 | 245,725 |
| 0.066 | 0.095 | 167,181 |
| 0.061 | 0.278 | 562,563 |
| 0.056 | 0.231 | 250,429 |
| 0.054 | 0.197 | 650,381 |
| 0.045 | 0.026 | 533,540 |
| 0.023 | 0.327 | 2,761,286 |
| 0.011 | 0.016 | 141,117 |
| -0.002 | -0.092 | 996,486 |
| -0.034 | -0.010 | 260,955 |
| -0.040 | -0.079 | 223,074 |
| -0.057 | 0.327 | 712,825 |
| -0.062 | -0.061 | 1,291,770 |
| -0.088 | 0.179 | 147,465 |
| -0.109 | 0.240 | 337,251 |
| -0.134 | 0.209 | 200,927 |
| -0.136 | 0.063 | 736,660 |
| -0.203 | 0.197 | 208,397 |
| -0.234 | 0.195 | 1,723,228 |
The positive correlation observed between changes in median house values and the growth of new immigrants during the 2006–2011 and 2016–2021 periods suggests that municipalities experiencing larger increases in house values also saw a more rapid increase in new immigrant populations. Conversely, the negative correlation noted during the 2011–2016 period implies that municipalities with a smaller rise in house values witnessed a faster growth in new immigrants. These summary measures can be better understood by examining changes in major municipalities, as detailed in Table 2. This table lists changes in the number of new immigrants, median house values, and median rents in municipalities with at least 100,000 residents.
As shown in Table 2, over the 2006–2011 period, the 10 municipalities with the fastest increases in new immigrants, located mostly in the Prairie provinces and Quebec, also tended to have large increases in median house values. For instance, Saskatoon, where the number of new immigrants grew 1.211 log points (or 2.4 times), median house values saw one of the largest increases (0.544 log points, or 72%). Similarly, over the 2016–2021 period, eight of the 10 municipalities with the largest increases in new immigrants, all located in southern Ontario, had an increase of new immigrants at least 0.46 log points (or 58%) and an increase in median house values at least 0.45 log points (or 57%).
In comparison, over the 2011–2016 period, many municipalities in the Greater Toronto and Hamilton area and Greater Vancouver area experienced large increases in median house values but mostly small increases or decreases in new immigrants. In the five municipalities with largest increases in new immigrants, new immigrants increased .415 (or 51%) to 0.730 log points (108%), but median house values saw only small increases, ranging from 1% to 10%. This regional incongruity between the increase in house values and the number of new immigrants explains the observed negative correlation between them.
In summary, the above descriptive analyses show that over the entire period from 2006 to 2021, changes in median house values and monthly rents were positively correlated with the growth in new immigrants. However, when examined by five-year census intervals, the positive correlation held only for the 2006–2011 and 2016–2021 periods, but not for the 2011–2016 period. The differences by periods reflect shifts in the broader regional distribution of new immigrants resulting from the combined forces of immigration policies and regional labour market conditions.
Table 2
Changes in the number of new immigrants, median house values and median rents in municipalities with at least 100,000 population
| Changes between 2006 and 2011 (changes in log points) |
Changes between 2011 and 2016 (changes in log points) |
Changes between 2016 and 2021 (changes in log points) |
|||||||||
|---|---|---|---|---|---|---|---|---|---|---|---|
| Municipality | number of new immigrants | median house value | median rent | Municipality | number of new immigrants | median house value | median rent | Municipality | number of new immigrants | median house value | median rent |
| Saskatoon | 1.211 | 0.544 | 0.263 | Regina | 0.730 | 0.042 | 0.133 | Oshawa | 0.971 | 0.559 | 0.168 |
| Regina | 1.131 | 0.608 | 0.254 | St. John's | 0.608 | 0.093 | 0.125 | Barrie | 0.777 | 0.532 | 0.182 |
| Winnipeg | 0.623 | 0.352 | 0.058 | Saskatoon | 0.527 | 0.010 | 0.079 | Whitby | 0.753 | 0.452 | 0.171 |
| Edmonton | 0.484 | 0.251 | 0.178 | Greater Sudbury | 0.431 | 0.061 | 0.086 | Cambridge | 0.737 | 0.569 | 0.174 |
| Lévis | 0.482 | 0.320 | -0.006 | Edmonton | 0.415 | 0.025 | 0.125 | Kitchener | 0.671 | 0.614 | 0.202 |
| Halifax | 0.463 | 0.097 | -0.016 | Oakville | 0.346 | 0.367 | 0.117 | Halifax | 0.587 | 0.181 | 0.133 |
| Laval | 0.444 | 0.177 | -0.028 | Lévis | 0.291 | 0.061 | 0.036 | London | 0.502 | 0.670 | 0.171 |
| Trois-Rivières | 0.381 | 0.225 | -0.021 | Oshawa | 0.290 | 0.350 | 0.059 | Greater Sudbury | 0.497 | 0.218 | 0.050 |
| Gatineau | 0.373 | 0.121 | -0.061 | Calgary | 0.257 | 0.035 | 0.131 | Guelph | 0.476 | 0.481 | 0.212 |
| Québec | 0.244 | 0.342 | -0.034 | Québec | 0.252 | 0.077 | 0.048 | Waterloo | 0.460 | 0.550 | 0.227 |
| Calgary | 0.225 | 0.048 | 0.107 | Winnipeg | 0.226 | 0.123 | 0.150 | Milton | 0.444 | 0.381 | 0.226 |
| Surrey | 0.202 | 0.020 | -0.085 | Guelph | 0.226 | 0.205 | 0.064 | St. Catharines | 0.414 | 0.670 | 0.132 |
| Thunder Bay | 0.192 | 0.048 | -0.085 | Langley | 0.183 | 0.253 | 0.012 | Thunder Bay | 0.413 | 0.187 | 0.093 |
| Kelowna | 0.162 | 0.057 | -0.028 | Halifax | 0.161 | 0.035 | 0.088 | Oakville | 0.406 | 0.327 | 0.267 |
| Longueuil | 0.127 | 0.216 | -0.060 | Terrebonne | 0.130 | -0.003 | 0.005 | Kelowna | 0.391 | 0.376 | 0.240 |
| Montréal | 0.126 | 0.121 | -0.048 | Ajax | 0.129 | 0.322 | 0.028 | Ottawa | 0.386 | 0.367 | 0.135 |
| Vaughan | 0.085 | 0.069 | -0.025 | Saanich | 0.125 | -0.003 | 0.065 | Kingston | 0.385 | 0.432 | 0.155 |
| Saanich | 0.079 | 0.097 | -0.085 | Kelowna | 0.116 | 0.020 | 0.022 | Lévis | 0.379 | 0.030 | 0.050 |
| Ottawa | 0.060 | 0.106 | -0.062 | Burlington | 0.108 | 0.306 | 0.108 | Hamilton | 0.374 | 0.481 | 0.162 |
| Oakville | 0.055 | 0.063 | -0.103 | Laval | 0.105 | 0.060 | 0.036 | Langley | 0.347 | 0.278 | 0.231 |
| Abbotsford | 0.054 | -0.017 | -0.052 | Richmond Hill | 0.101 | 0.409 | 0.114 | Burlington | 0.327 | 0.344 | 0.168 |
| Sherbrooke | 0.038 | 0.151 | -0.037 | Coquitlam | 0.091 | 0.265 | 0.118 | Windsor | 0.319 | 0.720 | 0.155 |
| Richmond Hill | 0.028 | 0.116 | -0.085 | Longueuil | 0.080 | 0.012 | 0.027 | Delta | 0.266 | 0.192 | 0.247 |
| Barrie | 0.028 | 0.010 | -0.090 | Windsor | 0.072 | 0.093 | 0.008 | Ajax | 0.252 | 0.452 | 0.228 |
| Greater Sudbury | 0.021 | 0.320 | -0.004 | Whitby | 0.069 | 0.303 | 0.045 | Terrebonne | 0.224 | 0.218 | 0.077 |
| Richmond | 0.013 | 0.097 | -0.036 | Markham | 0.068 | 0.387 | 0.080 | Gatineau | 0.222 | 0.199 | 0.074 |
| Brampton | -0.003 | 0.064 | -0.085 | Surrey | 0.054 | 0.253 | 0.088 | Brampton | 0.195 | 0.460 | 0.172 |
| Oshawa | -0.012 | 0.002 | -0.099 | Sherbrooke | 0.045 | 0.017 | -0.002 | Trois-Rivières | 0.148 | 0.084 | 0.042 |
| Markham | -0.019 | 0.138 | -0.025 | London | 0.040 | 0.039 | 0.022 | St. John's | 0.137 | -0.095 | -0.018 |
| Vancouver | -0.019 | 0.138 | 0.005 | Gatineau | 0.023 | 0.045 | 0.002 | Vaughan | 0.115 | 0.327 | 0.209 |
| Whitby | -0.025 | 0.040 | -0.124 | Kingston | -0.005 | 0.041 | 0.089 | Laval | 0.106 | 0.209 | 0.071 |
| Burlington | -0.039 | 0.107 | -0.037 | Abbotsford | -0.021 | 0.153 | 0.016 | Abbotsford | 0.105 | 0.452 | 0.223 |
| Coquitlam | -0.039 | 0.097 | -0.076 | Ottawa | -0.029 | 0.050 | 0.064 | Saanich | 0.101 | 0.279 | 0.178 |
| London | -0.040 | 0.055 | -0.077 | Brampton | -0.036 | 0.294 | 0.071 | Burnaby | 0.069 | 0.124 | 0.234 |
| Kitchener | -0.049 | 0.094 | -0.059 | Montréal | 0.046 | 0.034 | 0.053 | Sherbrooke | 0.066 | 0.095 | 0.036 |
| Burnaby | -0.070 | 0.058 | -0.035 | Hamilton | -0.082 | 0.292 | 0.081 | Surrey | 0.061 | 0.278 | 0.261 |
| Hamilton | -0.110 | 0.010 | -0.139 | Cambridge | -0.093 | 0.147 | 0.059 | Longueuil | 0.056 | 0.231 | 0.067 |
| Mississauga | -0.184 | 0.048 | -0.070 | Trois-Rivières | 0.103 | 0.042 | -0.009 | Vancouver | 0.054 | 0.197 | 0.174 |
| Toronto | -0.185 | 0.048 | -0.085 | Kitchener | -0.106 | 0.129 | 0.066 | Québec | 0.045 | 0.026 | 0.044 |
| Kingston | -0.219 | 0.079 | -0.034 | Vaughan | -0.113 | 0.338 | 0.080 | Toronto | 0.023 | 0.327 | 0.149 |
| Guelph | -0.229 | 0.058 | -0.107 | Vancouver | -0.119 | 0.300 | 0.114 | Saguenay | 0.011 | 0.016 | 0.049 |
| Cambridge | -0.283 | 0.012 | -0.059 | Mississauga | -0.136 | 0.322 | 0.075 | Edmonton | -0.002 | -0.092 | -0.054 |
| Saguenay | -0.291 | 0.335 | -0.063 | Toronto | -0.147 | 0.322 | 0.091 | Saskatoon | -0.034 | -0.010 | -0.026 |
| St. Catharines | -0.299 | 0.006 | -0.104 | Richmond | -0.148 | 0.140 | 0.075 | Regina | -0.040 | -0.079 | -0.072 |
| Windsor | -0.377 | -0.198 | -0.194 | Barrie | -0.159 | 0.240 | 0.079 | Mississauga | -0.057 | 0.327 | 0.162 |
| Chatham-Kent | -0.762 | -0.078 | -0.087 | Burnaby | -0.172 | 0.205 | 0.053 | Calgary | -0.062 | -0.061 | -0.070 |
| .. | .. | .. | .. | St. Catharines | -0.200 | 0.088 | 0.042 | Coquitlam | -0.088 | 0.179 | 0.231 |
| .. | .. | .. | .. | Saguenay | -0.225 | 0.050 | 0.012 | Markham | -0.109 | 0.240 | 0.205 |
| .. | .. | .. | .. | Thunder Bay | -0.245 | 0.280 | 0.093 | Richmond Hill | -0.134 | 0.209 | 0.238 |
| .. | .. | .. | .. | .. | .. | .. | .. | Winnipeg | -0.136 | 0.063 | 0.105 |
| .. | .. | .. | .. | .. | .. | .. | .. | Richmond | -0.203 | 0.197 | 0.184 |
| .. | .. | .. | .. | .. | .. | .. | .. | Montréal | -0.234 | 0.195 | 0.069 |
Note: .. not available for a specific reference period
Sources: Statistics Canada, 2006, 2016 and 2021 Census of Population, and 2011 National Household Survey
During the 2006–2011 period, the number of new immigrants increased primarily in Prairie provinces and Quebec but decreased in Ontario. These shifts in the distribution of new immigrants were brought about by the expansion of the Provincial Nominee Program and robust economic conditions in the Prairie provinces, as well as changes in immigrant source regions (Bonikowska, Hou, & Picot, 2017). During this period, housing prices increased considerably in Prairie provinces and Quebec but changed little in Ontario and British Columbia. Therefore, the increases in new immigrants and house values were concurrent at the broad regional level.
During the 2011–2016 period, number of new immigrants continued to increase primarily in Saskatchewan and Alberta, as both provinces had the lowest unemployment rates in the country, but the median house values in these two provinces changed little during this period. In contrast, the number of new immigrants decreased in Ontario, which experienced the largest increase in house values in the country. The number of new immigrants also decreased in British Columbia and remained stable in Quebec; both provinces saw only a small increase in house values. Overall, there was a disconnect between the growth in the number of new immigrants and house values at the broad regional level during this period.
During the 2016–2021 period, the number of new immigrants grew primarily in Ontario where unemployment rates decreased relative to the previous five-year period. To a lesser extent, the number of new immigrants also grew in British Columbia, which tended to have the lowest unemployment rates in the country during this period. The Atlantic provinces also experienced high rates of increase in new immigrants even though the region had the highest unemployment rates. This increase in new immigrants was driven mostly by the Provincial Nominee Program (Picot, Hou & Crossman, 2023). The number of new immigrants decreased in Prairie provinces, where unemployment rates increased relative to the previous five-year period. During this period, house values increased the most in Ontario and British Columbia but decreased in Saskatchewan and Alberta. Overall, the growth in new immigrant numbers aligned with increases in house values at the broad regional level during this period.
Multivariate analysis results
House values
Table 3 presents the unweighted and weighted estimates from both the first-difference FE models and first-difference FE-IV models for house values. The models are run for data pooling all three periods and for data pooling two of the three periods. In general, the estimated associations between increases in house values and new immigrants were much stronger in weighted estimates than in unweighted estimates. This is because these associations were stronger in larger municipalities (as shown later in Table 4) and the weighted estimates give more weight to larger municipalities in the estimation. The discussion below focuses on the weighted results since they better reflect the fact that most new immigrants are concentrated in a relatively small number of large municipalities.Footnote 12
Changes in the log number of new immigrants were positively and significantly associated with changes in log median house values in the model with three-period pooled data (Table 3). In the FE model, one log-point increase in the number of new immigrants was associated with a 0.032-point increase in house values, or a 1% increase in the number of new immigrants was associated with 0.032% increase in house values. The estimated effect in the FE-IV mode was much larger, at 0.143%.
Table 3
First-differences model with municipality fixed effects and instrumental variables predicting changes in log median house values across municipalities with at least 1,000 population, Canada
| Pooled three periods | Pooled 2006 to 2011 and 2011 to 2016 | Pooled 2011 to 2016 and 2016 to 2021 | Pooled 2006 to 2011 and 2016 to 2021 | |||||
|---|---|---|---|---|---|---|---|---|
| coefficient | robust standard error | coefficient | robust standard error | coefficient | robust standard error | coefficient | robust standard error | |
| Not weighted – Fixed effects models | ||||||||
| Change in log number of new immigrants | 0.007Table footnote ** | 0.002 | 0.001 | 0.003 | 0.009Table footnote ** | 0.003 | 0.012Table footnote ** | 0.004 |
| Initial share of Canadian-born population | 0.013Table footnote *** | 0.002 | 0.002 | 0.003 | 0.013Table footnote *** | 0.003 | 0.018Table footnote *** | 0.003 |
| Change in log number of dwellings | 0.199Table footnote *** | 0.048 | 0.051 | 0.068 | 0.230Table footnote ** | 0.069 | 0.240Table footnote *** | 0.056 |
| Change in log adult-equivalent adjusted income | 0.481Table footnote *** | 0.035 | 0.210Table footnote *** | 0.042 | 0.506Table footnote *** | 0.049 | 0.784Table footnote *** | 0.048 |
| Changes in percentage of seniors aged 65 or older | -0.003Table footnote * | 0.001 | 0.000 | 0.001 | -0.005Table footnote ** | 0.002 | -0.006Table footnote ** | 0.002 |
| Change in percentage of young adults aged 19 to 34 | 0.003Table footnote * | 0.001 | 0.002Table footnote *** | 0.002 | 0.001 | 0.002 | 0.005Table footnote ** | 0.002 |
| Change in unemployment rate | 0.001 | 0.001 | -0.005Table footnote *** | 0.001 | 0.009Table footnote *** | 0.001 | 0.001 | 0.001 |
| Not weighted – Fixed effects instrumental variables models | ||||||||
| Change in log number of new immigrants | 0.060Table footnote ** | 0.021 | 0.003 | 0.020 | 0.093 | 0.049 | 0.112Table footnote ** | 0.034 |
| Initial share of Canadian-born population | 0.001 | 0.005 | 0.002 | 0.006 | -0.008 | 0.013 | -0.001 | 0.007 |
| Change in log number of dwellings | 0.157Table footnote ** | 0.051 | 0.049 | 0.072 | 0.168Table footnote * | 0.075 | 0.199Table footnote ** | 0.064 |
| Change in log adult-equivalent adjusted income | 0.484Table footnote *** | 0.038 | 0.211Table footnote *** | 0.044 | 0.458Table footnote *** | 0.065 | 0.781Table footnote *** | 0.060 |
| Changes in percentage of seniors aged 65 or older | -0.003 | 0.001 | 0.000 | 0.001 | -0.004Table footnote * | 0.002 | -0.005 | 0.003 |
| Change in percentage of young adults aged 19 to 34 | 0.004Table footnote ** | 0.001 | 0.002 | 0.002 | 0.001 | 0.002 | 0.006Table footnote * | 0.002 |
| Change in unemployment rate | 0.001 | 0.001 | -0.005Table footnote *** | 0.001 | 0.007Table footnote *** | 0.002 | 0.000 | 0.002 |
| Weighted by municipality total population – Fixed effects models | ||||||||
| Change in log number of new immigrants | 0.032Table footnote *** | 0.004 | 0.005 | 0.005 | 0.030Table footnote *** | 0.007 | 0.066Table footnote *** | 0.008 |
| Initial share of Canadian-born population | 0.019Table footnote *** | 0.004 | 0.010 | 0.009 | 0.017 | 0.010 | 0.015Table footnote ** | 0.005 |
| Change in log number of dwellings | 0.104 | 0.098 | -0.251 | 0.142 | 0.610Table footnote *** | 0.124 | -0.059 | 0.107 |
| Change in log adult-equivalent adjusted income | 0.703Table footnote *** | 0.102 | 0.216Table footnote ** | 0.082 | 0.170 | 0.177 | 1.117Table footnote *** | 0.124 |
| Changes in percentage of seniors aged 65 or older | -0.007Table footnote * | 0.003 | 0.008Table footnote *** | 0.003 | -0.017Table footnote *** | 0.004 | -0.018Table footnote ** | 0.006 |
| Change in percentage of young adults aged 19 to 34 | 0.025Table footnote *** | 0.005 | 0.025Table footnote *** | 0.004 | 0.010 | 0.006 | 0.024Table footnote *** | 0.005 |
| Change in unemployment rate | 0.000 | 0.004 | -0.024Table footnote *** | 0.003 | 0.009Table footnote * | 0.004 | 0.016Table footnote *** | 0.004 |
| Weighted by municipality total population – Fixed effects instrumental variables models | ||||||||
| Change in log number of new immigrants | 0.143Table footnote *** | 0.031 | 0.039 | 0.029 | 0.149Table footnote * | 0.060 | 0.243Table footnote *** | 0.042 |
| Initial share of Canadian-born population | 0.008 | 0.005 | 0.006 | 0.010 | 0.002 | 0.012 | 0.000 | 0.004 |
| Change in log number of dwellings | 0.030 | 0.091 | -0.300Table footnote * | 0.150 | 0.540Table footnote *** | 0.120 | -0.114 | 0.092 |
| Change in log adult-equivalent adjusted income | 0.664Table footnote *** | 0.089 | 0.218Table footnote ** | 0.083 | 0.127 | 0.162 | 1.061Table footnote *** | 0.092 |
| Changes in percentage of seniors aged 65 or older | -0.005 | 0.003 | 0.008Table footnote ** | 0.003 | -0.015Table footnote ** | 0.004 | -0.012Table footnote * | 0.006 |
| Change in percentage of young adults aged 19 to 34 | 0.024Table footnote *** | 0.004 | 0.025Table footnote *** | 0.004 | 0.009 | 0.006 | 0.019Table footnote *** | 0.005 |
| Change in unemployment rate | -0.002 | 0.004 | -0.024Table footnote *** | 0.003 | 0.006 | 0.005 | 0.011Table footnote *** | 0.004 |
Note: Each model includes municipality and period fixed effects. The first model has 2,001 unique municipalities and 5,827 observations, with an F value of 28 (p<0.001) for the fixed effects (FE) model and 39 (p<0.001) for the fixed effects instrumental variables (FE-IV) model. The second model contains 1,985 unique municipalities and 3,888 observations, with an F value of 12 (p<0.001) for the FE model and 12 (p<0.001) for the FE-IV model. The third model contains 1,965 unique municipalities and 3,888 observations, with an F value of 25 (p<0.001) for the FE model and 22 (p<0.001) for the FE-IV model. The fourth model contain 1,994 unique municipalities and 3,878 observations, with an F value of 44 (p<0.001) for the FE model and 60 for the FE-IV model.
Sources: Statistics Canada, 2001, 2006, 2016 and 2021 Census of Population, and 2011 National Household Survey
At the aggregate level, over the study period, the average five-year increase in house values in municipalities with a population 1,000 or more was 0.170 log points (or about 18.5%), and the average five-year increase in the number of new immigrants was 0.131 log points. Therefore, on average, the increase in the number of new immigrants accounted for 2.5% (0.032x0.131/0.170) of the overall increase in house values in the FE estimate or 11.0% (0.143x0.131/0.170) in the FE-IV estimate.
The regression coefficients for control variables show that increases in family income and the share of young adults were positively associated with increases in house values in the weighted FE and FE-IV models. The coefficients for the initial share of Canadian-born population and changes in the share of seniors were significant in the FE model, but not in the FE-IV model.
When the models were run for pooling two of the three periods, it is not surprising that the two models involving the 2011–2006 period had a smaller coefficient for changes in the log number of new immigrants than the model pooling the 2006–2011 and 2016–2021 periods. As shown earlier, in the 2011–2016 period, the correlation between changes in house values and the number of new immigrants was negative.
The association between the increase in the number of new immigrants and the increase in house values tended to increase with the population size of municipalities (Table 4). Furthermore, the estimated effects were similar between unweighted and weighted models among large municipalities. This is likely because the variation in the population size across municipalities was considerably reduced when small municipalities were excluded. The estimated effects were also similar from FE and FE-IV models in large municipalities. This result implies that endogeneity is mostly an issue in small municipalities. Since most new immigrants do not go to small municipalities, it is possible that for those who do, finding more affordable housing is a factor in their locational choice. Conversely, most new immigrants settle in large municipalities regardless of their housing prices and potential price increases.
Table 4
Coefficients of changes in the log number of new immigrants in first-differences models with municipality fixed effects and instrumental variables predicting log median house values across municipalities, by population size and geographic region
By the population size of municipality
| Fixed effects model | Fixed effects instrumental variables model | |||
|---|---|---|---|---|
| coefficient | robust standard error | coefficient | robust standard error | |
| Population 5,000 or more | ||||
| Not weighted | 0.013Table footnote ** | 0.005 | 0.077Table footnote * | 0.039 |
| Weighted by municipality population | 0.056Table footnote *** | 0.008 | 0.195Table footnote *** | 0.050 |
| Population 10,000 or more | ||||
| Not weighted | 0.043Table footnote *** | 0.008 | 0.160Table footnote * | 0.064 |
| Weighted by municipality population | 0.109Table footnote *** | 0.015 | 0.274Table footnote *** | 0.055 |
| Population 100,000 or more | ||||
| Not weighted | 0.348Table footnote *** | 0.091 | 0.361Table footnote *** | 0.113 |
| Weighted by municipality population | 0.376Table footnote *** | 0.079 | 0.419Table footnote *** | 0.098 |
| Population above 1,000 to under 50,000 | ||||
| Not weighted | 0.006Table footnote * | 0.002 | 0.059Table footnote ** | 0.022 |
| Weighted by municipality population | 0.014Table footnote *** | 0.003 | 0.095Table footnote *** | 0.025 |
| Population above 1,000 to under 10,000 | ||||
| Not weighted | 0.003 | 0.002 | 0.042 | 0.022 |
| Weighted by municipality population | 0.003 | 0.002 | 0.043Table footnote * | 0.025 |
By geographic region
| Fixed effects model | ||
|---|---|---|
| coefficient | robust standard error | |
| Atlantic provinces | ||
| Not weighted | 0.004 | 0.005 |
| Weighted by municipality population | -0.001 | 0.006 |
| Quebec | ||
| Not weighted | 0.004 | 0.003 |
| Weighted by municipality population | 0.010Table footnote ** | 0.003 |
| Ontario | ||
| Not weighted | 0.011Table footnote * | 0.005 |
| Weighted by municipality population | 0.034Table footnote *** | 0.008 |
| Manitoba and Saskatchewan | ||
| Not weighted | 0.002 | 0.007 |
| Weighted by municipality population | 0.003 | 0.007 |
| Alberta | ||
| Not weighted | -0.002 | 0.009 |
| Weighted by municipality population | 0.006 | 0.011 |
| British Columbia | ||
| Not weighted | 0.009 | 0.007 |
| Weighted by municipality population | 0.025Table footnote * | 0.011 |
Note: Each model also includes municipality and period fixed effects and other control variables in Table 3. The model for municipalities with a population 5,000 or more contains 708 unique municipalities, 2124 observations, and with an F-value of 32 (p<0.001) for the fixed effects (FE) model and 46 (p<0.001) for the fixed effects instrumental variables (FE-IV) model. The model for municipalities with a population 10,000 or more contains 403 unique municipalities, 1,209 observations, and with an F-value of 37 (p<0.001) for the FE model and 52 (p<0.001) for the FE-IV model. The model for municipalities with a population 100,000 or more has 53 unique municipalities, 159 observations, and an F-value of 40 (p<0.001) for the FE model and 38 (p<0.001) for the FE-IV model. The model for municipalities with a population 1,000 to 50,000 has 1,901 unique municipalities, 5,527 observations, and an F-value of 79 (p<0.001) for the FE model and 69 (p<0.001) for the FE-IV model. The model for municipalities with a population 1,000 to 10,000 has 1,598 unique municipalities, 4,618 observations, and an F-value of 85 (p<0.001) for the FE model and 68 (p<0.001) for the FE-IV model. The model for Atlantic provinces has 322 unique municipalities, 935 observations and F-value of 15 (p<0.001). The model for Quebec has 638 unique municipalities, 1,861oberveration, and F-value of 91 (p<0.001). The model for Ontario has 346 unique municipalities, 1,026 observation, and F-value of 88 (p<0.001). The model or Manitoba and Saskatchewan has 228 unique municipalities, 638 observations, and F value of 42 (p<0.001). The model for Alberta has 177 unique municipalities, 521 observations, and F value of 58 (p<0.001). The model for British Columbia has 267 unique municipalities, 784 observations, and F value of 15 (p<0.001).
Sources: Statistics Canada, 2001, 2006, 2016 and 2021 Census of Population, and 2011 National Household Survey
Across municipalities with a population of at least 100,000, one log-point increase in the number of new immigrants was associated with a 0.376-point increase in house values in the weighted FE model, or a 1% increase in the number of new immigrants was associated with a 0.376% increase in house values. In the FE-IV model, a 1% increase in the number of new immigrants was associated with a 0.419% increase in house values. Over the study period, the average five-year increase in the new immigrant population was 0.089 log points, and the increase in house values was 0.181 log points among municipalities with a population of at least 100,000. Thus, in these municipalities, the increase in the new immigrant population accounted for 18.5% (=0.376*0.089/0.181) of the overall increase in house values in the FE model, and 20.6% (=0.419*0.089/0.181) in the FE-IV model. Over the study period, 53 municipalities had such a population size, and about 82% of new immigrants resided in these large municipalities in 2021.
By geographic region, the coefficient of the increase in the number of new immigrants was statistically significant in Ontario, Quebec and British Columbia in the weighted FE model, but not in other provinces or regions. As noted earlier, the results of the FE-IV models by province are not presented because the instrument did not pass the weak instruments test.
Rents
Similar to the results on house values, in the regression models for rents, the coefficient of the increase in the number of new immigrants on rents was larger in weighted estimates than in unweighted estimates, and larger in the FE-IV models than in FE models (Table 5). The discussion of results focuses on weighted results.
In the FE model pooling all three periods, one log-point increase in the number of new immigrants was associated with a 0.011 log-point increase in median rents across municipalities with at least 1,000 population, or a 1% increase in the number of new immigrants was associated with a 0.011% increase in rents. In the FE-IV model, a 1% increase in the number of new immigrants was associated with a 0.045% increase in rents. Over the study period, the average five-year increase in median rents was 0.052 log points across municipalities with a population of at least 1,000, while the average five-year increase in the number of new immigrants is 0.131 log points. Thus, the increase in the number of new immigrants accounted for 2.8% (=0.011*0.131/0.052) of the overall increase in median rents in the FE model, and 11.3% (=0.045*0.131/0.052) in the FE-IV model.
Table 5
First-differences models with municipality fixed effects and instrumental variables predicting log median rents across municipalities with at least 1,000 population, Canada
| Pooled three periods | Pooled 2006 to 2011 and 2011 to 2016 | Pooled 2011 to 2016 and 2016 to 2021 | Pooled 2006 to 2011 and 2016 to 2021 | |||||
|---|---|---|---|---|---|---|---|---|
| coefficient | robust standard error | coefficient | robust standard error | coefficient | robust standard error | coefficient | robust standard error | |
| Not weighted – Fixed effects models | ||||||||
| Change in log number of new immigrants | 0.002 | 0.003 | 0.001 | 0.004 | 0.000 | 0.004 | 0.005 | 0.004 |
| Initial share of Canadian-born population | 0.005Table footnote * | 0.002 | 0.004 | 0.005 | 0.004 | 0.003 | 0.005 | 0.002 |
| Change in log number of dwellings | 0.017 | 0.061 | -0.124 | 0.109 | 0.050 | 0.068 | 0.084 | 0.064 |
| Change in log adult-equivalent adjusted income | 0.176Table footnote *** | 0.050 | 0.056 | 0.068 | 0.158Table footnote * | 0.064 | 0.368Table footnote *** | 0.054 |
| Changes in percentage of seniors aged 65 or older | -0.003 | 0.002 | -0.001 | 0.003 | -0.005Table footnote ** | 0.002 | -0.001 | 0.003 |
| Change in percentage of young adults aged 19 to 34 | 0.000 | 0.002 | 0.000 | 0.002 | 0.001 | 0.002 | 0.001 | 0.002 |
| Change in unemployment rate | 0.003Table footnote * | 0.001 | 0.001 | 0.002 | 0.003 | 0.001 | 0.005Table footnote *** | 0.002 |
| Not weighted – Fixed effects instrumental variables models | ||||||||
| Change in log number of new immigrants | 0.022 | 0.022 | 0.020 | 0.028 | 0.055 | 0.047 | -0.007 | 0.030 |
| Initial share of Canadian-born population | 0.000 | 0.006 | -0.002 | 0.010 | -0.009 | 0.012 | 0.007 | 0.006 |
| Change in log number of dwellings | 0.002 | 0.066 | -0.145 | 0.119 | 0.012 | 0.081 | 0.089 | 0.065 |
| Change in log adult-equivalent adjusted income | 0.178Table footnote *** | 0.050 | 0.067 | 0.070 | 0.130 | 0.071 | 0.368Table footnote *** | 0.054 |
| Changes in percentage of seniors aged 65 or older | -0.003 | 0.002 | -0.001 | 0.003 | -0.005Table footnote ** | 0.002 | -0.001 | 0.003 |
| Change in percentage of young adults aged 19 to 34 | 0.001 | 0.002 | 0.000 | 0.002 | 0.001 | 0.002 | 0.001 | 0.002 |
| Change in unemployment rate | 0.002 | 0.001 | 0.001 | 0.002 | 0.002 | 0.002 | 0.005Table footnote *** | 0.002 |
| Weighted by municipality total population – Fixed effects models | ||||||||
| Change in log number of new immigrants | 0.011Table footnote *** | 0.003 | 0.000 | 0.004 | 0.011Table footnote ** | 0.003 | 0.020Table footnote *** | 0.005 |
| Initial share of Canadian-born population | 0.008Table footnote * | 0.003 | 0.007 | 0.004 | 0.004 | 0.004 | 0.005 | 0.003 |
| Change in log number of dwellings | 0.036 | 0.061 | 0.025 | 0.095 | 0.098 | 0.066 | -0.020 | 0.070 |
| Change in log adult-equivalent adjusted income | 0.537Table footnote *** | 0.066 | 0.133Table footnote * | 0.065 | 0.424Table footnote *** | 0.075 | 0.763Table footnote *** | 0.088 |
| Changes in percentage of seniors aged 65 or older | -0.005Table footnote * | 0.002 | 0.000 | 0.002 | -0.010Table footnote *** | 0.002 | -0.007Table footnote * | 0.003 |
| Change in percentage of young adults aged 19 to 34 | 0.013Table footnote *** | 0.002 | 0.009Table footnote *** | 0.003 | 0.007Table footnote ** | 0.003 | 0.016Table footnote *** | 0.003 |
| Change in unemployment rate | 0.004Table footnote ** | 0.001 | -0.006Table footnote *** | 0.001 | 0.007Table footnote *** | 0.001 | 0.008Table footnote *** | 0.002 |
| Weighted by municipality total population – Fixed effects instrumental variables models | ||||||||
| Change in log number of new immigrants | 0.045Table footnote * | 0.019 | 0.004 | 0.028 | 0.075Table footnote * | 0.032 | 0.056Table footnote * | 0.026 |
| Initial share of Canadian-born population | 0.004 | 0.004 | 0.007 | 0.005 | -0.004 | 0.005 | 0.002 | 0.004 |
| Change in log number of dwellings | 0.013 | 0.061 | 0.020 | 0.104 | 0.061 | 0.067 | -0.032 | 0.069 |
| Change in log adult-equivalent adjusted income | 0.525Table footnote *** | 0.066 | 0.133Table footnote * | 0.065 | 0.402Table footnote *** | 0.071 | 0.752Table footnote *** | 0.086 |
| Changes in percentage of seniors aged 65 or older | -0.004Table footnote * | 0.002 | 0.000 | 0.002 | -0.008Table footnote *** | 0.002 | -0.006 | 0.003 |
| Change in percentage of young adults aged 19 to 34 | 0.013Table footnote *** | 0.002 | 0.009Table footnote ** | 0.003 | 0.007Table footnote * | 0.003 | 0.015Table footnote *** | 0.003 |
| Change in unemployment rate | 0.003Table footnote ** | 0.001 | -0.006Table footnote *** | 0.001 | 0.005Table footnote *** | 0.001 | 0.007Table footnote *** | 0.002 |
Note: All models also include municipality and period fixed effects. The first model contains 1,999 unique municipalities and 5,819 observations, with an F value of 67 (p<0.001) for the fixed effects (FE) model and 70 (p<0.001) for the fixed effects instrumental variables (FE-IV) model. The second model contains 1,980 unique municipalities and 3,879 observations, with an F value of 25 (p<0.001) for the FE model and 25 (p<0.001) for the FE-IV model. The third model contains 1,964 unique municipalities and 3,885 observations, with an F value of 36 (p<0.001) for the FE model and 39 for the FE-IV model . The fourth model contain 1,993 unique municipalities and 3,874 observations, with an F value of 86 (p<0.001) for the FE model and 81 for the FE-IV model.
Sources: Statistics Canada, 2001, 2006, 2016 and 2021 Census of Population, and 2011 National Household Survey
The coefficients for the control variables show that increases in median family income, the share of young adults, and unemployment rates were associated with increased rents, while the increase in the share of seniors was associated with reduced rents.
When the models were run for two pooled periods, the coefficient for changes in the number of new immigrants was significant in the pooled 2011–2016 and 2016–2021 periods and in the pooled 2006–2011 and 2016–2021 periods, but not in the pooled 2006–2011 and 2011– 2016 periods.
The effect of rising numbers of new immigrants on rents appeared to increase with the population size of municipalities, as shown in Table 6. Specifically, in municipalities with a population of at least 100,000, a one log-point increase in the number of new immigrants corresponded to a 0.077 log-point rise in median rents according to the weighted FE model, and a 0.086 log-point increase based on the weighted FE-IV model. At the aggregate level, for municipalities with populations over 100,000, median rents went up by 0.057 log points while the new immigrant population saw a 0.089 log-point increase. Consequently, the growth in new immigrants accounted for 12.0% of the overall rent increase (0.077*0.089/0.057) in the FE model, or 13.4% (0.086*0.089/0.057) according to the FE-IV model estimate.
Across geographic regions, the coefficient for the increase in the number of new immigrants was statistically significant only in Ontario and British Columbia.
Table 6
Coefficients of changes in the log number of new immigrants in first-difference models with municipality fixed effects and instrumental variables predicting log median rents across municipalities, by population size and geographic region
By the population size of municipality
| Fixed effects model | Fixed effects instrumental variables model | |||
|---|---|---|---|---|
| coefficient | robust standard error | coefficient | robust standard error | |
| Population 5,000 or more | ||||
| Not weighted | 0.003 | 0.004 | 0.011 | 0.024 |
| Weighted by municipality population | 0.015Table footnote *** | 0.005 | 0.052Table footnote * | 0.026 |
| Population 10,000 or more | ||||
| Not weighted | 0.012 | 0.006 | -0.006 | 0.034 |
| Weighted by municipality population | 0.030Table footnote *** | 0.008 | 0.067Table footnote * | 0.033 |
| Population 100,000 or more | ||||
| Not weighted | 0.085Table footnote * | 0.036 | 0.097 | 0.058 |
| Weighted by municipality population | 0.077Table footnote * | 0.031 | 0.086Table footnote * | 0.041 |
| Population above 1,000 to under 50,000 | ||||
| Not weighted | 0.001 | 0.003 | 0.021 | 0.022 |
| Weighted by municipality population | 0.004 | 0.003 | 0.031 | 0.019 |
| Population above 1,000 to under 10,000 | ||||
| Not weighted | 0.001 | 0.003 | 0.020 | 0.025 |
| Weighted by municipality population | 0.000 | 0.003 | 0.024 | 0.023 |
By geographic region
| Fixed effects model | ||
|---|---|---|
| coefficient | robust standard error | |
| Atlantic provinces | ||
| Not weighted | -0.002 | 0.005 |
| Weighted by municipality population | -0.001 | 0.005 |
| Quebec | ||
| Not weighted | -0.003 | 0.004 |
| Weighted by municipality population | -0.001 | 0.003 |
| Ontario | ||
| Not weighted | 0.018 | 0.010 |
| Weighted by municipality population | 0.015Table footnote * | 0.006 |
| Manitoba and Saskatchewan | ||
| Not weighted | 0.003 | 0.010 |
| Weighted by municipality population | 0.018 | 0.031 |
| Alberta | ||
| Not weighted | -0.008 | 0.008 |
| Weighted by municipality population | -0.006 | 0.008 |
| British Columbia | ||
| Not weighted | 0.005 | 0.009 |
| Weighted by municipality population | 0.023Table footnote * | 0.009 |
Note: Each model also includes municipality and period fixed effects and other control variables in Table 5. The model for municipalities with a population 5,000 or more has 708 unique municipalities, 2124 observations, and F-value of 72 (p<0.001) for the fixed effects (FE) model and 71 (p<.0.001) for the fixed-effect instrumental variables (FE-IV) model. The model for municipalities with a population 10,000 or more has 403 unique municipalities, 1209 observations, and F-value of 77 (p<0.001) for the FE model and 71 (p<0.001) for the FE-IV model; The model for municipalities with a population 100,000 or more has 53 unique municipalities, 159 observations, and F-value of 83 (p<0.001) for the FE model and 67 (p<0.001) for the FE-IV model. The model for municipalities with a population 1,000 to 50,000 has 1,899 unique municipalities, 5,519 observations, and F-value of 38 (p<0.001) for the FE model and 37 (p<0.001) for then FE-IV model. The model for municipalities with a population 1,000 to 10,000 has 1,899 unique municipalities, 5,519 observations, and F-value of 38 (p<0.001) for the FE model and 23 (p<0.001) for the FE-IV mode. The numbers of unique municipalities, observations and F-values are 320, 931, and 4 for Atlantic provinces; 638, 1861, and 41 for Quebec; 346, 1026, and 219 for Ontario; 228, 633, and 8 for Manitoba and Saskatchewan; 177, 521, and 54 for Alberta; and 267, 784, and 29 for British Columbia.
Sources: Statistics Canada, 2001, 2006, 2016 and 2021 Census of Population, and 2011 National Household Survey
Conclusion and discussions
This study examined the empirical association between the growth in new immigrants and median house values of owner-occupied dwellings as well as median rents for rental dwellings from 2006 to 2021. The analysis used municipal-level panel data from the long-form census and employed first-difference fixed-effects instrumental variables models.
The results show that, over the study period, the rise in the influx of new immigrants, who arrived in Canada within the past five years, on average, accounted for 11% of the rise in median house values and in median rents across municipalities with a population of at least 1,000. This association was notably more pronounced in larger municipalities. In the 53 municipalities with a population exceeding 100,000, which together attracted over 80% of new immigrants, the rise in new immigrants accounted for 21% of the overall increase in median house values and 13% of the increase in median rents. In these large municipalities, the effect on house values tended to be larger than on rents, possibly due to rent control policies in many provinces that can cap rent increases for certain properties (Gorski, 2023).
However, the connection between immigration and housing prices varied over time and across regions, highlighting that immigration is not the solitary factor influencing housing prices. Its impact is often conditioned on local economic conditions, housing policies, and supply challenges, along with other regional factors that change over time. For example, there was a noticeable discrepancy between the regions where new immigrants settled and where housing prices increased in the period from 2011 to 2016, when Saskatchewan and Alberta saw significant immigrant growth but little change in housing values. Conversely, Ontario received fewer new immigrants yet experienced the most rapid increase in housing values. This mismatch resulted in a negative correlation between new immigrants and housing prices during that period. However, in the subsequent five years, the number of new immigrants grew mostly in Ontario where house prices continued the upward trend, while the Prairie provinces saw both a decrease in new immigrants and a stabilization or minor increase in housing prices, leading to a positive correlation during that period.
The association between housing prices and new immigrants was not uniform across provinces. Ontario, British Columbia and Quebec—provinces that hosted the most immigrants and had some of the highest housing prices—saw a positive correlation between immigration growth and housing prices during the study period. Conversely, in other provinces the relationship was generally not statistically significant. This variation indicates that immigration's impact on housing costs may be more significant in certain provinces, likely due to a combination of factors influencing housing demand and supply within each province's unique economic and housing landscape.
The varied impact of immigration on housing prices across different regions and time periods suggests that any observed trends are closely tied to the specific economic and policy context of each region and time period. As such, the patterns noted from 2006 to 2021 may not necessarily persist into the future, as the dynamic interplay between immigration and housing prices can be altered by numerous factors. Therefore, both the spatial and temporal dimensions should be incorporated into policy assessments of how immigration impacts the housing market.
References
- Aitken, A. (2015). Essays on Prices, Wealth, and Mobility. PhD thesis, https://pure.royalholloway.ac.uk/ws/portalfiles/portal/24137549/andrewaitken thesis.pdf (PDF, 11.6 MB). Accessed December 18, 2026
- Akbari, A. H., & Aydede, Y. (2012). Effects of immigration on house prices in Canada. Applied Economics, 44(13), 1645–1658.
- Bernhard, D. (2023). Immigrants didn't cause our failings. We did that all by ourselves. The Globe and Mail, September 15, 2023.
- Bian, X., Coulson, N. E., & Sun, X. (2023). Warmth of the welcome: Immigration and local housing returns. https://doi.org/10.2139/ssrn.4490130
- Bonikowska, A., Hou, F., & Picot, P. (2017). New immigrants seeking new places: The role of program changes in the regional redistribution of entering immigrants. Growth and Change 48(1):174–190.
- Burchardi, K. B., Chaney, T. & Hassan, T. A. (2019). Migrants, ancestors, and foreign investments. The Review of Economic Studies, 86(4), 1448–1486.
- Caranci, B., Orlando, J. & Sondhi, R. (2023) Balancing Canada’s pop in population, TD economics, https://economics.td.com/ca-balancing-canada-population Accessed Sept 15, 2023.
- Chong, F. (2020). Housing Price, Mortgage Interest Rate and Immigration. Real Estate Management and Valuation, 28(3), 36–44.
- Canada Mortgage and Housing Corporation. (2021). Methodologies for the Housing Market Assessment (HMA). https://www.cmhc-schl.gc.ca/professionals/housing-markets-data-and-research/housing-research/surveys/methods/methodologies-housing-market-assessment#footnote13
- Canada Mortgage and Housing Corporation. (2023). Housing shortages in Canada: Updating how much housing we need by 2030. https://www.cmhc-schl.gc.ca/professionals/housing-markets-data-and-research/housing-research/research-reports/accelerate-supply/housing-shortages-canada-updating-how-much-we-need-by-2030
- Cochrane, W., Poot, J. (2021). Effects of Immigration on Local Housing Markets. In: Kourtit, K., Newbold, B., Nijkamp, P., Partridge, M. (eds) The Economic Geography of Cross-Border Migration. Springer, Cham. https://doi.org/10.1007/978-3-030-48291-6_12
- D’Albis, H., Boubtane, E., & Coulibaly, D. (2019). International migration and regional housing markets: Evidence from France. International Regional Science Review, 42(2) 147–180.
- Filipowicz, J. & Lafleur, S. (2023). Getting our houses in order: How a lack of intergovernmental policy coordination undermines housing affordability in Canada. Macdonald-Laurier Institute https://macdonaldlaurier.ca/getting-our-houses-in-order-how-a-lack-of-intergovernmental-policy-coordination-undermines-housing-affordability-in-canada Accessed April 28, 2023.
- Fortin, P. (2023). La croissance démographique provoque la crise de l’habitation https://lactualite.com/lactualite-affaires/la-croissance-demographique-provoque-la-crise-de-lhabitation
- Gorski, A. (2023). A tale of two renters: Housing affordability among recent and existing renters in Canada (statcan.gc.ca), Statistics Canada.
- Jaeger, D. A., Ruist, J., & Stuhler, J. (2018). Shift-share instruments and the impact of immigration (Working Paper 24285). National Bureau of Economic Research. https://www.nber.org/papers/w24285.
- Khan, M., Bilyk, O., & Ackman, M. (2021). Update on housing market imbalances and household indebtedness (2021–4). Bank of Canada. https://doi.org/10.34989/san-2021-4
- Latif, E. (2015). Immigration and Housing Rents in Canada: A Panel Data Analysis. Economic Issues, 20(1), 91–108.
- Ley, D., & Tutchener, J. (2001). Immigration, globalisation and house prices in Canada’s gateway cities. Housing Studies, 16(2), 199–223. https://doi.org/10.1080/02673030120038483
- Marion, S. (2023). Hot Charts - Canada: A housing affordability Armageddon? National Bank of Canada, August 2, 2023. Accessed August 3, 2023.
- Mussa, A., Nwaogu, U. G., & Pozo, S. (2017). Immigration and housing: A spatial econometric analysis. Journal of Housing Economics, 35(C), 13–25.
- Ottaviano, G. I. P., & Peri, G. (2005). Rethinking the Gains from Immigration: Theory and Evidence from the U.S. National Bureau of Economic Research. https://www.nber.org/papers/w11672
- Paciorek, A. (2011). Supply Constraints and Housing Market Dynamics. https://doi.org/10.2139/ssrn.1982538
- Pavlov, A., & Somerville, T. (2020). Immigration, capital flows and housing prices. Real Estate Economics, 48(3), 915–949. https://doi.org/10.1111/1540-6229.12267
- Peri, G., Shih, K., & Sparber, C. (2015). STEM workers, H-1B visas, and productivity in US cities. Journal of Labor Economics, 33(S1), S225–S255. https://doi.org/10.1086/679061
- Picot, G., Hou, F., & Crossman, E. (2023). The Provincial Nominee Program: Its expansion in Canada, Economic and Social Reports. https://doi.org/10.25318/36280001202300700004-eng
- Sá, F. (2015). Immigration and house prices in the UK. The Economic Journal, 125(587), 1393–1424. https://doi.org/10.1111/ecoj.12158
- Saiz, A. (2003). Room in the kitchen for the melting pot: Immigration and rental prices, Review of Economics and Statistics, 85 (3), 502–521.
- Saiz, A. (2007). Immigration and housing rents in American cities. Journal of urban Economics, 61(2), 345–371.
- Sharpe, J. (2019). Re-evaluating the impact of immigration on the U.S. rental housing market. Journal of Urban Economics, 111, 14–34. https://doi.org/10.1016/j.jue.2019.04.001
- Stillman, S., & Maré, D. C. (2008). Housing Markets and Migration: Evidence from New Zealand. https://dx.doi.org/10.2139/ssrn.1146724
- Tyrcha, A. (2020). Migration and housing markets—Evidence from Sweden. https://doi.org/10.17863/CAM.53118
- Unal, U., Hayo, B., & Erol, I. (2022). The effect of immigration on the German housing market (Working Paper 38–2022). MAGKS Joint Discussion Paper Series in Economics. https://hdl.handle.net/10419/273876