
Expensive Drugs for Rare Diseases: Canadian Trends and International Comparisons, 2011–2020
January 2022
ISBN: 978-0-660-41135-4
Cat. No.: H82-53/2022E-PDF
Table of Contents
Acknowledgements
This analysis was prepared by the Patented Medicine Prices Review Board (PMPRB) as part of the National Prescription Drug Utilization Information System (NPDUIS) and was done at the request and in consultation with members of the NPDUIS Advisory Committee.
Appreciation goes to Brian O’Shea and Caroline Peterson for leading this analytical project, as well as to Tanya Potashnik, Jeffrey Menzies, and Elena Lungu for their oversight in the development of the analysis.
The PMPRB also wishes to acknowledge the contributions of analytical staff Jun Yu, Jared Berger, and Yvonne Zhang, as well as editorial staff Sarah Parker, Shirin Paynter, and Laura Fortune.
Disclaimer
NPDUIS operates independently of the regulatory activities of the Board of the PMPRB. The research priorities, data, statements, and opinions expressed or reflected in NPDUIS reports do not represent the position of the PMPRB with respect to any regulatory matter. NPDUIS reports do not contain information that is confidential or privileged under sections 87 and 88 of the Patent Act, and the mention of a medicine in an NPDUIS report is not and should not be understood as an admission or denial that the medicine is subject to filings under sections 80, 81, or 82 of the Patent Act or that its price is or is not excessive under section 85 of the Patent Act.
Although this information is based in part on data obtained from the NPDUIS Database of the Canadian Institute for Health Information (CIHI) and under license from the MIDAS®, and Private Pay Direct Drug Plan databases proprietary to IQVIA Solutions Canada Inc. and/or its affiliates (“IQVIA”), as well as from GlobalData, the statements, findings, conclusions, views, and opinions expressed in this report are exclusively those of the PMPRB and are not attributable to CIHI, IQVIA, or GlobalData.
Contact Information
Patented Medicine Prices Review Board
Standard Life Centre
Box L40
333 Laurier Avenue West Suite 1400
Ottawa, ON K1P 1C1
Tel.: 1-877-861-2350
TTY 613-288-9654
Email: PMPRB.Information-Renseignements.CEPMB@pmprb-cepmb.gc.ca
Web: https://www.canada.ca/en/patented-medicine-prices-review.html
Introduction
Over the past decade, the Canadian pharmaceutical market has experienced a rapid rise in the number of new approvals for "orphan" medicines used to treat rare diseases and conditions. The highest-cost orphan medicines—those with treatment costs in excess of $100,000 per year, or $7,500 per 28-day cycle for oncology—represent an increasingly important segment of the market classified in this analysis as “expensive drugs for rare diseases” (EDRDs).
EDRD sales in Canada reached $3.1 billion in 2020, more than 11 times the total in 2011. Given this pace of growth, there is a need for a better understanding of the impact of these medicines on drug plan budgets in Canada and around the world.
The chartbook provides an overview of the market for EDRDs, touching on current policies in Canada and comparator countries. The first section summarizes the 104 EDRDs currently sold in Canada, including the results of assessments performed by Canadian health agencies; the second examines the impact of these EDRDs on the Canadian market and how price levels compare internationally; and the final section focuses on recently approved EDRDs, comparing approvals in Canada to the PMPRB comparator countries and the broader Organisation for Economic Cooperation and Development (OECD).
Summary of Findings
The pace of EDRD approvals in Canada has increased over the past decade, with the majority of EDRDs currently on the market approved after 2015. As of the end of 2020, a total of 104 EDRDs had received approval in Canada.
EDRD sales have grown at an average annual rate of nearly 32% since 2011, reaching $3.1 billion in 2020, or 10.4% of the Canadian pharmaceutical market.
Oncology medicines make up 54% of the EDRDs approved in Canada, accounting for 76% of EDRD sales in 2020.
Most EDRDs have received a reimbursement recommendation from CADTH with a reduced price as a criteria, and about half were the subject of a successfully concluded negotiation with the pCPA for an orphan indication.
Canadian list prices for patented EDRDs are closer to the OECD median than for patented medicines in general, but these results do not reflect confidential rebates negotiated in each country.
EDRDs account for a sizeable segment of recent international approvals, and Canada has a launch rate commensurate with that of the PMPRB11 for EDRDs approved internationally from 2015 to 2019.
National and International Orphan Drug Policies
Orphan medicines
The US Food and Drug Administration (FDA) and the European Medicines Agency (EMA) assign an orphan designation to medicines used to treat rare diseases or medical conditions. The prevalence rates used to define the term “rare disease” vary: in the US it is defined as a disease that affects fewer than 200,000 Americans, while in the European Union a disease is defined as rare when it affects fewer than 1 in 2,000 people.Footnote 1
Orphan drug policies
Governments around the world have introduced various policies that incentivized the development of medicines with an orphan status.
To improve Canadians’ access to rare disease medicines, the Canadian government has sought public input on developing a national strategy on drugs for rare diseases and plans to implement an initiative to improve access to treatments beginning in 2022.Footnote 2
- Canada National Strategy for Drugs for Rare Diseases: $1B over 2 years for 2022-2023, up to $500M ongoing.
- Australia Orphan drug program (1997; amendments in 2017): evaluation fees waived, priority review.
- EU Regulation on Orphan Medicinal Products (2000): targets medicines treating less than 5 in 10,000 people.
- Japan Pharmaceutical Affairs Act (Amended 1993): Orphan designation criteria, priority approval, incentives and subsidies.
- UK Strategy for Rare Disease (2013); England’s Highly Specialised Technology Programme (HST) allows for prioritization.
- US Orphan Drug Act (1983); Office of Orphan Products Development (OOPD); Orphan Grants Program; Orphan Drug Modernization Plan (2017).
Methods
Drug Selection
EDRDs were defined as medicines with at least one orphan designated indication through either the FDA or EMA, and with estimated treatment costs exceeding $100,000 per year for non-oncology medicines or $7,500 per 28 days for oncology medicines.
Using this definition,104 medicines or combinations of medicines approved in Canada were identified for this analysis.
For Section 3, new EDRDs in international markets were identified as orphan medicines meeting the EDRD cost threshold that had received first-time approval from Health Canada, the US FDA, and/or the EMA from 2015 to 2019. Some of the EDRDs on this list may not yet have sales in Canada.
Approach
International markets examined include the Organisation for Economic Cooperation and Development (OECD) countries, with a focus on Australia, Belgium, France, Germany, Italy, Japan, Norway, Spain, Sweden, and the United Kingdom (UK), which along with the Netherlands will comprise the 11 PMPRB Schedule Countries (“PMPRB11”) specified in the amended Patented Medicine Regulations, which are scheduled to come into force on July 1, 2022.
The Netherlands was excluded from this analysis due to inconsistencies in the available data. Switzerland and the United States (US) are also shown for comparison, as well as the median of the current 7 PMPRB Schedule Countries (“PMPRB7”: France, Germany, Italy, Sweden, Switzerland, the UK, and the US).
Average foreign-to-Canadian price ratios for the selected medicines were calculated for a variety of bilateral and multilateral measures. Bilateral price ratios compare the price levels for an individual country to those in Canada, weighted by Canadian sales, while multilateral ratios compare the prices across groups of countries (PMPRB11 and OECD) to those in Canada.
Data Sources
Orphan indications were sourced from the US FDA’s Orphan Drug Product database, and the European Commission’s Community Register of orphan medicinal products.
Treatment costs were sourced from Canadian Agency for Drugs & Technologies in Health (CADTH) reports or calculated using product monograph dosing and public list prices when necessary.
Results pertaining to the Canadian national market, as well as international comparisons, are based on data captured in the IQVIA MIDAS® Database (all rights reserved). Sales were projected for Canadian medicines for which MIDAS data was not available.
GlobalData’s Healthcare database was used for the analysis of the share of drugs in development with an orphan designation.
Population data for per capita calculations was sourced from The World Bank.
For more information on the data sources used, as well as the calculation of foreign-to-Canadian price ratios, see the PMPRB website.
Limitations
The purpose of this report is to provide an overview of the EDRD market in Canada, including sales totals and international price comparisons. It is not intended to assess the appropriateness of these levels.
Available sales data does not distinguish between indications. Amounts reported here include use of EDRDs in all approved indications, both orphan and non-orphan.
Canadian and international sales and list prices available in the IQVIA MIDAS® Database are estimated manufacturer factory-gate list prices and do not reflect off-invoice price rebates and allowances, managed entry agreements, or patient access schemes.
1. EDRD Approvals in Canada
This section provides an overview of the 104 EDRDs approved for sale in Canada by 2020.
The pace of EDRD approvals in Canada has increased over the past decade
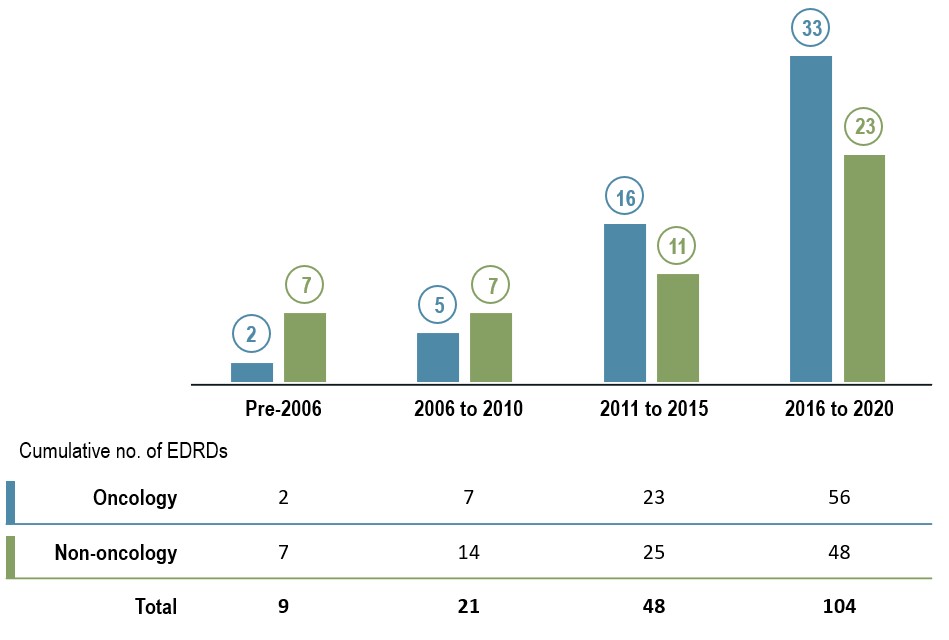
Until 2010, few medicines in Canada met the criteria to be an EDRD. Over the past decade, however, the number of EDRDs gaining market approval has grown substantially. The total number of EDRDs more than doubled from 2011 to 2015 and doubled again from 2016 to 2020 to reach 104.
The large number of EDRDs, especially oncology medicines, coming to market in recent years has been a major driver of the overall growth in EDRD sales.
Figure 1.1 EDRD approvals in Canada by year of Notice of Compliance, oncology and non-oncology, as of 2020
Long description
A bar graph gives the number of new EDRDs approved in Canada by the year that they received a Notice of Compliance. Results are given for oncology EDRDs as well as non-oncology EDRDs. The cumulative number of EDRDs for each period are shown in a table below the graph.
| Number of oncology EDRDs approved | Number of non-oncology EDRDs approved | Cumulative number of oncology EDRDs approved | Cumulative number of non-oncology EDRDs approved | Cumulative total number of EDRDs approved | |
|---|---|---|---|---|---|
Pre-2006 |
2 |
7 |
2 |
7 |
9 |
2006–2010 |
5 |
7 |
7 |
14 |
21 |
2011–2015 |
16 |
11 |
23 |
25 |
48 |
2016–2020 |
33 |
23 |
56 |
48 |
104 |
Data source: Health Canada Drug Product Database.
Newer oncology EDRDs have moderately higher treatment costs
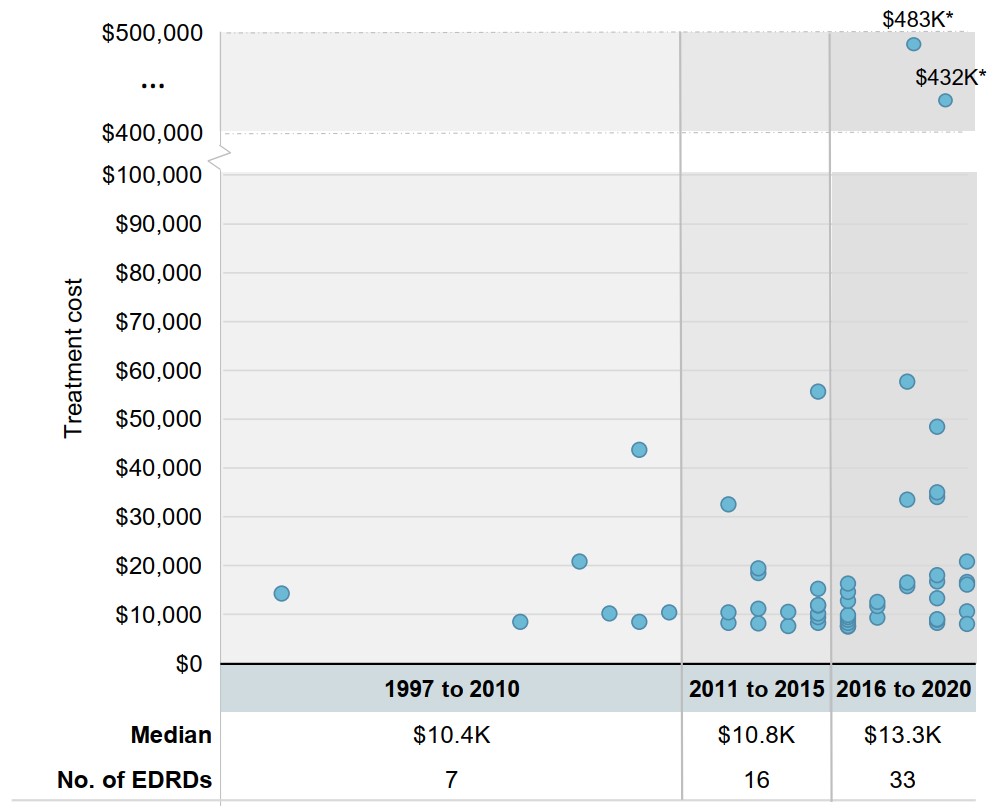
With the exception of two outlier one-time treatments, the range of 28-day treatment costs for oncology EDRDs has not substantially expanded in the past five years. However, the median treatment cost has increased for oncology EDRDs approved since 2016, even as these new entries have grown to outnumber existing EDRDs.
Figure 1.2 28-day treatment costs for oncology EDRDs in Canada by year of Notice of Compliance, 1997 to 2020
Long description
A scatter plot graph shows the range of 28-day treatment costs for oncology EDRDs in Canada by the year they received a Notice of Compliance. Years are organized into three periods: 1997 to 2010, 2011 to 2015, and 2016 to 2020. Median treatment costs for each period are given in a table below the graph, along with the number of oncology EDRDs approved during that timeframe.
| Year of Notice of Compliance | 28-day treatment cost | Median treatment cost, in thousands of dollars | Number of EDRDs | |
|---|---|---|---|---|
1997 |
1997 |
$14,203 |
$10.4 |
7 |
2005 |
$8,400 |
|||
2007 |
$20,827 |
|||
2008 |
$10,108 |
|||
2009 |
$8,456 |
|||
2009 |
$43,659 |
|||
2010 |
$10,408 |
|||
2011 to 2015 |
2012 |
$8,213 |
$10.8 |
16 |
2012 |
$10,425 |
|||
2012 |
$32,480 |
|||
2013 |
$8,120 |
|||
2013 |
$11,130 |
|||
2013 |
$18,425 |
|||
2013 |
$19,360 |
|||
2014 |
$7,615 |
|||
2014 |
$10,500 |
|||
2015 |
$8,213 |
|||
2015 |
$9,445 |
|||
2015 |
$10,186 |
|||
2015 |
$11,733 |
|||
2015 |
$11,870 |
|||
2015 |
$15,213 |
|||
2015 |
$55,594 |
|||
2016 to 2020 |
2016 |
$7,500 |
$13.3 |
33 |
2016 |
$7,567 |
|||
2016 |
$7,615 |
|||
2016 |
$8,251 |
|||
2016 |
$8,894 |
|||
2016 |
$9,445 |
|||
2016 |
$9,807 |
|||
2016 |
$12,696 |
|||
2016 |
$14,594 |
|||
2016 |
$16,252 |
|||
2017 |
$9,275 |
|||
2017 |
$11,614 |
|||
2017 |
$12,536 |
|||
2018 |
$15,700 |
|||
2018 |
$16,486 |
|||
2018 |
$33,410 |
|||
2018 |
$57,623 |
|||
2018 |
$482,549* |
|||
2019 |
$8,213 |
|||
2019 |
$8,832 |
|||
2019 |
$8,958 |
|||
2019 |
$13,300 |
|||
2019 |
$16,700 |
|||
2019 |
$17,967 |
|||
2019 |
$34,048 |
|||
2019 |
$35,000 |
|||
2019 |
$48,350 |
|||
2019 |
$432,013* |
|||
2020 |
$8,008 |
|||
2020 |
$10,611 |
|||
2020 |
$16,039 |
|||
2020 |
$16,650 |
|||
2020 |
$20,748 |
|||
* One-time treatment.
Data source: CADTH; Health Canada Drug Product Database; product monographs.
Non-oncology EDRDs with multimillion-dollar treatment costs have gained approval in the past decade
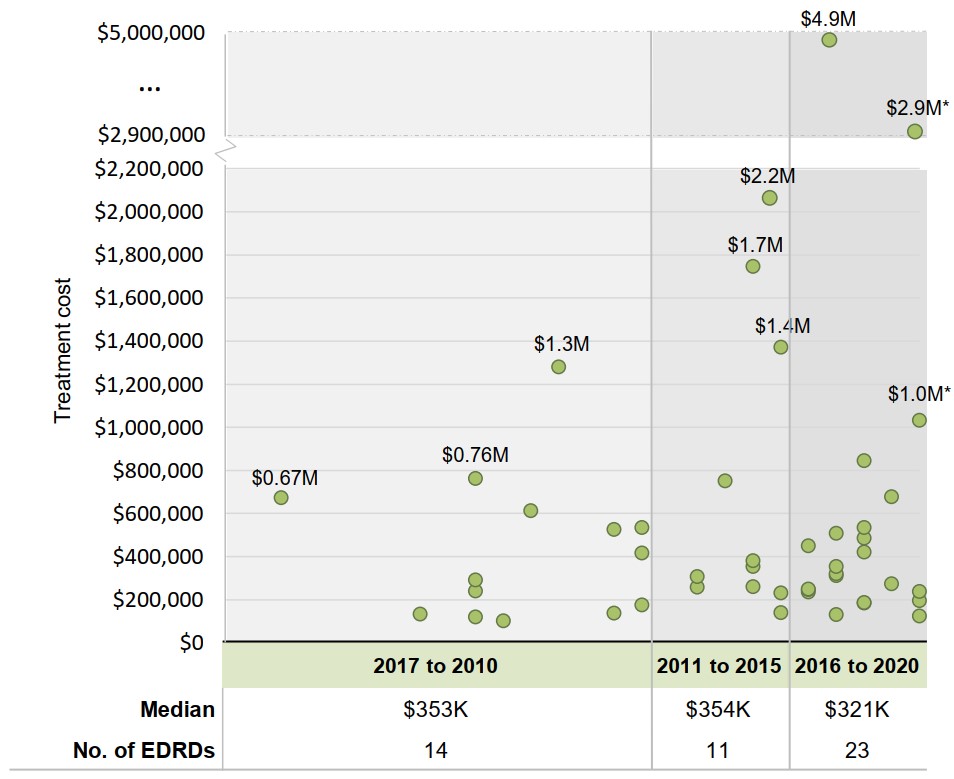
Since the start of the decade, a cohort of new medicines with multimillion-dollar annual costs per patient have gained market approval. Despite this, numerous launches in the $100,000 to $500,000 range resulted in a lower median for new launches than in previous periods.
Figure 1.3 Annual treatment costs for non-oncology EDRDs in Canada by year of Notice of Compliance, 1997 to 2020
Long description
A scatter plot graph shows the range of annual treatment costs for non-oncology EDRDs in Canada by the year they received a Notice of Compliance. Years are organized into three periods: 1997 to 2010, 2011 to 2015, and 2016 to 2020. Median treatment costs for each period are given in a table below the graph, along with the number of non-oncology EDRDs approved during that timeframe.
| Year of Notice of Compliance | Annual treatment cost | Median treatment cost, in thousands of dollars | Number of EDRDs | |
|---|---|---|---|---|
1997 to 2010 |
1997 |
$671,580 |
$353 |
14 |
2002 |
$132,452 |
|||
2004 |
$118,700 |
|||
2004 |
$239,200 |
|||
2004 |
$290,599 |
|||
2004 |
$760,760 |
|||
2005 |
$100,424 |
|||
2006 |
$611,746 |
|||
2007 |
$1,278,550 |
|||
2009 |
$137,696 |
|||
2009 |
$525,876 |
|||
2010 |
$173,971 |
|||
2010 |
$416,000 |
|||
2010 |
$533,715 |
|||
2011 to 2015 |
2012 |
$257,782 |
$354 |
11 |
2012 |
$306,600 |
|||
2013 |
$750,308 |
|||
2014 |
$259,200 |
|||
2014 |
$354,005 |
|||
2014 |
$379,600 |
|||
2014 |
$1,745,744 |
|||
2015 |
$140,087 |
|||
2015 |
$230,972 |
|||
2015 |
$1,370,119 |
|||
2015 |
$2,227,680 |
|||
2016 to 2020 |
2016 |
$236,088 |
$321 |
23 |
2016 |
$246,979 |
|||
2016 |
$248,988 |
|||
2016 |
$449,500 |
|||
2017 |
$130,089 |
|||
2017 |
$310,250 |
|||
2017 |
$321,000 |
|||
2017 |
$354,000 |
|||
2017 |
$507,350 |
|||
2017 |
$4,900,000 |
|||
2018 |
$183,232 |
|||
2018 |
$185,182 |
|||
2018 |
$420,000 |
|||
2018 |
$484,120 |
|||
2018 |
$533,988 |
|||
2018 |
$844,202 |
|||
2019 |
$274,092 |
|||
2019 |
$677,145 |
|||
2020 |
$122,850 |
|||
2020 |
$195,012 |
|||
2020 |
$236,840 |
|||
2020 |
$1,031,500* |
|||
2020 |
$2,910,500* |
|||
* One-time treatment.
Data source: CADTH; Health Canada Drug Product Database; product monographs.
EDRDs belong to a wide range of therapeutic classes
The most common non-oncology EDRD class is “other alimentary tract and metabolism products,” which includes enzyme replacement therapies used to treat Gaucher disease, among other indications.
The remaining non-oncology EDRDs are spread out among 11 other ATC classes.
Figure 1.4 Distribution of EDRDs in Canada by Anatomical Therapeutic Chemical (ATC) class*

Long description
A horizontal bar graph indicates the distribution of EDRDs approved in Canada by their therapeutic class. Therapeutic class is reported based on level 2 of the Anatomical Therapeutic Chemical (ATC) classification system maintained by the World Health Organization (WHO).
| Therapeutic class | Number of EDRDs |
|---|---|
L01 Antineoplastic agents (oncology) |
53 |
A16 Other alimentary tract |
23 |
L04 Immunosuppressants |
5 |
N07 Other nervous system drugs |
4 |
B02 Antihemorrhagics |
4 |
R07 Other respiratory system products |
3 |
B06 Other hematological agents |
3 |
B01 Antithrombotic agents |
3 |
M09 Other drugs for disorders |
2 |
V10 Therapeutic radiopharmaceuticals |
1 |
S01 Ophthalmologicals |
1 |
M05 Drugs for treatment of bone diseases |
1 |
C10 Lipid modifying agents |
1 |
* Therapeutic class is reported based on level 2 of the Anatomical Therapeutic Chemical (ATC) classification system maintained by the World Health Organization (WHO).
Data source: Health Canada Drug Product Database; WHO Collaborating Centre for Drug Statistics Methodology.
CADTH reimbursement reviews for EDRDs typically recommend price reduction
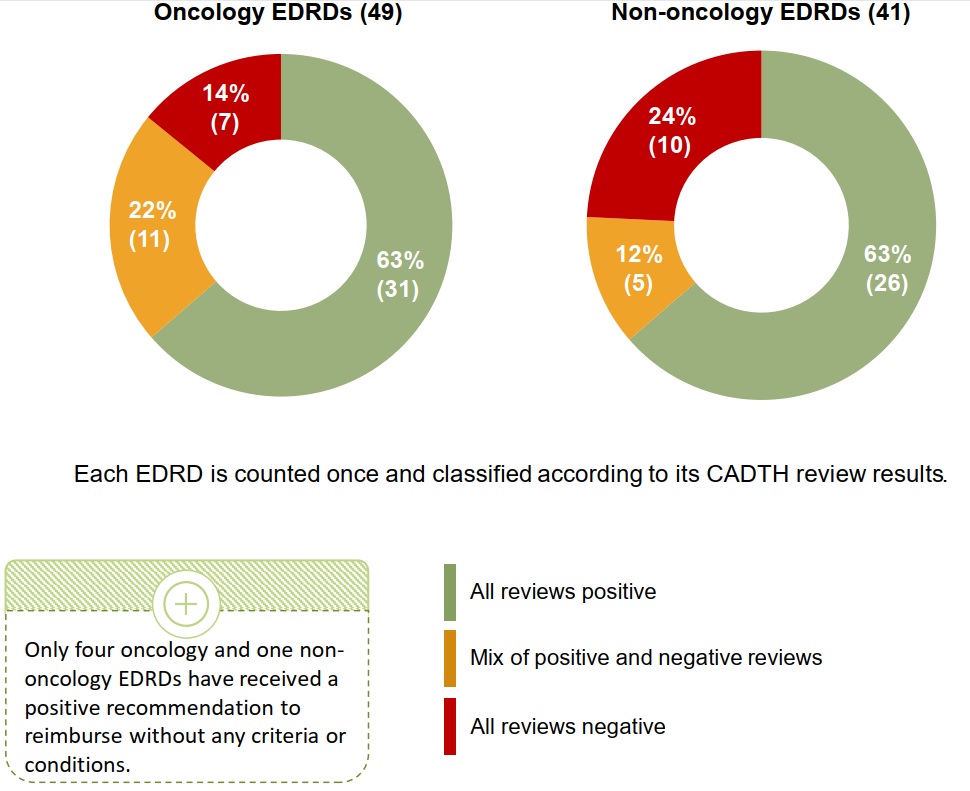
While the majority of oncology and non-oncology EDRDs have received at least one positive reimbursement recommendation from CADTH, it is almost always conditional on an improvement in cost-effectiveness over the manufacturer-submitted price.
Less common are medicines that received a mix of positive and negative recommendations for different indications, or solely negative recommendations to not reimburse.
Figure 1.5 CADTH reimbursement recommendations* for oncology and non-oncology EDRDs, as of March 2021
Long description
Two pie charts show the distribution of oncology and non-oncology EDRDs approved in Canada by their reimbursement recommendation received by the Canadian Agency for Drugs and Technologies in Health (CADTH). Results are given both as a count of medicines as well as a share of the total number of medicines in either the oncology category, which includes 49 medicines, or non-oncology category, which includes 41 medicines. Each EDRD is counted once and classified according to its CADTH review results. Recommendations are grouped into three segments: all reviews positive, mix of positive and negative reviews, and all reviews negative only. Positive recommendations include “Reimburse,” “Reimburse with clinical criteria and/or conditions,” “List,” and “List with clinical criteria and/or conditions.” Negative recommendations include “Do not reimburse” and “Do not list”.
Only four oncology and one non-oncology EDRDs have received a positive recommendation to reimburse without and criteria or conditions.
| All reviews positive | Mix of positive and negative reviews | All reviews negative | Total | |
|---|---|---|---|---|
Number of oncology EDRDs |
31 |
11 |
7 |
49 |
Share of oncology EDRDs |
63% |
22% |
14% |
100% |
Number of non-oncology EDRDs |
26 |
5 |
10 |
41 |
Share of non-oncology EDRDs |
63% |
12% |
24% |
100% |
* Positive recommendations include “Reimburse,” “Reimburse with clinical criteria and/or conditions,” “List,” and “List with clinical criteria and/or conditions.” Negative recommendations include “Do not reimburse” and “Do not list.”
Note: Seven oncology and seven non-oncology EDRDs did not have a final CADTH recommendation available at the time of the analysis.
Data source: CADTH.
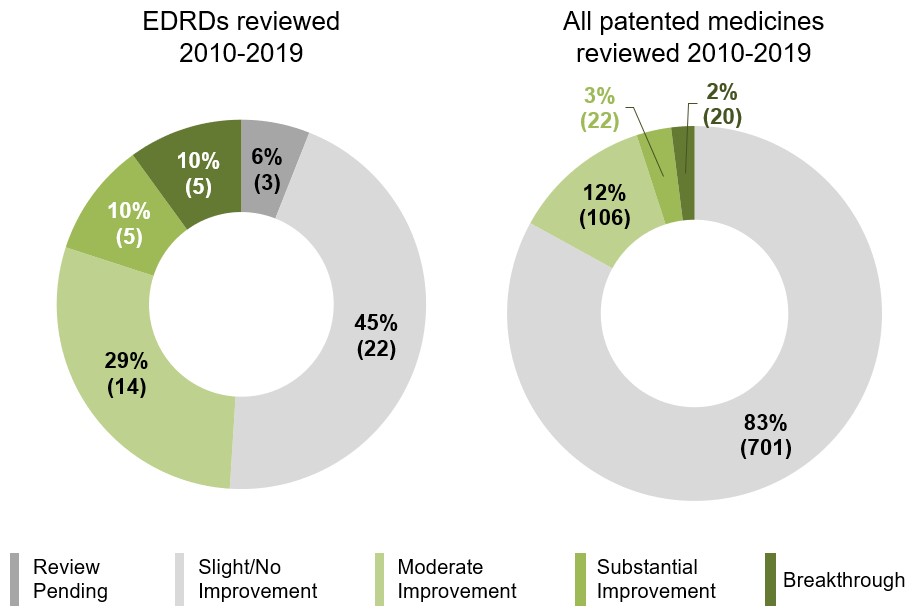
Just half of EDRDs reviewed by the PMPRB offer a therapeutic improvement over comparators
Of the 49 EDRDs with a completed or pending review under the current PMPRB Guidelines, 24 (49%) were recognized by the Human Drug Advisory Panel (HDAP) as offering a Moderate or greater therapeutic improvement over domestic comparators. For all medicines reviewed since the current PMPRB Guidelines came into effect in 2010, the comparable share was 17%.
Figure 1.6 Level of therapeutic improvement for EDRDs in Canada assessed by the PMPRB, as of 2019
Long description
Two pie charts give the distribution of medicines by their level of therapeutic improvement over comparator products, as assessed by the Patented Medicine Prices Review Board (PMPRB) from 2010 to 2019. The first is focused on the distribution of EDRDs reviewed by the PMPRB while the second presents the corresponding distribution for all patented medicines. Results for each chart are given by number of medicines as well as share of total medicines reviewed.
EDRDs reviewed 2010 to 2019
| Level of therapeutic improvement | Number of EDRDs | Share of EDRDs |
|---|---|---|
Breakthrough |
5 |
10% |
Substantial Improvement |
5 |
10% |
Moderate Improvement |
14 |
29% |
Slight/No Improvement |
22 |
45% |
Review pending |
3 |
6% |
All patented medicines reviewed 2010 to 2019
| Level of therapeutic improvement | Number of medicines | Share of medicines |
|---|---|---|
Breakthrough |
20 |
2% |
Substantial Improvement |
22 |
3% |
Moderate Improvement |
106 |
12% |
Slight/No Improvement |
701 |
83% |
Review pending |
0 |
0% |
Note: HDAP scientific reviews are based on the primary indication for a new medicine, which may be a non-orphan indication. Results of the HDAP reviews are published in the PMPRB’s Annual Report.
Data source: PMPRB.
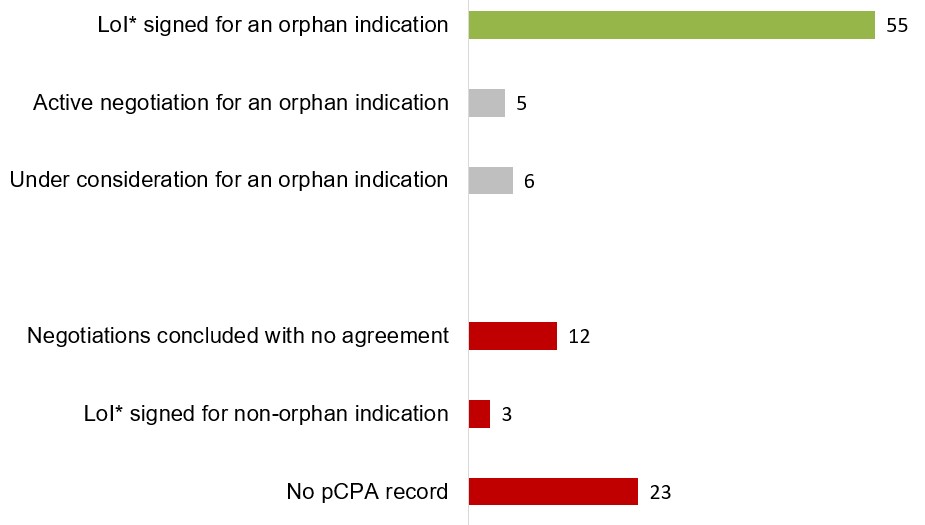
The pCPA has completed negotiations relating to an orphan indication for half of the EDRDs in Canada
The pan-Canadian Pharmaceutical Alliance (pCPA) has successfully concluded negotiations with the manufacturers of 55 EDRDs for an orphan indication and is in the process of negotiating or considering negotiations for 11 other EDRDs.
These results point to alignment with the recurrent recommendation from CADTH to reimburse EDRDs conditional on cost-effectiveness being improved.
Figure 1.7 pCPA negotiation status for EDRDs, as of June 2021
Long description
A horizontal bar graph indicates the current status of EDRDs negotiated through the pan-Canadian Pharmaceutical Alliance (pCPA). Those with a positive status, namely a successful negotiation for an orphan indication, are shown in green, while active negotiations and those under consideration are shown in grey and those with a negative status, including no-agreement negotiations, completed negotiations for non-orphan indications, and those without a pCPA record, are shown in red. EDRDs with more than one negotiation are only counted once according to the most relevant category of negotiation.
| Negotiation status | Number of EDRDs |
|---|---|
Letter of Intent signed for an orphan indication |
55 |
Active negotiation for an orphan indication |
5 |
Under consideration for an orphan indication |
6 |
Negotiations concluded with no agreement |
12 |
Letter of Intent signed for non-orphan indication |
3 |
No pCPA record |
23 |
* Letter of Intent (LoI).
Note: EDRDs with more than one negotiation are only counted once according to the most relevant category of negotiation.
Data source: pCPA Activity Overview (accessed June 2021).
2. Canadian Market for EDRDs
This section focuses on the 104 EDRDs approved in Canada, examining trends in the entire pharmaceutical market with an international price comparison.
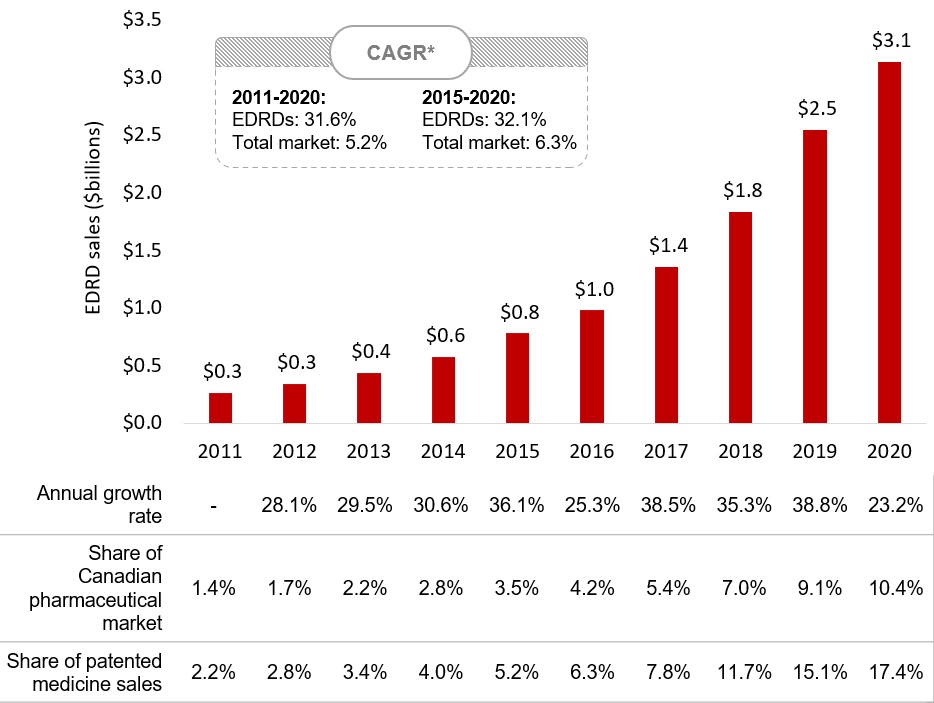
Sales of EDRDs in Canada have grown rapidly since 2016
A combination of new market entries and growth of existing medicines caused sales of EDRDs to increase at a compound annual growth rate of 31.6% between 2011 and 2020, greatly outpacing the overall pharmaceutical market.
In the latter half of the decade, compound annual growth was 32.1%, resulting in sales of $3.1 billion in 2020, more than one tenth of the total market.
Figure 2.1 Sales of EDRDs in Canada, 2011 to 2020
Long description
A bar graph gives the sales for EDRDs in Canada from 2011 to 2020 in billions of dollars. The annual growth rate and the EDRD share of the Canadian pharmaceutical market as well of Canadian patented medicine sales in each year are given in a table below the graph. The compound annual growth rate for the entire period was 31.6% for EDRDs and 5.2% for all medicines. Between 2015 and 2020, the compound annual growth rate was 32.1% for EDRDs and 6.3% for all medicines.
| 2011 | 2012 | 2013 | 2014 | 2015 | 2016 | 2017 | 2018 | 2019 | 2020 | |
|---|---|---|---|---|---|---|---|---|---|---|
EDRD sales, in billions of dollars |
$0.3 |
$0.3 |
$0.4 |
$0.6 |
$0.8 |
$1.0 |
$1.4 |
$1.8 |
$2.5 |
$3.1 |
Annual growth rate |
– |
28.1% |
29.5% |
30.6% |
36.1% |
25.3% |
38.5% |
35.3% |
38.8% |
23.2% |
EDRD share of Canadian pharmaceutical market |
1.4% |
1.7% |
2.2% |
2.8% |
3.5% |
4.2% |
5.4% |
7.0% |
9.1% |
10.4% |
EDRD share of patented medicine sales |
2.2% |
2.8% |
3.4% |
4.0% |
5.2% |
6.3% |
7.8% |
11.7% |
15.1% |
17.4% |
* Compound annual growth rate.
Data source: PMPRB; IQVIA MIDAS® Database, 2011 to 2020 (all rights reserved).
Ten top-selling EDRDs made up 71% of sales in 2020
Nearly three quarters of 2020 EDRD sales in Canada can be attributed to just 10 medicines, the majority of which are used for oncology indications. Sales data was recorded for a total of 81 EDRDs.
Over half of sales came from medicines that received Notice of Compliance from 2014 to 2016, while the larger 2017 to 2020 cohort is likely to contribute to sales growth in the coming years.
Figure 2.2 EDRD sales in Canada, by sales rank and year of NoC, 2020
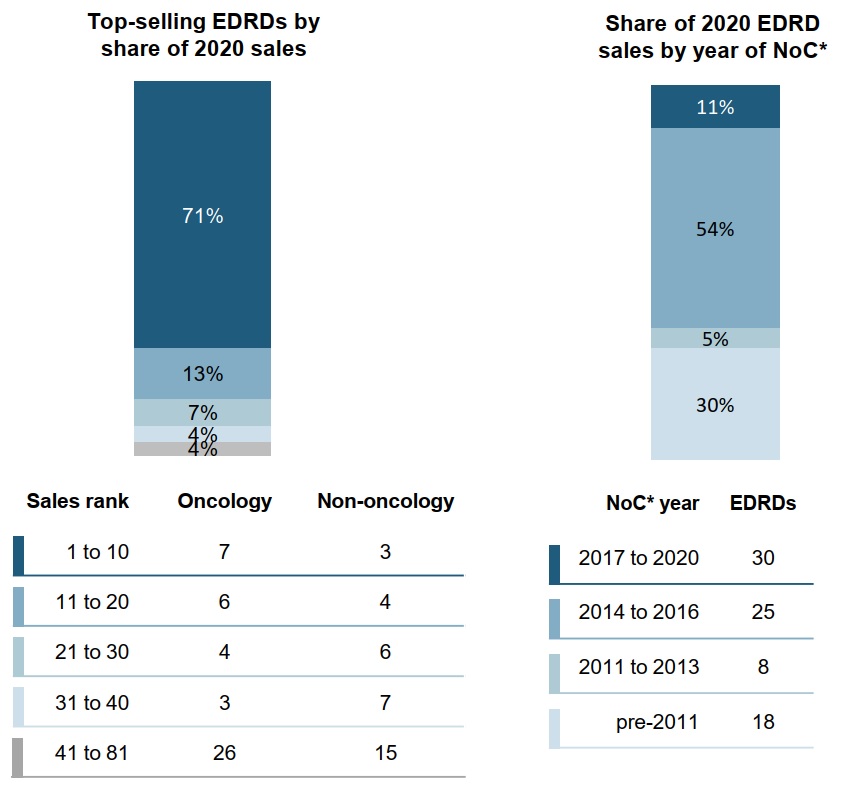
Long description
Two stacked bars give the distribution of EDRD sales in Canada by a) sales and b) year of Notice of Compliance. Results are given as a share of all EDRD sales in 2020 as well as by the number of oncology and non-oncology EDRDs in each category, shown in a table below the bars.
a) Top-selling EDRDs by share of 2020 sales
| Sales rank | Share of EDRD sales | Number of oncology EDRDs | Number of non-oncology EDRDs |
|---|---|---|---|
1 to 10 |
71% |
7 |
3 |
11 to 20 |
13% |
6 |
4 |
21 to 30 |
7% |
4 |
6 |
31 to 40 |
4% |
3 |
7 |
41 to 81 |
4% |
26 |
15 |
b) Share of 2020 EDRD sales by year of Notice of Compliance
| Year of Notice of Compliance | Share of EDRD sales | Number of EDRDs |
|---|---|---|
2017 to 2020 |
11% |
30 |
2014 to 2016 |
54% |
25 |
2011 to 2013 |
5% |
8 |
pre-2011 |
30% |
18 |
* Notice of Compliance (NoC).
Data source: PMPRB; IQVIA MIDAS® Database, 2020 (all rights reserved), Health Canada Drug Product Database.
Biologics make up nearly half of all Canadian EDRD sales
While the rise in the number of non-biologic EDRDs has outpaced biologics since the start of the decade, their respective shares of sales have remained relatively consistent, at 53% and 47% in 2020.
Figure 2.3 Biologic and non-biologic share of EDRD sales, Canada, 2011 to 2020
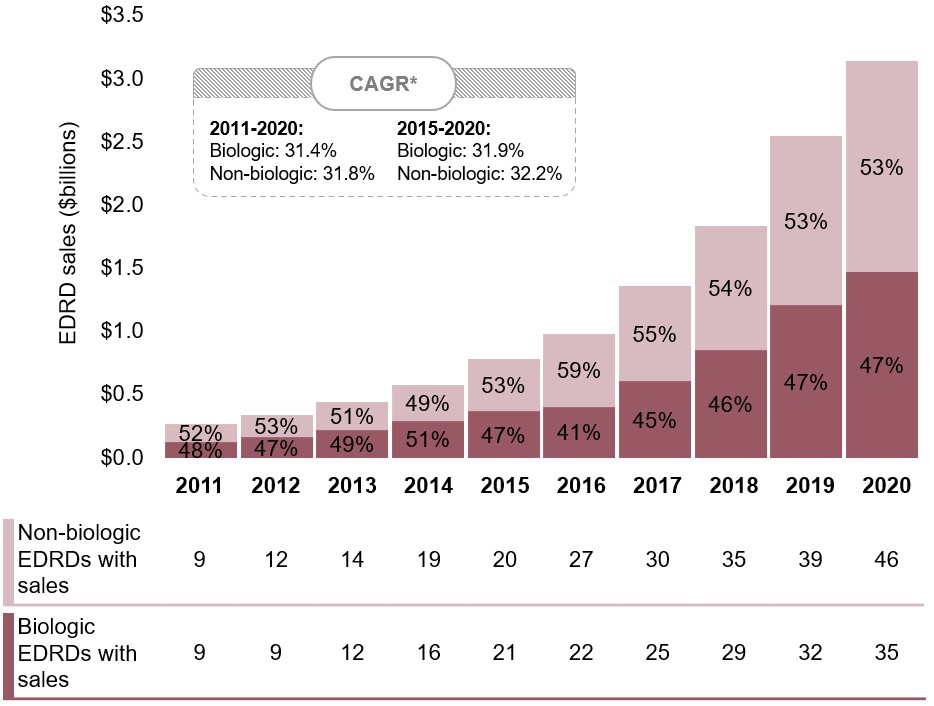
Long description
A stacked bar graph shows the distribution of EDRD sales in Canada from 2011 to 2020 by biologic and non-biologic medicines. Sales are given in billions of dollars. The count of biologic and non-biologic EDRDs with sales is shown in a table below the graph. The compound annual growth rate for the period was 31.4% for biologic EDRDs and 31.8% for non-biologic EDRDs. Between 2015 and 2020, the compound annual growth rate was 31.9% for biologic EDRDs and 32.2% for non-biologic EDRDs.
| 2011 | 2012 | 2013 | 2014 | 2015 | 2016 | 2017 | 2018 | 2019 | 2020 | |
|---|---|---|---|---|---|---|---|---|---|---|
Biologic EDRD sales, in billions of dollars |
$0.13 |
$0.16 |
$0.22 |
$0.29 |
$0.37 |
$0.41 |
$0.60 |
$0.85 |
$1.21 |
$1.47 |
Number of biologic EDRDs with sales |
9 |
9 |
12 |
16 |
21 |
22 |
25 |
29 |
32 |
35 |
Biologic share of total EDRDs sales |
48% |
47% |
49% |
51% |
47% |
41% |
45% |
46% |
47% |
47% |
Non-biologic EDRD sales, in billions of dollars |
$0.14 |
$0.18 |
$0.22 |
$0.28 |
$0.41 |
$0.57 |
$0.75 |
$0.98 |
$1.34 |
$1.66 |
Number of non-biologic EDRDs with sales |
9 |
12 |
14 |
19 |
20 |
27 |
30 |
35 |
39 |
46 |
Non-biologic share of EDRD sales |
52% |
53% |
51% |
49% |
53% |
59% |
55% |
54% |
53% |
53% |
Total EDRD sales, in billions of dollars |
$0.26 |
$0.34 |
$0.44 |
$0.57 |
$0.78 |
$0.98 |
$1.36 |
$1.83 |
$2.55 |
$3.14 |
* Compound annual growth rate.
Data source: PMPRB; IQVIA MIDAS® Database, 2011 to 2020 (all rights reserved).
Oncology EDRDs account for the majority of sales, with substantially faster growth since 2015
Although the proportion of EDRD sales held by non-oncology EDRDs increased at a greater rate over the past decade, the last five years have been characterized by faster growth in oncology EDRD sales.
Oncology EDRDs have received approval for an average of 2.4 indications from Health Canada, while the average for non-oncology EDRDs is 1.3, indicating a generally wider range of uses for oncology medicines.
Figure 2.4 Oncology and non-oncology share of EDRD sales, Canada, 2011 to 2020
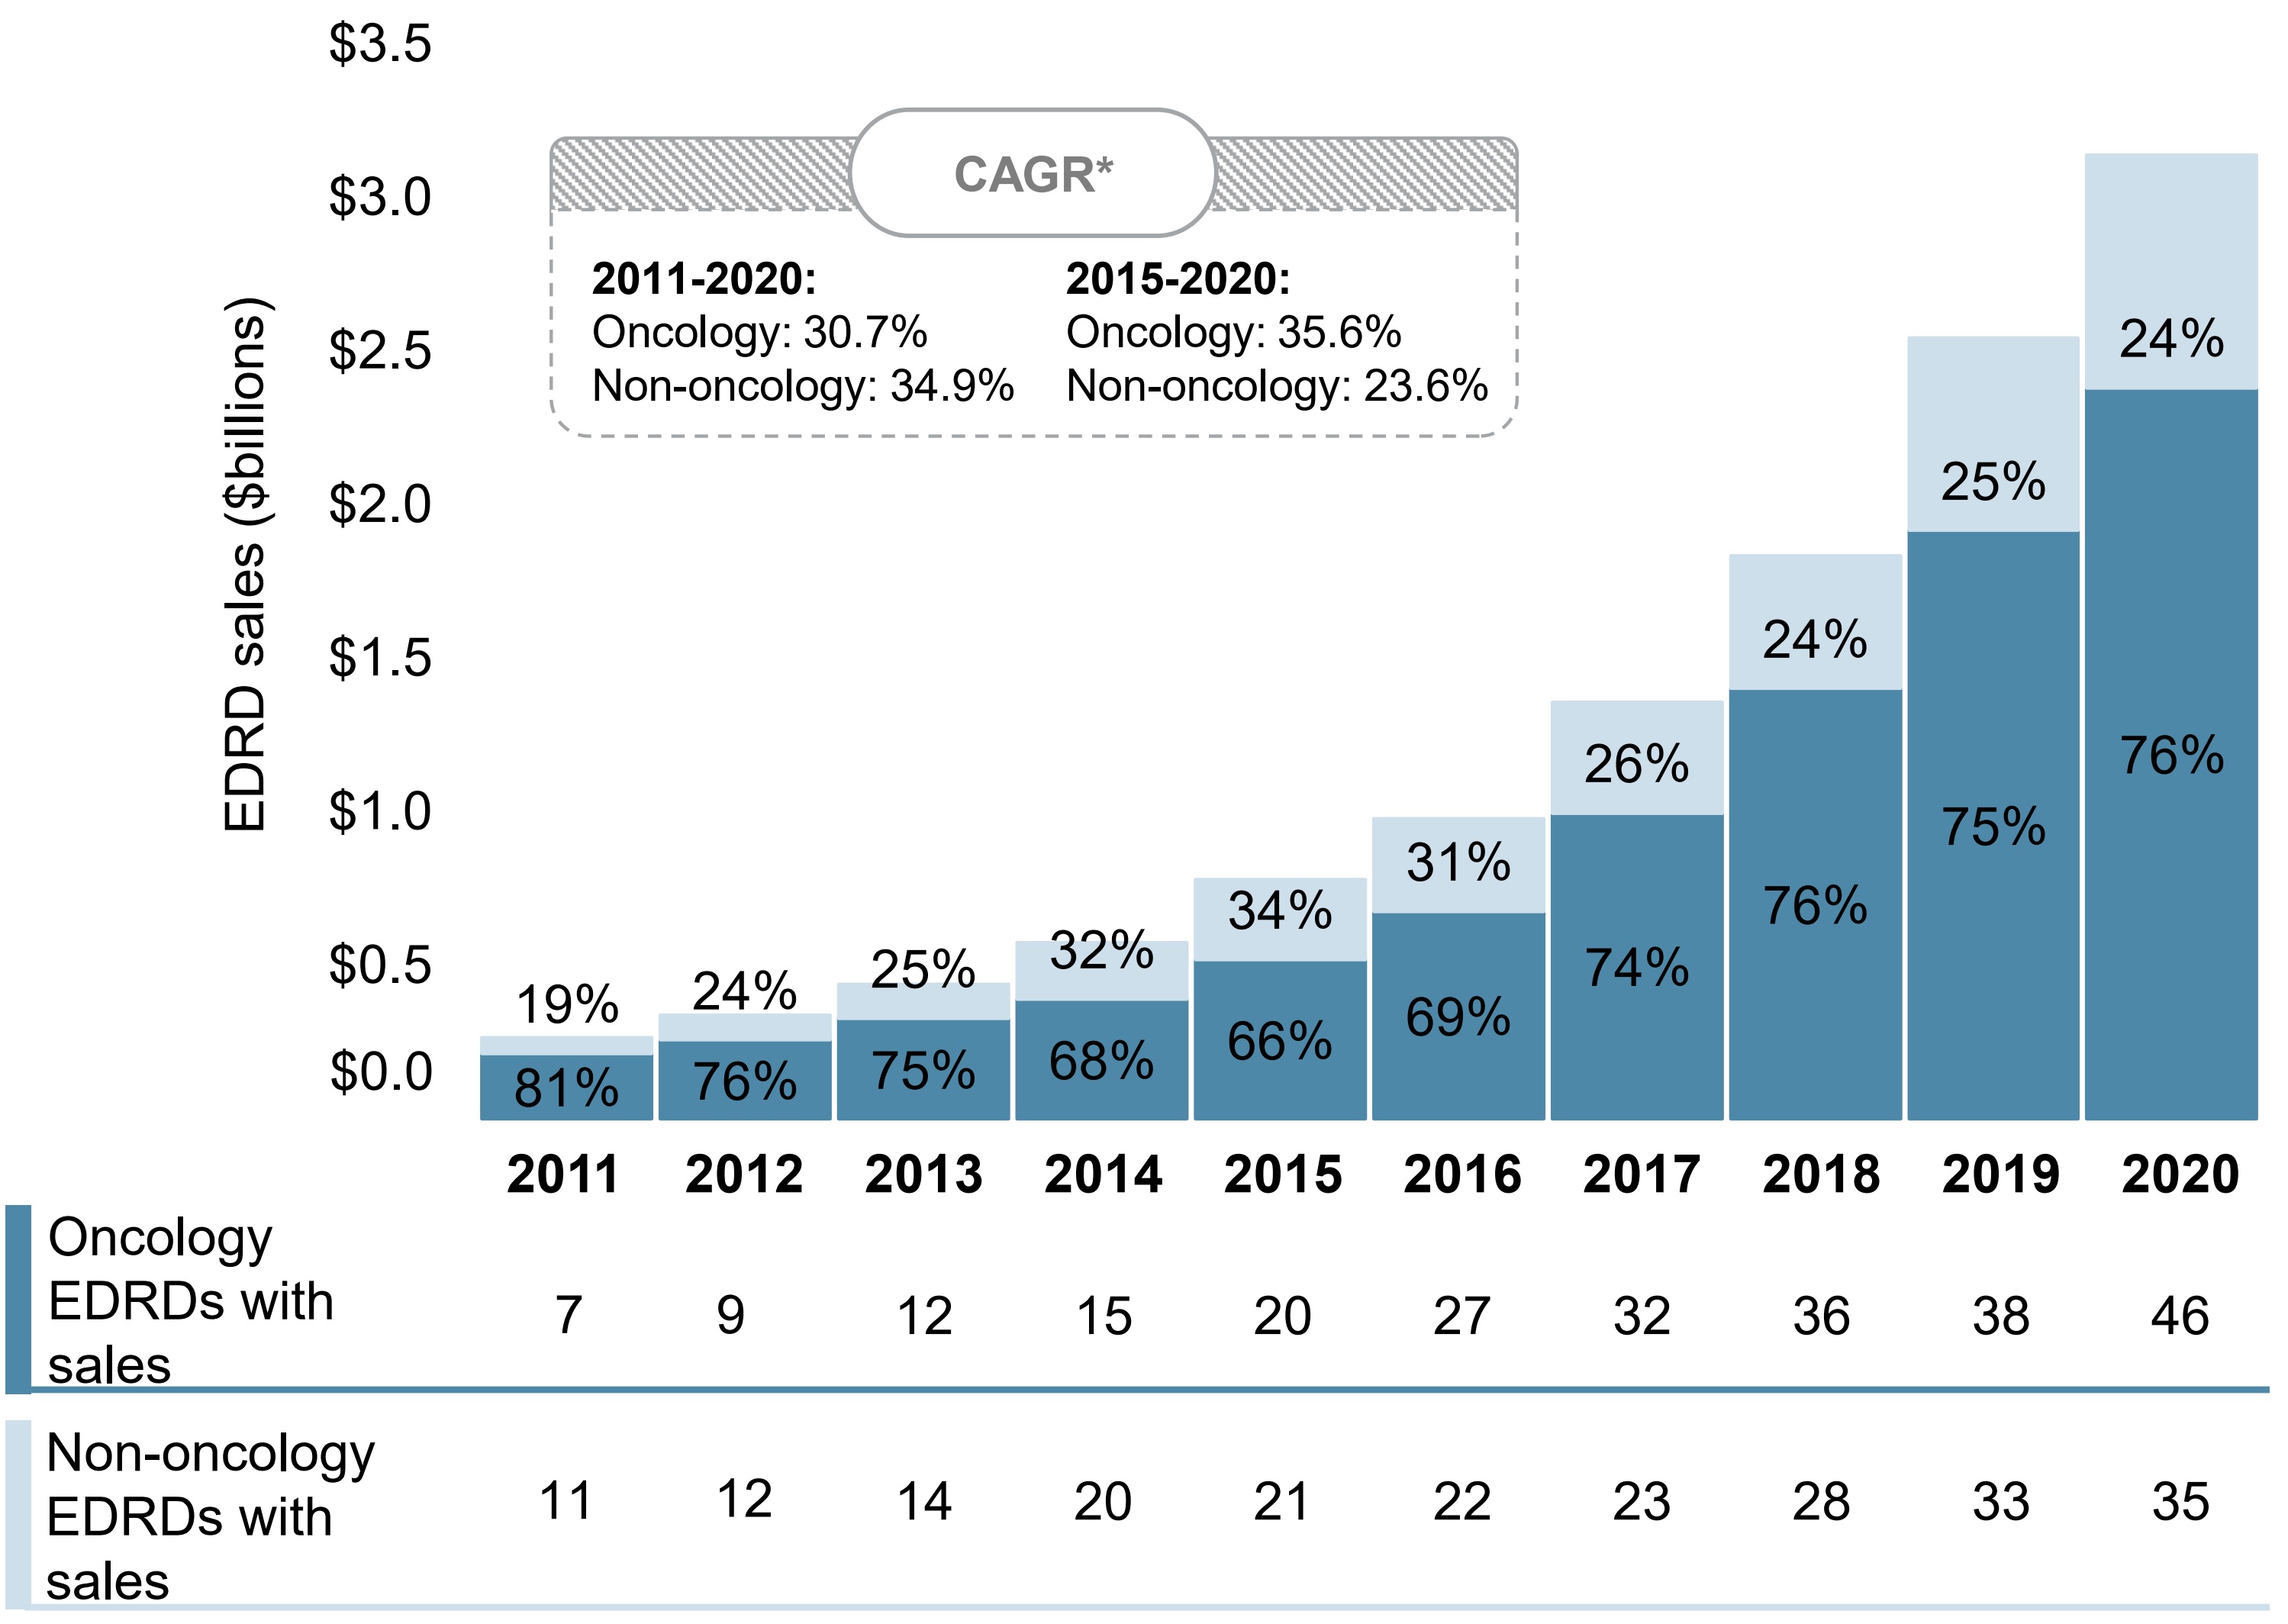
Long description
A stacked bar graph shows the distribution of EDRD sales in Canada from 2011 to 2020 by oncology and non-oncology medicines. Sales are given in billions of dollars. The count of oncology and non-oncology EDRDs with sales is shown in a table below the graph. The compound annual growth rate for the period was 30.7% for oncology EDRDs and 34.9% for non-oncology EDRDs. Between 2015 and 2020, the compound annual growth rate was 35.6% for oncology EDRDs and 23.6% for non-oncology EDRDs.
| 2011 | 2012 | 2013 | 2014 | 2015 | 2016 | 2017 | 2018 | 2019 | 2020 | |
|---|---|---|---|---|---|---|---|---|---|---|
Oncology EDRD sales, in billions of dollars |
$0.21 |
$0.26 |
$0.33 |
$0.39 |
$0.52 |
$0.68 |
$1.00 |
$1.40 |
$1.92 |
$2.38 |
Number of oncology EDRDs with sales |
7 |
9 |
12 |
15 |
20 |
27 |
32 |
36 |
38 |
46 |
Oncology share of total EDRDs sales |
81% |
76% |
75% |
68% |
66% |
69% |
74% |
76% |
75% |
76% |
Non-oncology EDRD sales, in billions of dollars |
$0.05 |
$0.08 |
$0.11 |
$0.18 |
$0.26 |
$0.30 |
$0.36 |
$0.43 |
$0.63 |
$0.76 |
Number of non-oncology EDRDs with sales |
11 |
12 |
14 |
20 |
21 |
22 |
23 |
28 |
33 |
35 |
Non-oncology share of EDRD sales |
19% |
24% |
25% |
32% |
34% |
31% |
26% |
24% |
25% |
24% |
Total EDRD sales, in billions of dollars |
$0.26 |
$0.34 |
$0.44 |
$0.57 |
$0.78 |
$0.98 |
$1.36 |
$1.83 |
$2.55 |
$3.14 |
* Compound annual growth rate.
Data source: Health Canada Drug Product Database; PMPRB; IQVIA MIDAS® Database, 2011 to 2020 (all rights reserved).
Canadian list prices for patented EDRDs are closer to the OECD median than for patented medicines in general
Canadian price levels for patented medicines were fourth highest in the OECD in 2019, while price levels for patented EDRDs were ninth highest in 2020, and closer to the medicine-level OECD median.
The alignment of list prices for patented EDRDs does not reflect confidential price discounts negotiated in Canada or other countries. The level of discount offered off the list price varies across countries and is an increasingly common aspect of reimbursement for newer medicines.
Figure 2.5 Foreign-to-Canadian price ratios for 2019 patented medicines and patented EDRDs, OECD
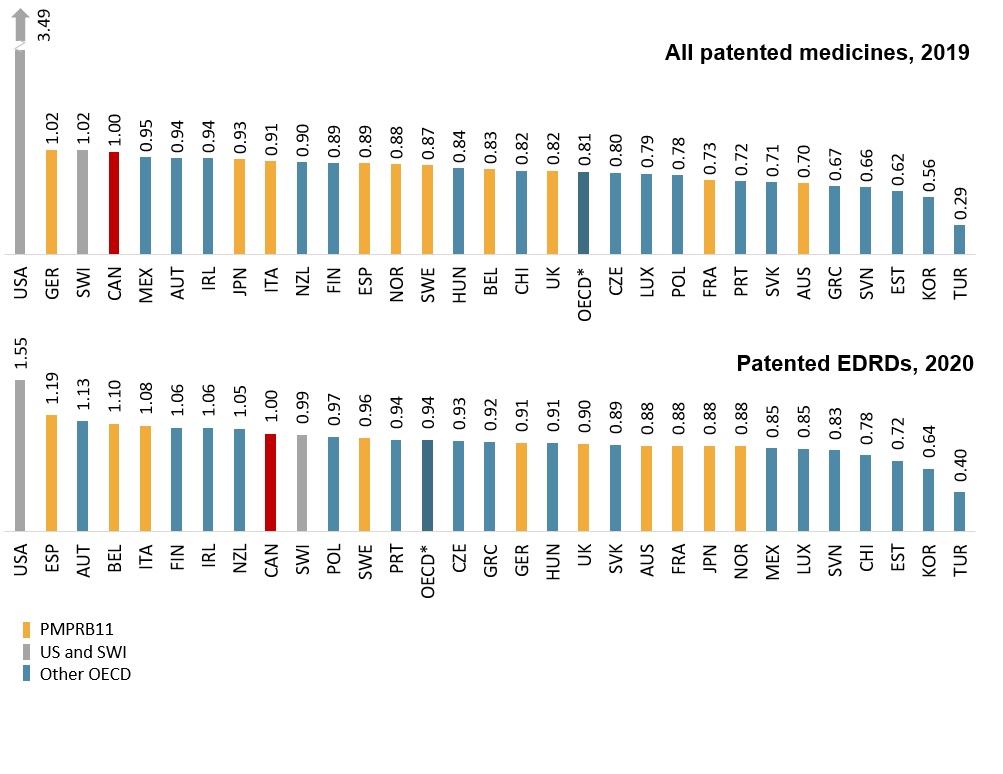
Long description
All patented medicines, 2019
A bar graph shows the average foreign-to-Canadian price ratios for patented medicines in 2019 for each country in the Organisation for Economic Co-operation and Development. Results are presented as a ratio of foreign prices to Canadian prices, with Canadian prices set to 1.00. The median price ratio for the countries shown was 0.81, calculated at the medicine level for medicines with prices available in at least three foreign markets.
| Country | Average foreign-to-Canadian price ratio |
|---|---|
United States |
3.49 |
Germany |
1.02 |
Switzerland |
1.02 |
Canada |
1.00 |
Mexico |
0.95 |
Austria |
0.94 |
Ireland |
0.94 |
Japan |
0.93 |
Italy |
0.91 |
New Zealand |
0.90 |
Finland |
0.89 |
Spain |
0.89 |
Norway |
0.88 |
Sweden |
0.87 |
Hungary |
0.84 |
Belgium |
0.83 |
Chile |
0.82 |
United Kingdom |
0.82 |
Czech Republic |
0.80 |
Luxembourg |
0.79 |
Poland |
0.78 |
France |
0.73 |
Portugal |
0.72 |
Slovakia |
0.71 |
Australia |
0.70 |
Greece |
0.67 |
Slovenia |
0.66 |
Estonia |
0.62 |
South Korea |
0.56 |
Turkey |
0.29 |
Patented EDRDs, 2020
A bar graph shows the average foreign-to-Canadian price ratios for patented EDRDs in 2020 for each country in the Organisation for Economic Co-operation and Development. Results are presented as a ratio of foreign prices to Canadian prices, with Canadian prices set to 1.00. The median price ratio for the countries shown was 0.94, calculated at the medicine level for medicines with prices available in at least three foreign markets.
| Country | Average foreign-to-Canadian price ratio |
|---|---|
United States |
1.55 |
Spain |
1.19 |
Austria |
1.13 |
Belgium |
1.10 |
Italy |
1.08 |
Finland |
1.06 |
Ireland |
1.06 |
New Zealand |
1.05 |
Canada |
1.00 |
Switzerland |
0.99 |
Poland |
0.97 |
Sweden |
0.96 |
Portugal |
0.94 |
Czech Republic |
0.93 |
Greece |
0.92 |
Germany |
0.91 |
Hungary |
0.91 |
United Kingdom |
0.90 |
Slovakia |
0.89 |
Australia |
0.88 |
France |
0.88 |
Japan |
0.88 |
Norway |
0.88 |
Mexico |
0.85 |
Luxembourg |
0.85 |
Slovenia |
0.83 |
Chile |
0.78 |
Estonia |
0.72 |
South Korea |
0.64 |
Turkey |
0.40 |
* OECD median calculated at the medicine level for medicines with prices available in at least three foreign markets.
Data source: PMPRB Annual Report 2019; IQVIA MIDAS® Database, 2019 to 2020 (all rights reserved).
3. New EDRDs in Canada and International Markets
This section considers orphan medicines as a share of the global development pipeline and provides an overview of treatment costs and availability of new EDRDs approved by the US FDA, the EMA, or Health Canada between 2015 and 2019.
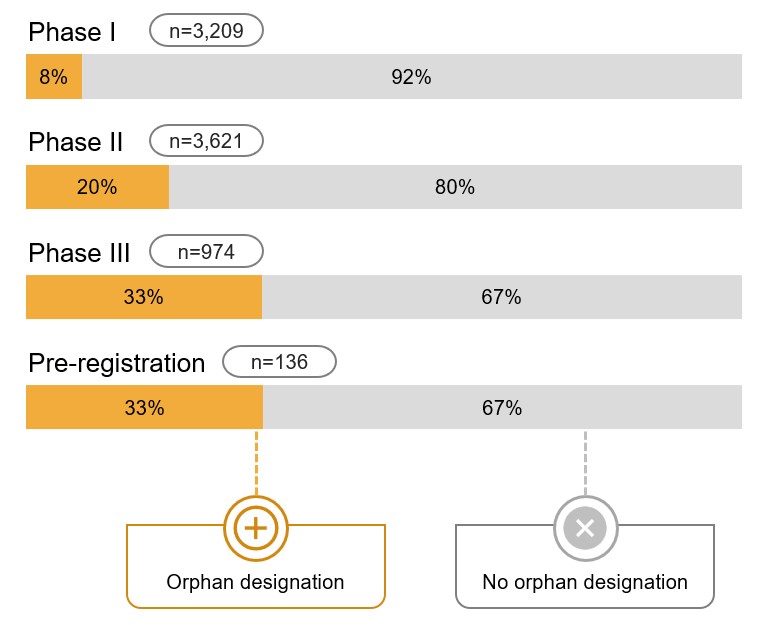
Orphan medicines account for a substantial share of the global development pipeline
A notable proportion of medicines currently under development are indicated to treat rare diseases and conditions. This is especially true in Phase III and pre-registration, where one third of medicines have an orphan designation.
Figure 3.1 Distribution of pipeline medicines by orphan designation, Canada, the US, and Europe, as of March 2021
Long description
A horizontal stacked bar graph shows the distribution of medicines under development in Canada, the United States, and Europe by those with and without an orphan designation. Shares are given for each phase of development: Phase I, Phase II, Phase III, and pre-registration. This analysis takes a snapshot of the pipeline in March 2021. Medicines in development in Russia and Turkey are excluded while those with an unspecified geographical region are included.
| Phase I | Phase II | Phase III | Pre-registration | |
|---|---|---|---|---|
Total number of medicines |
3,209 |
3,621 |
974 |
136 |
Medicines with an orphan designation |
8% |
20% |
33% |
33% |
Medicines without an orphan designation |
92% |
80% |
67% |
67% |
Note: Drug geography excludes Russia and Turkey and includes pipeline medicines with an unspecified geographical region.
Data source: GlobalData Healthcare database, March 2021.
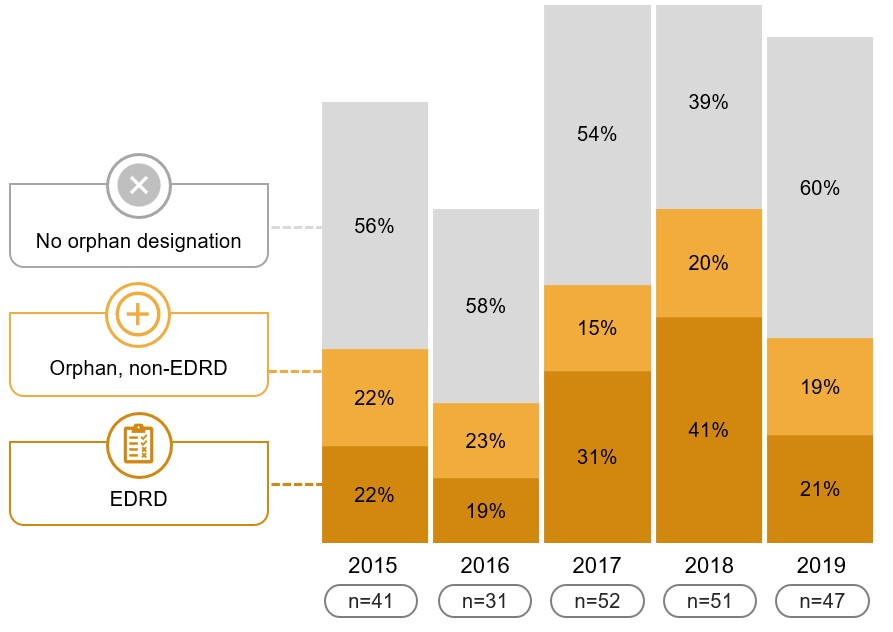
EDRDs account for a sizeable segment of recent international approvals
Of the new medicines approved from 2015 to 2019 by the US FDA, the EMA, or Health Canada, 62 had both an orphan designation and a treatment cost that met the required threshold for an EDRD.
These 62 medicines represent 28% of new approvals for the period, an indication that the rapid pace of EDRD launches in Canada has also been experienced in other countries.
Figure 3.2 EDRDs and orphan medicines as a share of new medicines approved by the US FDA, the EMA, or Health Canada, 2015 to 2019
Long description
A stacked bar graph shows the distribution of new medicines approved by the US Food and Drug Administration, the European Medicines Agency, or Health Canada between 2015 and 2019 by non-orphan, orphan non-EDRD, and EDRD medicines. Results are given both as a number of medicines and as a share of all new medicines approved annually.
| 2015 | 2016 | 2017 | 2018 | 2019 | |
|---|---|---|---|---|---|
Number of new non-orphan medicines |
23 |
18 |
28 |
20 |
28 |
Non-orphan share of new medicines |
56% |
58% |
54% |
39% |
60% |
Number of new non-EDRD orphan |
9 |
7 |
8 |
10 |
9 |
Non-EDRD orphan share of new medicines |
22% |
23% |
15% |
20% |
19% |
Number of new EDRDs |
9 |
6 |
16 |
21 |
10 |
EDRD share of new medicines |
22% |
19% |
31% |
41% |
21% |
Total number of new medicines |
41 |
31 |
52 |
51 |
47 |
Data source: US FDA, EMA, and Health Canada databases.
Treatment costs for EDRDs approved from 2015 to 2019 vary widely
Oncology and non-oncology EDRDs approved from 2015 to 2019 by the US FDA, the EMA, or Health Canada came with a wide range of treatment costs, with the highest levels seen among 2018 approvals.
While some of the EDRDs in this analysis had not launched in Canada by the end of 2019, these results indicate that other countries have also seen a number of new EDRDs approved in recent years with multimillion-dollar treatment costs.
Figure 3.3 Treatment costs for new EDRDs approved by the US FDA, the EMA, or Health Canada, 2015 to 2019

Long description
Two scatter plot graphs show the range of treatment costs for a) oncology and b) non-oncology EDRDs in Canada by the year of first approval through the US Food and Drug Administration, the European Medicines Agency, and/or Health Canada, from 2015 to 2019. Treatment costs for oncology EDRDs are based on a 28-day treatment cycle, while non-oncology treatment costs are annual. The number of EDRDs approved in each year is shown in a table below the graph. For the 2015 to 2019 period of approvals, the median treatment cost for oncology EDRDs was $17,400 while the median cost for non-oncology EDRDs was $510,000.
a) Oncology EDRDs
| Year of first approval | 28-day treatment cost | Number of EDRDs |
|---|---|---|
2015 |
$8,403 |
6 |
$8,893 |
||
$9,146 |
||
$9,807 |
||
$12,054 |
||
$43,576 |
||
2016 |
$11,600 |
2 |
$15,300 |
||
2017 |
$9,270 |
11 |
$9,435 |
||
$9,738 |
||
$13,300 |
||
$15,840 |
||
$16,200 |
||
$17,500 |
||
$27,227 |
||
$40,375 |
||
$432,013 |
||
$482,549 |
||
2018 |
$8,275 |
9 |
$13,887 |
||
$19,436 |
||
$21,259 |
||
$23,956 |
||
$27,642 |
||
$32,104 |
||
$88,958 |
||
$557,885 |
||
2019 |
$13,741 |
6 |
$17,294 |
||
$19,575 |
||
$21,152 |
||
$22,914 |
||
$25,470 |
b) Non-oncology EDRDs
| Year of first approval | Annual treatment cost | Number of EDRDs |
|---|---|---|
2015 |
$248,988 |
3 |
$1,102,433 |
||
$1,590,792 |
||
2016 |
$310,300 |
4 |
$354,000 |
||
$449,500 |
||
$638,800 |
||
2017 |
$185,182 |
5 |
$635,000 |
||
$683,900 |
||
$841,900 |
||
$1,031,500 |
||
2018 |
$156,403 |
12 |
$206,911 |
||
$236,840 |
||
$336,734 |
||
$420,000 |
||
$486,477 |
||
$533,988 |
||
$536,767 |
||
$584,098 |
||
$677,145 |
||
$2,493,892 |
||
$5,034,964 |
||
2019 |
$143,272 |
4 |
$217,633 |
||
$336,734 |
||
$773,452 |
Note: Medicines with different treatment durations have been adjusted, and maintenance dosage regimens were used over loading dose regimens.
Data source: US FDA, EMA, and Health Canada databases; CADTH.
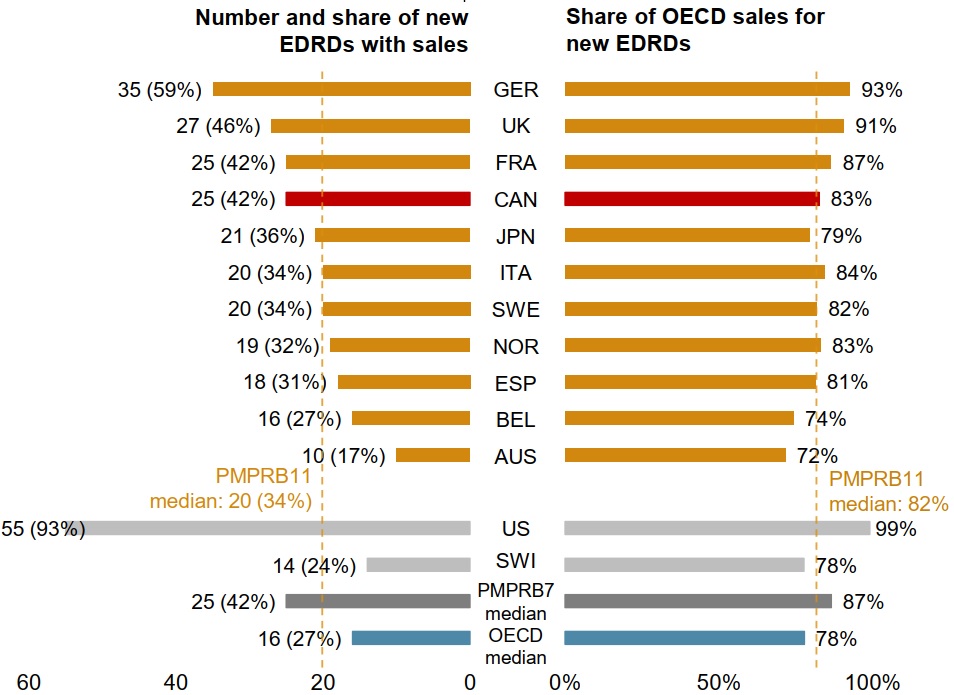
New EDRDs are launching in Canada at a rate similar to comparator countries
Of the 62 new EDRDs approved from 2015 to 2019 by the US FDA, the EMA, or Health Canada, 42% had recorded sales in Canada by the end of 2019, a slightly higher rate than the PMPRB11 median of 34%.
The medicines approved and sold in Canada accounted for 83% of sales generated by all 62 new EDRDs across the OECD in 2019, almost exactly the PMPRB11 median of 82%.
These results are similar to the shares for the 160 non-EDRD medicines approved from 2015 to 2019. Of these, 62 (39%) had sales in Canada by the end of 2019, comparing favourably to the OECD (35%) and PMPRB11 (38%) medians.
Figure 3.4 Share of EDRDs approved by the US FDA, the EMA, or Health Canada between 2015 and 2019 with sales, and their respective share of OECD sales, by country, 2019
Long description
This is a split bar graph. The left side gives the number and share of the 62 new EDRDs that had been approved in Canada and the 11 PMPRB comparator countries (PMPRB11) by the end of 2019. The right side gives those medicines’ respective share of all Organisation for Economic Co-operation and Development sales for new EDRDs in 2019. Results for the United States and Switzerland are also given, as well as the medians for the PMPRB11, the PMPRB7, and the Organisation for Economic Co-operation and Development countries. New EDRDs are defined as those first approved by the US Food and Drug Administration, the European Medicines Agency, or Health Canada from 2015 to 2019.
| Country | Number of new EDRDs with sales | Share of new EDRDs with sales | Share of total Organisation for Economic Co-operation and Development sales for new EDRDs |
|---|---|---|---|
Germany |
35 |
59% |
93% |
United Kingdom |
27 |
46% |
91% |
France |
25 |
42% |
87% |
Canada |
25 |
42% |
83% |
Japan |
21 |
36% |
79% |
Italy |
20 |
34% |
84% |
Sweden |
20 |
34% |
82% |
Norway |
19 |
32% |
83% |
Spain |
18 |
31% |
81% |
Belgium |
16 |
27% |
74% |
Australia |
10 |
17% |
72% |
PMPRB11 median |
20 |
34% |
82% |
United States |
55 |
93% |
99% |
Switzerland |
14 |
24% |
78% |
PMPRB7 median |
25 |
42% |
87% |
OECD median |
16 |
27% |
78% |
Data source: PMPRB; IQVIA MIDAS® Database, 2015 to 2019 (all rights reserved).