
The Cost of Drug Shortages for Canadian Insurers
Introduction
Background and objective
Drug shortages are an issue of great importance to the full range of Canadians they affect, from patients to healthcare providers, pharmacists, and insurers. Because they can be associated with decreases in quantities sold, price increases, and substitutions to pricier alternatives, the net effect of shortages on insurer spending is not immediately evident. This study aims to shed light on these effects by studying how public drug plan spending changes when drugs go into shortage.
Approach
The study analyzes public insurance claims data and prescription drug shortages reported by Canadian market authorizations holders to study changes in the unit price of drugs and plan spending during shortages between April 2017 and March 2020, accounting for drug substitutions within similar groups of drugs during shortages. It also characterizes the shortages associated with important shifts, either upward or downward, in public plan spending.
Results
Most shortages do not impact drugs with high spending levels
- Less than 1% of drugs with a shortage had over $1 million in monthly public plan spending prior to the shortage (figure 1).
- Approximately half of drugs (47%) had less than $10,000 in monthly spending.
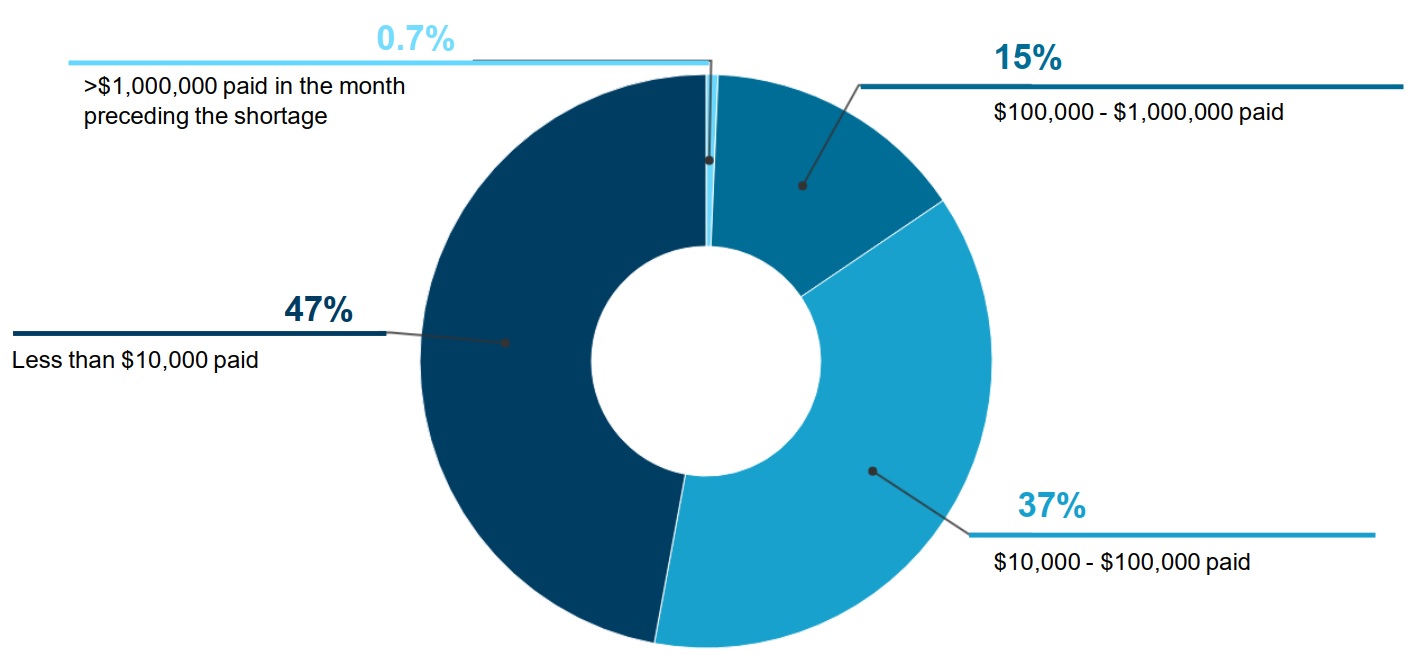
Figure description
A pie chart gives the distribution of shortages by public drug plan spending on the drug in shortage in the month before the shortage onset, for shortage reported between 2017/18 and 2019/20. Spending is broken out into four categories: less than $10,000; $10,000 to $100,000; $100,000 to $1,000,000; and more than $1,000,000.
| Number of beneficiaries | Share of shortages |
|---|---|
Less than $10,000 |
47% |
$10,000 to $100,000 |
37% |
$100,000 to $1,000,000 |
15% |
More than $1,000,000 |
0.7% |
Most shortages do not significantly disrupt spending patterns for public insurers
- When studying shortages at the chemical subgroup level1, less than a quarter of shortages (19%) resulted in a shift in spending greater than 20% (figure 2).
- For cases where there was a significant shift in expenditures, shortages were associated with spending decreases as often as increases (9% and 10% of shortages, respectively).
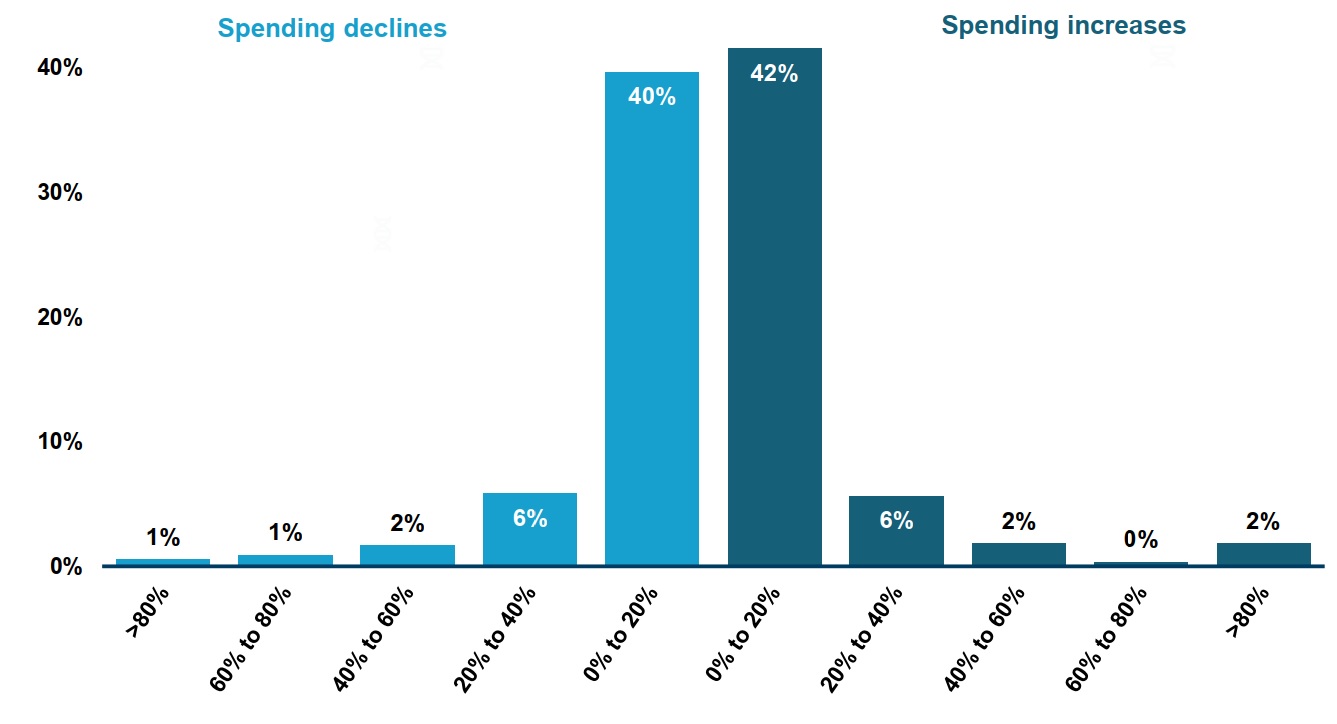
Figure description
This two-part bar graph gives the distribution of drug shortages by the change in public drug plan spending during the shortage at the chemical subgroup (ATC4) level. The change in spending is measured as a percent increase or decrease relative to spending in the six months prior to the shortage onset. Shortages reported between 2017 and 2020 are assessed for this analysis, for a total of 532 shortages at the ATC4 level.
| Percent change in spending | Share of shortages at the ATC4 level |
|---|---|
Greater than 80% decrease |
1% |
60% to 80% decrease |
1% |
40% to 60% decrease |
2% |
20% to 40% decrease |
6% |
0% to 20% decrease |
40% |
0% to 20% increase |
42% |
20% to 40% increase |
6% |
40% to 60% increase |
2% |
60% to 80% increase |
<1% |
Greater than 80% increase |
2% |
Which types of shortages lead to bigger changes in spending?
- Shortages that showed a steep decline in spending tended to feature more brand and single-source medicines and fewer DINs to use as substitutes (table).
- Shortages that were accompanied by a steep increase in spending tended to have fewer brand drugs in the subgroup.
Table. Characteristics of chemical subgroup level shortagesFootnote 1 by change in public plan spending, 2017/18 to 2019/20
| Shortages with a steep decline in spending (N=48) | Shortages with a small/ moderate change in spending (N=432) | Shortages with a steep increase in spending (N=52) | |
|---|---|---|---|
Mean spending* prior to the shortage |
$393,000 |
$1,607,000 |
$1,365,000 |
Mean shortage duration |
10.5 months |
7.4 months |
10.8 months |
| Chemical subgroup composition | |||
Mean number of DINs |
15 |
22 |
22 |
Brand medicines |
44% |
36% |
28% |
Patented medicines |
6% |
11% |
12% |
Single-source medicines |
33% |
21% |
23% |
DIN: drug identification number. Steep increase/decline: change in monthly public plan spending greater than 20%.
Note: Proportions of medicines by brand status and market segment were calculated as the percentage of DINs with claims within the chemical subgroup with these attributes. Medicines for which the attributes were unknown were counted as not having the attribute.
*Value in Canadian dollars
Conclusions
Most shortages reported between 2017/18 and 2019/20 in Canada impacted drugs with relatively low spending by public insurance plans. When accounting for substitutions to other drugs within the same chemical subgroup, less than a quarter of shortages (19%) resulted in a shift in spending greater than 20%. Shortages were associated with steep spending decreases as often as increases.
While the harmful impact of drug shortages on patients and the health care system is well documented, most shortages do not significantly disrupt spending patterns for public insurers.
Data
Public insurance plans: Monthly drug-level and chemical subgroup level spending data from publicly financed drug benefit programs affiliated were compiled with the National Prescription Drug Utilization Information System (NPDUIS) database, which represent approximately 7 million publicly insured active beneficiaries. Public drug plans from British Columbia, Alberta, Saskatchewan, Manitoba, Ontario, New Brunswick, Nova Scotia, Prince Edward Island, and Newfoundland were included in the analysis, as well as the Non-Insured Health Benefits program.
Drug shortages: Shortage reports were extracted from the Drug Shortages Canada website, to which holders of drug market authorizations issued by Health Canada are required to report when they are not able to meet demand for a product.
Study period: The study period comprised fiscal years (April to March) 2017/18 to 2019/20 and preceded most of the disruptions of the COVID-19 pandemic.
Definitions: A price increase was defined as an increase of >1% in the average unit price during the shortage relative to the average price up to six months prior to the shortage (figure 2). Changes in spending were determined by comparing monthly spending during the shortage to up to six months prior to the shortage (figure 3 and the table).
Limitations
The results and interpretations presented on this poster are preliminary and may change in future iterations of the project.
The analyses are observational in nature and variations may be caused by other factors. For example, macroeconomic fluctuations and policy changes during the analysis may have impacted the population eligible for coverage and thus spending. The chemical subgroup analysis only captured substitutions within the chemical subgroup and did not capture potential valid alternatives from other subgroups. The analysis may also have underestimated the impact of shortages in cases where the drugs in shortage represented a small portion of the chemical subgroup spending and the remainder of the subgroup did not provide valid substitutes.