
Cost drivers in Canada’s public and private drug plans: a comparative study using real-world evidence

Presentation to Canada’s Drug Agency Symposium 2026
Presented by: Yvonne Zhang, Senior Economist
NPDUIS, Policy and Economic Analysis Branch
Patented Medicine Prices Review Board
Disclosure: I have no actual or potential conflict of interest in relation to this topic or presentation.
PMPRB and NPDUIS research initiative
The PMPRB protects and informs Canadian consumers by
- Reviewing the prices of patented medicines sold in Canada
- Reporting on pharmaceutical trends.
Pursuant to section 90 of the Patent Act and at the request of the Minister of Health, the PMPRB has the mandate to provide the Minister with critical information and intelligence on price, utilization, and cost trends so that Canada’s healthcare system has more comprehensive and accurate information on how medicines are being used and on sources of cost.
Operates independently of the regulatory activities of the PMPRB.
Partnership between the PMPRB and the Canadian Institute for Health Information (CIHI).
Informs the Minister of Health and the public using a variety of media: annual publications, focused reports, conference presentations, etc.
Objective: to compare cost pressures affecting public and private drug plans
Public drug plans and private insurers together account for over 80% of all prescribed drug spending in Canada
Share of expenditure on prescribed drugs by source of finance, Canada, 2024

Figure description
| Source of finance | Share of expenditure |
|---|---|
Public payers |
43% |
Private payers |
39% |
Out-of-pocket |
18% |
Data source: Canadian Institute for Health Information. National Health Expenditure Trends, 2025: Data Tables — Series G.
This presentation examines the similarities and differences in cost pressures affecting these plans, differentiating the short-term effects and the longer-lasting impacts
The study focuses on recent years (2023/24 for public plans and 2024 for private plans), with a retrospective look at trends since 2018/19 and 2019
Methodology builds on the PMPRB’s expanded Laspeyres cost-driver model, isolating the contribution of:
- Demographics; Volume; Drug-mix; Substitution; Price change
Approach and Data Sources
Data sources:
- NPDUIS Database at the Canadian Institute for Health Information (CIHI)
- IQVIA™ Private Pay Direct Drug Plan (PDP) database (capture rate: 80%-86%, depending on year)
| NPDUIS Public Drug Plans | Private Drug Plans | |
|---|---|---|
Coverage |
9 provinces (except Quebec) and Yukon |
10 provinces |
Reporting Period |
Fiscal year: 2018/19 – 2023/24 (April–March) |
Calendar year: 2019-2024 (January–December) |
Comparisons |
Reflect snapshots of utilization and cost metrics |
|
Definitions:
- Drug costs: includes ingredient cost + allowable markups
- Prescription costs: Drug costs + dispensing fees (plan-paid + patient-paid)
Limitations:
- Drug costs do not reflect rebates and confidential product listing agreements (PLAs).
Both sectors show sustained growth; private plans had faster growth overall
Over the study period, prescribed drug expenditures grew at a CAGR of 5.9% in public plans and 7.7% in private plans
NPDUIS public plans: spending grew by 7.6% in 2023/24, following 7.4% 2022/23
Private plans: after a sharp rise of 12.9% in 2023, growth moderated but remained strong at 8.0% in 2024
Annual rates of changes in prescription drug expenditures
NPDUIS public plans, 2018/19 to 2023/24
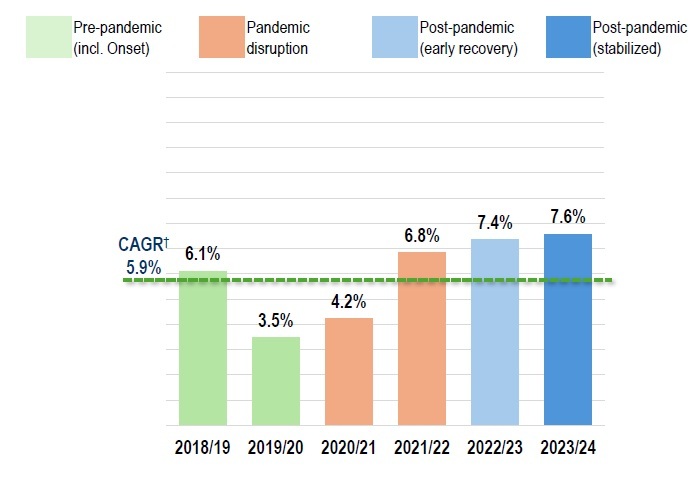
Figure description
NPDUIS public plans, 2018/19 to 2023/24
| Pre-pandemic (including onset) | Pandemic disruption | Post-pandemic (early recovery) | Post-pandemic (stabilized) | |
|---|---|---|---|---|
2018/19 |
6.1% |
|
|
|
2019/10 |
3.5% |
|
|
|
2020/21 |
|
4.2% |
|
|
2021/22 |
|
6.8% |
|
|
2022/23 |
|
|
7.4% |
|
2023/24 |
|
|
|
7.6% |
Compound annual growth rate |
5.9% |
|||
Note: For comparability across fiscal- and calendar-year datasets, study years were aligned to common pandemic phases reflecting broad pre-pandemic, pandemic disruption, and post-pandemic recovery and stabilization. These are analytic groupings and may not correspond exactly to epidemiological phases.
* Results are based on values extrapolated from the IQVIA™ Private Pay Direct Drug Plan database to represent 100% of the private pay-direct market in Canada.
† Compound annual growth rate.
Data source: National Prescription Drug Utilization Information System Database, Canadian Institute for Health Information. IQVIA™ Private Pay Direct Drug Plan Database.
Private drug plans*, 2019 to 2024
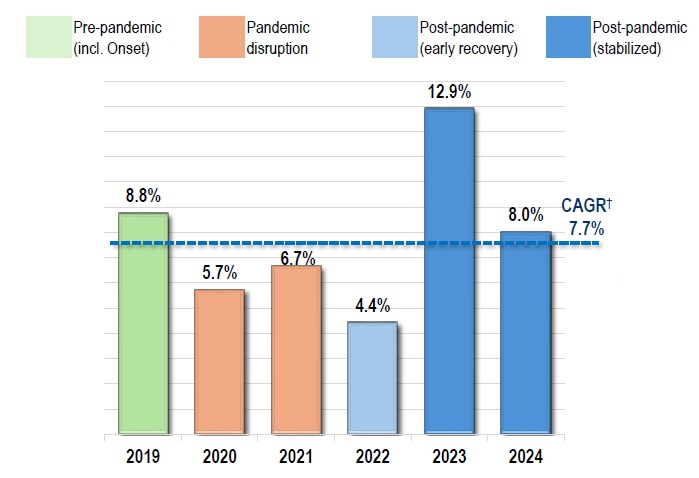
Figure description
Private drug plans*, 2019 to 2024
| Pre-pandemic (including onset) | Pandemic disruption | Post-pandemic (early recovery) | Post-pandemic (stabilized) | |
|---|---|---|---|---|
2019 |
8.8% |
|
|
|
2020 |
|
5.7% |
|
|
2021 |
|
6.7% |
|
|
2022 |
|
|
4.4% |
|
2023 |
|
|
|
12.9% |
2024 |
|
|
|
8.0% |
Compound annual growth rate |
7.7% |
|||
Note: For comparability across fiscal- and calendar-year datasets, study years were aligned to common pandemic phases reflecting broad pre-pandemic, pandemic disruption, and post-pandemic recovery and stabilization. These are analytic groupings and may not correspond exactly to epidemiological phases.
* Results are based on values extrapolated from the IQVIA™ Private Pay Direct Drug Plan database to represent 100% of the private pay-direct market in Canada.
† Compound annual growth rate.
Data source: National Prescription Drug Utilization Information System Database, Canadian Institute for Health Information. IQVIA™ Private Pay Direct Drug Plan Database.
Public plan demographics are skewed more toward seniors; average cost per claimant is also higher
Seniors (65+) made up the majority (62%) of public plan beneficiaries, while private drug plans were dominated by claimants under age 65 (87%)
Across all age groups, males incurred higher average treatment costs, though more females submitted claims
Average annual costs per claimant in private plans were less than half of those in public plans
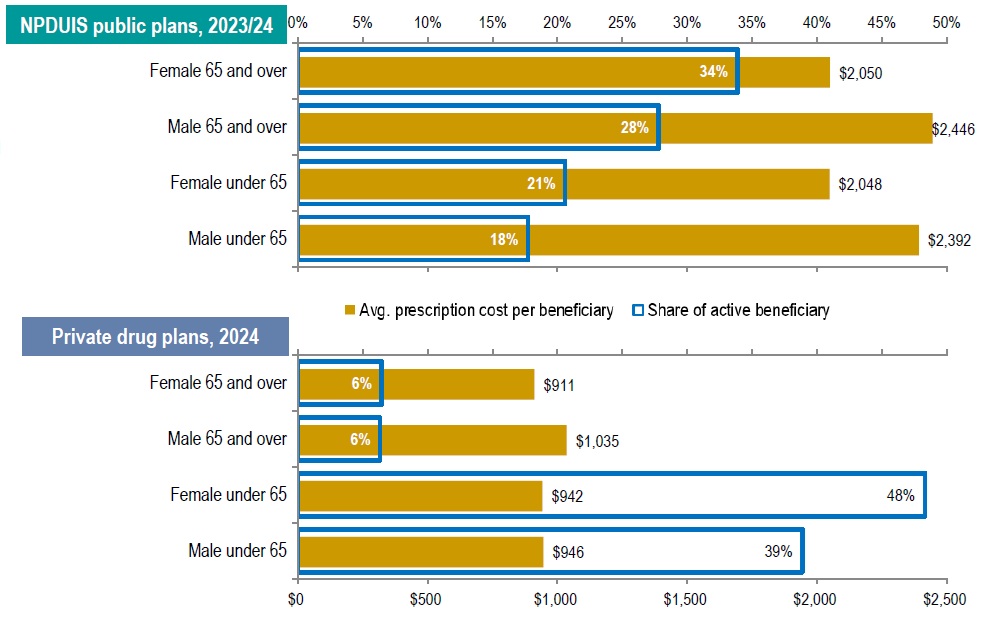
Figure description
NPDUIS public plans, 2023/24
| Demographic group | Average prescription cost per beneficiary | Share of active beneficiaries |
|---|---|---|
Female 65 and over |
$2,050 |
34% |
Male 65 and over |
$2,446 |
28% |
Female under 65 |
$2,048 |
21% |
Male under 65 |
$2,392 |
18% |
Private drug plans, 2024
| Demographic group | Average prescription cost per beneficiary | Share of active beneficiaries |
|---|---|---|
Female 65 and over |
$911 |
6% |
Male 65 and over |
$1,035 |
6% |
Female under 65 |
$942 |
48% |
Male under 65 |
$946 |
39% |
Data source: National Prescription Drug Utilization Information System Database, Canadian Institute for Health Information. IQVIA™ Private Pay Direct Drug Plan database. Capture rate: 81%.
Drug-mix effect was the largest cost driver in NPDUIS public plans, partially offset by substitution and price changes
The drug-mix effect—greater use of higher-cost medicines was the primary driver of drug cost growth, contributing 6%–8% annually
Following a 7.9% increase in 2022/23, drug costs rose by a further 7.9% in 2023/24
In 2023/24:
- Drug-mix alone contributed 8.0% to growth
- Substitution and price changes offset growth by -4.2%
- Demographic and volume effects added a combined 4.0%
Drug cost drivers, NPDUIS public plans, 2018/19 to 2023/24
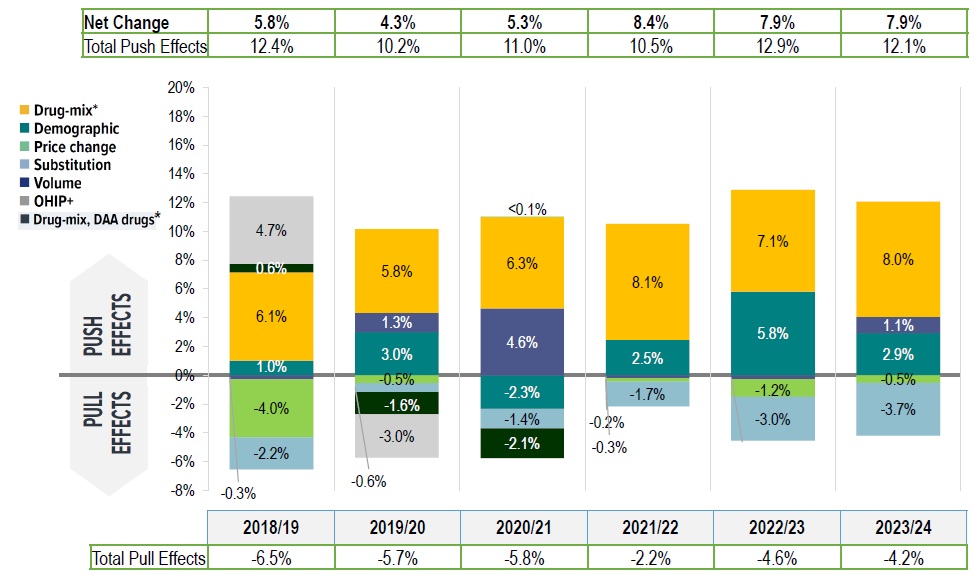
Figure description
| 2018/19 | 2019/20 | 2020/2021 | 2021/22 | 2022/23 | 2023/24 | |
|---|---|---|---|---|---|---|
Demographic |
1.0% |
3.0% |
-2.3% |
2.5% |
5.8% |
2.9% |
Volume |
-0.3% |
1.3% |
4.6% |
-0.2% |
-0.3% |
1.1% |
Drug-mix* |
6.1% |
5.8% |
6.3% |
8.1% |
7.1% |
8.0% |
Price change |
-4.0% |
-0.5% |
0.04% |
-0.3% |
-1.2% |
-0.5% |
Substitution |
-2.2% |
-0.6% |
-1.4% |
-1.7% |
-3.0% |
-3.7% |
Drug-mix, direct-acting antiviral (DAA) drugs* |
0.6% |
-1.6% |
-2.1% |
|
|
|
OHIP+ |
4.7% |
-3.0% |
|
|
|
|
Total push effects |
12.4% |
10.2% |
11.0% |
10.5% |
12.9% |
12.1% |
Total pull effects |
-6.5% |
-5.7% |
-5.8% |
-2.2% |
-4.6% |
-4.2% |
Net change |
5.8% |
4.3% |
5.3% |
8.4% |
7.9% |
7.9% |
* Since 2021/22, the effect of direct-acting antiviral (DAA) drugs has been minor (−0.1%) and folded into the Drug-mix, other drugs effect.
Data source: National Prescription Drug Utilization Information System Database, Canadian Institute for Health Information.
Private plans also had a large drug-mix impact, but offsetting effects were smaller
Similarly, over 2019–2024 in private plans, the drug-mix effect consistently pushed costs upward by 5%–9% annually
However, cost-mitigating effects from generic/biosimilar substitutions and price reductions were modest (~ -2% per year) and insufficient to offset upward pressures
Compared to public plans, demographic and volume effects varied more widely (-3% to 8%), reflecting plan design differences and pandemic-related shifts in utilization and enrollment
Drug cost drivers, private drug plans, 2019 to 2024

Figure description
| 2019 | 2020 | 2021 | 2022 | 2023 | 2024 | |
|---|---|---|---|---|---|---|
Demographic† |
2.4% |
-5.5% |
-0.2% |
1.8% |
8.9% |
6.0% |
Volume† |
1.4% |
5.6% |
-2.8% |
0.8% |
-1.9% |
1.7% |
Drug-mix* |
5.7% |
5.9% |
7.0% |
5.0% |
9.2% |
5.0% |
Price change |
-1.4% |
-0.5% |
0.2% |
-0.2% |
0.5% |
-0.6% |
Substitution |
-1.0% |
-1.0% |
-1.0% |
-2.0% |
-2.0% |
-1.7% |
OHIP+ |
2.3% |
|
|
|
|
|
Total push effects |
11.8% |
11.5% |
7.2% |
7.6% |
18.5% |
12.8% |
Total pull effects |
-2.4% |
-7.1% |
-3.9% |
-2.2% |
-3.9% |
-2.3% |
Net change |
9.0% |
5.4% |
4.0% |
4.5% |
14.1% |
9.8% |
* The drug-mix effect does not separate the impact of direct-acting antiviral (DAA) drugs for hepatitis C, due to their negligeable impact on private drug plan spending for the reported period 2019–2024.
† Partial data discontinuity from the private drug plan data supplier in 2021 and 2022 influenced the results for the demographic and volume effects. The 2023 demographic effect is based on projected claimant data to adjust for claimant double counting in the raw data.
Data source: IQVIA™ Private Pay Direct Drug Plan Database (capture rate: 79.9% to 85.7% of the private pay-direct market in Canada, varying by year).
A small number of medicines accounted for the majority of the drug-mix effect
In both sectors, 10 medicines accounted for more than half of the overall drug-mix effect:
- 4.9% upward push in 2023/24 of public plans
- 3.5% in 2024 of private plans
Antidiabetic therapies, high-cost oral oncology drugs, and immunosuppressants were among the leading contributors
Top contributors to the drug-mix effect
NPDUIS public plans, 2023/24
| Rank | Medicinal ingredient | Therapeutic class (ATC2) | Average cost per beneficiary* | Contribution to the drug-mix effect |
|---|---|---|---|---|
1 |
Semaglutide |
Drugs used in diabetes |
$2,153 |
1.73% |
2 |
Onasemnogene abeparvovec |
Other drugs for disorders of the musculo-skeletal system |
$3,086,677 |
0.40% |
3 |
Aflibercept |
Ophthalmologicals |
$8,769 |
0.40% |
4 |
Elexacaftor/tezacaftor/ivacaftor |
Other respiratory system products |
$242,041 |
0.40% |
5 |
Empagliflozin |
Drugs used in diabetes |
$847 |
0.40% |
6 |
Tafamidis |
Other nervous system drugs |
$136,961 |
0.40% |
7 |
Vedolizumab |
Immunosuppressants |
$20,846 |
0.35% |
8 |
Upadacitinib |
Immunosuppressants |
$12,598 |
0.34% |
9 |
Faricimab |
Ophthalmologicals |
$6,224 |
0.28% |
10 |
Risankizumab |
Immunosuppressants |
$18,676 |
0.22% |
Total drug-mix effect |
8.0% |
|||
Private drug plans, 2024
| Rank | Medicinal ingredient | Therapeutic class (ATC2) | Average cost per beneficiary* | Contribution to the drug-mix effect |
|---|---|---|---|---|
1 |
Semaglutide |
Drugs used in diabetes |
$1,607 |
0.72% |
2 |
Risankizumab |
Immunosuppressants |
$24,417 |
0.31% |
3 |
Dupilumab |
Other dermatological preparations |
$18,453 |
0.29% |
4 |
Lisdexamfetamine dimesilate |
Psychoanaleptics |
$16,824 |
0.26% |
5 |
Ofatumumab |
Immunosuppressants |
$748 |
0.24% |
6 |
Upadacitinib |
Immunosuppressants |
$11,428 |
0.23% |
7 |
Adalimumab |
Immunosuppressants |
$21,581 |
0.23% |
8 |
Vedolizumab |
Immunosuppressants |
$4,398 |
0.22% |
9 |
Abemaciclib |
Antineoplastic agents |
$32,766 |
0.21% |
10 |
Infliximab |
Immunosuppressants |
$116,226 |
0.18% |
Total drug-mix effect |
5.0% |
|||
* The average cost per beneficiary may not represent the cost of a complete year of treatment.
Data source: National Prescription Drug Utilization Information System Database, Canadian Institute for Health Information. IQVIA™ Private Pay Direct Drug Plan database. Capture rate: 81%.
The number and share of high-cost drugs has grown in both
High-cost drugs (annual cost >$10,000) account for:
- 38% of drug costs in 2023/24 public plans
- 33% in 2024 private plans
Drugs costing >$25,000 annually represent:
- 21% of public plan costs
- 15% of private plan costs
The number of high-cost drugs has increased across all cost bands, particularly medicines costing over $100,000 annually
NPDUIS public plans, 2018/19 to 2023/24

Figure description
NPDUIS public plans, 2018/19 to 2023/24
| Number of drugs $10,000 to $25,000 | Number of drugs $25,000 to $50,000 | Number of drugs $50,000 to $100,000 | Number of drugs over $100,000 | Share of total drug cost for drugs over $10,000 | Share of total drug cost for drugs over $25,000 | |
|---|---|---|---|---|---|---|
2018/19 |
54 |
31 |
23 |
10 |
35% |
20% |
2019/20 |
58 |
34 |
24 |
13 |
35% |
19% |
2020/21 |
59 |
36 |
25 |
16 |
35% |
18% |
2021/22 |
62 |
38 |
26 |
22 |
37% |
19% |
2022/23 |
65 |
40 |
31 |
26 |
37% |
20% |
2023/24 |
70 |
44 |
33 |
26 |
38% |
21% |
Note: High-cost medicines are defined as having an annual treatment cost greater than $10,000.
Data source: IQVIA™ Private Pay Direct Drug Plan Database (capture rate: 79.9% to 85.7% of the private pay-direct market in Canada, varying by year).
Private drug plans, 2019 to 2024
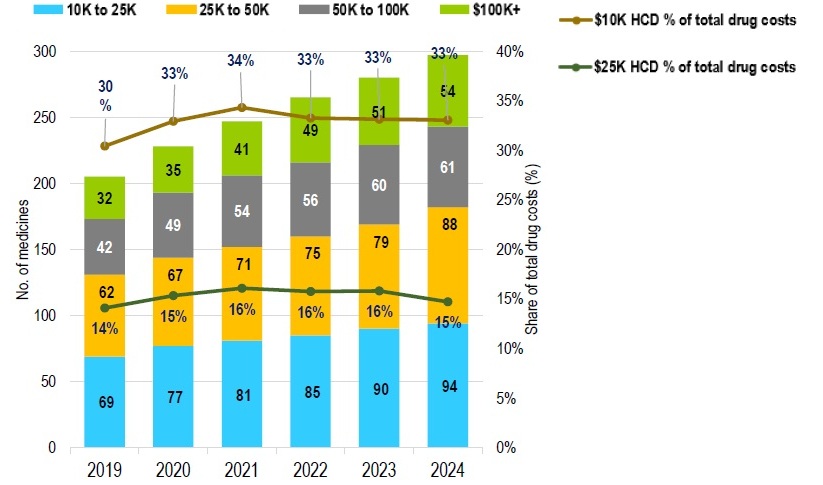
Figure description
Private drug plans, 2019 to 2024
| Number of drugs $10,000 to $25,000 | Number of drugs $25,000 to $50,000 | Number of drugs $50,000 to $100,000 | Number of drugs over $100,000 | Share of total drug cost for drugs over $10,000 | Share of total drug cost for drugs over $25,000 | |
|---|---|---|---|---|---|---|
2019 |
69 |
62 |
42 |
32 |
30% |
14% |
2020 |
77 |
67 |
49 |
35 |
33% |
15% |
2021 |
81 |
71 |
54 |
41 |
34% |
16% |
2022 |
85 |
75 |
56 |
49 |
33% |
16% |
2023 |
90 |
79 |
60 |
51 |
33% |
16% |
2024 |
94 |
88 |
61 |
54 |
33% |
15% |
Note: High-cost medicines are defined as having an annual treatment cost greater than $10,000.
Data source: IQVIA™ Private Pay Direct Drug Plan Database (capture rate: 79.9% to 85.7% of the private pay-direct market in Canada, varying by year).
Public drug plans saw greater savings from substation and price changes than private plans
Public drug plans achieved greater savings (average -3.2%) than private plans (-1.8%)
After significant price drops in 2018/19, savings from price change stabilized at under –1% in both sectors
Substitution generated larger effects than price changes:
- -3.7% in public plans (2023/24)
- -1.7% in private plans (2024)
Biosimilars and high-selling generics were among the top contributors to substitution effects in both sectors
Trends in price and substitution effects
NPDUIS public plans, 2018/19 to 2023/24
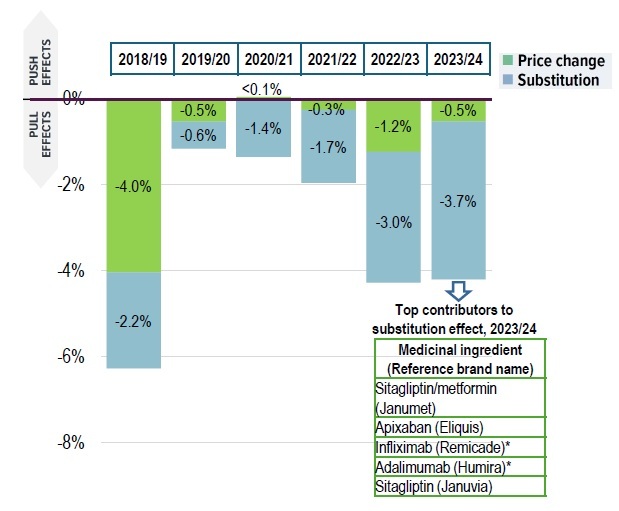
Figure description
NPDUIS public plans, 2018/19 to 2023/24
| 2018/19 | 2019/20 | 2020/21 | 2021/22 | 2022/23 | 2023/24 | |
|---|---|---|---|---|---|---|
Price change |
-4.0% |
-0.5% |
<0.1% |
-0.3% |
-1.2% |
-0.5% |
Substitution |
-2.2% |
-0.6% |
-1.4% |
-1.7% |
-3.0% |
-3.7% |
Top contributors to substitution effect, 2023/24
| Medicinal ingredient (Reference brand name) |
|---|
Sitagliptin/metformin (Janumet) |
Apixaban (Eliquis) |
Infliximab (Remicade)* |
Adalimumab (Humira)* |
Sitagliptin (Januvia) |
*Substitution effect from biosimilar medicines
Data source: IQVIA™ Private Pay Direct Drug Plan Database (capture rate: 79.9% to 85.7% of the private pay-direct market in Canada, varying by year).
Private drug plans, 2019 to 2024
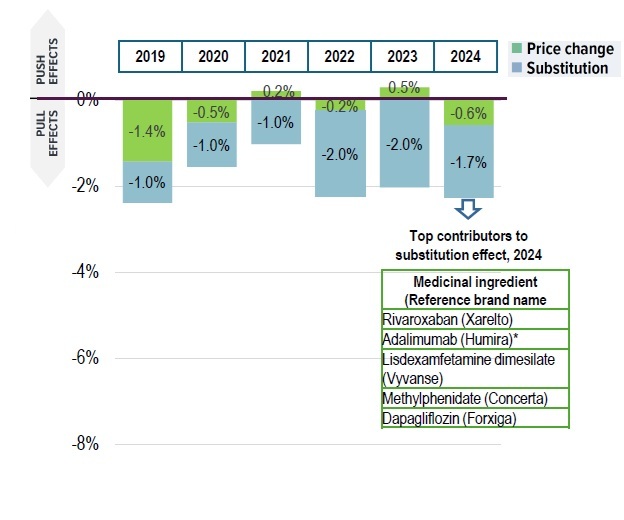
Figure description
Private drug plans, 2019 to 2024
| 2019 | 2020 | 2021 | 2022 | 2023 | 2024 | |
|---|---|---|---|---|---|---|
Price change |
-1.4% |
-0.5% |
0.2% |
-0.2% |
0.5% |
-0.6% |
Substitution |
-1.0% |
-1.0% |
-1.0% |
-2.0% |
-2.0% |
-1.7% |
Top contributors to substitution effect, 2024
| Medicinal ingredient (Reference brand name) |
|---|
Rivaroxaban (Xarelto) |
Adalimumab (Humira)* |
Lisdexamfetamine dimesilate (Vyvanse) |
Methylphenidate (Concerta) |
Dapagliflozin (Forxiga) |
*Substitution effect from biosimilar medicines
Data source: IQVIA™ Private Pay Direct Drug Plan Database (capture rate: 79.9% to 85.7% of the private pay-direct market in Canada, varying by year).
Key findings
- Sustained growth across both sectors, with higher growth in private plans
- Prescription drug expenditures grew at a CAGR of 5.9% in NPDUIS public plans (2018/19 - 2023/24) and 7.7% in private plans (2019 – 2024)
- Public plan beneficiaries are mainly (62%) seniors with higher annual costs, while private plan claimants are mostly (87%) under age 65 with lower annual costs
- Increased use of higher-cost drugs remains the leading cost driver in both sectors
- The drug-mix effect consistently pushed drug costs upward by 5%–9% annually
- High-cost medicines (costing over $10,000 annually) accounted for 38% of drug costs in public plans and 33% in private plans
- Savings from generic/biosimilar substitution and price reductions moderated cost growth but were insufficient to offset upward pressures
- Cost-mitigating effects were stronger in public plans (average -3%) than in private plans (-2%), driven primarily by substitution effects