
Pharmaceutical research and development (R&D) investment and number of clinical trials in Canada
Despite strong patent protection and relatively high drug prices in Canada, the level of research and development (R&D) expenditures relative to patented medicine revenues has been declining over the last two decades, prompting the need for a closer examination of the trends of pharmaceutical R&D investment and clinical trial intensity.
Background: Innovation is vital to advancing health care. In part, the provisions of Canada’s Patent Act are intended to foster an investment climate favorable to pharmaceutical R&D in Canada. However, the ratio of R&D expenditures to sales revenues for pharmaceutical patentees in Canada has been falling since the late 1990s and has been under the agreed-upon target of 10% since 2003. In 2019, it was at 3.9% for both all patentees and members of Innovative Medicines Canada. At the same time, Canadian list prices of patented medicines are the fourth highest in the Organisation for Economic Co-operation and Development (OECD).
1. Patentee R&D expenditures in Canada are out of step with comparator countries, even when broader expenditures are factored in.
Despite having among the highest prices in the OECD, the percentage of R&D-to-sales by pharmaceutical patentees in Canada was 3.9% in 2019, its lowest level since the PMPRB first began reporting on pharmaceutical trends in the 1980s. In 2017, Canada’s R&D-to-sales ratio was the lowest among the PMPRB7 comparator countries at 4.1%. Italy had a slightly higher ratio of 5.7%, while all other PMPRB7 countries remained well above Canada. The ratio obtained by aggregating R&D spending and sales across all PMPRB7 countries was 24.0%, almost six times greater than in Canada.
While the PMPRB defines R&D based on the 1987 Scientific Research and Experimental Development (SR&ED) definition, patentee R&D expenditures in Canada continue to fall below international norms, even when broader measures of R&D are considered. Using estimates recently published by Statistics Canada, the inclusion of broader measures of R&D (SR&ED and non-SR&ED) increases Canada’s R&D-to-sales ratio to just 5.8% for Innovative Medicines Canada (IMC) members. This ratio may be an overestimate as it combines in-house and outsourced R&D that Statistics Canada generally reports separately, and which has the potential to lead to double counting of the domestically outsourced R&D.
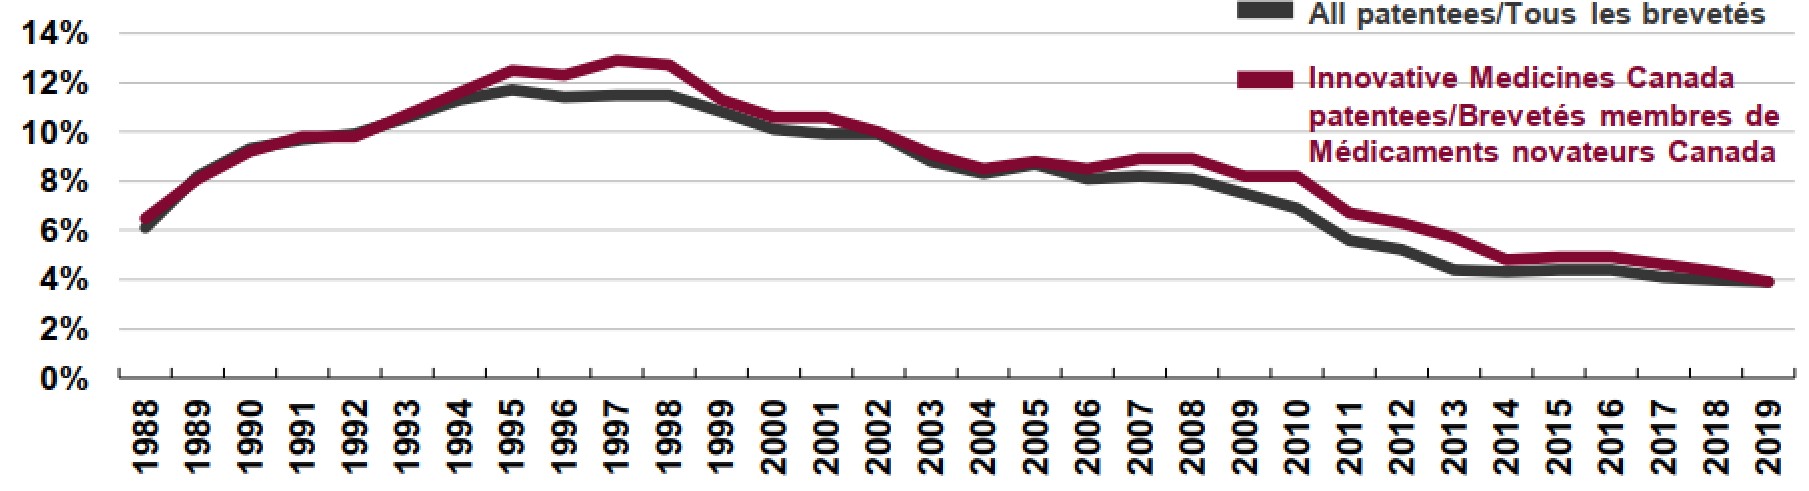
Figure description
This is a line graph that depicts the annual the R&D-to-sales ratio for all patentees and members of Innovative Medicines Canada (IMC) from 1988 to 2019.
Canadian Pharmaceutical Patentees, 1988 to 2019
IMC Patentees: 1988, 6.5%; 1989, 8.1%; 1990, 9.2%; 1991, 9.8%; 1992, 9.8%; 1993, 10.7%; 1994, 11.6%; 1995, 12.5%; 1996, 12.3%; 1997, 12.9%; 1998, 12.7%; 1999, 11.3%; 2000, 10.6%; 2001, 10.6%; 2002, 10.0%; 2003, 9.1%; 2004, 8.5%; 2005, 8.8%; 2006, 8.5%; 2007, 8.9%; 2008, 8.9%; 2009, 8.2%; 2010, 8.2%; 2011, 6.7%; 2012, 6.3%; 2013, 5.7%; 2014, 4.8%; 2015, 4.9%; 2016, 4.9%; 2017, 4.6%; 2018, 4.3%; 2019, 3.9%.
All Patentees: 1988, 6.1%; 1989, 8.2%; 1990, 9.3%; 1991, 9.7%; 1992, 9.9%; 1993, 10.6%; 1994, 11.3%; 1995, 11.7%; 1996, 11.4%; 1997, 11.5%; 1998, 11.5%; 1999, 10.8%; 2000, 10.1%; 2001, 9.9%; 2002, 9.9%; 2003, 8.8%; 2004, 8.3%; 2005, 8.7%; 2006, 8.1%; 2007, 8.2%; 2008, 8.1%; 2009, 7.5%; 2010, 6.9%; 2011, 5.6%; 2012, 5.2%; 2013, 4.4%; 2014, 4.3%; 2015, 4.4%; 2016, 4.4%; 2017, 4.1%; 2018, 4.0%; 2019, 3.9%.
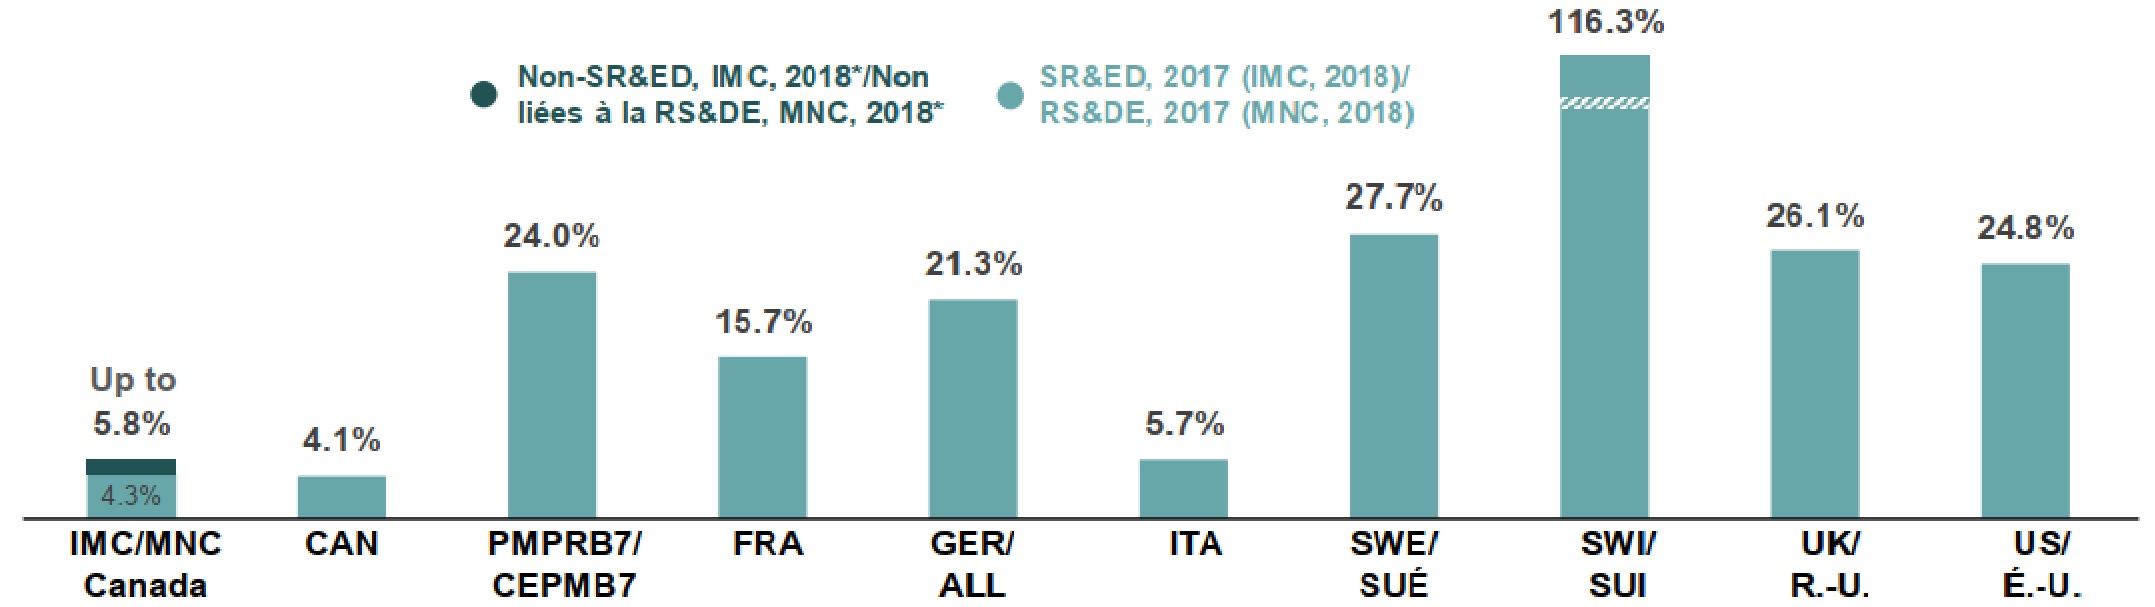
Figure description
This is a bar graph with R&D-to-sales ratios for Canada and each of the seven PMPRB comparator countries (PMPRB7) in 2017. Results for Canada are shown both as a whole and for members of Innovative Medicines Canada, which also includes results using an expanded definition of R&D that incorporates expenditures that did not qualify for a Scientific Research and Experimental Development investment tax credit in 2018 (non-SR&ED).
Country |
R&D-to-sales ratio, SR&ED expenditures, 2017 |
R&D-to-sales ratio, with non-SR&ED expenditures, 2018* |
Canada: Innovative Medicines Canada members |
4.3% |
Up to 5.8% |
Canada: all |
4.1% |
– |
PMPRB7 median |
24.0% |
– |
France |
15.7% |
– |
Germany |
21.3% |
– |
Italy |
5.7% |
– |
Sweden |
27.7% |
– |
Switzerland |
116.3% |
– |
United Kingdom |
26.1% |
– |
United States |
24.8% |
– |
Note: “SR&ED” indicates R&D expenditures that would have qualified for a Scientific Research and Experimental Development (SR&ED) investment tax credit under the provisions of the Income Tax Act that came into effect on December 1, 1987.
* The R&D-to-sales ratio for 2018 using a non-SR&ED definition is only available for Canada and was calculated using the R&D estimates published by Statistics Canada, which indicate that IMC members performed between $0.8 billion and $1.2 billion of total R&D in 2018. Statistics Canada’s range includes $188 million outsourced by IMC members to foreign recipients which was excluded from this analysis.
2. Canada has a sizable number of clinical trials, and those publicly sponsored play an important role.
Clinical trial intensity in Canada, measured by the number of new clinical trials per 1 million people, is just above the OECD median, at 12 and 11, respectively. Industry funds the majority of clinical trials internationally, though to a lesser extent in Canada: the share of new clinical trials primarily sponsored by the industry in Canada (70%) is lower than the OECD median (78%), and likewise, the share of Canadian patentee-sponsored clinical trials (46%) falls below OECD norms (61%). This suggests that the public funding of clinical trials plays an important role in the relatively strong clinical trial intensity in Canada.
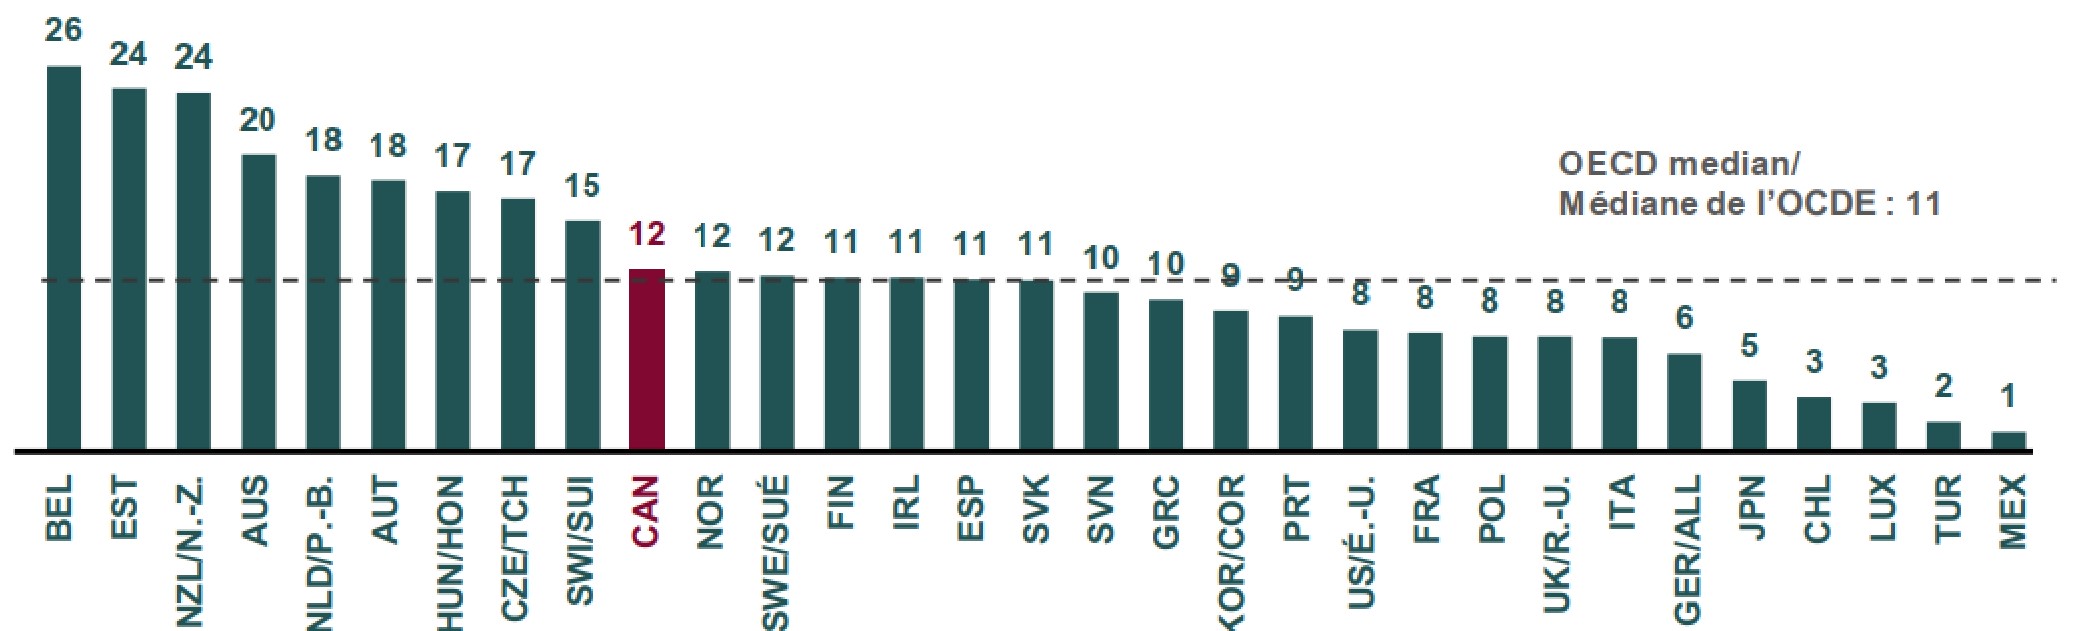
Figure description
This figure consists of a bar graph with the number of new clinical trials per 1 million people in each of the Organisation for Economic Co-operation and Development (OECD) countries in the second half of 2020. The median for the OECD countries was 11.
| Country | Number of new clinical trials per 1 million people |
|---|---|
Belgium |
26 |
Estonia |
24 |
New Zealand |
24 |
Australia |
20 |
Netherlands |
18 |
Austria |
18 |
Hungary |
17 |
Czechia |
17 |
Switzerland |
15 |
Canada |
12 |
Norway |
12 |
Sweden |
12 |
Finland |
11 |
Ireland |
11 |
Spain |
11 |
Slovakia |
11 |
Slovenia |
10 |
Greece |
10 |
South Korea |
9 |
Portugal |
9 |
United States |
8 |
France |
8 |
Poland |
8 |
United Kingdom |
8 |
Italy |
8 |
Germany |
6 |
Japan |
5 |
Chile |
3 |
Luxembourg |
3 |
Turkey |
2 |
Mexico |
1 |
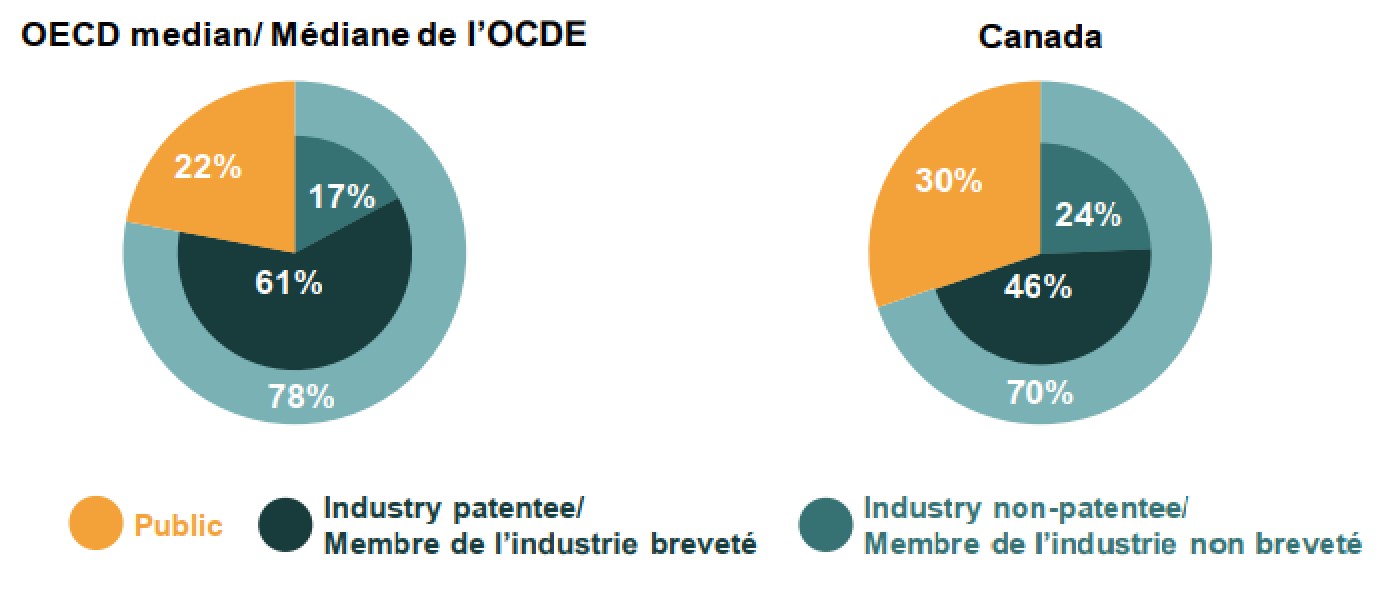
Figure description
Two accompanying pie charts show the distribution of new clinical trials by source of funding in the OECD and in Canada.
| OECD | Canada | |
|---|---|---|
Industry: patentee |
61% |
46% |
Industry: non-patentee |
17% |
24% |
Total industry |
78% |
70% |
Public |
22% |
30% |
Note: Public funding refers to the
funding from the government,
institutions, and individuals.
Source of funding is defined
based on the primary sponsor
responsible for providing funding
for the research.
3. Following a temporary decline in the number of international clinical trials due to the COVID-19 pandemic, the numbers in Canada are now back in line with previous trends.
COVID-19 caused unprecedented disruptions of clinical trials around the world in the first half of 2020. Compared with the average over the previous four years (2016–2019), the number of new clinical trials declined by an average of 21% among the OECD and PMPRB7 countries, and subsequently recovered in the second half of 2020. Similarly, the number of new clinical trials in Canada declined by 29% in the first half of 2020, and subsequently recovered to average levels in the second half of 2020.
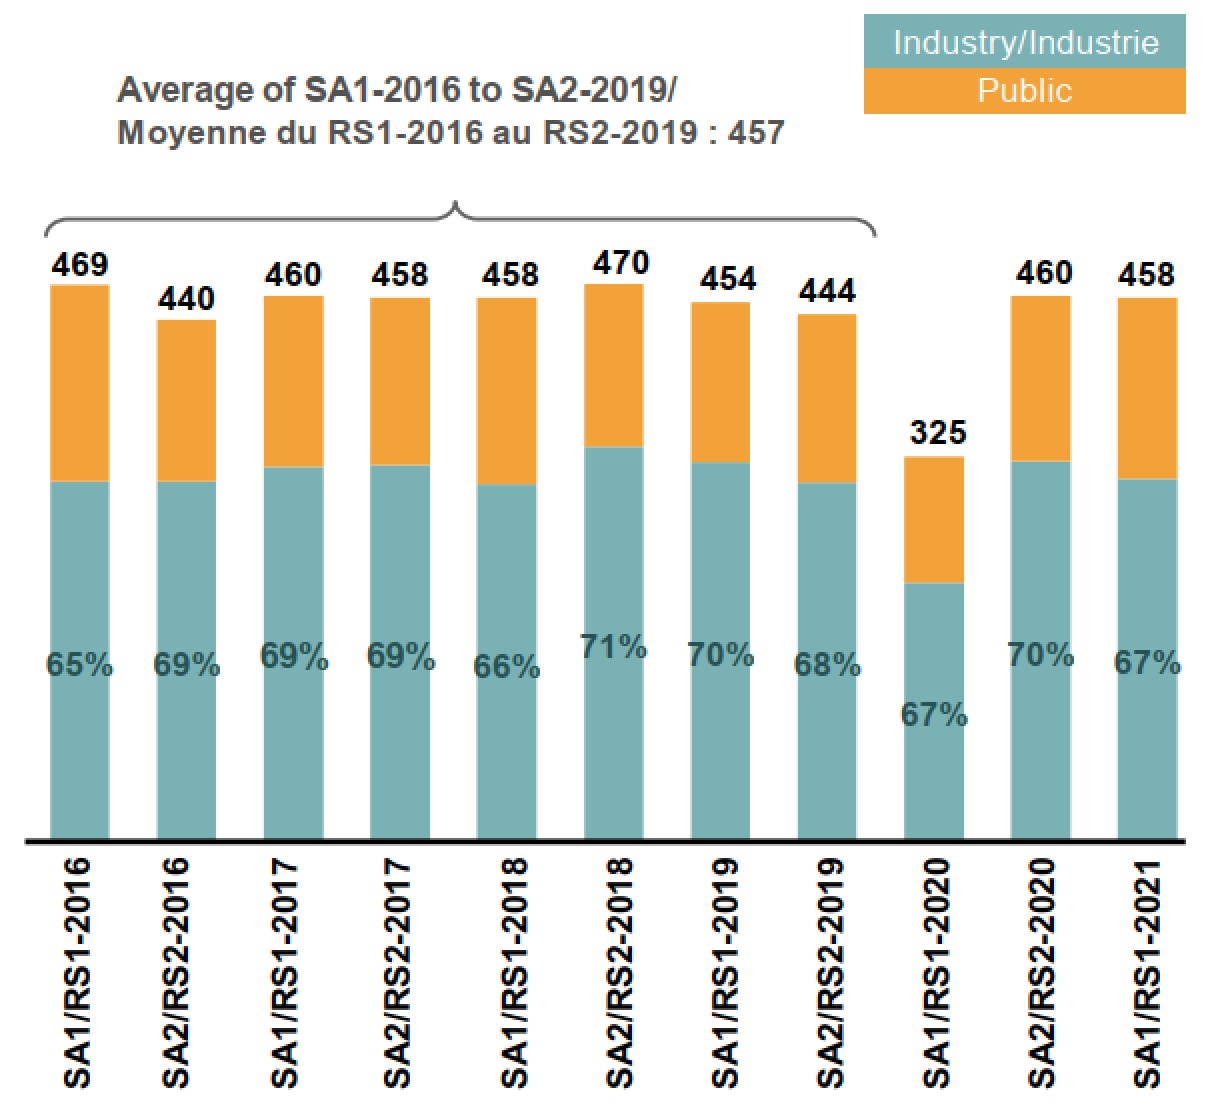
Figure description
This stacked bar graph gives the number of new clinical trials in Canada for each half-year between the start of 2016 and the first half of 2021. Each bar includes the total number of trials as well as the proportion funded by industry or public sponsors. Between 2016 and 2019, there was an average of 457 new clinical trials in each half-year period.
| Period | Total number of new clinical trials | Share of new clinical trials funded by industry sources | Share of new clinical trials funded by public sources |
|---|---|---|---|
2016: first half |
469 |
65% |
35% |
2016: second half |
440 |
69% |
31% |
2017: first half |
460 |
69% |
31% |
2017: second half |
458 |
69% |
31% |
2018: first half |
458 |
66% |
34% |
2018: second half |
470 |
71% |
29% |
2019: first half |
454 |
70% |
30% |
2019: second half |
444 |
68% |
32% |
2020: first half |
325 |
67% |
33% |
2020: second half |
460 |
70% |
30% |
2021: first half |
458 |
67% |
33% |
4. Over 1,000 clinical trials across the world have experienced disruptions due to the COVID-19 pandemic, with Canada seeing a comparable share of disrupted trials as other countries.
Some countries (such as United Kingdom and Estonia) have had nearly 7% of their clinical trials disrupted by the pandemic. In Canada, 158 clinical trials have been disrupted, or about 4.5% of Canada’s 2020 clinical trials, which is the OECD median.
Of all global clinical trials impacted by COVID-19, 72% were delayed or suspended and only a minority (28%) were terminated or withdrawn. Many trials experienced delayed initiation, enrollment suspensions, or overall slow enrollment, which can be attributed to patient safety measures, strict lockdown requirements, social distancing procedures, and the high demand on medical professionals to treat COVID-19 patients.
In OECD countries, Phase II and Phase III studies accounted for the greatest proportion of disrupted trials (51% and 26%, respectively) followed by Phase I and Phase IV (14% and 9%, respectively). Multinational clinical trials were more delayed or affected by the pandemic than single-country trials and oncology medicines were the most impacted therapeutic class, as they represent the most clinical trials of any therapeutic area.
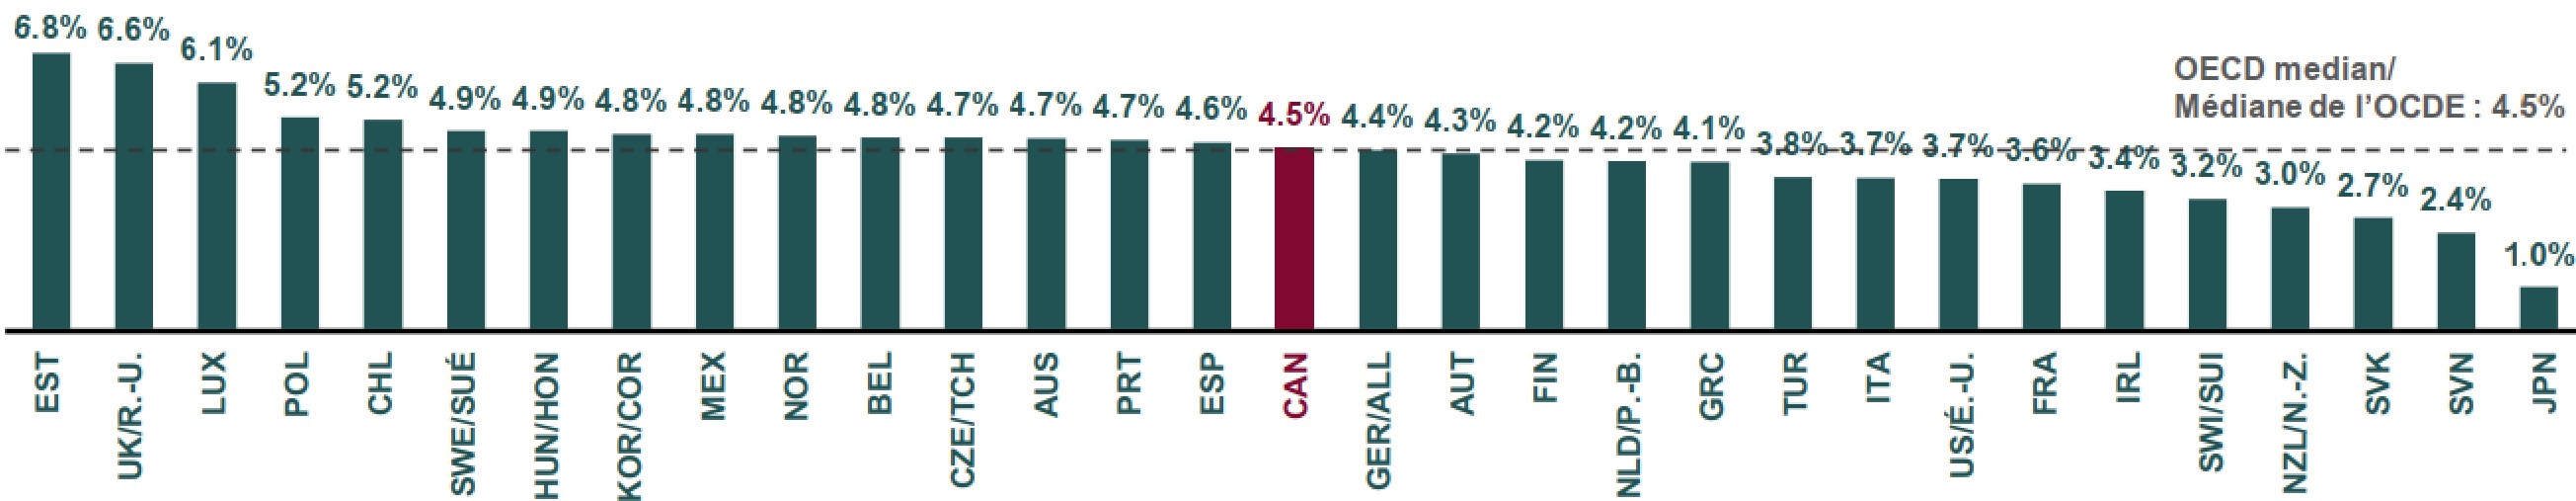
Figure description
This bar graph gives the share of clinical trials that were disrupted by the COVID-19 pandemic in each of the Organisation for Economic Co-operation and Development (OECD) countries. The median across all countries shown was 4.5%.
| Country | Share of clinical trials disrupted by COVID-19 |
|---|---|
Estonia |
6.8% |
United Kingdom |
6.6% |
Luxembourg |
6.1% |
Poland |
5.2% |
Chile |
5.2% |
Sweden |
4.9% |
Hungary |
4.9% |
Slovakia |
4.8% |
Mexico |
4.8% |
New Zealand |
4.8% |
Belgium |
4.8% |
Czech Republic |
4.7% |
Australia |
4.7% |
Portugal |
4.7% |
Spain |
4.6% |
Canada |
4.5% |
Germany |
4.4% |
Austria |
4.3% |
Finland |
4.2% |
Netherlands |
4.2% |
Greece |
4.1% |
Turkey |
3.8% |
Italy |
3.7% |
United States |
3.7% |
France |
3.6% |
Ireland |
3.4% |
Switzerland |
3.2% |
Norway |
3.0% |
Slovenia |
2.7% |
South Korea |
2.4% |
Japan |
1.0% |
5. COVID-19 clinical trial intensity is relatively high in Canada and mostly funded by the public.
Clinical trial intensity for COVID-19 medicines, measured by the number of new clinical trials per 1 million people, is higher in Canada (3.4) than the median for the OECD (2.5). Industry funds a minority of COVID-19 clinical trials internationally and even fewer of those in Canada: the share of industry-sponsored COVID-19 trials in Canada (45%) is lower than the OECD median (49%), and likewise, the share of Canadian patentee-sponsored trials (25%) falls below OECD norms (35%). This suggests that funding from public sources is a major factor in the relatively strong clinical trial intensity for COVID-19 medicines in Canada.
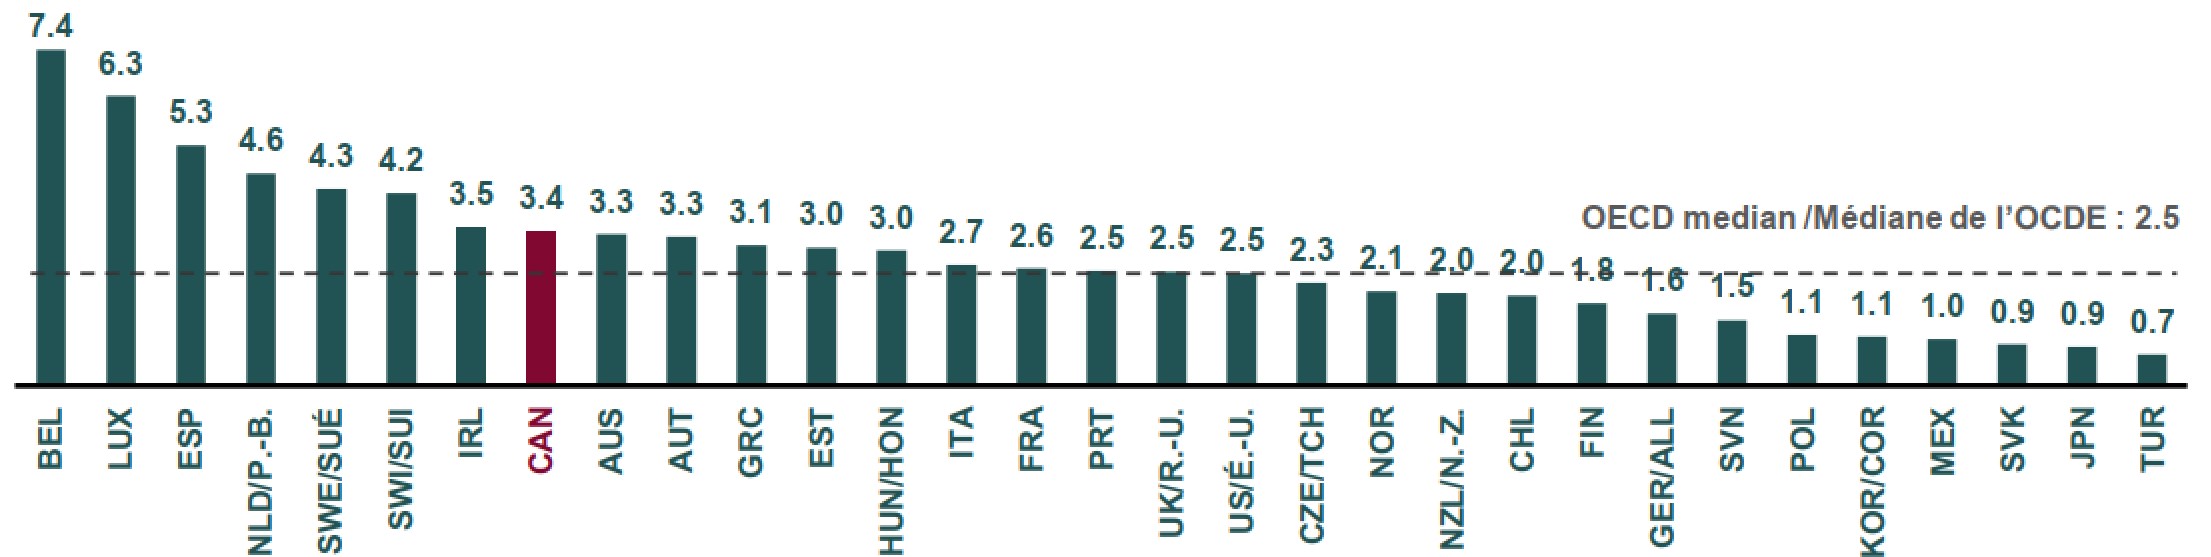
Figure description
This figure consists of a bar graph with the number of clinical trials for COVID-19 medicines per 1 million people in each of the Organisation for Economic Co-operation and Development (OECD) countries. The median for the OECD countries was 2.5.
| Country | Number of COVID-19 clinical trials per 1 million people |
|---|---|
Belgium |
7.4 |
Luxembourg |
6.3 |
Spain |
5.3 |
Sweden |
4.6 |
Netherlands |
4.3 |
Switzerland |
4.2 |
Australia |
3.5 |
Ireland |
3.4 |
Canada |
3.3 |
Estonia |
3.3 |
Hungary |
3.1 |
Austria |
3.0 |
Greece |
3.0 |
Czech Republic |
2.7 |
New Zealand |
2.6 |
Italy |
2.5 |
United Kingdom |
2.5 |
United States |
2.5 |
France |
2.3 |
Portugal |
2.1 |
Finland |
2.0 |
Norway |
2.0 |
Chile |
1.8 |
Slovenia |
1.6 |
Germany |
1.5 |
Poland |
1.1 |
South Korea |
1.1 |
Mexico |
1.0 |
Slovakia |
0.9 |
Japan |
0.9 |
Turkey |
0.7 |
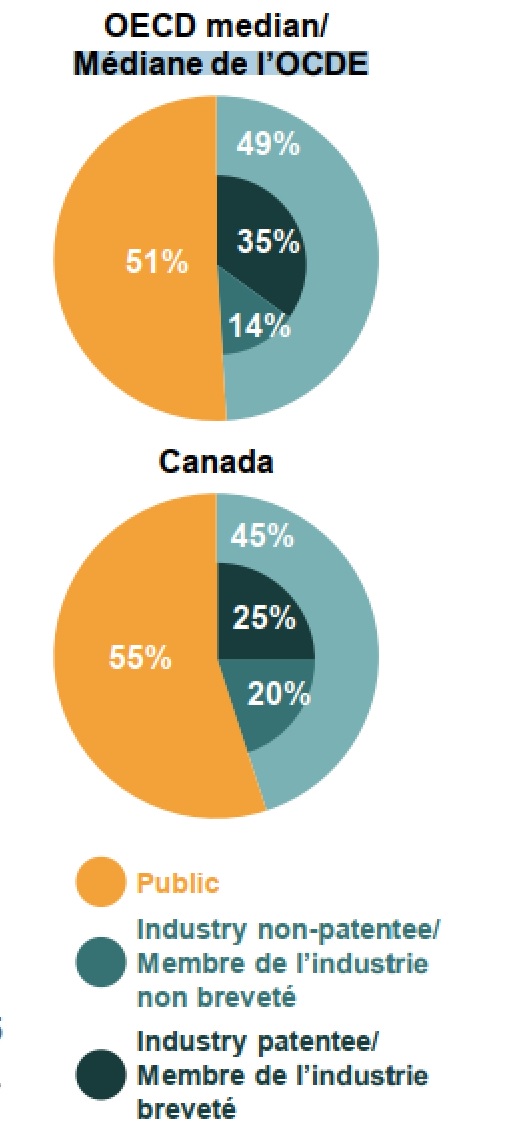
Figure description
Two accompanying pie charts show the distribution of COVID-19 clinical trials by source of funding in the OECD and in Canada.
| OECD | Canada | |
|---|---|---|
Industry: patentee |
35% |
25% |
Industry: non-patentee |
14% |
20% |
Total industry |
49% |
45% |
Public |
51% |
55% |
Data sources
1. Statistics Canada, May 2021, “The Canadian Research and Development Pharmaceutical Sector,” available at: https://www150.statcan.gc.ca/n1/en/pub/11-621-m/11-621-m2021003-eng.pdf?st+vuFRricY
2. PMPRB Annual Report, 2019.
3. GlobalData®.