
Prairies Economic Development Canada’s Quarterly Financial Report for the quarter ended June 30, 2026
View the print-friendly version: PDF (1085 kB)
ISSN 2817-2558
Statement outlining results, risks and significant changes in operations, personnel and programs
Introduction
This quarterly financial report should be read in conjunction with the Main Estimates and Supplementary Estimates (A). It has been prepared by management as required by section 65.1 of the Financial Administration Act (FAA) and in the form and manner prescribed by the Treasury Board. This quarterly report has not been subject to an external audit or review.
Authority, mandate and program activities
Prairies Economic Development Canada’s (PrairiesCan) mandate is to grow and diversify the economy of the prairie provinces and advance its interests of the region in national economic policy, programs, and projects. The department will achieve this mandate by working with clients and partners in our four roles as investor, advisor, pathfinder, and convenor.
PrairiesCan operates under the provision of the Western Economic Diversification Act, which came into force on June 28, 1988. As a federal department, PrairiesCan is headed by a Minister and a Deputy Head (President).
The Departmental Plan and Main Estimates provide further information on PrairiesCan’s authority, mandate and program activities.
Basis of presentation
This quarterly report has been prepared by management using an expenditure basis of accounting. The accompanying Statement of Authorities includes the department’s spending authorities granted by Parliament and those used by the department, consistent with the Main Estimates and Supplementary Estimates (A) for the 2026–27 fiscal year. This quarterly report has been prepared using a special purpose financial reporting framework designed to meet financial information needs with respect to the use of spending authorities.
The authority of Parliament is required before money can be spent by the Government. Approvals are given in the form of annually approved limits through appropriation acts, or through legislation in the form of statutory spending authority for specific purposes.
The Department uses the full accrual method of accounting to prepare and present its annual departmental financial statements that are part of the departmental results reporting process. However, the spending authorities voted by Parliament remain on an expenditure basis.
Financial structure
PrairiesCan manages its expenditures under two votes:
- Vote 1 – Net operating expenditures include salary, and other operating costs (e.g., transportation and communications; professional and special services).
- Vote 5 – Grants and contributions include all transfer payments.
Budgetary statutory authorities represent payments made under legislation approved by Parliament, and include items such as the Government of Canada’s share of employee benefit plans and other minor items.
Highlights of fiscal quarter and fiscal year-to-date (YTD) results
The following section highlights significant changes to fiscal quarter results as of June 30, 2026.
Statement of authorities: Vote 1 – Net operating expenditures
Total authorities available for use at quarter-end for fiscal year 2026–2027 are $47.8 million, representing a net increase of $5.3 million, or 12%, compared to $42.5 million at quarter-end for fiscal year 2025–2026. The net increase is explained by:
- $2.7 million increase to support Regional Tariff Response Initiative announced in Budget 2025;
- $2.2 million increase in funding for collective bargaining agreement adjustments;
- $2.0 million increase in funding for the Regional Development Agency Bridge Funding Replacement announced in Budget 2025;
- $0.3 million increase to support the Regional Defence Investment Initiative announced in Budget 2025;
- $1.2 million decrease in funding for the completion of the Regional Relief and Recovery Fund;
- $0.4 million decrease in funding for various other minor adjustments; and
- $0.3 million decrease in funding for Canada Coal Transition Initiative announced in Budget 2018.
Total authorities used has increased to $13.0 million for the quarter–ended June 30, 2026, compared to $10.8 million used at June 30, 2025. The increase of $2.2 million, or 21%, is primarily due to an increase for collective bargaining, and increases to support various Budget 2025 initiatives, such as the Regional Tariff Response Initiative.
Graph 1 illustrates total authorities available for use and authorities used, both as at quarter-end for the fiscal year.
(in thousands of dollars)

Text version: Total available for use and Used for Vote 1 (in thousands of dollars)
This bar graph breaks down total authorities available for use for fiscal year 2026–27 and the authorities used at quarter–end and then compares them to fiscal year 2025–26.
2026–2027
- $47,825 represents total available for use for the year ending March 31
- $12,996 represents total authorities used for the quarter–ending June 30
2025–2026
- $42,526 represents total available for use for the year ending March 31
- $10,760 represents total authorities used for the quarter–ending June 30
Statement of authorities: Vote 5 – Grants and contributions
Total authorities available for use at quarter-end for fiscal year 2026–2027 are $303.6 million, representing a net increase of $72.7 million, or 31%, compared to the $230.9 million at quarter-end for fiscal year 2025–2026. The net decrease is explained by:
- $63.3 million increase to support Regional Tariff Response Initiative announced in Budget 2025;
- $45.0 million increase in funding to support the Regional Development Agency Bridge Funding Replacement announced in Budget 2025;
- $17.7 million increase support for the Building Communities Strong Fund announced in Budget 2026;
- $17.0 million increase support for the Regional Defence Investment Initiative announced in Budget 2025;
- $10.0 million increase support for the Hudson Bay Railway in Churchill Manitoba;
- $5.5 million increase in funding for CKUA project announced in Budget 2025;
- $2.5 million increase support for the Regional Artificial Intelligence Initiative announced in Budget 2024;
- $21.0 million decrease in funding for the Canadian Critical Drug Initiative;
- $19.2 million decrease in funding for the Vaccine and Infectious Disease Organization project;
- $12.9 million decrease in funding for the Reinvestment of Receipts Repayable Contribution;
- $11.6 million decrease in funding for the Canada Coal Transition Initiative announced in Budget 2018;
- $7.3 million decrease in funding for the conclusion of the Tourism Growth Program;
- $6.9 million decrease in funding for the Growth through Regional Innovation Program;
- $5.7 million decrease in funding for the Critical Minerals Initiative;
- $2.0 million decrease in funding for the New Flyer Industries;
- $1.5 million decrease in funding for the RCMP Heritage Centre announced in Budget 2024; and
- $0.2 million decrease in funding for other minor grants and contributions adjustments.
Total authorities used for the quarter-ended June 30, 2026 increased to $25.7 million, compared to $19.2 million at June 30, 2025. The $6.5 million increase, or 34% is explained by:
- $5.0 million increase for payments restoring rail service to Churchill, Manitoba;
- $1.3 million increase for payments for the Regional Tariff Response Initiative announced in Budget 2025;
- $1.0 million increase for payments supporting the Regional Defence Investment Initiative announced in Budget 2025;
- $0.5 million increase in Regional Economic Growth through Innovation payments to deliver various other initiatives;
- $0.2 million increase in Regional Artificial Intelligence Initiative payments announced in Budget 2024;
- $1.2 million decrease in Western Diversification Program payments, investing in a diverse and growing economy; and
- $0.3 million decrease in Prairies Performing Arts Initiative payments announced in Budget 2024.
Graph 2 illustrates total authorities available for use and authorities used, both as at quarter-end for the fiscal year.
(in thousands of dollars)
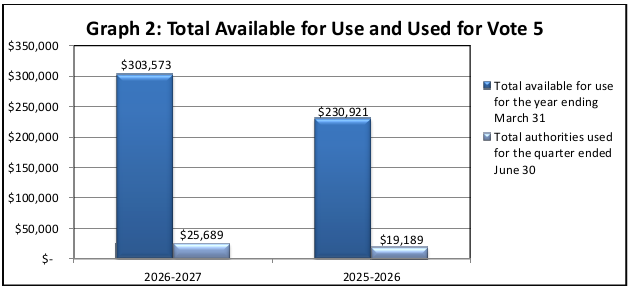
Text version: Total available for use and Used for Vote 5 (in thousands of dollars)
This bar graph breaks down total authorities available for use for fiscal year 2026–27 and the authorities used at quarter–end and then compares them to fiscal year 2025–26.
2026–2027
- $303,573 represents total available for use for the year ending March 31
- $25,689 represents total authorities used for the quarter–ending June 30
2025–2026
- $230,921 represents total available for use for the year ending March 31
- $19,189 represents total authorities used for the quarter–ending June 30
Statement of authorities: Budgetary statutory authorities
Budgetary statutory authorities available for use at quarter-end for fiscal year 2026–2027 are $6.4 million, representing an increase of $1.3 million when compared to the $5.1 million at quarter-end for fiscal year 2025–2026. The variance is due to net adjustments in personnel funding.
Budgetary statutory authorities used for fiscal year 2026–2027 are $1.6 million, an increase of $0.3 million when compared to the $1.3 million in 2025–2026.
Graph 3 illustrates total authorities available for use and authorities used, both as at quarter–end for the fiscal year.
(in thousands of dollars)
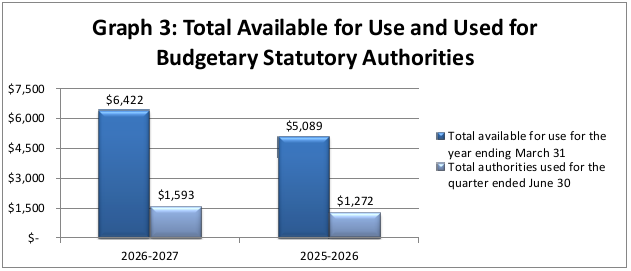
Text version: Total available for use and used for budgetary statutory authorities (in thousands of dollars)
This bar graph breaks down total authorities available for use for fiscal year 2026–27 and the authorities used at quarter–end and then compares them to fiscal year 2025–26.
2026–2027
- $6,422 represents total available for use for the year ending March 31
- $1,593 represents total authorities used for the quarter ending June 30
- $5,089 represents total available for use for the year ending March 31
- $1,272 represents total authorities used for the quarter ending June 30
Statement of the departmental budgetary expenditures by standard object
Expenditures by standard object for the quarter ended June 30, 2026, were $40.3 million, which reflects an increase of $9.1 million, or 29% from the $31.2 million at June 30, 2025.
The variance is largely due to:
- $5.0 million increase for payments restoring rail service to Churchill, Manitoba;
- $2.9 million increase for salary and personnel costs;
- $1.3 million increase for payments for the Regional Tariff Response Initiative announced in Budget 2025;
- $1.0 million increase for payments supporting the Regional Defence Investment Initiative announced in Budget 2025;
- $0.5 million increase in Regional Economic Growth through Innovation payments to deliver various other initiatives;
- $0.2 million increase in Regional Artificial Intelligence Initiative payments announced in Budget 2024;
- $1.2 million decrease in Western Diversification Program payments, investing in a diverse and growing economy;
- $0.3 million decrease in Prairies Performing Arts Initiative payments announced in Budget 2024; and
- $0.3 million decrease in operations and maintenance costs.
Additional information can be found in the Statement of Authorities, Vote 1 and Vote 5 sections above.
Graphs 4 and 5 illustrate actual gross expenditures for the quarter-end.
(in thousands of dollars)
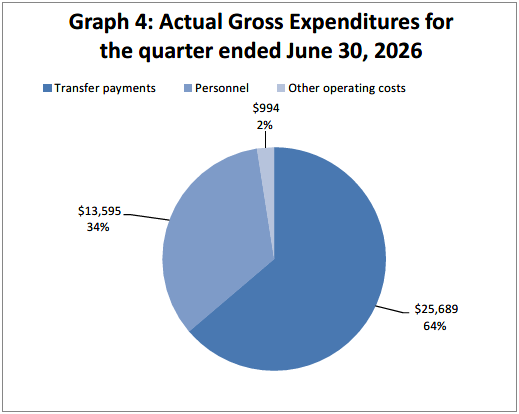
Text version: Actual gross expenditures quarter ended June 30, 2026 (in thousands of dollars)
This pie chart breaks down actual expenditures for quarter ended June 30, 2026.
- $25,689 represents actual spending on Transfer Payments, which accounts for 64% of Actual expenditures quarter ended June 30, 2026
- $13,595 represents actual spending on Personnel, which accounts for 34% of Actual expenditures quarter ended June 30, 2026
- $994 represents actual spending on Other operating costs, which accounts for 2% of Actual Expenditures quarter ended June 30, 2026
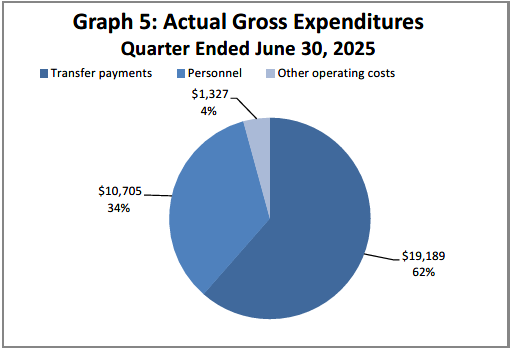
Text version: Actual gross expenditures quarter ended June 30, 2025 (in thousands of dollars)
This pie chart breaks down actual expenditures for quarter ended June 30, 2025.
- $19,189 represents actual spending on Transfer Payments, which accounts for 62% of Actual Expenditures quarter ended June 30, 2025
- $10,705 represents actual spending on Personnel, which accounts for 34% of Actual Expenditures quarter ended June 30, 2025
- $1,327 represents actual spending on Other operating costs, which accounts for 4% of Actual Expenditures quarter ended June 30, 2025
Risks and uncertainties
PrairiesCan allocates departmental funding and resources within a well-defined framework of accountabilities, policies, and procedures. This includes a system of budgets, reporting, and internal controls to manage within available resources and Parliamentary authorities.
PrairiesCan assesses risk in all areas of departmental decision making. This includes discussion of the likelihood and potential impact of possible risks. Executive governance committees provide departmental risk oversight for most decisions. The department provides bi-annual risk input to the Treasury Board of Canada Secretariat (TBS) Office of the Comptroller General to inform the Regional Development Agency (RDA) Risk-Based Internal Audit Plan. PrairiesCan also participates in the new TBS Risk and Compliance Process (RCP), which assesses compliance, performance, and risk in 11 key areas of administration.
The department continues to identify and mitigate enterprise-wide risks in areas such as loan repayment, funding programs, employee physical and mental health, security, and cyber vulnerabilities.
To minimize risk, PrairiesCan employs risk-based mitigation such as:
- business continuity planning;
- occupational health and safety planning;
- people management strategies;
- Public Service Employee Survey (PSES) results and recommendations;
- a robust system of network controls including encrypted signature, electronic security protocols, and mobile equipment to employ remote connectivity; and
- when implementing and assessing funding programs and projects, the department uses risk assessments, governance processes, process mapping, and separation of duties.
PrairiesCan will continue to apply risk management practices and principles at all levels of the organization to support strategic priority setting, resource allocation, informed decisions, and improved results.
Significant changes in relation to operations, personnel and programs
There are no significant changes in relation to operations, personnel and programs for this reporting period.
Approval by senior officials
Approved by:
Original signed by:
________________________
Diane Gray
President
Edmonton, Canada
Date: August 17, 2026
Original signed by:
________________________
Sundeep Cheema
Chief Financial Officer
Statement of authorities (unaudited)
| Authorities | Total available for use for the year ending March 31, 2027* | Used during the quarter ended June 30, 2026 | Year-to-date used at quarter-end |
|---|---|---|---|
| Vote 1 – Net operating expenditures | $47,825 | $12,996 | $12,996 |
| Vote 5 – Grants and contributions | 303,573 | 25,689 | 25,689 |
| Budgetary statutory authorities: | |||
| Employee benefit plans | 6,422 | 1,593 | 1,593 |
| Total authorities | $357,820 | $40,278 | $40,278 |
| Authorities | Total available for use for the year ending March 31, 2026* | Used during the quarter ended June 30, 2025 | Year-to-date used at quarter-end |
|---|---|---|---|
| Vote 1 – Net operating expenditures | $42,526 | $10,760 | $10,760 |
| Vote 5 – Grants and contributions | 230,921 | 19,189 | 19,189 |
| Budgetary statutory authorities: | |||
| Employee benefit plans | 5,089 | 1,272 | 1,272 |
| Total authorities | $278,536 | $31,221 | $31,221 |
| *Includes only Authorities available for use and granted by Parliament at quarter-end. | |||
Departmental budgetary expenditures by standard object (unaudited)
| Expenditures | Planned expenditures for the year ending March 31, 2027* | Expended during the quarter ended June 30, 2026 | Year-to-date used at quarter-end |
|---|---|---|---|
| Personnel | $45,460 | $13,595 | $13,595 |
| Transportation and communications | 909 | 196 | 196 |
| Information | 1,401 | 80 | 80 |
| Professional and special services | 5,517 | 271 | 271 |
| Rentals | 1,609 | 389 | 389 |
| Repair and maintenance | 420 | 0 | 0 |
| Utilities, materials and supplies | 211 | 8 | 8 |
Acquisition of machinery and equipment |
1,320 | 24 | 24 |
| Transfer payments | 303,573 | 25,689 | 25,689 |
| Other subsidies and payments | 0 | 26 | 26 |
| Total gross budgetary expenditures | $360,420 | $40,278 | $40,278 |
| Less revenues netted against expenditures: | |||
| Vote netted revenue | (2,600) | 0 | 0 |
| Total net budgetary expenditures | $357,820 | $40,278 | $40,278 |
| Expenditures | Planned expenditures for the year ending March 31, 2026* | Expended during the quarter ended June 30, 2025 | Year-to-date used at quarter-end |
|---|---|---|---|
| Personnel | $38,347 | $10,705 | $10,705 |
| Transportation and communications | 905 | 178 | 178 |
| Information | 1,322 | 21 | 21 |
| Professional and special services | 5,594 | 750 | 750 |
| Rentals | 1,643 | 211 | 211 |
| Repair and maintenance | 702 | 0 | 0 |
| Utilities, materials and supplies | 162 | 7 | 7 |
Acquisition of machinery and equipment |
1,540 | 3 | 3 |
| Transfer payments | 230,921 | 19,189 | 19,189 |
| Other subsidies and payments | 0 | 157 | 157 |
| Total gross budgetary expenditures | $ 281,136 | $31,221 | $31,221 |
| Less revenues netted against expenditures: | |||
| Vote netted revenue | (2,600) | 0 | 0 |
| Total net budgetary expenditures | $278,536 | $31,221 | $31,221 |
| *Includes only Authorities available for use and granted by Parliament at quarter-end. | |||