
HIV and AIDS in Canada: Surveillance Report to December 31st, 2013
Disclaimer: The HTML version of this form is a representation of the content only. Please download the PDF version of this document. The PDF version of this document is available for downloading or viewing at the following link:
HIV and AIDS in Canada: Surveillance Report to December 31 (PDF document - 3 MB - 106 pages)
Introduction
HIV and AIDS in Canada: Surveillance Report to December 31, 2013 presents an overview of the status of HIV and AIDS in Canada based on case reports of HIV and AIDS submitted to the Public Health Agency of Canada (PHAC) by all provinces and territories. This report also presents data received from Citizenship and Immigration Canada (CIC) and from the Canadian Perinatal HIV Surveillance Program (CPHSP). The annual publication of this surveillance report is part of PHAC's mandate to collect, analyze, and report on surveillance data at the national level. This report describes the epidemiology of HIV and AIDS in Canada by identifying trends by geographic location, sex, age group, exposure category, and race/ethnicity. It replaces all previously published reports in this series because it reflects the most recent data. Further analysis of the HIV and AIDS surveillance data is available in the HIV/AIDS Epi Updates series.Footnote 1
Surveillance data are critical for understanding the ways in which HIV and AIDS affect a given population. However, the data tend to understate the magnitude of the HIV epidemic. Surveillance data do not represent the total number of people infected with HIV (prevalence) or the number of people newly infected each year (incidence). Surveillance data can tell us only about people who have been diagnosed with HIV or AIDS. Furthermore, because HIV is a chronic infection with a long latency period, many individuals who are newly infected in a given year may not receive a diagnosis until much later. As well, surveillance data are subject to delays in reporting, to under-reporting, and to changing patterns in HIV testing behaviours.
Since surveillance data describe only the diagnosed portion of the epidemic, statistical modelling and additional sources of information are used to produce estimates that describe the overall HIV epidemic in Canada, including people with diagnosed and undiagnosed HIV infection. Estimates allow for an improved analysis of the epidemic and guide the work undertaken by PHAC and other federal departments under the Federal Initiative to Address HIV/AIDS in Canada. In 2012, PHAC published estimates of incidence and prevalence to the end of 2011, which showed that approximately 71,300 (range: 58,600 to 84,000) people were living with HIV (including AIDS), 25% of whom were unaware of their infection (because of a lack of testing or diagnosis).Footnote 2 The estimated number of new HIV infections in 2011 was 3,175 (range: 2,250 to 4,100).
Note to reader
This report differs in several ways from the reports previously published. First, the report now includes descriptive information about the sources of data to give readers more insight into the context and interpretation of the findings. Also, the report now uses the term "HIV cases" instead of "positive HIV test reports" in order to enhance comprehensibility of the report. "HIV cases" is an internationally accepted public health surveillance term, and reflects that most of the provinces and territories monitor their epidemics using case-based HIV/AIDS surveillance systems.
Additionally, changes to several provincial and territorial surveillance systems affect the interpretation of the national data set:
- Ontario: HIV cases reported for the period 2007 to 2012 increased by 2.4% as a result of a data quality review of the data sources and small revisions to the exposure category hierarchy. The number of reported HIV cases decreased from what was previously reported between 2007 and 2009 (range: -0.1 to -0.3%), and the number of reported HIV cases increased between 2010 and 2012 (range: 3.2 to 7.6%).
- British Columbia: The cumulative number of reported AIDS cases increased by 4.2% as a result of retrospective identification of new AIDS cases from 1989 to 2013, with the majority identified after 2005. From 2005 to 2013, the average increase in the number of newly identified AIDS cases was 15 per year (range: 8 to 26 cases).
- Alberta: Starting in 2010, the surveillance database in Alberta has included a new exposure category called "Citizenship and Immigration Canada/Out of Country (CIC/OOC)" which represents people who acquired HIV infection outside of Canada. The first year that the data received from Alberta included the CIC/OOC exposure category was 2013, and this exposure classification was retrospectively applied to cases diagnosed from 2010 to present. For cases diagnosed outside of Canada before 2010, the original exposure category reported did not change. Within the national data set, the CIC/OOC category is captured in the "Other" exposure category.
Lastly, this report contains new tables that present data about HIV cases identified as Aboriginal. For the first time, tables showing disaggregation by First Nations, Métis, and Inuit are presented in tables relating to reported HIV cases and race/ethnicity. Not all provinces collect or report disaggregated ethnicity/race information for cases identified as Aboriginal. Therefore cases without such detail are included in the "Aboriginal, unspecified" category.
Methodology
Data collection
This report presents data from four different sources relating to HIV and AIDS:
- the National HIV/AIDS Surveillance System
- immigration medical screening for HIV
- the Canadian Perinatal HIV Surveillance Program
- the Canadian Mortality Database
An understanding of each data source and its related strengths and weaknesses is integral to the appropriate interpretation of the data in this report.
National HIV/AIDS Surveillance System
The National HIV/AIDS Surveillance System is a passive case-based surveillance system that collates data submitted to PHAC voluntarily from all provincial and territorial public health authorities. The provinces and territories provide the data using the national case reporting form (Appendix 6) or using an electronic dataset transmission.
The data for HIV and AIDS are maintained in two unlinked databases. The HIV surveillance database consists of non-nominal data on people diagnosed with HIV infection including, but not limited to, age, sex, race/ethnicity, country of birth, and risks associated with the transmission of HIV (exposure categories). Cases reported to PHAC must meet the national case definitionFootnote 3 which requires laboratory evidence of HIV infection through a confirmed, repeatedly reactive screening test for HIV antibody in a person over 15 months of age or for cases with history of non-maternal-fetal HIV transmission. The AIDS surveillance database captures non-nominal data on people diagnosed with AIDS (as per the national case definitionFootnote 4) and includes, in addition to the information included in the HIV surveillance database, the disease indicative of AIDS and vital status for the AIDS case (i.e. death).
Different HIV and AIDS reporting requirements and practices exist across the country.Footnote 5 Reporting of HIV diagnoses for individuals younger than two years of age varies between provinces and territories. For example, Quebec and Newfoundland and Labrador exclude positive serology results for HIV cases younger than two years of age. In most of the remaining provinces and territories, where HIV infection in children younger than 18 months of age is confirmed using other testing modalities, HIV cases younger than two years of age are included within the surveillance data.
The completeness of epidemiologic information collected and submitted to PHAC varies by jurisdiction. In particular, exposure category and race/ethnicity information is incomplete for many case reports. Most significantly, Quebec does not submit exposure category or race/ethnicity information for HIV cases to PHAC. However, Quebec does publish provincial reports that include information on exposure category and race/ethnicity. For Ontario, completeness of exposure category and race/ethnicity data for HIV cases has changed over time. Completeness increased significantly for data from 2009 onwards due to the inclusion of supplementary data collected through the Laboratory Enhancement Program. Manitoba does not provide disaggregated data on Aboriginal populations.
With respect to AIDS reporting, the following changes that affect the completeness of AIDS surveillance data have occurred over time:
- Ontario: Due to changes in the reporting of AIDS cases, exposure category, race/ethnicity data, and mortality data are not available after 2004.
- Quebec: AIDS data (including mortality data) have not been available since June 30, 2003.
- Newfoundland and Labrador: AIDS is no longer a reportable disease as of 2009.
- Prince Edward Island: AIDS is no longer a reportable disease as of 2012.
Differences between the data published in this report and the data published in provincial and territorial surveillance reports may be due to reporting delays or differences in the date the data were extracted from the provincial and territorial surveillance databases for the national, provincial, and territorial reports. Where such differences are noted, it is recommended that data from the provincial and territorial reports be used. Appendix 5 contains the list of provincial and territorial data source programs.
The data presented in this surveillance report represents HIV and AIDS cases diagnosed on or before December 31, 2013 and submitted by provincial and territorial surveillance programs to PHAC between March 15 and June 25, 2014, and were extracted from the national surveillance database on June 26, 2014. Standardized data recoding procedures were applied to all submitted provincial and territorial datasets to create a national dataset for analysis.
Immigration medical screening for HIV
CIC collects data relating to HIV during the immigration process. All foreign nationals applying for permanent residence and some applying for temporary residence must undergo an Immigration Medical Examination (IME), either in Canada or overseas. On January 15, 2002, CIC added mandatory routine HIV screening to the IME for all applicants 15 years of age and older, as well as for applicants under the age of 15 who have certain risk factors.Footnote 6 CIC provides PHAC with non-nominal data (on immigrants diagnosed with HIV) collected during the IME process, including demographic information (e.g. sex, age, place of birth), as well as the year tested (for those tested in Canada) or the year the applicant landed in Canada (for those tested overseas).
In this surveillance report, data relating to HIV and immigration were obtained from three sources:
- Data relating to all applicants screened in Canada or overseas who tested positive for HIV, including those who tested positive but did not land in Canada, were extracted from the CIC's database on HIV in June 2013.
- Data relating to the HIV cases screened in Canada were extracted from the CIC HIV database in March 2013.
- Data relating to HIV cases screened overseas and those who landed in Canada were extracted from CIC Health Branch Post-Arrival Health Public Health Liaison Unit Provincial Notifications – Overseas Notifications database on January 9, 2013.
Canadian Perinatal HIV Surveillance Program
National data on the HIV status of infants exposed perinatally to HIV infection are collected through the CPHSP, an initiative of the Canadian Pediatric AIDS Research Group (CPARG). Support for the program is provided by the Canadian HIV Trials Network and the Surveillance and Epidemiology Division within PHAC.
The CPHSP is a sentinel-based surveillance system that collects data on all identified infants and children in Canada born to mothers who are known to be infected with HIV.Footnote 7 The program includes infants identified as exposed to HIV during pregnancy, older infants and children not identified in the perinatal period, and those born outside Canada and receiving care for HIV infection. Data were obtained through a national, non-nominal, confidential survey of infants known to participating pediatricians in tertiary care centres and specialists in HIV clinics across Canada. The HIV status of infants is reported as "confirmed infected," "confirmed not infected," or "infection status not confirmed," according to the United States Centers for Disease Control and Prevention's surveillance case definitions for HIV infection.Footnote 8 Tests for HIV DNA or RNA (polymerase chain reaction) are used to confirm infection status by four months of age. Infants are classified as "not confirmed" if they have not yet received the required number of tests to determine their HIV status. The current status of confirmed infected infants is defined as "asymptomatic," "symptomatic," "died of AIDS," "died of a cause other than AIDS," or "lost to follow-up".
The data presented in this surveillance report were extracted from the CPHSP's database in March 2014 and provided to PHAC.
Statistics Canada's Canadian Mortality Database
Under a federal/provincial/territorial agreement, all deaths, regardless of cause, must be registered with the provincial and territorial registrars of the offices of vital statistics.Footnote 9 The central registry in each province and territory provides data from death registration forms to the Health Statistics Division of Statistics Canada, which maintains the Canadian Mortality Database, a cumulative record of death statistics. Information on cause of death is coded using the International Classification of Diseases (ICD).
The 9th revision (ICD-9) is used for deaths that occurred between 1979 and 1999; codes 042-044 include deaths attributed to HIV infection. The 10th revision (ICD-10) is used for deaths that occurred from 2000 onward; codes B20-B24 include deaths attributed to HIV infection. Data are not comparable between the two coding systems because of changes in coding definitions.
From 1987 to 1999, data on mortality due to HIV infection were obtained using the Data Extraction and Analysis (DEXA) system (extracted in August 2014). DEXA is a web-enabled SAS-based application that facilitates access to centralized data holdings in PHAC, which include vital statistics from Statistics Canada. Data from 2000 to 2011 were obtained from the Canadian Mortality Database, Health Statistics Division, Statistics Canada (extracted in August 2014).
Tabulation and presentation of data
The key findings are summarised in the At a glance section of this report. In addition, the following series of detailed data tables are presented in Sections I to VI:
Section I: HIV in Canada: Reported HIV cases to December 31, 2013
Section II: Immigration medical screening for HIV
Section III: Report of the Canadian Perinatal HIV Surveillance Program: 1984-2013
Section IV: AIDS in Canada: Reported AIDS cases to December 31, 2013
Section V: Mortality due to HIV/AIDS in Canada
Section VI: International Statistics on HIV and AIDS
No statistical procedures were used for comparative analyses in this report. Nor were any statistical techniques applied to account for missing data. Data in tables with small cell sizes (n ≤ 5) were reviewed for possible issues regarding data quality and case identification. Strategies such as data suppression or collapsing data categories were used if deemed necessary by national analysts or by provincial or territorial data providers.
This report also includes the following appendices:
Appendix 1: Exposure category hierarchy
Appendix 2: Data limitations
Appendix 3: Terminology
Appendix 4: List of HIV-endemic countries
Appendix 5: Data contributors
Appendix 6: HIV/AIDS case report form
Results: At a glance
HIV surveillance
Time trends
(See Table 1)
A cumulative total of 78,511 HIV cases have been reported to PHAC since HIV reporting began in Canada in 1985. In 2013, 2,090 HIV cases were reported, which represents a 0.4% decrease from the 2,099 cases reported in 2012 and is the lowest number of annual HIV cases since reporting began in 1985.
Figure 1 illustrates the annual trends for reported HIV cases from 1996 until 2013. A steady decrease of reported HIV cases was observed up until the year 2000. From 2002 to 2008, the annual number of HIV cases remained stable, fluctuating between 2,439 and 2,620. As of 2008, the number of reported HIV cases has gradually declined.
Figure 1: Number of reported HIV cases by year of diagnosis – Canada, 1996-2013

Text Equivalent - Figure 1
| Year of diagnosis | 1996 | 1997 | 1998 | 1999 | 2000 | 2001 | 2002 | 2003 | 2004 | 2005 | 2006 | 2007 | 2008 | 2009 | 2010 | 2011 | 2012 | 2013 |
|---|---|---|---|---|---|---|---|---|---|---|---|---|---|---|---|---|---|---|
| Number of reported HIV cases | 2,729 | 2,460 | 2,290 | 2,184 | 2,092 | 2,216 | 2,460 | 2,468 | 2,520 | 2,478 | 2,537 | 2,439 | 2,620 | 2,392 | 2,364 | 2,307 | 2,099 | 2,090 |
This graph shows the number of reported HIV cases by year of diagnosis in Canada, for the period 1996 to 2013.
Age and sex
(See Tables 2-4C)
In 2013, sex was reported in 96.6% of the reported HIV cases, of which 21.9% were female. Over the past decade, the proportion of reported HIV cases that were females has remained stable at approximately one-quarter (range: 21.9% - 27.8%). The age distribution differed between females and males, with HIV diagnosis generally being made at a younger age (< 15, 15-19, and 20-29 years old) among females compared to males, where a greater proportion of HIV cases were diagnosed at an older age (30-39, 40-49, and 50+ years old) (Figure 2).
Figure 2: Age group distribution of reported HIV cases by sex – Canada, 1985-2013
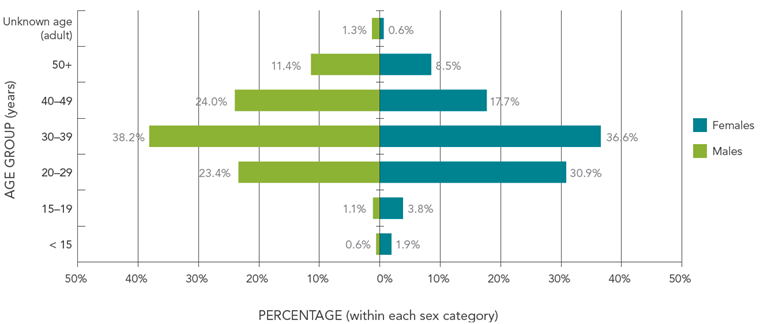
Text Equivalent - Figure 2
| Sex | ||
|---|---|---|
| Age Group | Males | Females |
| ≤15 | 0.6% | 1.9% |
| 15-19 | 1.1% | 3.8% |
| 20-29 | 23.4% | 30.9% |
| 30-39 | 38.2% | 36.6% |
| 40-49 | 24.0% | 17.7% |
| 50+ | 11.4% | 8.5% |
| Unknown age (adult) | 1.3% | 0.6% |
This figure shows the age group distribution of reported HIV cases by sex in Canada, for the period 1985 to 2013.
Exposure category
(See Tables 5A-5E)
Trends in exposure category have shifted since HIV reporting began in 1985. In the early stages of the epidemic, more than 80% of all reported HIV cases with known exposure category were attributed to the "men who have sex with men" (MSM) exposure category. Although this exposure category is still the predominant one in Canada, the proportion has decreased over the years.
In 2013, where exposure category was known (66.0%), 49.3% of all reported HIV cases in adults (≥ 15 years old) were attributed to the MSM exposure category (Figure 3). The second-most reported exposure category among adults was heterosexual contact (29.6%), which includes reported HIV cases attributed to heterosexual contact among people born in a country where HIV is endemic (Het-Endemic, 9.6%), heterosexual contact with a person at risk (Het-Risk, 10.4%), and heterosexual contact with someone with no identified risk (NIR-Het, 9.6%). The third-most frequently reported exposure category among adults in 2013 was injection drug use (IDU) exposure, accounting for 12.8% of reported HIV cases.
Figure 3: Proportion of HIV cases among adults (≥ 15 years old) by exposure category – Canada, 2013

Text Equivalent - Figure 3
| Exposure Category | Percentage |
|---|---|
| MSM | 49.3% |
| MSM/IDU | 2.7% |
| IDU | 12.8% |
| Blood/Blood products | 0.4% |
| Het-Endemic | 9.6% |
| Het-risk | 10.4% |
| NIR-Het | 9.6% |
| Other | 5.2% |
This graph shows the proportion of HIV cases among adults (greater than or equal to 15 years of age) by exposure category in Canada in 2013.
Exposure category and sex
(See Tables 5A-5E)
There are differences in exposure category distributions between adult males and females (≥ 15 years old). MSM exposure accounts for the greatest proportion (62.7%) of reported HIV cases among adult males, whereas heterosexual contact accounts for the greatest proportion (66.2%) of HIV cases among adult females (Figure 4, Figure 5). The largest difference between males and females was observed for the Het-Endemic exposure category, which accounted for 42.7% of heterosexual contact cases among females compared to 22.9% among males. IDU exposure accounted for approximately one-fifth of adult female HIV cases (20.7%), whereas IDU exposure accounted for a possible 14.1% of adult male HIV cases (i.e. 10.6% via IDU exposure plus a possible 3.5% in the MSM/IDU category).
Figure 4: Proportion of HIV cases among adult males (≥ 15 years old) by exposure category – Canada, 2013
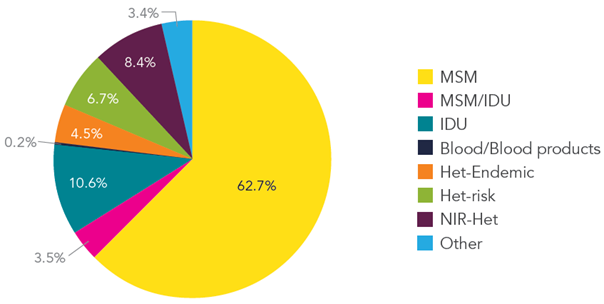
Text Equivalent - Figure 4
| Exposure Category | Percentage |
|---|---|
| MSM | 62.7% |
| MSM/IDU | 3.5% |
| IDU | 10.6% |
| Blood/blood products | 0.2% |
| Het-Endemic | 4.5% |
| Het-Risk | 6.7% |
| NIR-Het | 8.4% |
| Other | 3.4% |
| Total | 100% |
This graph shows the proportion of HIV cases among adult (greater than or equal to 15 years of age) males by exposure category in Canada in 2013.
Figure 5: Proportion of HIV cases among adult females (≥ 15 years old) by exposure category – Canada, 2013

Text Equivalent - Figure 5
| Exposure Category | Percentage |
|---|---|
| IDU | 20.7% |
| Blood/blood products | 1.0% |
| Het-Endemic | 28.3% |
| Het-Risk | 23.8% |
| NIR-Het | 14.1% |
| Other | 12.1% |
| Total | 100% |
This graph shows the proportion of HIV cases among adult (greater or equal to 15 years of age) females by exposure category in Canada in 2013.
Race/ethnicity distribution
(See Table 6A-6C)
In 2013, race/ethnicity information was available for nearly two-thirds (59.9%) of the reported HIV cases. While this is an improvement from the years before 2009, the national trends presented in this report must be interpreted with caution given that a significant number of HIV cases are not included in the race/ethnicity analysis. These data may not be fully representative of Canada because race/ethnicity data for HIV cases from jurisdictions with more diverse populations are not included.
In 2013, the majority of reported HIV cases were identified as White (49.4%), followed by Black (17.3%), and Aboriginal (15.9%) (Figure 6). The race/ethnicity distribution varied between sexes: among males, the greatest proportion of the cases were White (57.2%), followed by Aboriginal (11.5%), and Black (11.1%) (Figure 7). By comparison, among females, just over one-third were Black (39.3%), followed by Aboriginal (32.0%), and White (21.3%).
Figure 6: Proportion of reported HIV cases (all ages) by race/ethnicity – Canada, 2009-2013

Text Equivalent - Figure 6
| Race/ethnicity | 2009 | 2010 | 2011 | 2012 | 2013 |
|---|---|---|---|---|---|
| South Asian/West Asian/Asian/Latin American/Other | 14.9% | 13.2% | 15.6% | 15.3% | 17.4% |
| Aboriginal | 21.1% | 19.5% | 21.4% | 18.9% | 15.9% |
| Black | 16.7% | 15.6% | 18.5% | 22.3% | 17.3% |
| White | 47.3% | 51.7% | 44.4% | 43.5% | 49.4% |
This figure shows the proportion of reported HIV cases (all ages) by race/ethnicity in Canada, for the years 2009 to 2013.
Figure 7: Proportion of reported HIV cases (all ages) by sex and race/ethnicity – Canada, 2013
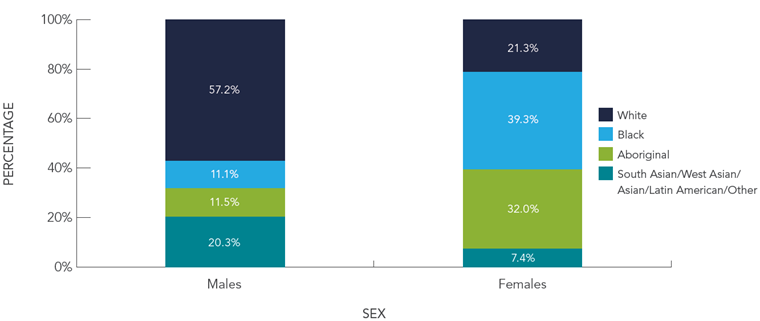
Text Equivalent - Figure 7
| Sex | ||
|---|---|---|
| Race/ethnicity | Males | Females |
| South Asian/West Asian/Asian/Latin American/Other | 20.3% | 7.4% |
| Aboriginal | 11.5% | 32.0% |
| Black | 11.1% | 39.3% |
| White | 57.2% | 21.3% |
This graph shows the proportion of reported HIV cases (all ages) by sex and race/ethnicity in Canada in 2013.
Race/ethnicity and exposure category
(See Table 6D)
Race/ethnicity and exposure categories information was available for 38.2% of reported cases from 1998 to 2013, therefore the national trends presented in this report must be interpreted with caution given that a significant number of HIV cases are not included in the analyses.
Among HIV cases attributed to the MSM exposure category, the majority (73.1%) were identified as White. Almost all HIV cases attributed to IDU exposure were either Aboriginal (50.1%) or White (46.4%). Among cases attributed to the Het-Endemic category 94.4% were identified Black (Figure 8). Looking at the breakdown of cases identified as Aboriginal, First Nations people represent 16.7% of reported HIV cases, whereas Métis people represented 1.8% and Inuit 0.1%.
Figure 8: Proportion of reported HIV cases (all ages) by exposure category and race/ethnicity – Canada, 1998-2013

Text Equivalent - Figure 8
| Exposure Category | |||||
|---|---|---|---|---|---|
| Race/ethniciy | MSM | MSM/IDU | IDU | Heterosexual Contact | Other |
| South Asian/West Asian/Asian/Latin American/Other | 18.4% | 5.6% | 2.3% | 10.8% | 13.5% |
| Aboriginal | 4.0% | 24.6% | 50.1% | 21.6% | 14.0% |
| Black | 4.5% | 2.4% | 1.2% | 33.6% | 48.4% |
| White | 73.1% | 67.3% | 46.4% | 34.0% | 24.2% |
This graph shows the proportion of reported HIV cases (all ages) by exposure category and race/ethnicity in Canada for the period 1998 to 2013.
Geographic distribution
(See Tables 7A-7E)
In 2013, as in previous years, Ontario accounted for the highest proportion and number of reported HIV cases (39.6%, n=827) in Canada, followed by Quebec (21.7%, n=453), British Columbia (13.0%, n=272), Alberta (12.5%, n=261), and Saskatchewan (6.1%, n=126).
HIV diagnosis rates highlight unique aspects of the HIV epidemic (Figure 9). The national all-ages diagnosis rate in Canada in 2013 was 5.9 per 100,000 population. However, provincial and territorial rates varied. For example, in all provinces except Saskatchewan, the adult HIV diagnosis rates for 2013 remained relatively similar to recent years. In Saskatchewan, the all-age HIV diagnosis rate reached a high of 19.3 per 100,000 population in 2009, with annual decreases thereafter to a rate of 11.4 per 100,000 population in 2013. The next highest provincial and territorial rates in 2013 were observed in Manitoba (9.2 per 100,000 population), Alberta (6.5 per 100,000 population), Ontario (6.1 per 100,000 population), and British Columbia (5.9 per 100,000 population). The remaining provinces and territories had HIV diagnosis rates that were lower than the national rate.
Figure 9: All-age HIV diagnosis rate (per 100,000 population) by province/territory – Canada, 2013

Text Equivalent - Figure 9
| Province/territory | Rate (per 100,000 population) |
|---|---|
| Yukon | 2.7 |
| Northwest Territories | 2.3 |
| Nunavut | 0.0 |
| British Columbia | 5.9 |
| Alberta | 6.5 |
| Saskatchewan | 11.4 |
| Manitoba | 9.2 |
| Ontario | 6.1 |
| Quebec | 5.6 |
| New Brunswick | 0.8 |
| Nova Scotia and Prince Edward Island | 1.7 |
| Newfoundland and Labrador | 1.3 |
| Canada | 5.9 |
This figure demonstrates the HIV diagnosis rate (all ages) per 100,000 population by province and territory in Canada in 2013.
Immigration medical screening for HIV
(See Table 8)
In 2012, 257,887 foreign nationals obtained permanent residence status and 1,091,876 foreign nationals obtained temporary residence status in Canada.Footnote 10,Footnote 11 From January 15, 2002 to December 31, 2012, 5,777 applicants screened in Canada or overseas tested positive for HIV.Footnote 12 In 2012, 534 applicants, of which 231 were screened in Canada and 303 were screened overseas, tested positive for HIV. However, not all applicants with HIV diagnoses were admissible for residency, nor did all applicants screened and diagnosed with HIV overseas land in Canada.
The following analysis focuses on applicants who underwent an IME in Canada from 2002 to 2011, and applicants who underwent an IME overseas and landed in Canada from 2005 to 2012.
Between January 15, 2002 and December 31, 2011, 3,004 applicants screened in Canada were diagnosed with HIV infection, with an average of 300 per year (ranging from 210 in 2011 to 373 in 2006).Footnote 13 These included applicants who were admissible for residency as well as those who were not. More than half of the HIV-positive applicants (56.7%) were male and the majority (42.5%) were either 30 to 39 years old and 20 to 29 years old (24.5%) (Figure 10). Ontario was the province of residence for the highest proportion of the HIV-positive applicants (54.4%), followed by Quebec (26.9%), British Columbia (8.4%), Alberta (5.8%), and Manitoba (2.8%), with less than 1% of the remaining HIV-positive applicants residing in the other provinces and territories. The three most frequently reported countries of birth were Zimbabwe (13.6%), Mexico (8.2%), and Haiti (6.4%). Among all HIV cases, 67.2% were born in HIV-endemic countries.
Between January 1, 2005 and December 31, 2012, 1,058 applicants screened overseas who landed in Canada were diagnosed with HIV infection, with an average of 132 per year (ranging from 84 in 2009 to 183 in 2008).Footnote 14 Just over half (52.4%) were females. The majority (41.9%) were 30 to 39 years old, followed by those 20 to 29 years old (26.6%) (Figure 10). Ontario was the most common intended province of residence (33.5%), followed by Quebec (24.4%), Alberta (15.1%), British Columbia (12.9%), Manitoba (9.1%), Saskatchewan (2.9%), and the Atlantic provinces (2.1%). Among HIV-positive applicants, 69.5% were born in HIV-endemic countries, with Ethiopia (19.6%), Democratic Republic of Congo (9.7%), and Burundi (5.6%) being the most frequently reported countries of birth.
Figure 10: Age group distribution of HIV-positive applicants tested overseas and applicants tested in Canada

Text Equivalent - Figure 10
| Age group | Tested in Canada | Tested Overseas |
|---|---|---|
| <15 | 0.5% | 5.2% |
| 15-19 | 1.5% | 4.3% |
| 20-29 | 24.5% | 26.6% |
| 30-39 | 42.5% | 41.9% |
| 40-49 | 23.7% | 18.4% |
| 50+ | 7.2% | 3.7% |
This graph shows the distribution of HIV-positive applicants who were tested in Canada and of applicants tested overseas.
Canadian Perinatal HIV Surveillance Program
(See Tables 9-13)
From 1984 to 2013, 4,025 infants in Canada were identified as being perinatally exposed to HIV. The number of HIV-exposed infants reported per birth year between 2005 and 2013 has fluctuated from a low of 196 in 2006 to a high of 248 in 2009. In 2013, 201 infants were reported as being perinatally exposed to HIV, down from 228 in 2012.
Although the number of infants perinatally exposed to HIV has increased over time, the proportion of infants born in Canada and confirmed to be HIV infected has decreased gradually from greater than 25% before the advent of antiretroviral treatment during pregnancy (AZT monotherapy after 1994, HAART after 1996) to less than 1% in 2013 (data not shown). Two HIV transmissions were confirmed in the 201 perinatally exposed infants born in 2013. Correspondingly, the proportion of HIV-positive mothers receiving antiretroviral therapy has increased over time and was at 95.5% in 2013.
A review of all perinatally exposed infants from 1984 to 2013 shows that the majority (74.1%) were born to mothers who acquired HIV infection through heterosexual contact, whereas just over one-fifth (23.2%) were attributed to IDU exposure. In terms of race/ethnicity distribution of the infants, almost half (49.5%) were reported as Black, one-quarter (25.2%) as White, and almost one-fifth (17.0 %) as Aboriginal. Maternal region of birth for the majority of infants was North America (43.0%), Africa (37.5%), and the Caribbean (10.6%).
AIDS surveillance
Number of cases
(See Table 14)
From 1979 to December 31, 2013, a cumulative total of 23,111 AIDS cases have been reported to PHAC. The annual number of reported AIDS cases in Canada has decreased steadily since the mid-1990s, largely as a result of the introduction of highly active antiretroviral therapy (HAART) in 1996. In more recent years, there has been a decrease in reporting because some provinces no longer report AIDS cases.
In 2013, 177 AIDS cases were reported to PHAC, representing a 12.8% decrease from 2012 and a 90.4% decrease since 1993, the year with the highest number of reported AIDS cases (1,837) (Figure 11).
Figure 11: Number of reported AIDS cases by year of diagnosis – Canada, 1979-2013

Text Equivalent - Figure 11
| Year | 1979 | 1980 | 1981 | 1982 | 1983 | 1984 | 1985 | 1986 | 1987 | 1988 | 1989 | 1990 |
|---|---|---|---|---|---|---|---|---|---|---|---|---|
| Number of reported AIDS cases | 2 | 3 | 10 | 26 | 64 | 162 | 403 | 690 | 1014 | 1179 | 1411 | 1473 |
| Year | 1991 | 1992 | 1993 | 1994 | 1995 | 1996 | 1997 | 1998 | 1999 | 2000 | 2001 | 2002 |
|---|---|---|---|---|---|---|---|---|---|---|---|---|
| Number of reported AIDS cases | 1533 | 1758 | 1837 | 1805 | 1675 | 1208 | 747 | 662 | 576 | 529 | 441 | 443 |
| Year | 2003 | 2004 | 2005 | 2006 | 2007 | 2008 | 2009 | 2010 | 2011 | 2012 | 2013 |
|---|---|---|---|---|---|---|---|---|---|---|---|
| Number of reported AIDS cases | 415 | 359 | 423 | 385 | 363 | 364 | 284 | 264 | 223 | 203 | 177 |
This graph shows the number of reported AIDS cases by year of diagnosis in Canada for the period 1979 to 2013.
Age and sex distribution
(See Tables 15-17C)
Data on age and sex were available for 98.8% of reported AIDS cases for 2013. In 2013, the majority (35.0%) of cases were 40 to 49 years old, followed by cases aged 50 years and older (33.3%), and cases 30 to 39 years old (20.3%).
In 2013, one pediatric AIDS case was reported. Among adults (≥ 15 years old), where sex was known, the majority of reported AIDS cases were males (76.8%). Similar to the HIV trends, the age distribution among females and males differs. Among females, a greater proportion of AIDS cases were observed in the younger age groups (< 15, 15-19 and 20-29 years old) compared to males (Figure 12), where a greater proportion of AIDS cases were observed in older age groups (30-39, 40-49, and 50+ years old).
Figure 12: Age group distribution of reported AIDS cases by sex - Canada, 1979-2013

Text Equivalent - Figure 12
| Age Group | ||||||
|---|---|---|---|---|---|---|
| Sex | <15 | 15-19 | 20-29 | 30-39 | 40-49 | ≥ 50 |
| Males | 0.6% | 0.3% | 14.2% | 42.2% | 29.4% | 13.3% |
| Females | 5.2% | 1.3% | 22.3% | 37.1% | 21.5% | 12.8% |
This figure shows the distribution of reported AIDS cases by sex in Canada for the period 1979 to 2013.
Exposure category
(See Tables 18A-18E)
In 2013, the majority (59.1%) of the reported AIDS cases were missing exposure category information, therefore no breakdown of the data are presented
Race/ethnicity
(See Table 19)
Similar to exposure categories, a smaller proportion of AIDS cases in 2013 (35.6%) had race/ethnicity information compared to 2012 (61.6%). As such, these data must be interpreted with caution. Where race/ethnicity information is available, 52.4% of AIDS cases identified as White, 20.6% as Aboriginal, and 14.3% as Black (Figure 13).
Figure 13: Proportion of reported AIDS cases (all ages) by race/ethnicity – Canada, 2009-2013
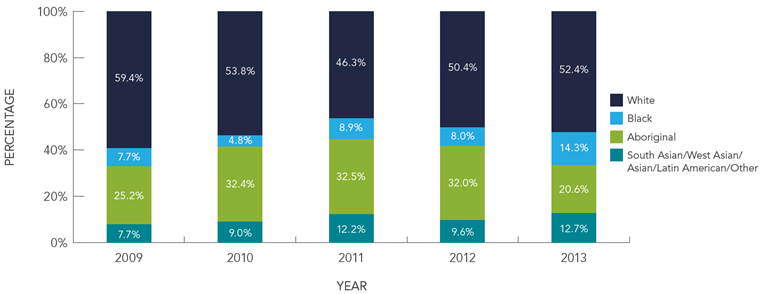
Text Equivalent - Figure 13
| Race/ethnicity | 2009 | 2010 | 2011 | 2012 | 2013 | Total |
|---|---|---|---|---|---|---|
| South Asian/West Asian/Asian/Latin American/Other | 7.7% | 9.0% | 12.2% | 9.6% | 12.7% | 9.8% |
| Aboriginal | 25.2% | 32.4% | 32.5% | 32.0% | 20.6% | 29.4% |
| Black | 7.7% | 4.8% | 8.9% | 8.0% | 14.3% | 8.0% |
| White | 59.4% | 53.8% | 46.3% | 50.4% | 52.4% | 52.8% |
This graph demonstrates the proportion of reported AIDS cases (all ages) by race/ethnicity in Canada from 2009 to 2013.
Geographic distribution
(See Table 20A-20E)
In 2013, the majority (56.5%) of AIDS cases reported were from Ontario, British Columbia (20.3%), and Alberta (18.1%).
AIDS mortality
(See Tables 21-29)
Since 1996, the Canadian Mortality Database shows that the numbers of annual deaths attributed to HIV infection are declining. The lowest recorded number of deaths attributed to HIV infection (303) was reported in 2011 (the most recent year data is available). This trend is also reflected in the mortality data captured in the national HIV/AIDS surveillance system. However, differences in the numbers between the two databases are due to under-reporting of AIDS deaths to PHAC via the national HIV/AIDS surveillance system.
Data limitations
Surveillance data have several limitations that should be considered in the interpretation of possible trends. Some limitations apply generally to surveillance data, for example, different reporting practices across jurisdictions, reporting delays, under-reporting, duplicate reports, missing or incomplete data, and limitations related to AIDS surveillance and associated mortality data. It is also important to consider the possible effect of individual or societal behaviour changes over time that contribute to changes in observed disease trends, for example, changes in HIV testing patterns (i.e. who comes forward for testing and when). Appendix 2 contains comprehensive descriptions of the data limitations.
Conclusion
The annual number of HIV cases reported to PHAC for the year 2013 was the lowest reported since HIV reporting began in 1985. At 5.9 per 100,000, the 2013 HIV diagnosis rate is the lowest reported to date. PHAC will continue to monitor HIV surveillance data to see whether this decreasing trend continues.
Overall, when the different risk exposure categories for HIV were examined, the MSM category was still the leading exposure category in Canada, followed by heterosexual contact, and IDU exposures. However, the pattern of risk exposure differed by province and territory as well as by race/ethnicity.
Rates of reported HIV cases in Saskatchewan continue to exceed the national average, but a decreasing trend has been observed since 2009. In contrast to declining national numbers attributed to IDU exposure, the majority of HIV cases in Saskatchewan have been identified as Aboriginal, and IDU exposure has been the most commonly identified exposure category. In response to this situation, Saskatchewan Health continues to implement its provincial strategy to reduce HIV transmission and to increase HIV care and treatment access for people infected with HIV.
At the national level, distinct differences were observed between the sexes in terms of age at the HIV diagnosis. HIV diagnosis tended to be made at a younger age among females compared to males. In addition, the proportion of HIV cases among older Canadians (50 years and older) has increased gradually since reporting began in 1985, and males outnumbered females in the older age groups.
Given the variations in HIV and AIDS case reports between provinces and territories, as well as variations in demographic profile (e.g. race/ethnicity, age, and sex), the data presented in this surveillance report highlight the need for population-specific interventions.