
Canada's progress towards eliminating viral hepatitis as a public health concern
Download in PDF format
(92 KB, 1 pages)
Organization: Public Health Agency of Canada
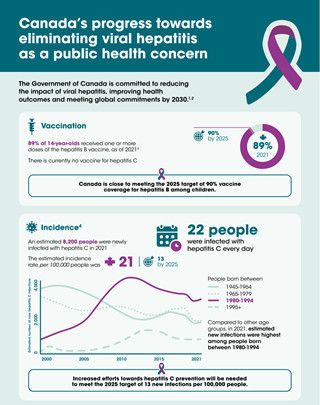
The Government of Canada is committed to reducing the impact of viral hepatitis, improving health outcomes and meeting global commitments by 2030.Footnote 1 Footnote 2
Vaccination
- 89% of 14-year-olds received one or more doses of the hepatitis B vaccine, as of 2021Footnote 3
- There is currently no vaccine for hepatitis C
- Canada is close to meeting the 2025 target of 90% vaccine coverage for hepatitis B among children.
IncidenceFootnote 4
- An estimated 8,200 people were newly infected with hepatitis C in 2021
- The estimated incidence rate per 100,000 people was 21
- 22 people were infected with hepatitis C every day
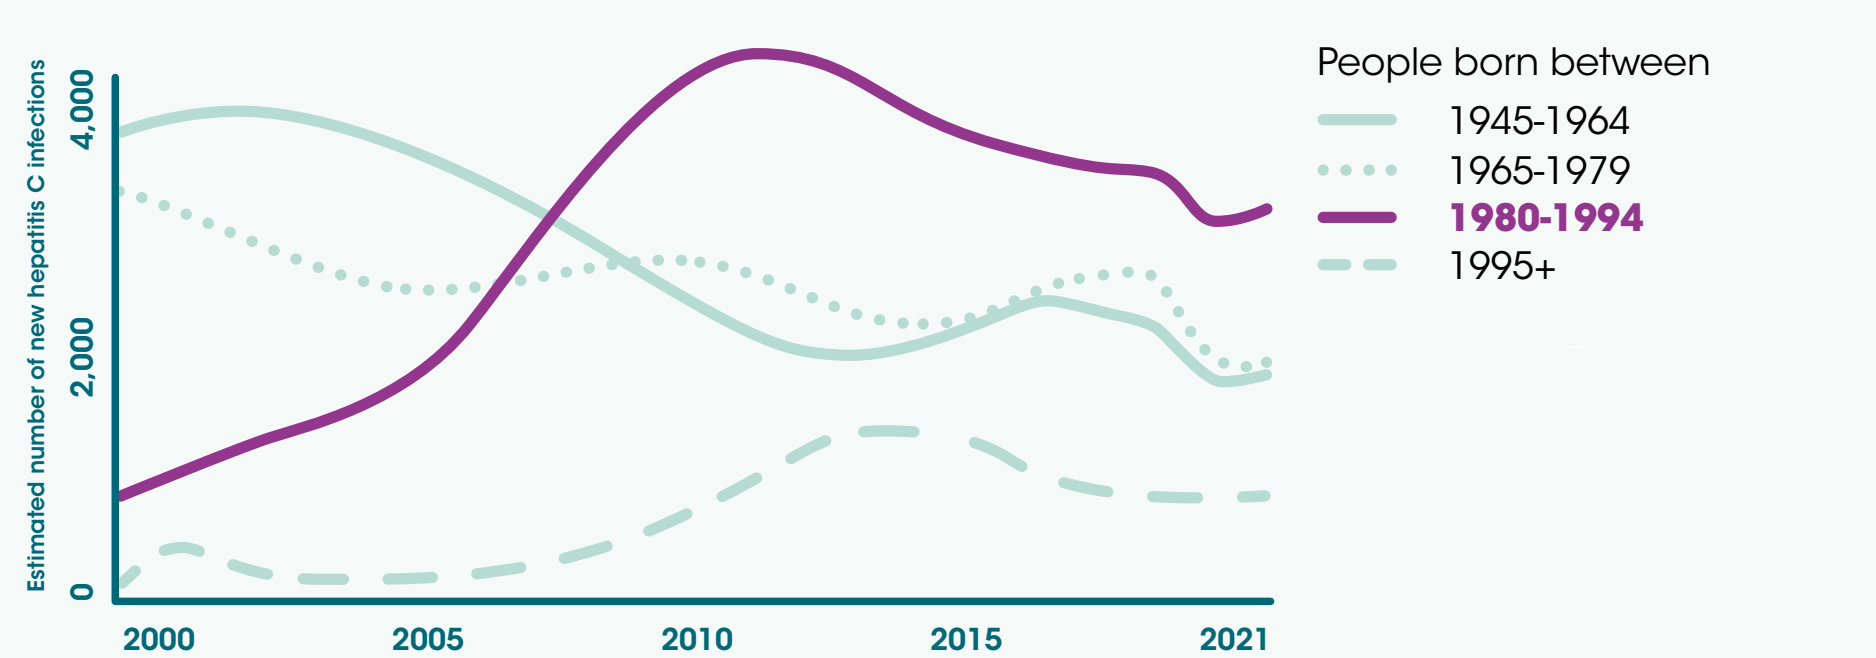
Figure 1 - Text description
Figure 1 is a graph showing the estimated number of new hepatitis C infections in Canada by year and by age group. The vertical axis shows the estimated number of new hepatitis C infections per year, the horizontal axis shows the calendar years, and the lines on the graph represent each age group.
| Year | 1920-1929 | 1930-1944 | 1945-1964 | 1965-1979 | 1980-1994 | 1995+ |
|---|---|---|---|---|---|---|
| 2000 | 0 | 0 | 3,731 | 3,364 | 1,337 | 0 |
| 2001 | 0 | 0 | 3,826 | 3,236 | 1,481 | 119 |
| 2002 | 0 | 0 | 3,857 | 3,072 | 1,628 | 72 |
| 2003 | 0 | 0 | 3,828 | 2,901 | 1,754 | 19 |
| 2004 | 0 | 0 | 3,746 | 2,766 | 1,865 | 16 |
| 2005 | 0 | 0 | 3,631 | 2,687 | 2,022 | 19 |
| 2006 | 0 | 0 | 3,491 | 2,672 | 2,289 | 155 |
| 2007 | 0 | 0 | 3,330 | 2,716 | 2,685 | 141 |
| 2008 | 0 | 0 | 3,142 | 2,795 | 3,156 | 147 |
| 2009 | 0 | 0 | 2,927 | 2,868 | 3,613 | 233 |
| 2010 | 0 | 0 | 2,704 | 2,895 | 3,977 | 376 |
| 2011 | 0 | 0 | 2,500 | 2,844 | 4,191 | 559 |
| 2012 | 0 | 0 | 2,352 | 2,730 | 4,240 | 753 |
| 2013 | 0 | 0 | 2,279 | 2,588 | 4,139 | 906 |
| 2014 | 0 | 0 | 2,290 | 2,480 | 3,951 | 970 |
| 2015 | 0 | 0 | 2,390 | 2,463 | 3,758 | 946 |
| 2016 | 0 | 0 | 2,544 | 2,553 | 3,621 | 862 |
| 2017 | 0 | 0 | 2,661 | 2,714 | 3,534 | 763 |
| 2018 | 0 | 0 | 2,582 | 2,782 | 3,447 | 694 |
| 2019 | 0 | 0 | 2,471 | 2,760 | 3,402 | 666 |
| 2020 | 0 | 0 | 2,136 | 2,212 | 3,104 | 633 |
| 2021 | 0 | 0 | 2,168 | 2,212 | 3,179 | 654 |
- Compared to other age groups, in 2021, estimated new infections were highest among people born between 1980-1994.
- Increased efforts towards hepatitis C prevention will be needed to meet the 2025 target of 13 new infections per 100,000 people.
Prevalence and Awareness
- At the end of 2021, an estimated:
- 214,000 people were living with chronic hepatitis CFootnote 5. Of these, 59% were diagnosed.
- 262,000 people were living with chronic hepatitis B. Of these, 58% were diagnosed.
- 2 in 5 people were unaware of their chronic infection and could benefit from testing and treatment.
- Canada is close to meeting the 2025 target of having 60% of people being aware of their infection with either hepatitis B or C.
TreatmentFootnote 4
- Between 2012 and 2021, an estimated 108,000 people living with chronic hepatitis C received treatmentFootnote 6
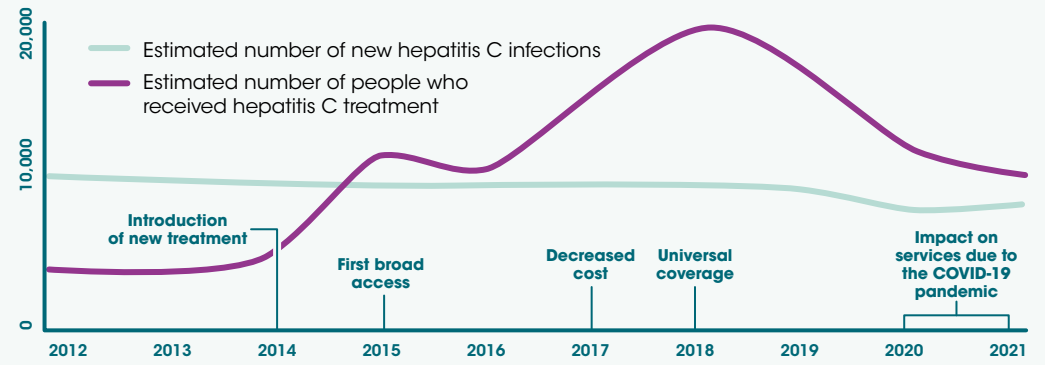
Figure 2 - Text description
Figure 2 is a graph showing both the estimated number of new hepatitis C infections and the estimated number of people who have received treatment in Canada by year.
The vertical axis shows the estimated number of new hepatitis C infections and people who were treated, and the horizontal axis shows the calendar years along with callouts on certain years identifying important historical landmarks of hepatitis C treatment in Canada.
| Year | Estimated number of new hepatitis C infections | Estimated number of people who received hepatitis C treatment | Hepatitis C treatment landmark |
|---|---|---|---|
| 2012 | 10,075 | 4,370 | N/A |
| 2013 | 9,912 | 4,221 | N/A |
| 2014 | 9,690 | 5,147 | Arrival of a new treatment |
| 2015 | 9,557 | 11,138 | Expanded access for the first time |
| 2016 | 9,580 | 10,496 | N/A |
| 2017 | 9,673 | 14,887 | Decrease in cost |
| 2018 | 9,506 | 19,155 | Universal coverage |
| 2019 | 9,298 | 16,619 | N/A |
| 2020 | 8,086 | 11,774 | Impact on services due to the COVID-19 pandemic |
| 2021 | 8,212 | 10,155 |
- Since the introduction of a treatment for hepatitis C that cures over 95% of people who take it, access to treatment has increased. Between 2015 and 2021, more people were treated and cured each year than there were new infections.
Mortality
- Hepatitis C was identified as a contributing cause of death for 972 people in 2021Footnote 7. This represents 3 deaths out of 100,000 people.
- Hepatitis B was identified as a contributing cause of death for 274 people in 2021Footnote 7. This represents 1 death out of 100,000 people.
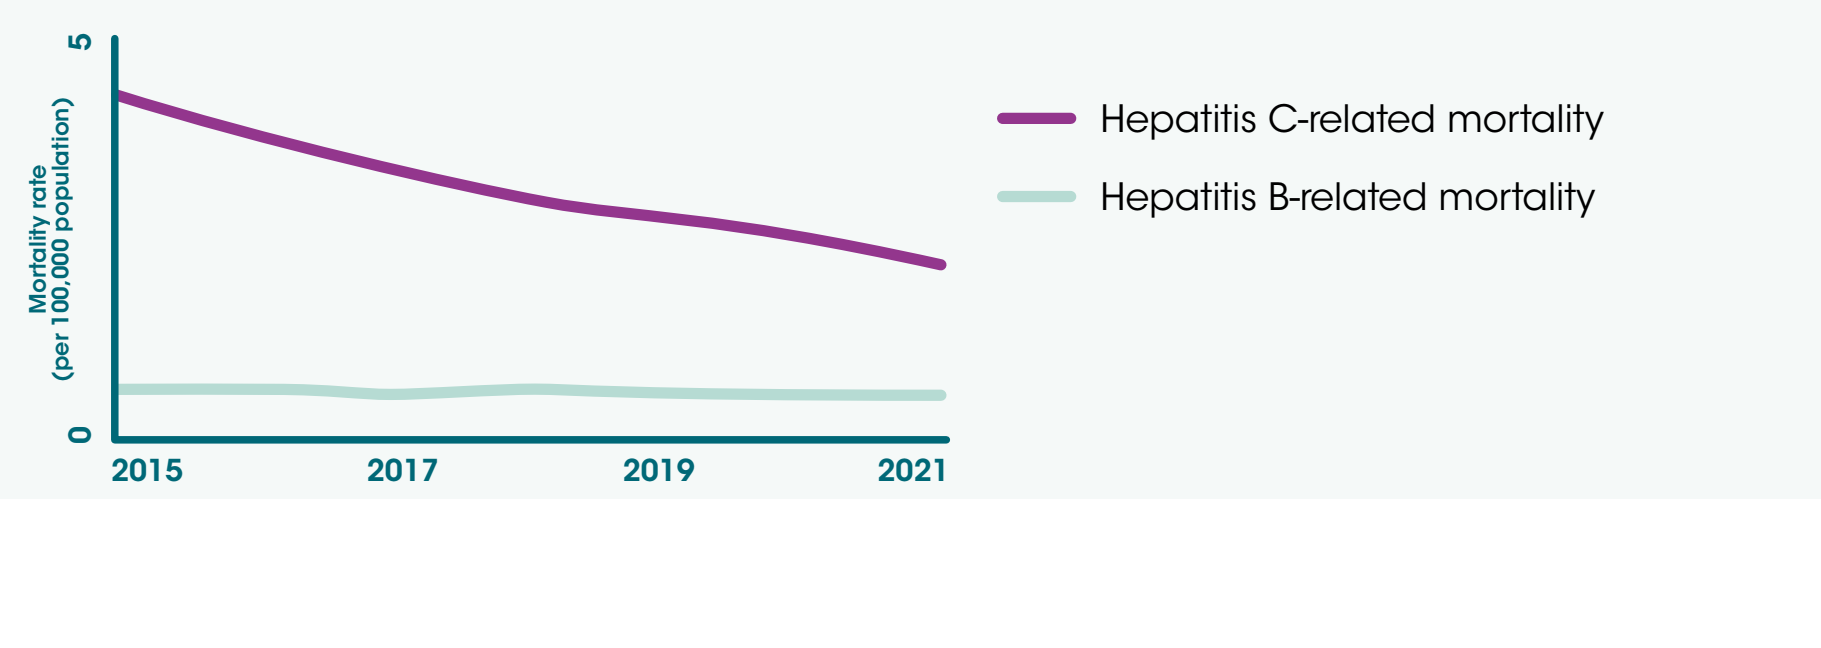
Figure 3 - Text description
Figure 3 is a graph showing the rates of hepatitis-related mortality in Canada by year.
The vertical axis shows the mortality rate per 100,000 people, the horizontal axis shows the calendar years, and the lines on the graph represent hepatitis B- and hepatitis C-related mortality, respectively.
| Year | Hepatitis B-related mortality (per 100,000 people) | Hepatitis C-related mortality (per 100,000 people) |
|---|---|---|
| 2015 | 0.8 | 4.3 |
| 2016 | 0.8 | 3.8 |
| 2017 | 0.7 | 3.5 |
| 2018 | 0.8 | 3.2 |
| 2019 | 0.7 | 3.1 |
| 2020 | 0.7 | 2.8 |
| 2021 | 0.7 | 2.5 |
- Between 2015 and 2021, deaths attributed to hepatitis B were stable; whereas deaths attributed to hepatitis C decreased.
- Canada has achieved the 2025 mortality targets for hepatitis B and C, 7 and 3 deaths or less per 100,000 people per year, respectively.
The COVID-19 pandemic resulted in a decreased demand for, and access to, prevention, diagnostic, treatment and care services for hepatitis B and C.
References & Footnotes
- Footnote 1
-
Government of Canada's sexually transmitted and blood-borne infections action plan 2024-2030
https://www.canada.ca/en/public-health/services/publications/diseases-conditions/sexually-transmitted-blood-borne-infections-action-plan-2024-2030.html - Footnote 2
-
Global health sector strategies on, respectively, HIV, viral hepatitis and sexually transmitted infections for the period 2022-2030
https://www.who.int/teams/global-hiv-hepatitis-and-stis-programmes/strategies/global-health-sector-strategies - Footnote 3
-
Childhood National Immunization Coverage Survey, 2021
https://www.canada.ca/en/public-health/services/immunization-vaccines/vaccination-coverage/2021-highlights-childhood-national-immunization-coverage-survey.html - Footnote 4
-
Additional data are needed to estimate the number of new infections and the number of people on treatment for hepatitis B
- Footnote 5
-
These estimates replace all previous estimates published by the Public Health Agency of Canada concerning Hepatitis C. Updated data were available, and improvements were incorporated into the methods. Revisions to the methodology mean that the 2021 estimates should not be compared directly with previously published estimates.
- Footnote 6
-
The number of people on treatment should not be used to estimate the proportion of people on treatment because people who may have passed away as of 2021 have not been removed. Data sources: 2012-2016 completed by the British Columbia Centre for Disease Control using data from IQVIA Solutions Canada; 2017-2021 from IQVIA Solutions Canada. The statements, findings, conclusions, views, and opinions expressed in this report are based in part on data obtained under license from IQVIA Solutions Canada Inc. concerning the following information service(s): CompuScript and GPM Custom Solutions. All Rights Reserved. The statements, findings, conclusions, views, and opinions expressed herein are not necessarily those of IQVIA Solutions Canada Inc. or any of its affiliated or subsidiary entities.
- Footnote 7
-
Statistics Canada, Canadian Vital Statistics – Death Database (2023/2024). Statistical Surveys and Related Services. Federal Research Data Centre (FRDC). Deaths where the primary cause or any of the next 19 causes of death listed as hepatitis B or as hepatitis C were included. Hepatitis B- and hepatitis C-related mortality may be higher than the direct measurement of cause of death within vital statistics.