
West Nile Virus and Other Mosquito-Borne Disease National Surveillance Report - July 19 to July 25, 2015 (Report Week 29)
Summary
West Nile Virus in Canada
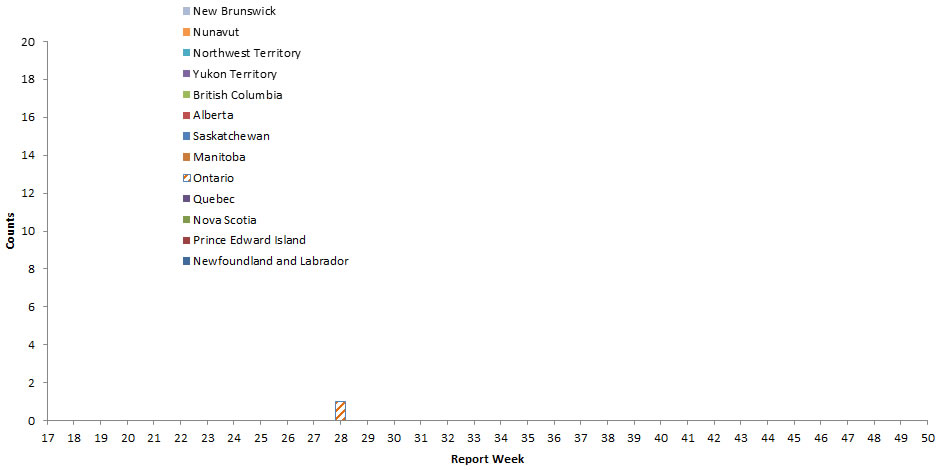
Humans: During surveillance week 29 (July 19 to July 25, 2015), no human cases of West Nile virus were reported to the Public Health Agency of Canada.
As of surveillance week 29, there is one human case reported in Ontario.
Mosquitoes: As of surveillance week 29, there are 3 mosquito pools tested positive for West Nile virus in Canada: Ontario (1), Manitoba (1) and Saskatchewan (1).
Dead Birds: During surveillance week 29 (July 19 to July 25, 2015), three dead birds have been tested positive.
As of surveillance week 29, the Canadian Wildlife Health Cooperative tested 6 dead bird positive for West Nile virus in Canada: Ontario (5) and Quebec (1).
Domestic Animals As of surveillance week 29, the Canadian Food Inspection Agency reported no horses that have tested positive for West Nile virus in Canada.
West Nile Virus Human Disease Cases in the United States
Alternative Formats
Related Topics
As of July 21, 2015, the Centers for Disease Control and Prevention (CDC) reported 23 human cases of West Nile virus:
Arizona (1), Colorado (1), Delaware (1), Kansas (2), Louisiana (2), Mississippi (1), Montana (1), Nebraska (1), New Mexico (1), Oklahoma (5), South Dakota (2), Texas (3), Washington (1) and Wyoming (1).
Of these, 9 (39.1%) were diagnosed as neuroinvasive disease cases, 14 (60.9%) as non-neuroinvasive disease cases. No fatal cases were reported. Fifteen (15) presumptive viremic blood donors have been identified.
West Nile Fever in the European Union, European Economic Area and Neighbouring Countries
During surveillance week 29, the European Centre for Disease Prevention and Control (ECDC) no human cases of West Nile fever were reported.
Since surveillance week 26 one human case of West Nile fever in Bulgaria was reported. As of July 23, 2015 two human cases in neighbouring countries were reported.
FIGURE 1: West Nile Virus clinical cases and asymptomatic infections, by Province/Territory and by report week, 2015 season
| Report week of 2015 | |||||||||||||||||||||||||||||||
|---|---|---|---|---|---|---|---|---|---|---|---|---|---|---|---|---|---|---|---|---|---|---|---|---|---|---|---|---|---|---|---|
| 17 | 18 | 19 | 20 | 21 | 22 | 23 | 24 | 25 | 26 | 27 | 28 | 29 | 30 | 31 | 32 | 33 | 34 | 35 | 36 | 37 | 38 | 39 | 40 | 41 | 42 | 43 | 44 | 45 | 46 | 47 | |
Table 1 Footnotes
|
|||||||||||||||||||||||||||||||
| Newfoundland and Labrador | 0 | 0 | 0 | 0 | 0 | 0 | 0 | 0 | 0 | 0 | 0 | 0 | 0 | ||||||||||||||||||
| Prince Edward Island | 0 | 0 | 0 | 0 | 0 | 0 | 0 | 0 | 0 | 0 | 0 | 0 | 0 | ||||||||||||||||||
| New Brunswick | 0 | 0 | 0 | 0 | 0 | 0 | 0 | 0 | 0 | 0 | 0 | 0 | 0 | ||||||||||||||||||
| Nova Scotia | 0 | 0 | 0 | 0 | 0 | 0 | 0 | 0 | 0 | 0 | 0 | 0 | 0 | ||||||||||||||||||
| Quebec | 0 | 0 | 0 | 0 | 0 | 0 | 0 | 0 | 0 | 0 | 0 | 0 | 0 | ||||||||||||||||||
| Ontario | 0 | 0 | 0 | 0 | 0 | 0 | 0 | 0 | 0 | 0 | 0 | 1Table 1 Footnote 1 | 0 | ||||||||||||||||||
| Manitoba | 0 | 0 | 0 | 0 | 0 | 0 | 0 | 0 | 0 | 0 | 0 | 0 | 0 | ||||||||||||||||||
| Saskatchewan | 0 | 0 | 0 | 0 | 0 | 0 | 0 | 0 | 0 | 0 | 0 | 0 | 0 | ||||||||||||||||||
| Alberta | 0 | 0 | 0 | 0 | 0 | 0 | 0 | 0 | 0 | 0 | 0 | 0 | 0 | ||||||||||||||||||
| British Columbia | 0 | 0 | 0 | 0 | 0 | 0 | 0 | 0 | 0 | 0 | 0 | 0 | 0 | ||||||||||||||||||
| Yukon Territory | 0 | 0 | 0 | 0 | 0 | 0 | 0 | 0 | 0 | 0 | 0 | 0 | 0 | ||||||||||||||||||
| Northwest Territory | 0 | 0 | 0 | 0 | 0 | 0 | 0 | 0 | 0 | 0 | 0 | 0 | 0 | ||||||||||||||||||
| Nunavut | 0 | 0 | 0 | 0 | 0 | 0 | 0 | 0 | 0 | 0 | 0 | 0 | 0 | ||||||||||||||||||
| Total | 0 | 0 | 0 | 0 | 0 | 0 | 0 | 0 | 0 | 0 | 0 | 1Table 1 Footnote 1 | 0 | ||||||||||||||||||
| Week 29: July 19 to July 25, 2015 | ||||||
|---|---|---|---|---|---|---|
| West Nile virus neurological syndrome | West Nile virus non-neurological syndrome | Unclassified/unspecified | Total clinical casesTable 2 Footnote 1 | Number of travel-related casesTable 2 Footnote 2 | West Nile virus asymptomatic infectionTable 2 Footnote 3 | |
Table 2 Footnotes
|
||||||
| Newfoundland and Labrador | 0 | 0 | 0 | 0 | 0 | 0 |
| Prince Edward Island | 0 | 0 | 0 | 0 | 0 | 0 |
| Nova Scotia | 0 | 0 | 0 | 0 | 0 | 0 |
| New Brunswick | 0 | 0 | 0 | 0 | 0 | 0 |
| Quebec | 0 | 0 | 0 | 0 | 0 | 0 |
| Ontario | 0 | 0 | 1 | 1 | 0 | 0 |
| Manitoba | 0 | 0 | 0 | 0 | 0 | 0 |
| Saskatchewan | 0 | 0 | 0 | 0 | 0 | 0 |
| Alberta | 0 | 0 | 0 | 0 | 0 | 0 |
| British Columbia | 0 | 0 | 0 | 0 | 0 | 0 |
| Yukon Territory | 0 | 0 | 0 | 0 | 0 | 0 |
| Northwest Territory | 0 | 0 | 0 | 0 | 0 | 0 |
| Nunavut | 0 | 0 | 0 | 0 | 0 | 0 |
| Total | 0 | 0 | 1 | 1 | 0 | 0 |
| Year to date: January 1 to July 25, 2015 | ||||||
| Newfoundland and Labrador | 0 | 0 | 0 | 0 | 0 | 0 |
| Prince Edward Island | 0 | 0 | 0 | 0 | 0 | 0 |
| Nova Scotia | 0 | 0 | 0 | 0 | 0 | 0 |
| New Brunswick | 0 | 0 | 0 | 0 | 0 | 0 |
| Quebec | 0 | 0 | 0 | 0 | 0 | 0 |
| Ontario | 0 | 0 | 1 | 1 | 0 | 0 |
| Manitoba | 0 | 0 | 0 | 0 | 0 | 0 |
| Saskatchewan | 0 | 0 | 0 | 0 | 0 | 0 |
| Alberta | 0 | 0 | 0 | 0 | 0 | 0 |
| British Columbia | 0 | 0 | 0 | 0 | 0 | 0 |
| Yukon Territory | 0 | 0 | 0 | 0 | 0 | 0 |
| Northwest Territory | 0 | 0 | 0 | 0 | 0 | 0 |
| Nunavut | 0 | 0 | 0 | 0 | 0 | 0 |
| Total | 0 | 0 | 1 | 1 | 0 | 0 |
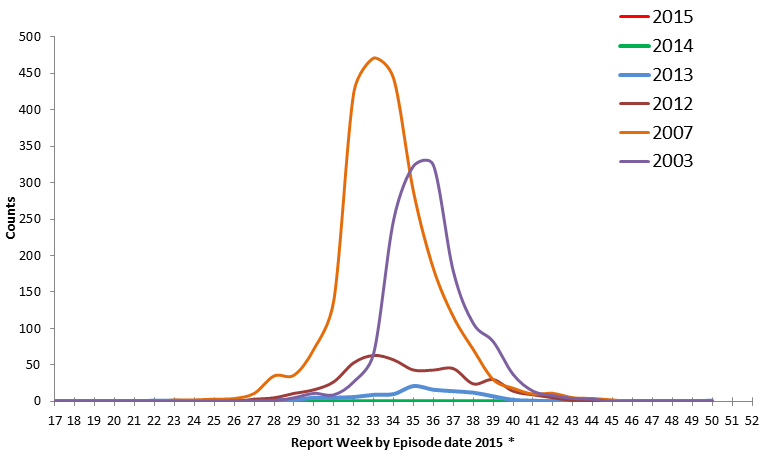
FIGURE 2: West Nile Virus clinical cases and asymptomatic infections by report week for selected years
| Report week | |||||||||||||||||||||||||||||||
|---|---|---|---|---|---|---|---|---|---|---|---|---|---|---|---|---|---|---|---|---|---|---|---|---|---|---|---|---|---|---|---|
| 17 | 18 | 19 | 20 | 21 | 22 | 23 | 24 | 25 | 26 | 27 | 28 | 29 | 30 | 31 | 32 | 33 | 34 | 35 | 36 | 37 | 38 | 39 | 40 | 41 | 42 | 43 | 44 | 45 | 46 | 47 | |
Table 3 Footnotes
|
|||||||||||||||||||||||||||||||
| 2015 | 0 | 0 | 0 | 0 | 0 | 0 | 0 | 0 | 0 | 0 | 0 | 1 | 0 | ||||||||||||||||||
| 2014 | 0 | 0 | 0 | 0 | 0 | 0 | 0 | 0 | 0 | 0 | 0 | 0 | 1 | 0 | 0 | 0 | 4Table 3 Footnote * | 3 | 5 | 6 | 1 | 1 | 0 | 0 | 1 | 0 | 0 | 0 | 0 | 0 | 0 |
| 2013 | 1 | 0 | 0 | 0 | 0 | 1 | 1 | 0 | 0 | 0 | 1 | 2 | 1 | 5 | 5 | 8 | 17 | 11 | 13 | 13 | 11 | 9 | 1 | 6 | 1 | 0 | 4 | 1 | 0 | 1 | 0 |
| 2012 | 1 | 0 | 0 | 0 | 0 | 0 | 0 | 0 | 0 | 0 | 3 | 5 | 11 | 16 | 27 | 53 | 63 | 57 | 43 | 43 | 45 | 24 | 30 | 14 | 9 | 5 | 1 | 0 | 0 | 0 | 0 |
| 2007 | 0 | 0 | 0 | 0 | 0 | 0 | 2 | 2 | 3 | 4 | 11 | 35 | 36 | 72 | 139 | 424 | 471 | 443 | 287 | 182 | 116 | 71 | 30 | 18 | 10 | 11 | 5 | 4 | 2 | 0 | 0 |
| 2005 | 0 | 0 | 0 | 0 | 0 | 0 | 0 | 0 | 0 | 0 | 0 | 0 | 0 | 0 | 4 | 4 | 11 | 28 | 28 | 38 | 45 | 27 | 15 | 7 | 12 | 3 | 3 | 1 | 0 | 0 | 0 |
| 2003 | 0 | 0 | 0 | 0 | 0 | 0 | 0 | 0 | 0 | 1 | 1 | 1 | 5 | 11 | 9 | 27 | 66 | 249 | 323 | 324 | 178 | 107 | 82 | 37 | 14 | 8 | 4 | 3 | 0 | 0 | 0 |
| Report week of 2015 | |||||||||||||||||||||||||||||||
|---|---|---|---|---|---|---|---|---|---|---|---|---|---|---|---|---|---|---|---|---|---|---|---|---|---|---|---|---|---|---|---|
| 17 | 18 | 19 | 20 | 21 | 22 | 23 | 24 | 25 | 26 | 27 | 28 | 29 | 30 | 31 | 32 | 33 | 34 | 35 | 36 | 37 | 38 | 39 | 40 | 41 | 42 | 43 | 44 | 45 | 46 | 47 | |
Table 4.1 Footnotes
|
|||||||||||||||||||||||||||||||
| Newfoundland and Labrador | 0 | 0 | 0 | 0 | 0 | 0 | 0 | 0 | 0 | 0 | 0 | 0 | 0 | ||||||||||||||||||
| Prince Edward Island | 0 | 0 | 0 | 0 | 0 | 0 | 0 | 0 | 0 | 0 | 0 | 0 | 0 | ||||||||||||||||||
| New Brunswick | 0 | 0 | 0 | 0 | 0 | 0 | 0 | 0 | 0 | 0 | 0 | 0 | 0 | ||||||||||||||||||
| Nova Scotia | 0 | 0 | 0 | 0 | 0 | 0 | 0 | 0 | 0 | 0 | 0 | 0 | 0 | ||||||||||||||||||
| Quebec | 0 | 0 | 0 | 0 | 0 | 0 | 0 | 0 | 0 | 120 | 115 | 100 | 154 | ||||||||||||||||||
| Ontario | 0 | 0 | 0 | 0 | 0 | 0 | 0 | 1Table 4.1 Footnote 2 | 0 | 0 | 0 | 1Table 4.1 Footnote 2 | 3Table 4.1 Footnote 2 | ||||||||||||||||||
| Manitoba | 0 | 0 | 0 | 0 | 12 | 4 | 87 | 82 | 44 | 75 | 73 | 132 | 139 | ||||||||||||||||||
| Saskatchewan | 0 | 0 | 0 | 0 | 2 | 0 | 3 | 3 | 10 | 13 | 15 | 40 | 47 | ||||||||||||||||||
| Alberta | 0 | 0 | 0 | 0 | 0 | 0 | 0 | 0 | 0 | 0 | 0 | 0 | 0 | ||||||||||||||||||
| British Columbia | 0 | 0 | 0 | 0 | 0 | 0 | 0 | 0 | 0 | 0 | 0 | 0 | 0 | ||||||||||||||||||
| Yukon Territory | 0 | 0 | 0 | 0 | 0 | 0 | 0 | 0 | 0 | 0 | 0 | 0 | 0 | ||||||||||||||||||
| Northwest Territory | 0 | 0 | 0 | 0 | 0 | 0 | 0 | 0 | 0 | 0 | 0 | 0 | 0 | ||||||||||||||||||
| Nunavut | 0 | 0 | 0 | 0 | 0 | 0 | 0 | 0 | 0 | 0 | 0 | 0 | 0 | ||||||||||||||||||
| Total | 0 | 0 | 0 | 0 | 14 | 4 | 90 | 86 | 54 | 208 | 203 | 273 | 343 | ||||||||||||||||||
| Year to date: January 1 to July 25, 2015 | |||
|---|---|---|---|
| Number of positive mosquito pools | Number of mosquito pools tested | Percentage of positive mosquito pools (%) | |
Table 4.2 Footnotes
|
|||
| Quebec | 0 | 501 | 0 |
| Ontario | 5 | N/ATable 4.2 Footnote 1 | N/ATable 4.2 Footnote 1 |
| Manitoba | 1 | 648 | 0.15 |
| Saskatchewan | 1 | 134 | 1.01 |
| Total | 7 | 1283 | 0.55 |
FIGURE 3: Reported number of dead birds testing positive for West Nile Virus by Province/Territory and by report week, 2015 season*
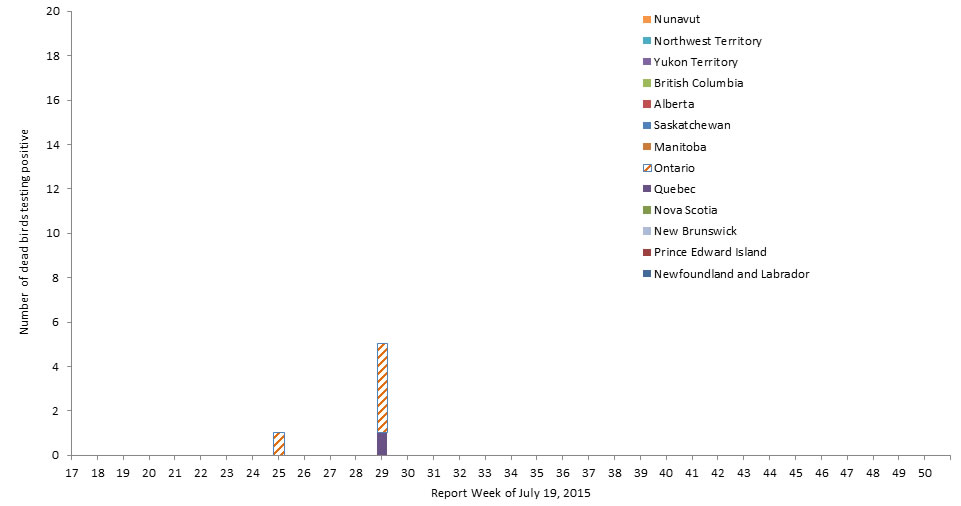
Number of Provinces/Territories are no longer conducting dead bird surveillance as part of their West Nile Virus (WNV) program.
As part of their national network to monitor the health of wildlife in Canada, the Canadian Wildlife Health Cooperative (CWHC) receives dead bird submissions for analysis. As part of this work, and if appropriate, the CWHC will test some of these dead birds for infection with WNV. Results from this program are recorded in the table above, and are also available on the CWHC web site at: http://www.cwhc-rcsf.ca/data_products_wnv.php
* Data from the Canadian Wildlife Health Cooperative. You may also access historical dead bird surveillance test results via this link.
| Report week of 2015 | ||||||||||||||||||||||||||||||||
|---|---|---|---|---|---|---|---|---|---|---|---|---|---|---|---|---|---|---|---|---|---|---|---|---|---|---|---|---|---|---|---|---|
| 17 | 18 | 19 | 20 | 21 | 22 | 23 | 24 | 25 | 26 | 27 | 28 | 29 | 30 | 31 | 32 | 33 | 34 | 35 | 36 | 37 | 38 | 39 | 40 | 41 | 42 | 43 | 44 | 45 | 46 | 47 | Total | |
Table 5 Footnotes
|
||||||||||||||||||||||||||||||||
| Newfoundland and Labrador | 0 | 0 | 0 | 0 | 0 | 0 | 0 | 0 | 0 | 0 | 0 | 0 | 0 | 0 | ||||||||||||||||||
| Prince Edward Island | 0 | 0 | 0 | 0 | 0 | 0 | 0 | 0 | 0 | 0 | 0 | 0 | 0 | 0 | ||||||||||||||||||
| New Brunswick | 0 | 0 | 0 | 0 | 0 | 0 | 0 | 0 | 0 | 0 | 0 | 0 | 0 | 0 | ||||||||||||||||||
| Nova Scotia | 0 | 0 | 0 | 0 | 0 | 0 | 0 | 0 | 0 | 0 | 0 | 0 | 0 | 0 | ||||||||||||||||||
| Quebec | 0 | 0 | 0 | 0 | 0 | 0 | 0 | 0 | 0 | 0 | 0 | 0 | 1 | 1 | ||||||||||||||||||
| Ontario | 0 | 0 | 0 | 0 | 0 | 0 | 0 | 1 | 0 | 0 | 0 | 0 | 4 | 5 | ||||||||||||||||||
| Manitoba | 0 | 0 | 0 | 0 | 0 | 0 | 0 | 0 | 0 | 0 | 0 | 0 | 0 | 0 | ||||||||||||||||||
| Saskatchewan | 0 | 0 | 0 | 0 | 0 | 0 | 0 | 0 | 0 | 0 | 0 | 0 | 0 | 0 | ||||||||||||||||||
| Alberta | 0 | 0 | 0 | 0 | 0 | 0 | 0 | 0 | 0 | 0 | 0 | 0 | 0 | 0 | ||||||||||||||||||
| British Columbia | 0 | 0 | 0 | 0 | 0 | 0 | 0 | 0 | 0 | 0 | 0 | 0 | 0 | 0 | ||||||||||||||||||
| Yukon Territory | 0 | 0 | 0 | 0 | 0 | 0 | 0 | 0 | 0 | 0 | 0 | 0 | 0 | 0 | ||||||||||||||||||
| Northwest Territory | 0 | 0 | 0 | 0 | 0 | 0 | 0 | 0 | 0 | 0 | 0 | 0 | 0 | 0 | ||||||||||||||||||
| Nunavut | 0 | 0 | 0 | 0 | 0 | 0 | 0 | 0 | 0 | 0 | 0 | 0 | 0 | 0 | ||||||||||||||||||
| Total | 0 | 0 | 0 | 0 | 0 | 0 | 0 | 1 | 0 | 0 | 0 | 0 | 5 | 6 | ||||||||||||||||||
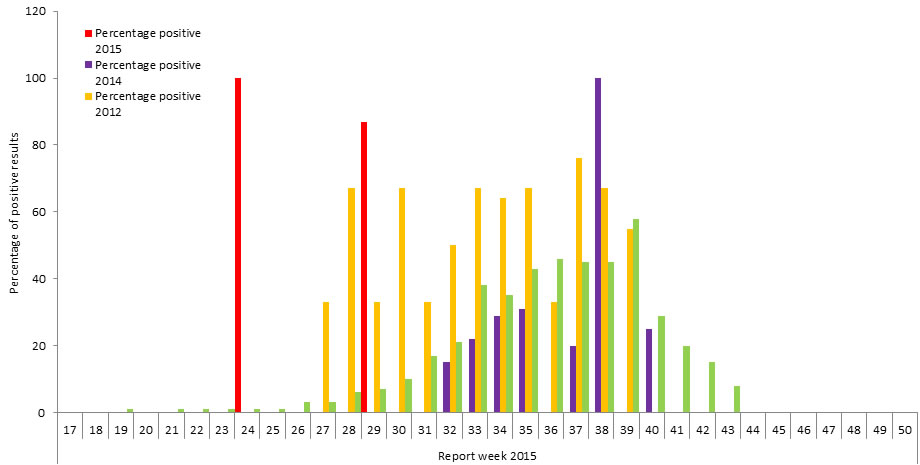
FIGURE 4: Percentage of dead birds testing positive for West Nile Virus in the 2015 season by report week, as compared to the 2003, 2012 and 2014 seasons
|
Report week | ||||||||||||||||||||||||||||||
|---|---|---|---|---|---|---|---|---|---|---|---|---|---|---|---|---|---|---|---|---|---|---|---|---|---|---|---|---|---|---|---|
| 17 | 18 | 19 | 20 | 21 | 22 | 23 | 24 | 25 | 26 | 27 | 28 | 29 | 30 | 31 | 32 | 33 | 34 | 35 | 36 | 37 | 38 | 39 | 40 | 41 | 42 | 43 | 44 | 45 | 46 | 47 | |
Table 6 Footnotes
|
|||||||||||||||||||||||||||||||
| Numbers positive 2015 | 0 | 0 | 0 | 0 | 0 | 0 | 0 | 1 | 0 | 0 | 0 | 0 | 6 | ||||||||||||||||||
| Numbers tested 2015 | 0 | 0 | 0 | 0 | 0 | 0 | 0 | 1 | 0 | 0 | 1 | 0 | 7 | ||||||||||||||||||
| Percentage positive 2015 | 0 | 0 | 0 | 0 | 0 | 0 | 0 | 100 | 0 | 0 | 0 | 0 | 86 | ||||||||||||||||||
| Numbers positive 2014 | 0 | 0 | 0 | 0 | 0 | 0 | 0 | 0 | 0 | 0 | 0 | 0 | 0 | 0 | 0 | 2 | 2 | 2 | 4 | 0 | 2 | 3 | 0 | 1 | 0 | 0 | 0 | 0 | 0 | 0 | 0 |
| Numbers tested 2014 | 0 | 0 | 0 | 0 | 0 | 0 | 0 | 0 | 0 | 0 | 0 | 0 | 0 | 41Table 6 Footnote * | 10 | 13 | 9 | 7 | 13 | 6 | 10 | 3 | 1 | 4 | 2 | 1 | 0 | 0 | 0 | 0 | 0 |
| Percentage positive 2014 | 0 | 0 | 0 | 0 | 0 | 0 | 0 | 0 | 0 | 0 | 0 | 0 | 0 | 0 | 0 | 15 | 22 | 29 | 31 | 0 | 20 | 100 | 0 | 25 | 0 | 0 | 0 | 0 | 0 | 0 | 0 |
| Percentage positive 2012 | 0 | 0 | 0 | 0 | 0 | 0 | 0 | 0 | 0 | 0 | 33 | 67 | 33 | 67 | 33 | 50 | 67 | 64 | 67 | 33 | 67 | 67 | 55 | 0 | 0 | 0 | 0 | 0 | 0 | 0 | 0 |
| Percentage positive 2003 | 0 | 0 | 1 | 0 | 1 | 1 | 1 | 1 | 1 | 3 | 3 | 6 | 7 | 10 | 17 | 21 | 38 | 35 | 43 | 46 | 45 | 45 | 58 | 29 | 20 | 15 | 8 | 0 | 0 | 0 | 0 |
Page details
- Date modified: