
West Nile Virus and Other Mosquito-Borne Disease National Surveillance Report - September 18 to September 24, 2016 (Week 38)
West Nile virus
Canada
Humans
During surveillance week 38, ending on September 24, 2016, eleven (11) human clinical cases of West Nile virus (WNV) have been reported to the Public Health Agency of Canada (PHAC). Of these, eight cases have been reported in Ontario [Ottawa (1),Toronto (2), Windsor-Essex County (2), Durham (1), Peel (1), Haldimand-Norfolk (1)] and three cases in Quebec [Montérégie (2), Montréal (1)].
As of surveillance week 38, a total of 69 human clinical cases have been reported to PHAC: Alberta (4) [Calgary zone (1) and South zone (3)], Manitoba (20) [Interlake-Eastern (3), Northern (1), Prairie Mountain (2), Southern (8) and Winnipeg (6)], Ontario (34) [Ottawa (1),Toronto (17), Niagara (6), York (2), Durham (2), Halton (1), Windsor-Essex County (2), Peel (2) ,Haldimand-Norfolk (1)] and Quebec (11) [Capitale-Nationale (1), Laurentides (1)Footnote *, Laval (3), Montérégie (3), Lanaudière (2), Montréal (1) ]. Of these, thirty-seven cases (54 %) were classified as West Nile virus Neurological Syndrome, nineteen cases (27 %) as West Nile virus Non-Neurological Syndrome, and thirteen cases (19 %) were unclassified. Three fatal cases have been reported.
In addition, five West Nile virus asymptomatic infections have been reported: Saskatchewan (1) [Mixed-Grass prairieFootnote x (1)] and Ontario (4) [Toronto (3), Windsor-Essex County (1)].
Alternative Formats
Related Topics
Mosquitoes
As of surveillance week 38, 338 (2.32 %) out of 14569 mosquito pools have tested positive for WNV in Canada: Saskatchewan (67), Manitoba (39), Ontario (208) and Quebec (24).
Birds
As of surveillance week 38, the Canadian Wildlife Health Cooperative, the Québec Ministry of Agriculture, Fisheries and Food, and the Québec Centre for Wildlife Health have examined a total of 66 dead birds for WNV: British Columbia (2), Saskatchewan (3), Ontario (49), and Quebec (12), of which 21 (32%) dead birds have tested positive for WNV: British Columbia (2) [Cranbrook], Sakatchewan (1)[Saskatoon], [Ontario (8) [Bradford (1), Hamilton (1), Sarnia (1), Thorold (1), Toronto (1), Tecumseh (1), Burlington (1), Waterloo (1)] and Quebec (10) [ Estrie (1), Lanaudière (1), Montérégie (5), Saint-Jean-Baptiste (1), Abitibi-Témiscaminigue (1), Montréal (1)]. The positive birds were identified as American Crows (38%), Red- tailed Hawks (24%), Sharp-shinned Hawks (14%), Merlins (9%), Northern Goshawks (5%), Great- horned Owl (5%) and Cooper's hawk (5%).
Domestic Animals
As of surveillance week 38, forty-four horses with WNV infection have been reported to the Canadian Food Inspection Agency by various provincial/private animal health laboratories. These are preliminary data under validation: British Columbia (10), Alberta (7), Manitoba (12), Ontario (2) and Saskatchewan (13). In addition, the Quebec Ministry of Agriculture, Fisheries and Food, has reported one horse that tested positive for WNV, in Quebec.
United States and U.S. territories
As of September 24, 2016, the Centers for Disease Control and Prevention have reported a total of 986 human clinical cases of West Nile virus disease in the US, including the following border states: Washington (8), Idaho (6), Montana (5), New York (1), North Dakota (11), Minnesota (34), Michigan (32), and Vermont (3). Of these, 505 (51%) were classified as neuroinvasive disease and 481 (49%) were classified as non- neuroinvasive disease.
Detailed information can be accessed via the CDC web site.
Europe and Neighbouring Countries
As of September 24, 2016, a total of 149 human cases of WNV have been reported in the European Union and 205 cases have been reported in the neighbouring countries.
Detailed information can be accessed via the ECDC web site.
Eastern equine encephalitis
Canada
Domestic Animals
As of surveillance week 38, one horse with Eastern Equine Encephalitis in Berthierville, Québec, has been reported to the Canadian Food Inspection Agency by a provincial/private animal health laboratory.
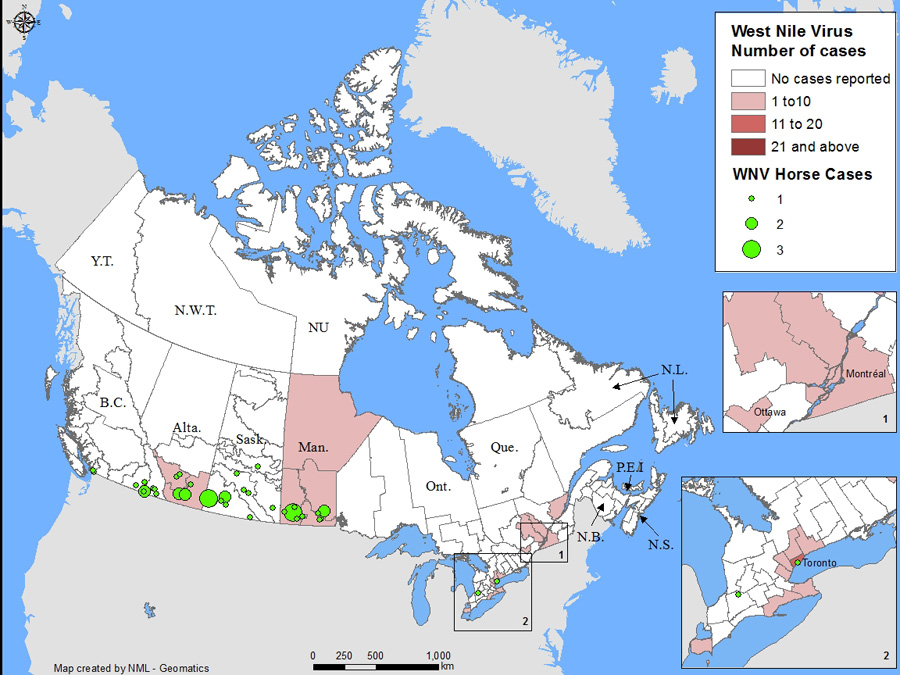
Figure 1: Geographic distribution of WNV in humans (clinical cases) and horsesFigure 1 - Footnote * in Canada, as of September 24, 2016
- Figure 1 - Footnote *
-
These are preliminary data, under validation.
Figure 1 - Text Description
Map showing geographic distribution of WNV in Humans (clinical cases) and horses in Canada.
As of surveillance week 38, ending September 24, 2016, a total of 69 human clinical cases of WNV have been reported in Canada: Alberta (4), Manitoba (20), Ontario (34) and Quebec (11).
Forty-four horses with WNV infection have been reported (preliminary data): British Columbia (10), Alberta (7), Manitoba (12), Ontario (2) and Saskatchewan (13).
Figure 2: WNV human clinical cases and asymptomatic infections by province/ territory and by report week, as of September 24, 2016
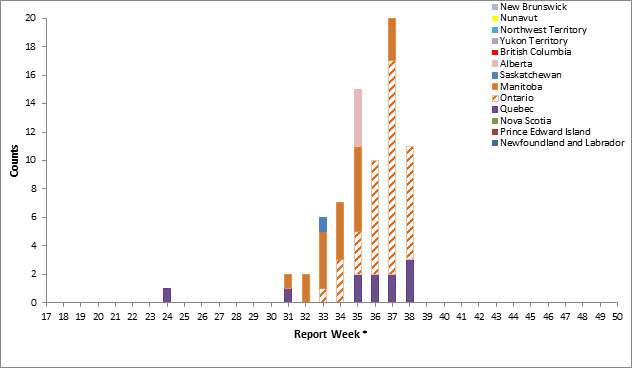
Figure 2 - Text Description
| Report Weeks of 2016 | |||||||||||||||||||||||||||||||||||
|---|---|---|---|---|---|---|---|---|---|---|---|---|---|---|---|---|---|---|---|---|---|---|---|---|---|---|---|---|---|---|---|---|---|---|---|
| 17 | 18 | 19 | 20 | 21 | 22 | 23 | 24 | 25 | 26 | 27 | 28 | 29 | 30 | 31 | 32 | 33 | 34 | 35 | 36 | 37 | 38 | 39 | 40 | 41 | 42 | 43 | 44 | 45 | 46 | 47 | 48 | 49 | 50 | Total | |
| Newfoundland and Labrador | 0 | 0 | 0 | 0 | 0 | 0 | 0 | 0 | 0 | 0 | 0 | 0 | 0 | 0 | 0 | 0 | 0 | 0 | 0 | 0 | 0 | 0 | 0 | ||||||||||||
| Prince Edward Island | 0 | 0 | 0 | 0 | 0 | 0 | 0 | 0 | 0 | 0 | 0 | 0 | 0 | 0 | 0 | 0 | 0 | 0 | 0 | 0 | 0 | 0 | 0 | ||||||||||||
| New Brunswick | 0 | 0 | 0 | 0 | 0 | 0 | 0 | 0 | 0 | 0 | 0 | 0 | 0 | 0 | 0 | 0 | 0 | 0 | 0 | 0 | 0 | 0 | 0 | ||||||||||||
| Nova Scotia | 0 | 0 | 0 | 0 | 0 | 0 | 0 | 0 | 0 | 0 | 0 | 0 | 0 | 0 | 0 | 0 | 0 | 0 | 0 | 0 | 0 | 0 | 0 | ||||||||||||
| Quebec | 0 | 0 | 0 | 0 | 0 | 0 | 0 | 1Figure 2 Footnote * | 0 | 0 | 0 | 0 | 0 | 0 | 1 | 0 | 0 | 0 | 2 | 2 | 2 | 3 | 11 | ||||||||||||
| Ontario | 0 | 0 | 0 | 0 | 0 | 0 | 0 | 0 | 0 | 0 | 0 | 0 | 0 | 0 | 0 | 0 | 1 | 3 | 3 | 8 | 15 | 8 | 38 | ||||||||||||
| Manitoba | 0 | 0 | 0 | 0 | 0 | 0 | 0 | 0 | 0 | 0 | 0 | 0 | 0 | 0 | 1 | 2 | 4 | 4 | 6 | 0 | 3 | 0 | 20 | ||||||||||||
| Saskatchewan | 0 | 0 | 0 | 0 | 0 | 0 | 0 | 0 | 0 | 0 | 0 | 0 | 0 | 0 | 0 | 0 | 1 | 0 | 0 | 0 | 0 | 0 | 1 | ||||||||||||
| Alberta | 0 | 0 | 0 | 0 | 0 | 0 | 0 | 0 | 0 | 0 | 0 | 0 | 0 | 0 | 0 | 0 | 0 | 0 | 4 | 0 | 0 | 0 | 4 | ||||||||||||
| British Columbia | 0 | 0 | 0 | 0 | 0 | 0 | 0 | 0 | 0 | 0 | 0 | 0 | 0 | 0 | 0 | 0 | 0 | 0 | 0 | 0 | 0 | 0 | 0 | ||||||||||||
| Yukon Territory | 0 | 0 | 0 | 0 | 0 | 0 | 0 | 0 | 0 | 0 | 0 | 0 | 0 | 0 | 0 | 0 | 0 | 0 | 0 | 0 | 0 | 0 | 0 | ||||||||||||
| Northwest Territory | 0 | 0 | 0 | 0 | 0 | 0 | 0 | 0 | 0 | 0 | 0 | 0 | 0 | 0 | 0 | 0 | 0 | 0 | 0 | 0 | 0 | 0 | 0 | ||||||||||||
| Nunavut | 0 | 0 | 0 | 0 | 0 | 0 | 0 | 0 | 0 | 0 | 0 | 0 | 0 | 0 | 0 | 0 | 0 | 0 | 0 | 0 | 0 | 0 | 0 | ||||||||||||
| Total | 0 | 0 | 0 | 0 | 0 | 0 | 0 | 1 | 0 | 0 | 0 | 0 | 0 | 0 | 2 | 2 | 6 | 7 | 15 | 10 | 20 | 11 | 74 | ||||||||||||
|
|||||||||||||||||||||||||||||||||||
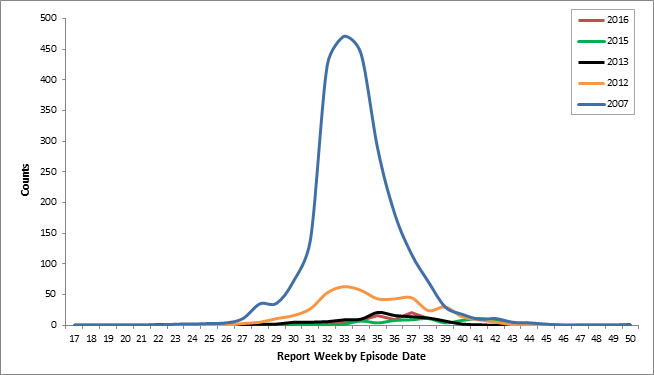
Figure 3: WNV human clinical cases and asymptomatic infections by report week for selected years, in CanadaFigure 3 Footnote *
- Figure 3 - Footnote *
-
West Nile virus clinical cases and asymptomatic infections are grouped by report week, based on episode date. Episode date could include one of the following: onset date, diagnosis date, lab sample date or reporting date.
Figure 3 - Text Description
| Years | Report Week | ||||||||||||||||||||||||||||||||||
|---|---|---|---|---|---|---|---|---|---|---|---|---|---|---|---|---|---|---|---|---|---|---|---|---|---|---|---|---|---|---|---|---|---|---|---|
| 17 | 18 | 19 | 20 | 21 | 22 | 23 | 24 | 25 | 26 | 27 | 28 | 29 | 30 | 31 | 32 | 33 | 34 | 35 | 36 | 37 | 38 | 39 | 40 | 41 | 42 | 43 | 44 | 45 | 46 | 47 | 48 | 49 | 50 | Total | |
| 2016 | 0 | 0 | 0 | 0 | 0 | 0 | 0 | 1 | 0 | 0 | 0 | 0 | 0 | 0 | 2 | 2 | 6 | 7 | 15 | 10 | 20 | 11 | 74 | ||||||||||||
| 2015 | 0 | 0 | 0 | 0 | 0 | 0 | 0 | 0 | 0 | 0 | 0 | 1 | 1 | 2 | 1 | 0 | 2 | 7 | 4 | 8 | 9 | 11 | 4 | 8 | 11 | 8 | 4 | 0 | 1 | 0 | 0 | 0 | 0 | 0 | 82 |
| 2013 | 0 | 0 | 0 | 0 | 0 | 1 | 1 | 0 | 0 | 0 | 1 | 2 | 2 | 5 | 5 | 6 | 9 | 10 | 21 | 16 | 14 | 12 | 7 | 2 | 1 | 0 | 1 | 1 | 0 | 0 | 0 | 0 | 0 | 1 | 118 |
| 2012 | 0 | 0 | 0 | 0 | 0 | 0 | 1 | 0 | 0 | 0 | 3 | 5 | 11 | 16 | 27 | 53 | 63 | 57 | 43 | 43 | 45 | 24 | 30 | 14 | 9 | 5 | 1 | 0 | 0 | 0 | 0 | 0 | 0 | 0 | 450 |
| 2007 | 0 | 0 | 0 | 0 | 0 | 0 | 2 | 2 | 3 | 4 | 11 | 35 | 36 | 72 | 139 | 424 | 471 | 443 | 287 | 182 | 116 | 71 | 30 | 18 | 10 | 11 | 5 | 4 | 2 | 0 | 0 | 0 | 0 | 0 | 2378 |
| Week 38: September 18 to September 24, 2016 | ||||||
|---|---|---|---|---|---|---|
| West Nile virus neurological syndrome | West Nile virus non-neurological syndrome | Unclassified/unspecified | Total clinical casesTable 1 Footnote 1 | Number of travel-related casesTable 1 Footnote 2 | West Nile virus asymptomatic infectionTable 1 Footnote 3 | |
| Newfoundland and Labrador | 0 | 0 | 0 | 0 | 0 | 0 |
| Prince Edward Island | 0 | 0 | 0 | 0 | 0 | 0 |
| Nova Scotia | 0 | 0 | 0 | 0 | 0 | 0 |
| New Brunswick | 0 | 0 | 0 | 0 | 0 | 0 |
| Quebec | 3 | 0 | 0 | 3 | 0 | 0 |
| Ontario | 5 | 2 | 1 | 8 | 0 | 0 |
| Manitoba | 0 | 0 | 0 | 0 | 0 | 0 |
| Saskatchewan | 0 | 0 | 0 | 0 | 0 | 0 |
| Alberta | 0 | 0 | 0 | 0 | 0 | 0 |
| British Columbia | 0 | 0 | 0 | 0 | 0 | 0 |
| Yukon Territory | 0 | 0 | 0 | 0 | 0 | 0 |
| Northwest Territory | 0 | 0 | 0 | 0 | 0 | 0 |
| Nunavut | 0 | 0 | 0 | 0 | 0 | 0 |
| Total | 8 | 2 | 1 | 11 | 0 | 0 |
| - | Year to date: January 1 to September 24, 2016 | |||||
| Newfoundland and Labrador | 0 | 0 | 0 | 0 | 0 | 0 |
| Prince Edward Island | 0 | 0 | 0 | 0 | 0 | 0 |
| Nova Scotia | 0 | 0 | 0 | 0 | 0 | 0 |
| New Brunswick | 0 | 0 | 0 | 0 | 0 | 0 |
| Quebec | 8Table 1 Footnote * | 3 | 0 | 11Table 1 Footnote * | 0 | 0 |
| Ontario | 22 | 8 | 4 | 34 | 3 | 4 |
| Manitoba | 6 | 5 | 9 | 20 | 0 | 0 |
| Saskatchewan | 0 | 0 | 0 | 0 | 0 | 1 |
| Alberta | 1 | 3 | 0 | 4 | 1 | 0 |
| British Columbia | 0 | 0 | 0 | 0 | 0 | 0 |
| Yukon Territory | 0 | 0 | 0 | 0 | 0 | 0 |
| Northwest Territory | 0 | 0 | 0 | 0 | 0 | 0 |
| Nunavut | 0 | 0 | 0 | 0 | 0 | 0 |
| Total | 37 | 19 | 13 | 69 | 4 | 5 |
|
||||||
| Province | Year to date: January 1 to September 24, 2016Table 2 Footnote * | ||
|---|---|---|---|
| Number of positive mosquito pools | Number of mosquito pools tested | Percentage of positive mosquito pools (%) | |
| Quebec | 24 | 871 | 2.76 |
| Ontario | 208 | 11707 | 1.78 |
| Manitoba | 39 | 1394 | 2.8 |
| Saskatchewan | 67 | 597 | 11.22 |
| Total | 338 | 14569 | 2.32 |
|
|||
Figure 4: Reported number of dead birds tested positive for WNV by province/ territory and by report week, 2016 season in Canada
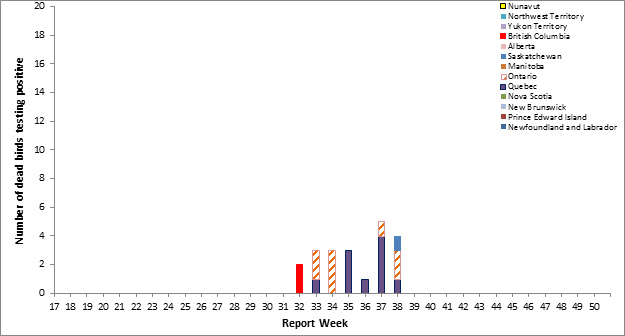
Figure 4 - Text Description
| Report Weeks of 2016 | |||||||||||||||||||||||||||||||||||
|---|---|---|---|---|---|---|---|---|---|---|---|---|---|---|---|---|---|---|---|---|---|---|---|---|---|---|---|---|---|---|---|---|---|---|---|
| 17 | 18 | 19 | 20 | 21 | 22 | 23 | 24 | 25 | 26 | 27 | 28 | 29 | 30 | 31 | 32 | 33 | 34 | 35 | 36 | 37 | 38 | 39 | 40 | 41 | 42 | 43 | 44 | 45 | 46 | 47 | 48 | 49 | 50 | Total | |
| Newfoundland and Labrador | 0 | 0 | 0 | 0 | 0 | 0 | 0 | 0 | 0 | 0 | 0 | 0 | 0 | 0 | 0 | 0 | 0 | 0 | 0 | 0 | 0 | 0 | 0 | ||||||||||||
| Prince Edward Island | 0 | 0 | 0 | 0 | 0 | 0 | 0 | 0 | 0 | 0 | 0 | 0 | 0 | 0 | 0 | 0 | 0 | 0 | 0 | 0 | 0 | 0 | 0 | ||||||||||||
| New Brunswick | 0 | 0 | 0 | 0 | 0 | 0 | 0 | 0 | 0 | 0 | 0 | 0 | 0 | 0 | 0 | 0 | 0 | 0 | 0 | 0 | 0 | 0 | 0 | ||||||||||||
| Nova Scotia | 0 | 0 | 0 | 0 | 0 | 0 | 0 | 0 | 0 | 0 | 0 | 0 | 0 | 0 | 0 | 0 | 0 | 0 | 0 | 0 | 0 | 0 | 0 | ||||||||||||
| Quebec | 0 | 0 | 0 | 0 | 0 | 0 | 0 | 0 | 0 | 0 | 0 | 0 | 0 | 0 | 0 | 0 | 1 | 0 | 3 | 1 | 4 | 1 | 10 | ||||||||||||
| Ontario | 0 | 0 | 0 | 0 | 0 | 0 | 0 | 0 | 0 | 0 | 0 | 0 | 0 | 0 | 0 | 0 | 2 | 3 | 0 | 0 | 1 | 2 | 8 | ||||||||||||
| Manitoba | 0 | 0 | 0 | 0 | 0 | 0 | 0 | 0 | 0 | 0 | 0 | 0 | 0 | 0 | 0 | 0 | 0 | 0 | 0 | 0 | 0 | 0 | 0 | ||||||||||||
| Saskatchewan | 0 | 0 | 0 | 0 | 0 | 0 | 0 | 0 | 0 | 0 | 0 | 0 | 0 | 0 | 0 | 0 | 0 | 0 | 0 | 0 | 0 | 1 | 1 | ||||||||||||
| Alberta | 0 | 0 | 0 | 0 | 0 | 0 | 0 | 0 | 0 | 0 | 0 | 0 | 0 | 0 | 0 | 0 | 0 | 0 | 0 | 0 | 0 | 0 | 0 | ||||||||||||
| British Columbia | 0 | 0 | 0 | 0 | 0 | 0 | 0 | 0 | 0 | 0 | 0 | 0 | 0 | 0 | 0 | 2 | 0 | 0 | 0 | 0 | 0 | 0 | 2 | ||||||||||||
| Yukon Territory | 0 | 0 | 0 | 0 | 0 | 0 | 0 | 0 | 0 | 0 | 0 | 0 | 0 | 0 | 0 | 0 | 0 | 0 | 0 | 0 | 0 | 0 | 0 | ||||||||||||
| Northwest Territory | 0 | 0 | 0 | 0 | 0 | 0 | 0 | 0 | 0 | 0 | 0 | 0 | 0 | 0 | 0 | 0 | 0 | 0 | 0 | 0 | 0 | 0 | 0 | ||||||||||||
| Nunavut | 0 | 0 | 0 | 0 | 0 | 0 | 0 | 0 | 0 | 0 | 0 | 0 | 0 | 0 | 0 | 0 | 0 | 0 | 0 | 0 | 0 | 0 | 0 | ||||||||||||
| Total | 0 | 0 | 0 | 0 | 0 | 0 | 0 | 0 | 0 | 0 | 0 | 0 | 0 | 0 | 0 | 2 | 3 | 3 | 3 | 1 | 5 | 4 | 21 | ||||||||||||
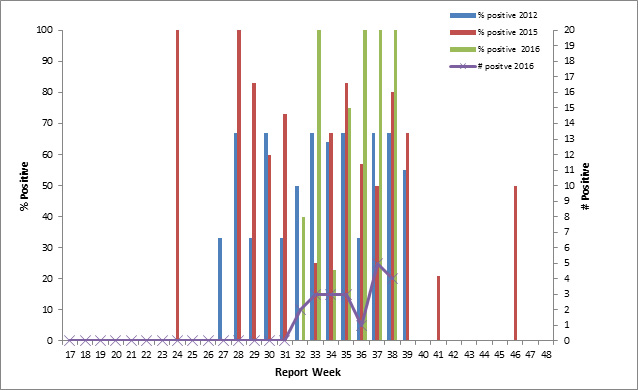
Figure 5: Percentage of dead birds tested positive for WNV by report week in 2012, 2015 and 2016, and number of dead birds tested positive for WNV, by report week, 2016, in CanadaFigure 5 Footnote 
- Figure 5 - Footnote 
-
Not all provinces are conducting dead bird surveillance as part of their own WNV surveillance program. However, WNV positive dead birds may be identified through the National Wildlife Disease Surveillance Program of the Canadian Wildlife Health Cooperative (CWHC)
Figure 5 - Text Description
| Years | Report Week | ||||||||||||||||||||||||||||||||
|---|---|---|---|---|---|---|---|---|---|---|---|---|---|---|---|---|---|---|---|---|---|---|---|---|---|---|---|---|---|---|---|---|---|
| 17 | 18 | 19 | 20 | 21 | 22 | 23 | 24 | 25 | 26 | 27 | 28 | 29 | 30 | 31 | 32 | 33 | 34 | 35 | 36 | 37 | 38 | 39 | 40 | 41 | 42 | 43 | 44 | 45 | 46 | 47 | 48 | ||
| % Positive | 2012 | 0 | 0 | 0 | 0 | 0 | 0 | 0 | 0 | 0 | 0 | 33 | 67 | 33 | 67 | 33 | 50 | 67 | 64 | 67 | 33 | 67 | 67 | 55 | 0 | 0 | 0 | 0 | 0 | 0 | 0 | 0 | 0 |
| % Positive | 2015 | 0 | 0 | 0 | 0 | 0 | 0 | 0 | 100 | 0 | 0 | 0 | 100 | 83 | 60 | 73 | 0 | 25 | 67 | 83 | 57 | 50 | 80 | 67 | 0 | 21 | 0 | 0 | 0 | 0 | 50 | 0 | 0 |
| % Positive | 2016 | 0 | 0 | 0 | 0 | 0 | 0 | 0 | 0 | 0 | 0 | 0 | 0 | 0 | 0 | 0 | 40 | 100 | 23 | 75 | 100 | 100 | 100 | ||||||||||
| # Positive | 2016 | 0 | 0 | 0 | 0 | 0 | 0 | 0 | 0 | 0 | 0 | 0 | 0 | 0 | 0 | 0 | 2 | 3 | 3 | 3 | 1 | 5 | 4 | ||||||||||