
West Nile Virus and Other Mosquito-Borne Disease National Surveillance Report - September 20 to September 26, 2015 (Report Week 38)
Summary
West Nile Virus in Canada
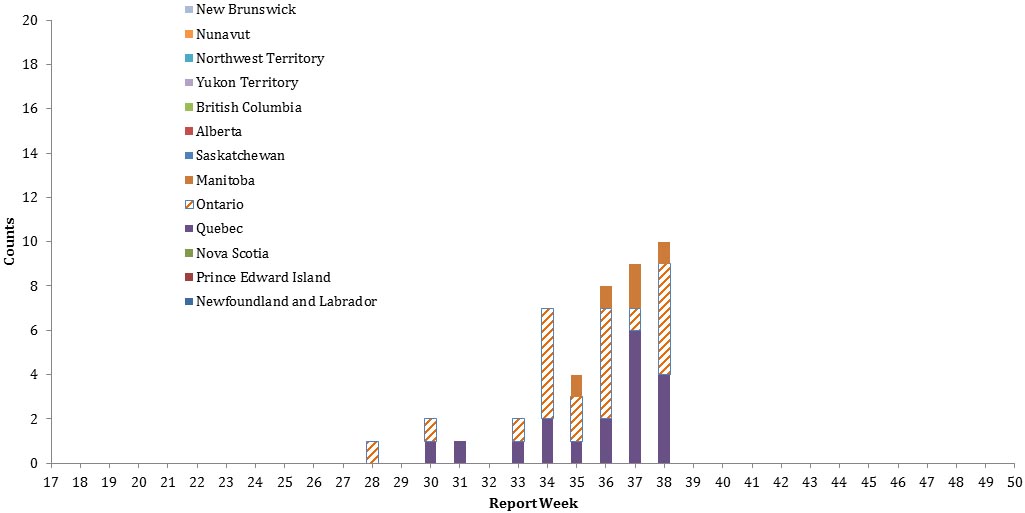
Humans: During surveillance week 38, ending on Sept 26, 2015, nine ( 9 ) human clinical cases of West Nile virus were reported to the Public Health Agency of Canada (the Agency). Of these, three cases were reported in Quebec [ Laval (2), Montérégie (1) ], five cases in Ontario [Toronto (4), Hamilton (1)] and one case in Manitoba (Winnipeg). Additionally, one asymptomatic infection was reported in Montérégie, Quebec.
As of surveillance week 38, a total of 40 human clinical cases have been reported to the Agency: Quebec (14), Ontario (21), and Manitoba (5). Of these, eighteen (45%) were classified as West Nile virus Neurological Syndrome, twenty-one (53%) as West Nile virus Non-Neurological Syndrome, and one (2%) as Unclassified. In addition, four (4) asymptomatic infections have been reported in Quebec [Laval (1) and Montérégie (3)].
Mosquitoes: As of surveillance week 38, 162 ( 0.83%) out of the 19,370 mosquito pools have tested positive for West Nile virus in Canada: Quebec (22), Ontario (94), Manitoba (30), and Saskatchewan (16).
Dead Birds: As of surveillance week 38, the Canadian Wildlife Health Cooperative and the Quebec Ministry of Health and Social Services have reported a total of 39 dead birds that were tested positive for West Nile virus: Quebec (16), Ontario (22), and Saskatchewan (1).
Domestic Animals: As of surveillance week 38, the Canadian Food Inspection Agency has reported 9 horses that were tested positive for West Nile virus: Ontario (3), Manitoba (1), Saskatchewan (3) and Alberta (2).
Four horses have tested positive for Eastern equine encephalitis virus: Ontario (3) and Quebec (1).
Alternative Formats
Related Topics
West Nile Virus in United States
As of Sept 29, 2015, the Centers for Disease Control and Prevention (CDC) has reported a total of 1028 human cases of West Nile virus:
Alabama ( 5), Arizona (57), Arkansas (14), California (201), Colorado (70), Connecticut (5), Delaware (1 ), District of Columbia (1), Florida (7),Georgia (8), Idaho (7), Illinois (30), Indiana (12), Iowa (4),Kansas (18), Louisiana (22), Maine (1), Maryland (38), Massachusetts (3), Michigan (9), Minnesota (5), Mississippi (32), Missouri (20), Montana (2), Nebraska (50), Nevada (7), New Jersey (18), New Mexico ( 8), New York (17), North Carolina (3), North Dakota (15 ), Ohio (26 ), Oklahoma (51), Oregon (1), Pennsylvania (27), South Carolina (0), South Dakota(35), Tennessee (3 ), Texas (150), Utah (3), Virginia (12 ), Washington(22), Wisconsin (4) and Wyoming (4).
Of these, 638 (62%) were diagnosed as neuroinvasive disease cases, 390 (38%) as non-neuroinvasive disease cases. 54 fatal cases were reported. In addition, 226 presumptive viremic blood donors have been identified.
West Nile Fever in the European Union, European Economic Area and Neighbouring Countries
As of 24 September 2015, the European Centre for Disease Prevention and Control has reported 78 cases of West Nile fever in humans in the EU Member States: Austria, Belgium, Bulgaria, Croatia, Republic of Cyprus, Czech Republic, Denmark, Estonia, Finland, France, Germany, Greece, Hungary, Ireland, Italy, Latvia, Lithuania, Luxembourg, Malta, Netherlands, Poland, Portugal, Romania, Slovakia, Slovenia, Spain, Sweden and the UK, as well as 92 cases in the neighboring countries: Armenia, Azerbaijan, Belarus, Georgia, Moldova, Ukraine, Algeria, Egypt, Israel, Jordan, Lebanon, Libya, Morocco, Palestine, Syria and Tunisia , since the beginning of the 2015 transmission season.
FIGURE 1: West Nile Virus human clinical cases and asymptomatic infections, by Province/Territory and by report week, 2015 season
| Report Weeks of 2015 | |||||||||||||||||||||||||||||||||
|---|---|---|---|---|---|---|---|---|---|---|---|---|---|---|---|---|---|---|---|---|---|---|---|---|---|---|---|---|---|---|---|---|---|
| 17 | 18 | 19 | 20 | 21 | 22 | 23 | 24 | 25 | 26 | 27 | 28 | 29 | 30 | 31 | 32 | 33 | 34 | 35 | 36 | 37 | 38 | 39 | 40 | 41 | 42 | 43 | 44 | 45 | 46 | 47 | 48 | Total | |
Table 1 Footnotes
|
|||||||||||||||||||||||||||||||||
| Newfoundland and Labrador | 0 | 0 | 0 | 0 | 0 | 0 | 0 | 0 | 0 | 0 | 0 | 0 | 0 | 0 | 0 | 0 | 0 | 0 | 0 | 0 | 0 | 0 | 0 | ||||||||||
| Prince Edward Island | 0 | 0 | 0 | 0 | 0 | 0 | 0 | 0 | 0 | 0 | 0 | 0 | 0 | 0 | 0 | 0 | 0 | 0 | 0 | 0 | 0 | 0 | 0 | ||||||||||
| New Brunswick | 0 | 0 | 0 | 0 | 0 | 0 | 0 | 0 | 0 | 0 | 0 | 0 | 0 | 0 | 0 | 0 | 0 | 0 | 0 | 0 | 0 | 0 | 0 | ||||||||||
| Nova Scotia | 0 | 0 | 0 | 0 | 0 | 0 | 0 | 0 | 0 | 0 | 0 | 0 | 0 | 0 | 0 | 0 | 0 | 0 | 0 | 0 | 0 | 0 | 0 | ||||||||||
| Quebec | 0 | 0 | 0 | 0 | 0 | 0 | 0 | 0 | 0 | 0 | 0 | 0 | 0 | 1 | 1 | 0 | 1 | 2 | 1 | 2 | 6 | 4 | 18 | ||||||||||
| Ontario | 0 | 0 | 0 | 0 | 0 | 0 | 0 | 0 | 0 | 0 | 0 | 1 | 0 | 1 | 0 | 0 | 1 | 5 | 2 | 5 | 1 | 5 | 21 | ||||||||||
| Manitoba | 0 | 0 | 0 | 0 | 0 | 0 | 0 | 0 | 0 | 0 | 0 | 0 | 0 | 0 | 0 | 0 | 0 | 0 | 1 | 1 | 2 | 1 | 5 | ||||||||||
| Saskatchewan | 0 | 0 | 0 | 0 | 0 | 0 | 0 | 0 | 0 | 0 | 0 | 0 | 0 | 0 | 0 | 0 | 0 | 0 | 0 | 0 | N/AFootnote * | N/AFootnote * | 0 | ||||||||||
| Alberta | 0 | 0 | 0 | 0 | 0 | 0 | 0 | 0 | 0 | 0 | 0 | 0 | 0 | 0 | 0 | 0 | 0 | 0 | 0 | 0 | 0 | 0 | 0 | ||||||||||
| British Columbia | 0 | 0 | 0 | 0 | 0 | 0 | 0 | 0 | 0 | 0 | 0 | 0 | 0 | 0 | 0 | 0 | 0 | 0 | 0 | 0 | 0 | 0 | 0 | ||||||||||
| Yukon Territory | 0 | 0 | 0 | 0 | 0 | 0 | 0 | 0 | 0 | 0 | 0 | 0 | 0 | 0 | 0 | 0 | 0 | 0 | 0 | 0 | 0 | 0 | 0 | ||||||||||
| Northwest Territory | 0 | 0 | 0 | 0 | 0 | 0 | 0 | 0 | 0 | 0 | 0 | 0 | 0 | 0 | 0 | 0 | 0 | 0 | 0 | 0 | 0 | 0 | 0 | ||||||||||
| Nunavut | 0 | 0 | 0 | 0 | 0 | 0 | 0 | 0 | 0 | 0 | 0 | 0 | 0 | 0 | 0 | 0 | 0 | 0 | 0 | 0 | 0 | 0 | 0 | ||||||||||
| Total | 0 | 0 | 0 | 0 | 0 | 0 | 0 | 0 | 0 | 0 | 0 | 1 | 0 | 2 | 1 | 0 | 2 | 7 | 4 | 8 | 9 | 10 | 44 | ||||||||||
| Week 38: Sept 20 to Sept 26, 2015 | ||||||
|---|---|---|---|---|---|---|
| West Nile virus neurological syndrome | West Nile virus non-neurological syndrome | Unclassified/unspecified | Total clinical casesTable 2 Footnote 1 | Number of travel-related casesTable 2 Footnote 2 | West Nile virus asymptomatic infectionTable 2 Footnote 3 | |
Footnotes
|
||||||
| Newfoundland and Labrador | 0 | 0 | 0 | 0 | 0 | 0 |
| Prince Edward Island | 0 | 0 | 0 | 0 | 0 | 0 |
| Nova Scotia | 0 | 0 | 0 | 0 | 0 | 0 |
| New Brunswick | 0 | 0 | 0 | 0 | 0 | 0 |
| Quebec | 3 | 0 | 0 | 3 | 0 | 1 |
| Ontario | 1 | 4 | 0 | 5 | 0 | 0 |
| Manitoba | 0 | 1 | 0 | 1 | 0 | 0 |
| Saskatchewan | 0 | 0 | 0 | 0 | 0 | 0 |
| Alberta | 0 | 0 | 0 | 0 | 0 | 0 |
| British Columbia | 0 | 0 | 0 | 0 | 0 | 0 |
| Yukon Territory | 0 | 0 | 0 | 0 | 0 | 0 |
| Northwest Territory | 0 | 0 | 0 | 0 | 0 | 0 |
| Nunavut | 0 | 0 | 0 | 0 | 0 | 0 |
| Total | 4 | 5 | 0 | 9 | 0 | 1 |
| Year to date: January 1 to Sept 26, 2015 | ||||||
| Newfoundland and Labrador | 0 | 0 | 0 | 0 | 0 | 0 |
| Prince Edward Island | 0 | 0 | 0 | 0 | 0 | 0 |
| Nova Scotia | 0 | 0 | 0 | 0 | 0 | 0 |
| New Brunswick | 0 | 0 | 0 | 0 | 0 | 0 |
| Quebec | 10 | 4 | 0 | 14 | 1 | 4 |
| Ontario | 7 | 13 | 1 | 21 | 4 | 0 |
| Manitoba | 1 | 4 | 0 | 5 | 0 | 0 |
| Saskatchewan | 0 | 0 | 0 | 0 | 0 | 0 |
| Alberta | 0 | 0 | 0 | 0 | 0 | 0 |
| British Columbia | 0 | 0 | 0 | 0 | 0 | 0 |
| Yukon Territory | 0 | 0 | 0 | 0 | 0 | 0 |
| Northwest Territory | 0 | 0 | 0 | 0 | 0 | 0 |
| Nunavut | 0 | 0 | 0 | 0 | 0 | 0 |
| Total | 18 | 21 | 1 | 40 | 5 | 4 |
FIGURE 2: West Nile Virus clinic al cases and asymptomatic infections by report week for selected years
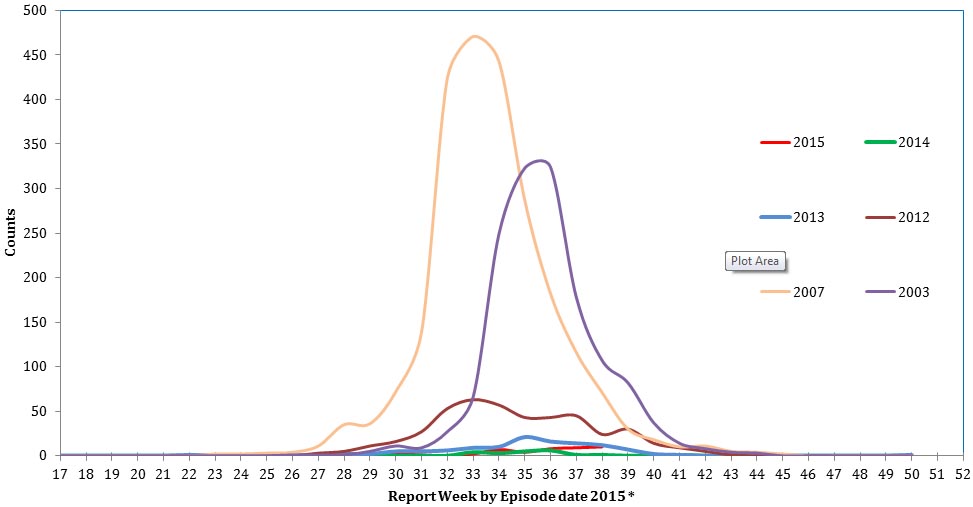
* West Nile virus clinical cases and asymptomatic infections are grouped by report week, based on episode date. Episode date could include one of the following: onset date, diagnosis date, lab sample date or reporting date.
| Report week | |||||||||||||||||||||||||||||||
|---|---|---|---|---|---|---|---|---|---|---|---|---|---|---|---|---|---|---|---|---|---|---|---|---|---|---|---|---|---|---|---|
| 17 | 18 | 19 | 20 | 21 | 22 | 23 | 24 | 25 | 26 | 27 | 28 | 29 | 30 | 31 | 32 | 33 | 34 | 35 | 36 | 37 | 38 | 39 | 40 | 41 | 42 | 43 | 44 | 45 | 46 | 47 | |
Table 3 Footnotes
|
|||||||||||||||||||||||||||||||
| 2015 | 0 | 0 | 0 | 0 | 0 | 0 | 0 | 0 | 0 | 0 | 0 | 1 | 0 | 2 | 1 | 0 | 2 | 7 | 4 | 8 | 9 | 10 | |||||||||
| 2014 | 0 | 0 | 0 | 0 | 0 | 0 | 0 | 0 | 0 | 0 | 0 | 0 | 1 | 0 | 0 | 0 | 4Table 3 Footnote * | 3 | 5 | 6 | 1 | 1 | 0 | 0 | 1 | 0 | 0 | 0 | 0 | 0 | 0 |
| 2013 | 1 | 0 | 0 | 0 | 0 | 1 | 1 | 0 | 0 | 0 | 1 | 2 | 1 | 5 | 5 | 8 | 17 | 11 | 13 | 13 | 11 | 9 | 1 | 6 | 1 | 0 | 4 | 1 | 0 | 1 | 0 |
| 2012 | 1 | 0 | 0 | 0 | 0 | 0 | 0 | 0 | 0 | 0 | 3 | 5 | 11 | 16 | 27 | 53 | 63 | 57 | 43 | 43 | 45 | 24 | 30 | 14 | 9 | 5 | 1 | 0 | 0 | 0 | 0 |
| 2007 | 0 | 0 | 0 | 0 | 0 | 0 | 2 | 2 | 3 | 4 | 11 | 35 | 36 | 72 | 139 | 424 | 471 | 443 | 287 | 182 | 116 | 71 | 30 | 18 | 10 | 11 | 5 | 4 | 2 | 0 | 0 |
| 2005 | 0 | 0 | 0 | 0 | 0 | 0 | 0 | 0 | 0 | 0 | 0 | 0 | 0 | 0 | 4 | 4 | 11 | 28 | 28 | 38 | 45 | 27 | 15 | 7 | 12 | 3 | 3 | 1 | 0 | 0 | 0 |
| 2003 | 0 | 0 | 0 | 0 | 0 | 0 | 0 | 0 | 0 | 1 | 1 | 1 | 5 | 11 | 9 | 27 | 66 | 249 | 323 | 324 | 178 | 107 | 82 | 37 | 14 | 8 | 4 | 3 | 0 | 0 | 0 |
| Province / Territory | Report week of 2015 | ||||||||||||||||||||||||||
|---|---|---|---|---|---|---|---|---|---|---|---|---|---|---|---|---|---|---|---|---|---|---|---|---|---|---|---|
| 17 | 18 | 19 | 20 | 21 | 22 | 23 | 24 | 25 | 26 | 27 | 28 | 29 | 30 | 31 | 32 | 33 | 34 | 35 | 36 | 37 | 38 | 39 | 40 | 41 | 42 | Total | |
Table 4.1 Footnotes
|
|||||||||||||||||||||||||||
| Newfoundland and Labrador | 0 | 0 | 0 | 0 | 0 | 0 | 0 | 0 | 0 | 0 | 0 | 0 | 0 | 0 | 0 | 0 | 0 | 0 | 0 | 0 | 0 | 0 | 0 | ||||
| Prince Edward Island | 0 | 0 | 0 | 0 | 0 | 0 | 0 | 0 | 0 | 0 | 0 | 0 | 0 | 0 | 0 | 0 | 0 | 0 | 0 | 0 | 0 | 0 | 0 | ||||
| New Brunswick | 0 | 0 | 0 | 0 | 0 | 0 | 0 | 0 | 0 | 0 | 0 | 0 | 0 | 0 | 0 | 0 | 0 | 0 | 0 | 0 | 0 | 0 | 0 | ||||
| Nova Scotia | 0 | 0 | 0 | 0 | 0 | 0 | 0 | 0 | 0 | 0 | 0 | 0 | 0 | 0 | 0 | 0 | 0 | 0 | 0 | 0 | 0 | 0 | 0 | ||||
| Quebec | 0 | 0 | 0 | 0 | 0 | 0 | 0 | 0 | 0 | 120 | 127 | 132 | 131 | 129 | 126 | 133 | 125 | 123 | 131 | 128 | 123 | N/ATable 4.1 Footnote 2 | 1528 | ||||
| Ontario | 0 | 0 | 0 | 0 | 0 | 180 | 356 | 852 | 886 | 954 | 1152 | 1216 | 1219 | 1222 | 1176 | 1168 | 1168 | 987 | 881 | 802 | 712 | 526 | 15457 | ||||
| Manitoba | 0 | 0 | 0 | 0 | 12 | 4 | 87 | 82 | 44 | 75 | 73 | 132 | 139 | 204 | 275 | 195 | 228 | 69 | 92 | 113 | 34 | N/ATable 4.1 Footnote 4 | 1858 | ||||
| Saskatchewan | 0 | 0 | 0 | 0 | 2 | 0 | 3 | 3 | 10 | 13 | 16 | 40 | 47 | 69 | 67 | 80 | 94 | 42 | 41 | N/ATable 4.1 Footnote 3 | N/ATable 4.1 Footnote 3 | N/ATable 4.1 Footnote 3 | 527 | ||||
| Alberta | 0 | 0 | 0 | 0 | 0 | 0 | 0 | 0 | 0 | 0 | 0 | 0 | 0 | 0 | 0 | 0 | 0 | 0 | 0 | 0 | 0 | 0 | 0 | ||||
| British Columbia | 0 | 0 | 0 | 0 | 0 | 0 | 0 | 0 | 0 | 0 | 0 | 0 | 0 | 0 | 0 | 0 | 0 | 0 | 0 | 0 | 0 | 0 | 0 | ||||
| Yukon Territory | 0 | 0 | 0 | 0 | 0 | 0 | 0 | 0 | 0 | 0 | 0 | 0 | 0 | 0 | 0 | 0 | 0 | 0 | 0 | 0 | 0 | 0 | 0 | ||||
| Northwest Territory | 0 | 0 | 0 | 0 | 0 | 0 | 0 | 0 | 0 | 0 | 0 | 0 | 0 | 0 | 0 | 0 | 0 | 0 | 0 | 0 | 0 | 0 | 0 | ||||
| Nunavut | 0 | 0 | 0 | 0 | 0 | 0 | 0 | 0 | 0 | 0 | 0 | 0 | 0 | 0 | 0 | 0 | 0 | 0 | 0 | 0 | 0 | 0 | 0 | ||||
| Total | 0 | 0 | 0 | 0 | 14 | 184 | 446 | 937 | 940 | 1162 | 1368 | 1520 | 1536 | 1624 | 1644 | 1576 | 1615 | 1221 | 1145 | 1043 | 869 | 526 | 19370 | ||||
| Province | Year to date: January 1 to Sept 26, 2015 | ||
|---|---|---|---|
| Number of positive mosquito pools | Number of mosquito pools tested | Percentage of positive mosquito pools (%) | |
| Quebec | 22 | 1528 | 1.44 |
| Ontario | 94 | 15457 | 0.61 |
| Manitoba | 30 | 1858 | 1.61 |
| Saskatchewan | 16 | 527 | 3.04 |
| Total | 162 | 19370 | 0.84 |
FIGURE 3: Reported number of dead birds testing positive for West Nile Virus by Province/Territory and by report week, 2015 season*
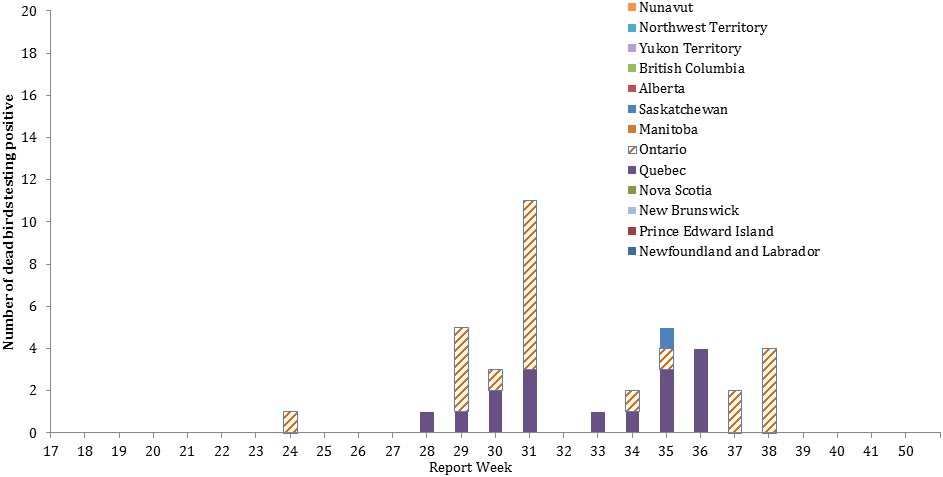
* Data from the Canadian Wildlife Health Cooperative and the Quebec Ministry of Health and Social Services
|
Report week of 2015 | |||||||||||||||||||||||||||||||
|---|---|---|---|---|---|---|---|---|---|---|---|---|---|---|---|---|---|---|---|---|---|---|---|---|---|---|---|---|---|---|---|---|
| 17 | 18 | 19 | 20 | 21 | 22 | 23 | 24 | 25 | 26 | 27 | 28 | 29 | 30 | 31 | 32 | 33 | 34 | 35 | 36 | 37 | 38 | 39 | 40 | 41 | 42 | 43 | 44 | 45 | 46 | 47 | Total | |
Table 5 Footnotes
|
||||||||||||||||||||||||||||||||
| Newfoundland and Labrador | 0 | 0 | 0 | 0 | 0 | 0 | 0 | 0 | 0 | 0 | 0 | 0 | 0 | 0 | 0 | 0 | 0 | 0 | 0 | 0 | 0 | 0 | 0 | |||||||||
| Prince Edward Island | 0 | 0 | 0 | 0 | 0 | 0 | 0 | 0 | 0 | 0 | 0 | 0 | 0 | 0 | 0 | 0 | 0 | 0 | 0 | 0 | 0 | 0 | 0 | |||||||||
| New Brunswick | 0 | 0 | 0 | 0 | 0 | 0 | 0 | 0 | 0 | 0 | 0 | 0 | 0 | 0 | 0 | 0 | 0 | 0 | 0 | 0 | 0 | 0 | 0 | |||||||||
| Nova Scotia | 0 | 0 | 0 | 0 | 0 | 0 | 0 | 0 | 0 | 0 | 0 | 0 | 0 | 0 | 0 | 0 | 0 | 0 | 0 | 0 | 0 | 0 | 0 | |||||||||
| Quebec | 0 | 0 | 0 | 0 | 0 | 0 | 0 | 0 | 0 | 0 | 0 | 1 | 1 | 2 | 3 | 0 | 1 | 1 | 3 | 4 | 0 | 0 | 16 | |||||||||
| Ontario | 0 | 0 | 0 | 0 | 0 | 0 | 0 | 1 | 0 | 0 | 0 | 0 | 4 | 1 | 8 | 0 | 0 | 1 | 1 | 0 | 2 | 4 | 22 | |||||||||
| Manitoba | 0 | 0 | 0 | 0 | 0 | 0 | 0 | 0 | 0 | 0 | 0 | 0 | 0 | 0 | 0 | 0 | 0 | 0 | 0 | 0 | 0 | 0 | 0 | |||||||||
| Saskatchewan | 0 | 0 | 0 | 0 | 0 | 0 | 0 | 0 | 0 | 0 | 0 | 0 | 0 | 0 | 0 | 0 | 0 | 0 | 1 | 0 | 0 | 0 | 1 | |||||||||
| Alberta | 0 | 0 | 0 | 0 | 0 | 0 | 0 | 0 | 0 | 0 | 0 | 0 | 0 | 0 | 0 | 0 | 0 | 0 | 0 | 0 | 0 | 0 | 0 | |||||||||
| British Columbia | 0 | 0 | 0 | 0 | 0 | 0 | 0 | 0 | 0 | 0 | 0 | 0 | 0 | 0 | 0 | 0 | 0 | 0 | 0 | 0 | 0 | 0 | 0 | |||||||||
| Yukon Territory | 0 | 0 | 0 | 0 | 0 | 0 | 0 | 0 | 0 | 0 | 0 | 0 | 0 | 0 | 0 | 0 | 0 | 0 | 0 | 0 | 0 | 0 | 0 | |||||||||
| Northwest Territory | 0 | 0 | 0 | 0 | 0 | 0 | 0 | 0 | 0 | 0 | 0 | 0 | 0 | 0 | 0 | 0 | 0 | 0 | 0 | 0 | 0 | 0 | 0 | |||||||||
| Nunavut | 0 | 0 | 0 | 0 | 0 | 0 | 0 | 0 | 0 | 0 | 0 | 0 | 0 | 0 | 0 | 0 | 0 | 0 | 0 | 0 | 0 | 0 | 0 | |||||||||
| Total | 0 | 0 | 0 | 0 | 0 | 0 | 0 | 1 | 0 | 0 | 0 | 1 | 5 | 3 | 11 | 0 | 1 | 2 | 5 | 4 | 2 | 4 | 39 | |||||||||
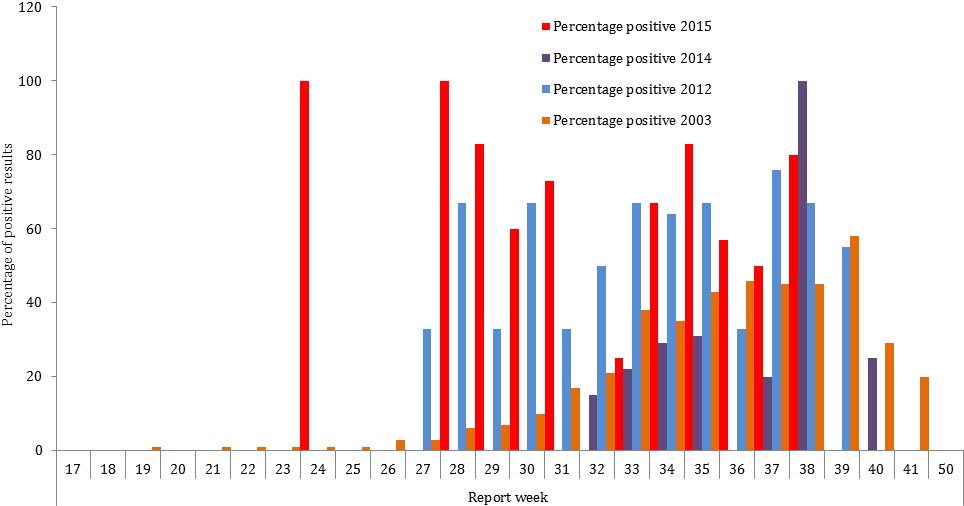
FIGURE 4: Percentage of dead birds testing positive for West Nile Virus in the 2015 season by report week, as compared to the 2003, 2012 and 2014 seasons
| Report week | |||||||||||||||||||||||||||||||
|---|---|---|---|---|---|---|---|---|---|---|---|---|---|---|---|---|---|---|---|---|---|---|---|---|---|---|---|---|---|---|---|
| 17 | 18 | 19 | 20 | 21 | 22 | 23 | 24 | 25 | 26 | 27 | 28 | 29 | 30 | 31 | 32 | 33 | 34 | 35 | 36 | 37 | 38 | 39 | 40 | 41 | 42 | 43 | 44 | 45 | 46 | 47 | |
Table 6 Footnotes
|
|||||||||||||||||||||||||||||||
| Numbers positive 2015 | 0 | 0 | 0 | 0 | 0 | 0 | 0 | 1 | 0 | 0 | 0 | 1 | 5 | 3 | 11 | 0 | 1 | 2 | 5 | 4 | 2 | 4 | |||||||||
| Numbers tested 2015 | 0 | 0 | 0 | 0 | 0 | 0 | 0 | 1 | 0 | 0 | 1 | 1 | 6 | 5 | 15 | 7 | 4 | 3 | 6 | 7 | 4 | 5 | |||||||||
| Percentage positive 2015 | 0 | 0 | 0 | 0 | 0 | 0 | 0 | 100 | 0 | 0 | 0 | 100 | 83 | 60 | 73 | 0 | 25 | 67 | 83 | 57 | 50 | 80 | |||||||||
| Numbers positive 2014 | 0 | 0 | 0 | 0 | 0 | 0 | 0 | 0 | 0 | 0 | 0 | 0 | 0 | 0 | 0 | 2 | 2 | 2 | 4 | 0 | 2 | 3 | 0 | 1 | 0 | 0 | 0 | 0 | 0 | 0 | 0 |
| Numbers tested 2014 | 0 | 0 | 0 | 0 | 0 | 0 | 0 | 0 | 0 | 0 | 0 | 0 | 0 | 41Table 6 Footnote * | 10 | 13 | 9 | 7 | 13 | 6 | 10 | 3 | 1 | 4 | 2 | 1 | 0 | 0 | 0 | 0 | 0 |
| Percentage positive 2014 | 0 | 0 | 0 | 0 | 0 | 0 | 0 | 0 | 0 | 0 | 0 | 0 | 0 | 0 | 0 | 15 | 22 | 29 | 31 | 0 | 20 | 100 | 0 | 25 | 0 | 0 | 0 | 0 | 0 | 0 | 0 |
| Percentage positive 2012 | 0 | 0 | 0 | 0 | 0 | 0 | 0 | 0 | 0 | 0 | 33 | 67 | 33 | 67 | 33 | 50 | 67 | 64 | 67 | 33 | 67 | 67 | 55 | 0 | 0 | 0 | 0 | 0 | 0 | 0 | 0 |
| Percentage positive 2003 | 0 | 0 | 1 | 0 | 1 | 1 | 1 | 1 | 1 | 3 | 3 | 6 | 7 | 10 | 17 | 21 | 38 | 35 | 43 | 46 | 45 | 45 | 58 | 29 | 20 | 15 | 8 | 0 | 0 | 0 | 0 |
Page details
- Date modified: