
West Nile virus and other mosquito-borne diseases national surveillance report - August 13 to August 19, 2017 (Week 33)
Alternative Formats
Related Topics
West Nile Virus
Canada
Humans
During week 33, August 13 to August 19, 2017, Ontario reported one additional clinical case of West Nile virus (WNv). Ontario also reported an additional five cases with episode dates dating back to week 28.
As of week 33, fifteen cases (ON=14, BC=1) have been reported to the Public Health Agency of Canada (PHAC). Of the fourteen cases in Ontario, there are twelve clinical cases (confirmed or probable) and two asymptomatic infections. Four cases in Ontario are travel-related. The one case in British Columbia was reported as an asymptomatic infection.
Mosquitoes
As of initial surveillance, 11,470 mosquito pools have been tested for WNv in Canada: Québec (735), Ontario (9,516), Manitoba (872), and Saskatchewan (347).
A total of 322 positive pools of WNv have been found in the following four provinces: 264 in Ontario [Brant County (2), Chatham-Kent (3), Durham Region (7), Eastern Ontario (3), Halton Region (24), Hamilton (19), Haliburton-Kwartha-Pine Ridge District (1), Hastings and Prince Edward Countries (9), Huron County (2), Kingston-Frontenac and Lennox and Addington (2), Lambton (1), Middlesex-London (4), Niagara Region (8), Northwestern (1), Ottawa (15), Oxford County (1), Peel (62), Perth District (5), Peterborough County-City (1), Renfrew County and District (2), Simcoe Muskoka District (1), Toronto (48), Waterloo (3), Wellington-Dufferin-Guelph (2), Windsor-Essex County (25), and York Regional (13)]; Thirty-seven in Manitoba [(Winnipeg (12), Southern (4), Interlake Eastern (7), and Prairie Mountain (14)]; Thirteen in Québec [Capitale-Nationale (1), Montérégie (7), Montréal (3), and Outaouais (2)]; and Eight in Saskatchewan.
Birds
As of week 33, the Canadian Wildlife Health Cooperative has tested eighty-four dead birds for WNv [Quebec (49), Ontario (26), Saskatchewan (5), Manitoba (2) and British Columbia (2)]. Of these, fifty-eight were positive: thirty-eight in Quebec [Chambly (1), Drummondville (1), Lachine (1), Lac-Supérieur (1), Laval (1), L'Avenir (1), Mascouche (2), Montréal (3), Mont Royal (1), Pointe-Claire (1), Repentigny (1), Rigaud (1), Rivière-Rouge (2), Rosemère (1), Saint-Ambroise (1), Saint-Colomban (1), Saint-Côme (2), Sainte-Madeleine (1), Sainte-Mélanie (1), Saint-Félix-de-Valois (1), Saint-Hippolyte (1), Saint-Hyacinthe (1), Saint Jean-de-Martha (1), Saint-Jean-des-Piles (1), Saint-Jérôme (1), Saint-Lambert (2), Saint-Ours (1), Sherbrooke (1), Terrebonne (1), Trois-Rivières (1), Victoriaville (1), Unknown (1)]; two in Manitoba [Winnipeg (2)]; fifteen in Ontario [Campbellville (6), Dryden (1), Guelph (1), Kingston (1), Oro-Medonte (1), Pickerel (1), Sarnia (1), Sudbury (1), Thunder Bay (2)]; and three in Saskatchewan [Saskatoon (3)].
Domestic Animals
As of week 33, two horses with WNv infection were reported to the Canadian Food Inspection Agency (CFIA): one in Alberta and the other in Saskatchewan. Also one pheasant with WNv infection located in Québec was reported to the CFIA.
United States and U.S. territories
As of August 22, 2017, 314 human cases of WNv have been reported by the Centers for Disease Control and Prevention (CDC). Of these, 190 (61%) were classified as neuroinvasive disease and 124 (39%) as non-neuroinvasive disease. In addition, seventy-one presumptive viremic blood donors have been identified.
Detailed information can be accessed via the CDC web site.
Europe and Neighbouring Countries
As of August 24, 2017, the European Centre for Disease Prevention and Control (ECDC) reported a total of sixty (confirmed and probable) cases of West Nile fever [Austria (4), Greece (37), Hungary (2), Israel (4), Italy (3), Romania (6), and Serbia (4)].
Detailed information can be accessed via the ECDC web site.
Other Mosquito-borne Diseases
Canada
Eastern Equine Encephalitis virus
No human cases of eastern equine encephalitis virus have been reported to the Public Health Agency of Canada in 2017.
California Serogroup virus
Since January 1, 2017, fifteen human cases of laboratory-confirmed cases/exposures of California serogroup virus were diagnosed by the National Microbiology Laboratory in Canada: Alberta (2), Saskatchewan (2), Manitoba (1), Ontario (1), Quebec (8), and Nova Scotia (1). Of these cases, eleven cases were further classified as Jamestown Canyon virus and one Snowshoe hare virus.
Figure 1: Geographic distribution of WNv human cases in Canada, as of August 19, 2017
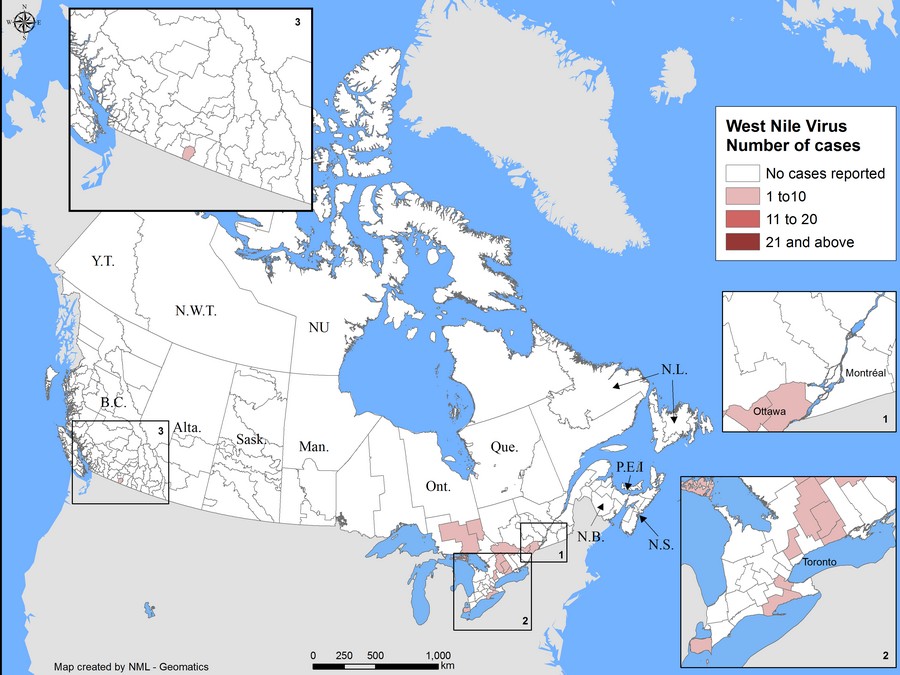
Figure 1 text equivalent
Map showing geographic distribution of human cases of WNv in Canada.
As of surveillance week 33, ending August 19, 2017, there are fifteen human cases of WNv in Canada; fourteen from Ontario and one from British Columbia.
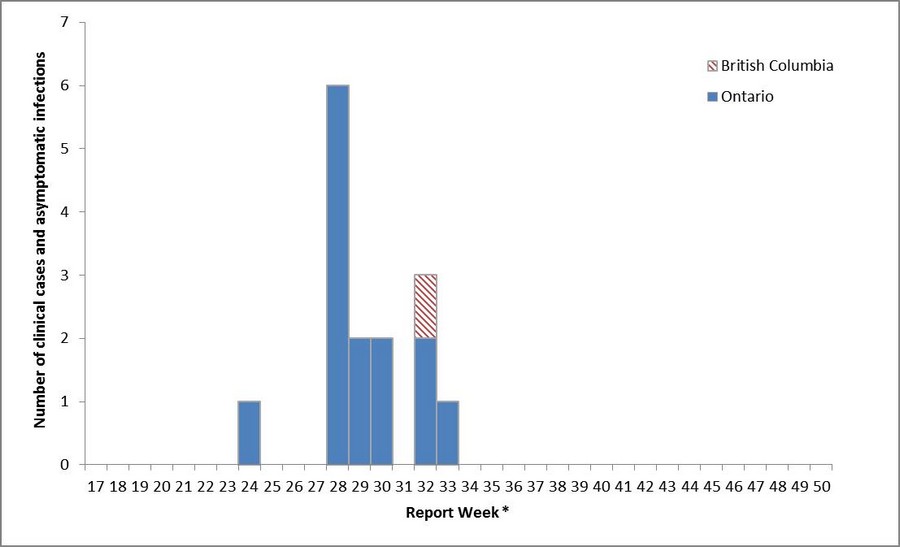
Figure 2: West Nile virus human clinical cases and asymptomatic infections by province/territory and by report week, as of August 19, 2017
- Figure 2 Footnote 1
-
WNv clinical cases and asymptomatic infections are grouped by report week, based on episode date. Episode date could include one of the following: onset date, diagnosis date, lab sample date or reporting date.
Figure 2 text equivalent
As of week 33, ending August 19, 2017, there are fifteen human clinical cases and asymptomatic infections associated with WNv in Canada.
| Report Week Figure 2 Footnote * | Total | ||||||||||||||||||||||||||||||||||
|---|---|---|---|---|---|---|---|---|---|---|---|---|---|---|---|---|---|---|---|---|---|---|---|---|---|---|---|---|---|---|---|---|---|---|---|
| 17 | 18 | 19 | 20 | 21 | 22 | 23 | 24 | 25 | 26 | 27 | 28 | 29 | 30 | 31 | 32 | 33 | 34 | 35 | 36 | 37 | 38 | 39 | 40 | 41 | 42 | 43 | 44 | 45 | 46 | 47 | 48 | 49 | 50 | ||
| British Columbia | 0 | 0 | 0 | 0 | 0 | 0 | 0 | 0 | 0 | 0 | 0 | 0 | 0 | 0 | 0 | 1 | 0 | 0 | 0 | 0 | 0 | 0 | 0 | 0 | 0 | 0 | 0 | 0 | 0 | 0 | 0 | 0 | 0 | 0 | 1 |
| Ontario | 0 | 0 | 0 | 0 | 0 | 0 | 0 | 1 | 0 | 0 | 0 | 6 | 2 | 2 | 0 | 2 | 1 | 0 | 0 | 0 | 0 | 0 | 0 | 0 | 0 | 0 | 0 | 0 | 0 | 0 | 0 | 0 | 0 | 0 | 14 |
| Total | 0 | 0 | 0 | 0 | 0 | 0 | 0 | 1 | 0 | 0 | 0 | 6 | 2 | 2 | 0 | 3 | 1 | 0 | 0 | 0 | 0 | 0 | 0 | 0 | 0 | 0 | 0 | 0 | 0 | 0 | 0 | 0 | 0 | 0 | 15 |
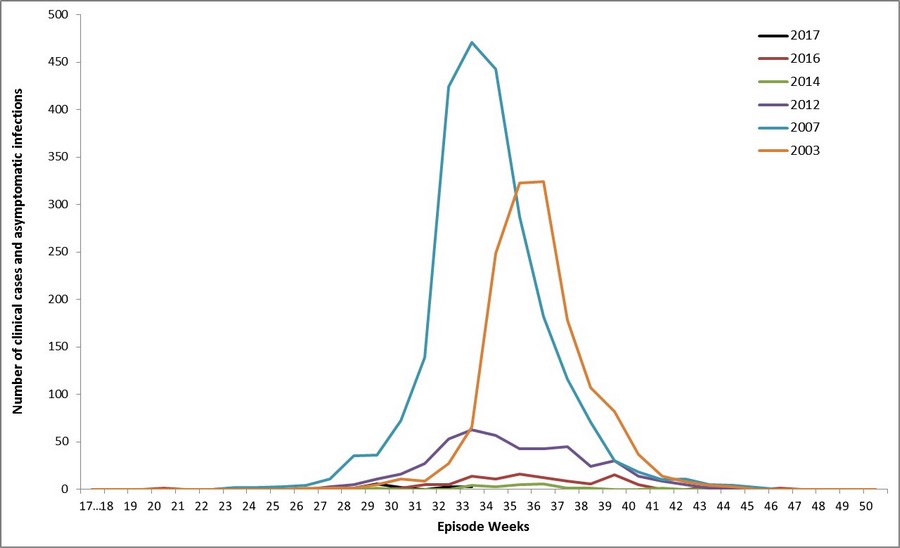
Figure 3: West Nile virus human clinical cases and asymptomatic infections by report week for selected years, in Canada
- Figure 3 Footnote 1
-
WNv clinical cases and asymptomatic infections are grouped by report week, based on episode date. Episode date could include one of the following: onset date, diagnosis date, lab sample date or reporting date.
Figure 3 text equivalent
| Report Week Figure 3 Footnote * | Total | ||||||||||||||||||||||||||||||||||
|---|---|---|---|---|---|---|---|---|---|---|---|---|---|---|---|---|---|---|---|---|---|---|---|---|---|---|---|---|---|---|---|---|---|---|---|
| 17 | 18 | 19 | 20 | 21 | 22 | 23 | 24 | 25 | 26 | 27 | 28 | 29 | 30 | 31 | 32 | 33 | 34 | 35 | 36 | 37 | 38 | 39 | 40 | 41 | 42 | 43 | 44 | 45 | 46 | 47 | 48 | 49 | 50 | ||
| 2017 | 0 | 0 | 0 | 0 | 0 | 0 | 0 | 1 | 0 | 0 | 0 | 6 | 2 | 2 | 0 | 3 | 1 | 15 | |||||||||||||||||
| 2016 | 0 | 0 | 0 | 1 | 0 | 0 | 0 | 1 | 0 | 0 | 0 | 0 | 0 | 1 | 5 | 5 | 14 | 11 | 16 | 12 | 9 | 6 | 15 | 5 | 0 | 0 | 3 | 1 | 0 | 1 | 0 | 0 | 0 | 0 | 106 |
| 2014 | 0 | 0 | 0 | 0 | 0 | 0 | 0 | 0 | 0 | 0 | 0 | 0 | 1 | 0 | 0 | 0 | 4 | 3 | 5 | 6 | 1 | 1 | 0 | 0 | 1 | 0 | 0 | 0 | 0 | 0 | 0 | 0 | 0 | 0 | 22 |
| 2012 | 0 | 0 | 0 | 0 | 0 | 0 | 1 | 0 | 0 | 0 | 3 | 5 | 11 | 16 | 27 | 53 | 63 | 57 | 43 | 43 | 45 | 24 | 30 | 14 | 9 | 5 | 1 | 0 | 0 | 0 | 0 | 0 | 0 | 0 | 450 |
| 2007 | 0 | 0 | 0 | 0 | 0 | 0 | 2 | 2 | 3 | 4 | 11 | 35 | 36 | 72 | 139 | 424 | 471 | 443 | 287 | 182 | 116 | 71 | 30 | 18 | 10 | 11 | 5 | 4 | 2 | 0 | 0 | 0 | 0 | 0 | 2378 |
| 2003 | 0 | 0 | 0 | 0 | 0 | 0 | 0 | 0 | 0 | 1 | 1 | 1 | 5 | 11 | 9 | 27 | 66 | 249 | 323 | 324 | 178 | 107 | 82 | 37 | 14 | 8 | 4 | 3 | 0 | 0 | 0 | 0 | 0 | 0 | 1450 |
| Province/Territory | Week 33: August 13 to August 19, 2017 | |||||
|---|---|---|---|---|---|---|
| WNv Cases | Total clinical casesTable 1 Footnote 1 | # of travel related WNv casesTable 1 Footnote 2 | # of asymptomatic WNv infectionsTable 1 Footnote 3 | |||
| Neurological syndrome | Non-Neurological syndrome | Unclassified / Unspecified | ||||
| Newfoundland and Labrador | 0 | 0 | 0 | 0 | 0 | 0 |
| Prince Edward Island | 0 | 0 | 0 | 0 | 0 | 0 |
| Nova Scotia | 0 | 0 | 0 | 0 | 0 | 0 |
| New Brunswick | 0 | 0 | 0 | 0 | 0 | 0 |
| Québec | 0 | 0 | 0 | 0 | 0 | 0 |
| Ontario | 0 | 0 | 1 | 1 | 0 | 0 |
| Manitoba | 0 | 0 | 0 | 0 | 0 | 0 |
| SaskatchewanTable 1 Footnote 4 | 0 | - | - | - | - | - |
| Alberta | 0 | 0 | 0 | 0 | 0 | 0 |
| British Columbia | 0 | 0 | 0 | 0 | 0 | 0 |
| Yukon Territory | 0 | 0 | 0 | 0 | 0 | 0 |
| Northwest Territories | 0 | 0 | 0 | 0 | 0 | 0 |
| Nunavut | 0 | 0 | 0 | 0 | 0 | 0 |
| Total | 0 | 0 | 1 | 1 | 0 | 0 |
| Year to date: January 1 to August 19, 2017 | ||||||
| Newfoundland and Labrador | 0 | 0 | 0 | 0 | 0 | 0 |
| Prince Edward Island | 0 | 0 | 0 | 0 | 0 | 0 |
| Nova Scotia | 0 | 0 | 0 | 0 | 0 | 0 |
| New Brunswick | 0 | 0 | 0 | 0 | 0 | 0 |
| Québec | 0 | 0 | 0 | 0 | 0 | 0 |
| Ontario | 5 | 2 | 5 | 12 | 4 | 2 |
| Manitoba | 0 | 0 | 0 | 0 | 0 | 0 |
| SaskatchewanTable 1 Footnote 4 | 0 | - | - | - | - | - |
| Alberta | 0 | 0 | 0 | 0 | 0 | 0 |
| British Columbia | 0 | 0 | 0 | 0 | 0 | 1 |
| Yukon Territory | 0 | 0 | 0 | 0 | 0 | 0 |
| Northwest Territories | 0 | 0 | 0 | 0 | 0 | 0 |
| Nunavut | 0 | 0 | 0 | 0 | 0 | 0 |
| Total | 5 | 2 | 5 | 12 | 4 | 3 |
|
||||||
| Province | Year to date: January 1 to August 12, 2017 | ||
|---|---|---|---|
| Number of positive mosquito pools | Number of mosquito pools tested | Percentage of positive mosquito pools (%) | |
| Quebec | 13 | 735 | 1.77 |
| Ontario | 264 | 9,516 | 2.77 |
| Manitoba | 37 | 872 | 4.24 |
| Saskatchewan | 8 | 347 | 2.31 |
| Alberta | - | - | - |
| British Columbia | - | - | - |
| Newfoundland and Labrador | - | - | - |
| Prince Edward Island | - | - | - |
| Nova Scotia | - | - | - |
| New Brunswick | - | - | - |
| Yukon Territory | - | - | - |
| Northwest Territory | - | - | - |
| Nunavut | - | - | - |
| Total | 322 | 11,470 | 2.81 |
| Province / Territory | Report week of 2017 | Total | |||||||||||||||||||||
|---|---|---|---|---|---|---|---|---|---|---|---|---|---|---|---|---|---|---|---|---|---|---|---|
| 19 | 20 | 21 | 22 | 23 | 24 | 25 | 26 | 27 | 28 | 29 | 30 | 31 | 32 | 33 | 34 | 35 | 36 | 37 | 38 | 39 | 40 | ||
| Québec | - | - | - | - | - | - | - | - | 147 | 147 | 147 | 147 | 0 | 147 | 0 | 735 | |||||||
| Ontario | 13 | 15 | 43 | 84 | 194 | 299 | 718 | 794 | 964 | 1,003 | 1,037 | 1,053 | 1,168 | 1,015 | 1,116 | 9,516 | |||||||
| Manitoba | - | - | - | - | 15 | 45 | 48 | 16 | 60 | 93 | 96 | 113 | 178 | 122 | 86 | 872 | |||||||
| Saskatchewan | - | - | - | - | 6 | 20 | 11 | 18 | 25 | 31 | 38 | 46 | 61 | 52 | 39 | 347 | |||||||
| Alberta | - | - | - | - | - | - | - | - | - | - | - | - | - | - | - | 0 | |||||||
| British Columbia | - | - | - | - | - | - | - | - | - | - | - | - | - | - | - | 0 | |||||||
| Newfoundland and Labrador | - | - | - | - | - | - | - | - | - | - | - | - | - | - | - | 0 | |||||||
| Prince Edward Island | - | - | - | - | - | - | - | - | - | - | - | - | - | - | - | 0 | |||||||
| Nova Scotia | - | - | - | - | - | - | - | - | - | - | - | - | - | - | - | 0 | |||||||
| New Brunswick | - | - | - | - | - | - | - | - | - | - | - | - | - | - | - | 0 | |||||||
| Yukon Territory | - | - | - | - | - | - | - | - | - | - | - | - | - | - | - | 0 | |||||||
| Northwest Territories | - | - | - | - | - | - | - | - | - | - | - | - | - | - | - | 0 | |||||||
| Nunavut | - | - | - | - | - | - | - | - | - | - | - | - | - | - | - | 0 | |||||||
| Total | 13 | 15 | 43 | 84 | 215 | 364 | 777 | 828 | 1,196 | 1,274 | 1,318 | 1,359 | 1,407 | 1,336 | 1,241 | 0 | 0 | 0 | 0 | 0 | 0 | 0 | 11,470 |
|
|||||||||||||||||||||||
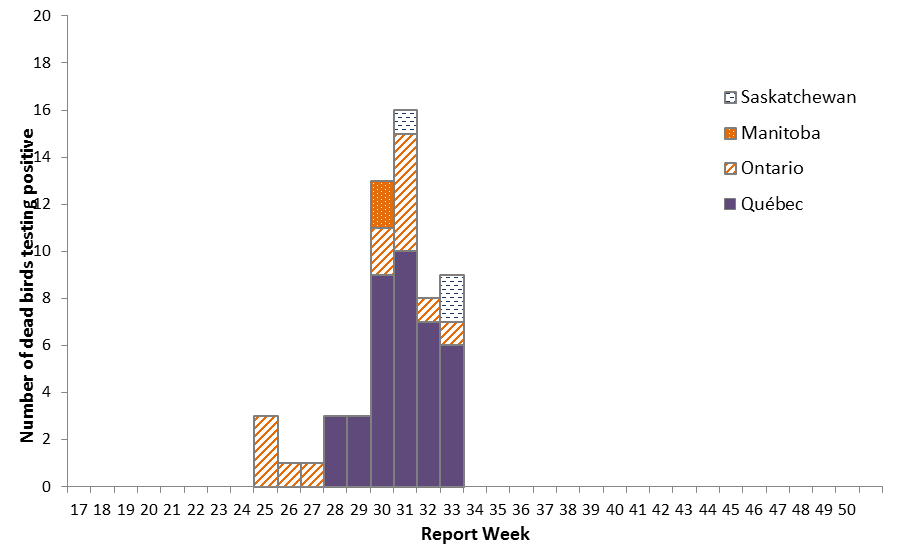
Figure 4: Reported number of dead birds tested positive for WNv by province/territory and by report week, 2017 season in CanadaFigure 4 Footnote 
- Figure 4 Footnote 1
-
Not all provinces are conducting dead bird surveillance as part of their own WNv surveillance program. However, WNv positive dead birds may be identified through the National Wildlife Disease Surveillance Program of the Canadian Wildlife Health Cooperative.
Text Equivalent
As of week 33, ending August 19 in 2017, there are fifty-eight WNv cases in birds, in Canada.
| Report Week | ||||||||||||||||||||||||||||||||||||||
|---|---|---|---|---|---|---|---|---|---|---|---|---|---|---|---|---|---|---|---|---|---|---|---|---|---|---|---|---|---|---|---|---|---|---|---|---|---|---|
| 14 | 15 | 16 | 17 | 18 | 19 | 20 | 21 | 22 | 23 | 24 | 25 | 26 | 27 | 28 | 29 | 30 | 31 | 32 | 33 | 34 | 35 | 36 | 37 | 38 | 39 | 40 | 41 | 42 | 43 | 44 | 45 | 46 | 47 | 48 | 49 | 50 | Total | |
| Manitoba | 0 | 0 | 0 | 0 | 0 | 0 | 0 | 0 | 0 | 0 | 0 | 0 | 0 | 0 | 0 | 0 | 2 | 0 | 0 | 0 | 0 | 0 | 0 | 0 | 0 | 0 | 0 | 0 | 0 | 0 | 0 | 0 | 0 | 0 | 0 | 0 | 0 | 2 |
| Ontario | 0 | 0 | 1 | 0 | 0 | 0 | 0 | 0 | 0 | 0 | 0 | 3 | 1 | 1 | 0 | 0 | 2 | 5 | 1 | 1 | 0 | 0 | 0 | 0 | 0 | 0 | 0 | 0 | 0 | 0 | 0 | 0 | 0 | 0 | 0 | 0 | 0 | 15 |
| Québec | 0 | 0 | 0 | 0 | 0 | 0 | 0 | 0 | 0 | 0 | 0 | 0 | 0 | 0 | 3 | 3 | 9 | 10 | 7 | 6 | 0 | 0 | 0 | 0 | 0 | 0 | 0 | 0 | 0 | 0 | 0 | 0 | 0 | 0 | 0 | 0 | 0 | 38 |
| Saskatchewan | 0 | 0 | 0 | 0 | 0 | 0 | 0 | 0 | 0 | 0 | 0 | 0 | 0 | 0 | 0 | 0 | 0 | 1 | 0 | 2 | 0 | 0 | 0 | 0 | 0 | 0 | 0 | 0 | 0 | 0 | 0 | 0 | 0 | 0 | 0 | 0 | 0 | 3 |
| Total | 0 | 0 | 1 | 0 | 0 | 0 | 0 | 0 | 0 | 0 | 0 | 3 | 1 | 1 | 3 | 3 | 13 | 16 | 8 | 9 | 0 | 0 | 0 | 0 | 0 | 0 | 0 | 0 | 0 | 0 | 0 | 0 | 0 | 0 | 0 | 0 | 0 | 58 |
Figure 5: Percentage of dead birds tested positive for WNv by report week in 2012, 2015, 2016, 2017 and number of dead birds tested positive, by report week, 2017, in CanadaFigure 5 Footnote 
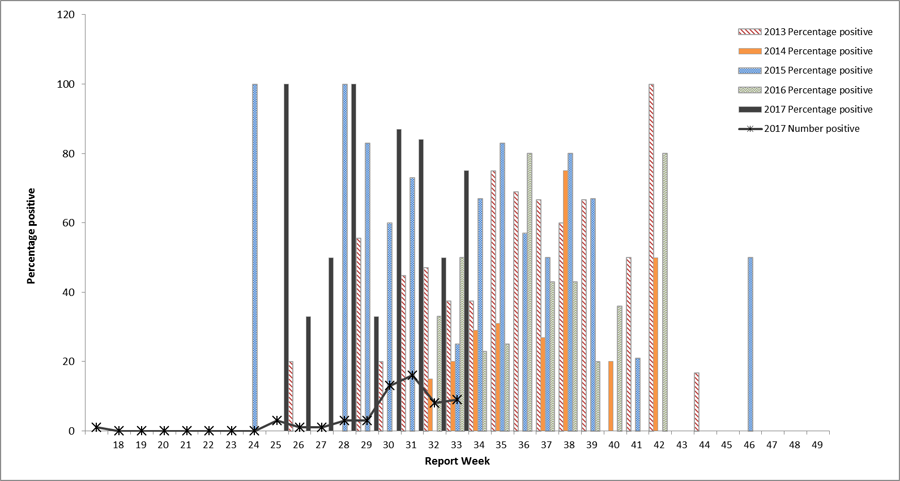
- Figure 5 Footnote 1
-
Not all provinces are conducting dead bird surveillance as part of their own WNv surveillance program. However, WNv positive dead birds may be identified through the National Wildlife Disease Surveillance Program of the Canadian Wildlife Health Cooperative.
Figure 5 text equivalent
| Report Weeks | Total | |||||||||||||||||||||||||||||||||
|---|---|---|---|---|---|---|---|---|---|---|---|---|---|---|---|---|---|---|---|---|---|---|---|---|---|---|---|---|---|---|---|---|---|---|
| 17 | 18 | 19 | 20 | 21 | 22 | 23 | 24 | 25 | 26 | 27 | 28 | 29 | 30 | 31 | 32 | 33 | 34 | 35 | 36 | 37 | 38 | 39 | 40 | 41 | 42 | 43 | 44 | 45 | 46 | 47 | 48 | 49 | ||
| 2013 Percentage positive | 0 | 0 | 0 | 0 | 0 | 0 | 0 | 0 | 0 | 20 | 0 | 0 | 56 | 20 | 45 | 47 | 38 | 38 | 75 | 69 | 67 | 60 | 67 | 0 | 50 | 100 | 0 | 17 | 0 | 0 | 0 | 0 | 0 | 43.1% |
| 2014 Percentage positive | 0 | 0 | 0 | 0 | 0 | 0 | 0 | 0 | 0 | 0 | 0 | 0 | 0 | 0 | 0 | 15 | 20 | 29 | 31 | 0 | 27 | 75 | 0 | 20 | 0 | 50 | 0 | 0 | 0 | 0 | 0 | 0 | 0 | 20.4% |
| 2015 Percentage positive | 0 | 0 | 0 | 0 | 0 | 0 | 0 | 100 | 0 | 0 | 0 | 100 | 83 | 60 | 73 | 0 | 25 | 67 | 83 | 57 | 50 | 80 | 67 | 0 | 21 | 0 | 0 | 0 | 0 | 50 | 0 | 0 | 0 | 51.0% |
| 2016 Percentage positive | 0 | 0 | 0 | 0 | 0 | 0 | 0 | 0 | 0 | 0 | 0 | 0 | 0 | 0 | 0 | 33 | 50 | 23 | 25 | 80 | 43 | 43 | 20 | 36 | 0 | 80 | 0 | 0 | 0 | 0 | 0 | 0 | 0 | 26.2% |
| 2017 Percentage positive | - | 0 | 0 | 0 | 0 | 0 | 0 | 0 | 100 | 33 | 50 | 100 | 33 | 87 | 84 | 50 | 75 | |||||||||||||||||
| 2017 Number positive | - | 0 | 0 | 0 | 0 | 0 | 0 | 0 | 3 | 1 | 1 | 4 | 3 | 13 | 16 | 4 | 3 | |||||||||||||||||