
Adverse Events Following Immunization (AEFI) Quarterly Report for 2014 – Q1
Safety assessment summary for this Quarter:
- No vaccine safety concerns were identified in Quarter 1 for 2014.
- All serious cases were reviewed and found either to be expected based on known vaccine-related adverse reactions or to have alternate explanations such as commonly acquired infection (upper or lower respiratory tract infection by non-vaccine preventable pathogens like Respiratory Syncytial Virus (RSV) or the common cold virus) or exposures to other agents, such as antibiotics, that can also cause adverse events.
- As in previous years the vast majority (over 90%) of AEFIs reported in the quarter were neither serious nor unexpected
Vaccines are closely monitored in Canada at all phases of the vaccine product 'life cycle' from discovery through market authorization (pre-market) and beyond, as people begin using them (post-market). Many stakeholders are involved in various activities related to vaccine safety assessment and monitoring including the federal government, provincial, territorial and local public health authorities, health care providers, vaccine industry and the public. The Public Health Agency of Canada (the Agency) conducts rigorous post-market safety surveillance through a national reporting system, the Canadian Adverse Events Following Immunization Surveillance System (CAEFISS).
The primary purpose of vigilant vaccine safety surveillance is to detect vaccine safety concerns which include a possible increase in the severity or frequency of expected reactions or occurrence of one or more unexpected events (i.e. an event that is not consistent with Canadian product information or labelling) that need further investigation. This allows immunization providers and public health immunization program providers to take public health action at the level of the individual (e.g. further investigation to confirm a diagnosis and determine possible causes, consultation to rule out allergy to one or more vaccine components, or even a decision not to give subsequent doses of vaccine) and/or the immunization program (e.g. investigation of a cluster of adverse events, review of procedures to ensure that vaccine storage requirements have been strictly followed, or even a change in policy to adopt a less reactogenic vaccine).The Agency also shares adverse event following immunization (AEFI) data with Health Canada, the vaccine regulator in Canada, to enable regulatory action (such as issuing communications to immunization providers or the public regarding the concern, testing of a given lot of vaccine or requiring additional information or investigation by the vaccine distributor) related to vaccines marketed in Canada.
This is the first of what will be regular vaccine safety surveillance quarterly reports published by the Agency summarizing CAEFISS data. This report summarizes all reports of adverse events following immunization (AEFI) received by the Agency in 2014 from Jan 1st to March 31st (Quarter 1), regardless of the date the vaccine was actually given.
The current quarterly data for 2014 are compared to an average of all reports received during the same quarter (Jan 1st to March 31st) in several years prior. For this quarterly report, the comparison is to the last three years (2011, 2012, and 2013). The Agency will also provide cumulative data in subsequent quarters along with the appropriate historic comparisons. Thus, the final year-end quarterly report (Q4) this year will include data for all of 2014.
NOTES on INTERPRETATION: An AEFI is defined as "any untoward medical occurrence which follows immunization and which does not necessarily have a causal relationship with the usage of the vaccine. The adverse event may be any unfavorable or unintended sign, abnormal laboratory finding, symptom or disease". AEFI reports submitted to the Public Health Agency of Canada represent a suspicion, opinion or observation by the reporter as opposed to an assertion or proof that the vaccine may have caused the event. For most events a clear causal relationship is difficult to establish. Additional limitations to AEFI report data include varied reporting standards and underreporting, lack of certainty regarding the diagnostic validity of a reported event, missing information regarding other potential causes and other reporting biases. In short, this information should not be used to estimate the incidence of adverse events.
Results highlighted for Quarter 1 of 2014
Cumulative counts included in this Quarterly Report (Q1) include reports received from January 1st to March 31st 2014 and comparisons are made to the average number of reports received in the same quarter over the previous three calendar years (2011-2013). The reports analysed were extracted from the CAEFISS database on 29-April-2014 by the Public Health Agency of Canada (the Agency).
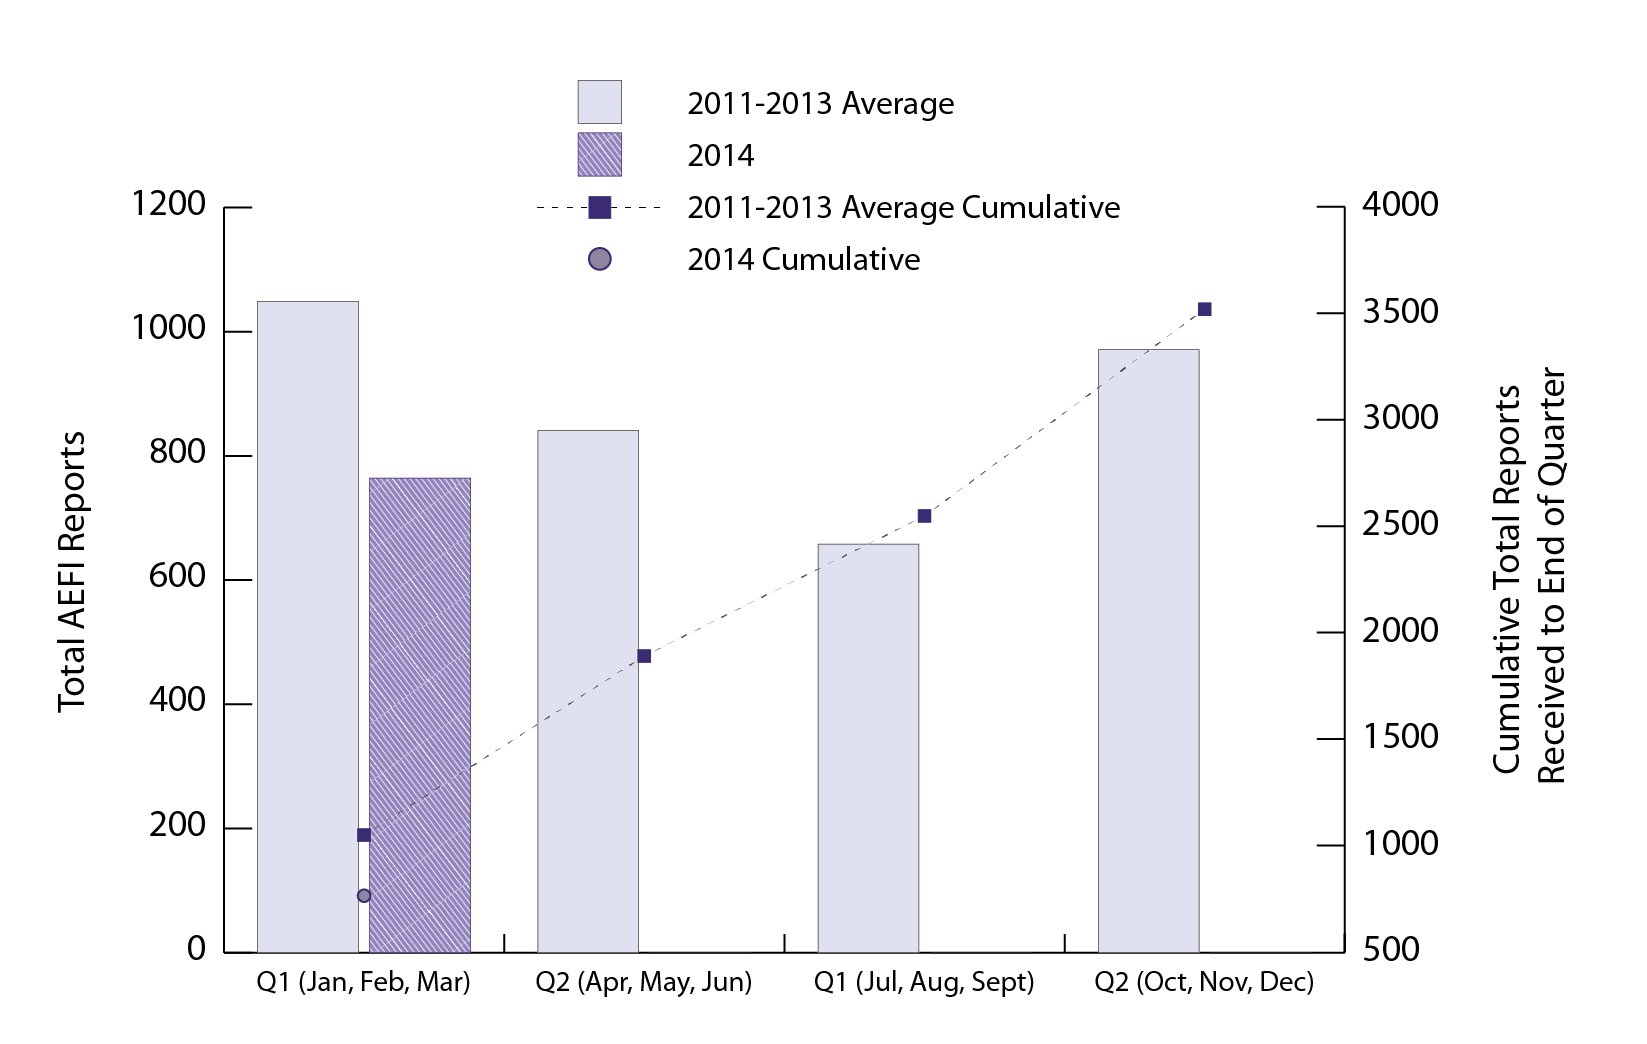
Figure 1: Total AEFI reports by calendar year quarter and cumulative to end of each Quarter: 2014 vs. average for 2011-2013
A total of 764 AEFI reports were received by the Agency in Q1 of 2014. During the same periods for 2011, 2012 and 2013, the Agency received an average of 1049 (range: 803-1258) AEFI reports. The drop in reporting totals for Q1 in 2014 relative to previous years is not unusual. From time to time, there are delays in report transmission from one or more provinces and territories to the Agency, primarily for technical reasons such as implementing a new electronic AEFI reporting system. In such cases the apparent drop in one quarter will be reflected by increased numbers in subsequent Quarters.
Text Equivalent
This is a combination bar and line graph. The bars show the total number of AEFI reports received each calendar quarter(Q) with Q1 encompassing January, February and March, Q2 April, May and Jun, Q3 July, August and September and Q4 October, November and December. The line shows the accumulated total reports to the end of each quarter. The primary y-axis on the left hand side of the graph is for the bar graph and shows the total count for each quarter, ranging from 0-1200. The secondary y-axis on the right hand side of the graph is for the line graph and shows the accumulated total count to the end of each quarter, ranging from 0 to 4000. The x-axis is quarter and ranges from Q1 to Q4. Two time periods are depicted on the graph. The main focus is for the current year of 2014, and the graph shows the totals received in Q1 only. Subsequent Q2, Q3 and Q4 reports to be published in the future will add totals for Q2, Q3 and Q4 of 2014 respectively. To provide a comparison the graph also shows an average of reports received in each Quarter for three prior years (2011, 2012 and 2013). All data points for the 2011 - 2013 average by individual quarter and cumulative to the end of the quarter are shown on the graph.
For Q1, 2014 the total reports received were 764 compared to the average number of reports received for Q1 in 2011, 2012 and 2013 which was 1049. For Q2, Q3 and Q4 respectively the averages for reports received in 2011, 2012 and 2013 were 841, 658 and 971 and cumulative to the end of Q2, Q3 and Q4 respectively were 1890, 2548 and 3519.
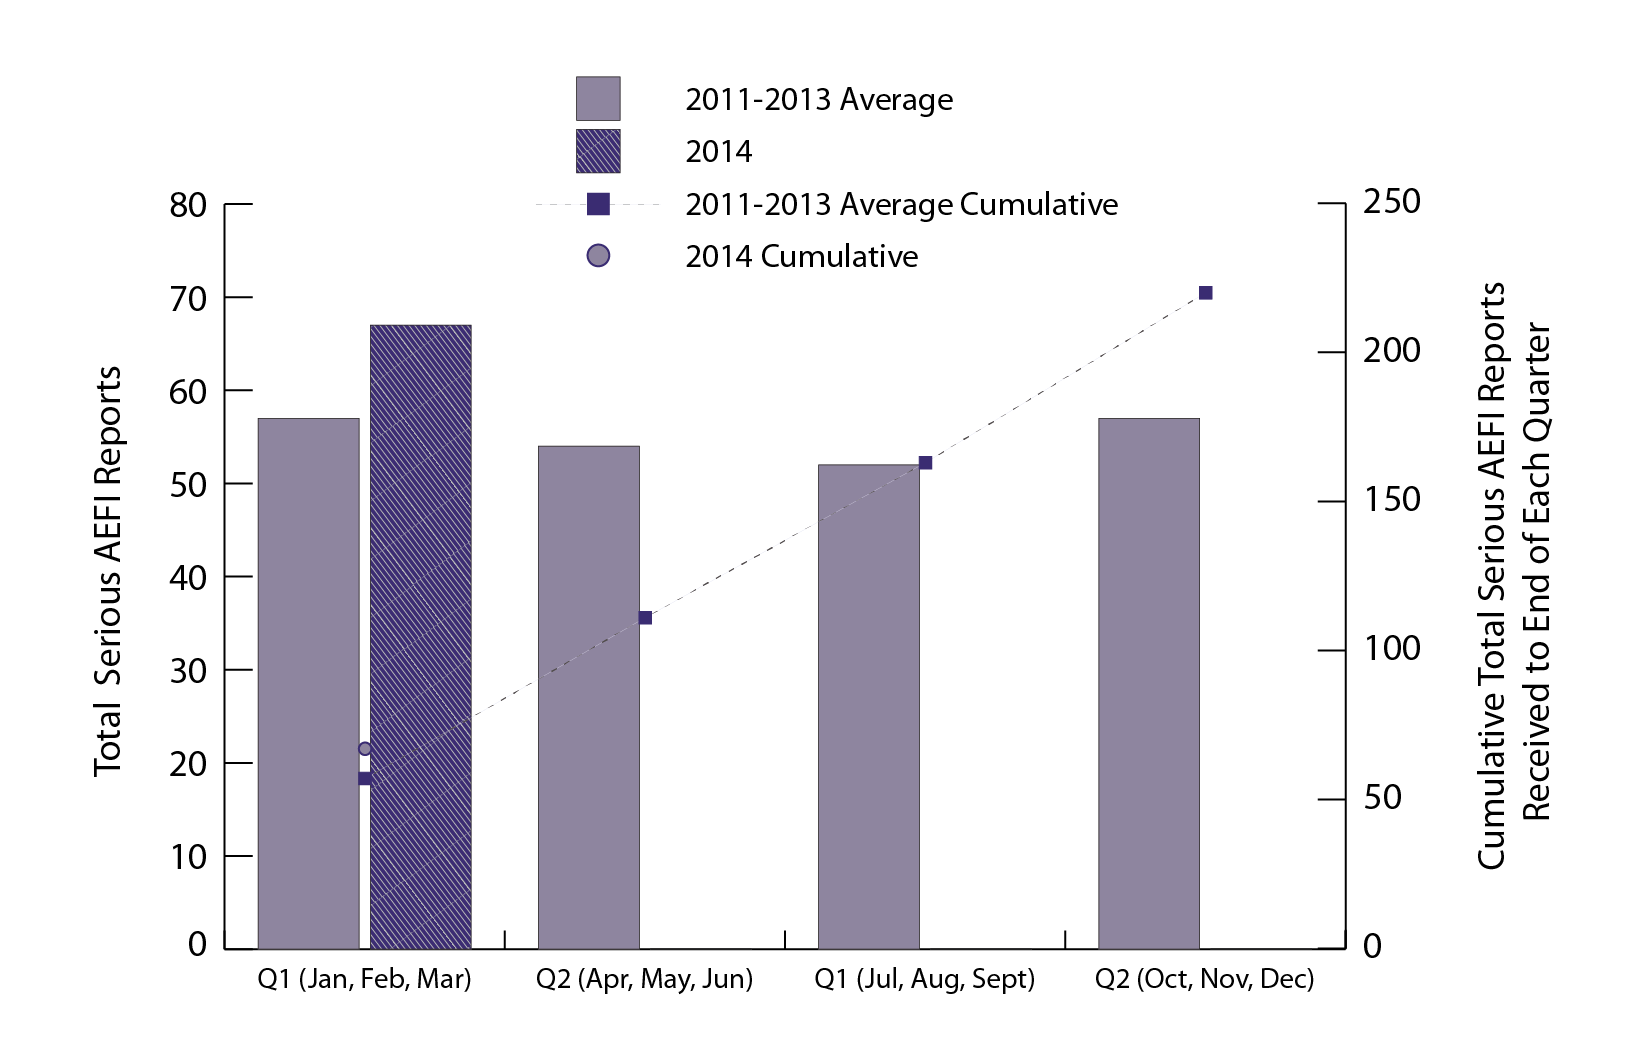
Figure 2: Total serious AEFI reports by calendar year Quarter and cumulative to end of each Quarter: 2014 vs. average for 2011-2013
A total of 67 serious AEFI reports (8.8% of all AEFI reports) were received by the Agency in Q1 of 2014. During the same periods for 2011, 2012 and 2013, the Agency received an average of 57 (range: 54-60) serious AEFI reports representing from 4.3-7.5% of all AEFI reports received in the same quarter for these years.
Text Equivalent
This is a combination bar and line graph. The bars show the total number of serious AEFI reports received each calendar quarter(Q) with Q1 encompassing January, February and March, Q2 April, May and Jun, Q3 July, August and September and Q4 October, November and December. The line shows the accumulated total reports to the end of each quarter. The primary y-axis on the left hand side of the graph is for the bar graph and shows the total count for each quarter, ranging from 0-80. The secondary y-axis on the right hand side of the graph is for the line graph and shows the total count to the end of each quarter, ranging from 0 to 250. The x-axis is quarter and ranges from Q1 to Q4. Two time periods are depicted on the graph. The main focus is for the current year of 2014, and the graph shows the totals received in Q1 only. Subsequent Q2, Q3 and Q4 reports to be published in the future will add totals for Q2, Q3 and Q4 of 2014 respectively. To provide a comparison the graph also shows an average of reports received in each Quarter for three prior years (2011, 2012 and 2013). All data points for the 2011 - 2013 average by individual quarter and cumulative to the end of the quarter are shown on the graph.
For Q1, 2014 the total reports received were 67 compared to the average number of reports received for Q1 in 2011, 2012 and 2013 which was 57. For Q2, Q3 and Q4 respectively the averages for reports received in 2011, 2012 and 2013 were 54, 52 and 57 and cumulative to the end of Q2, Q3 and Q4 respectively were 111, 163 and 220.
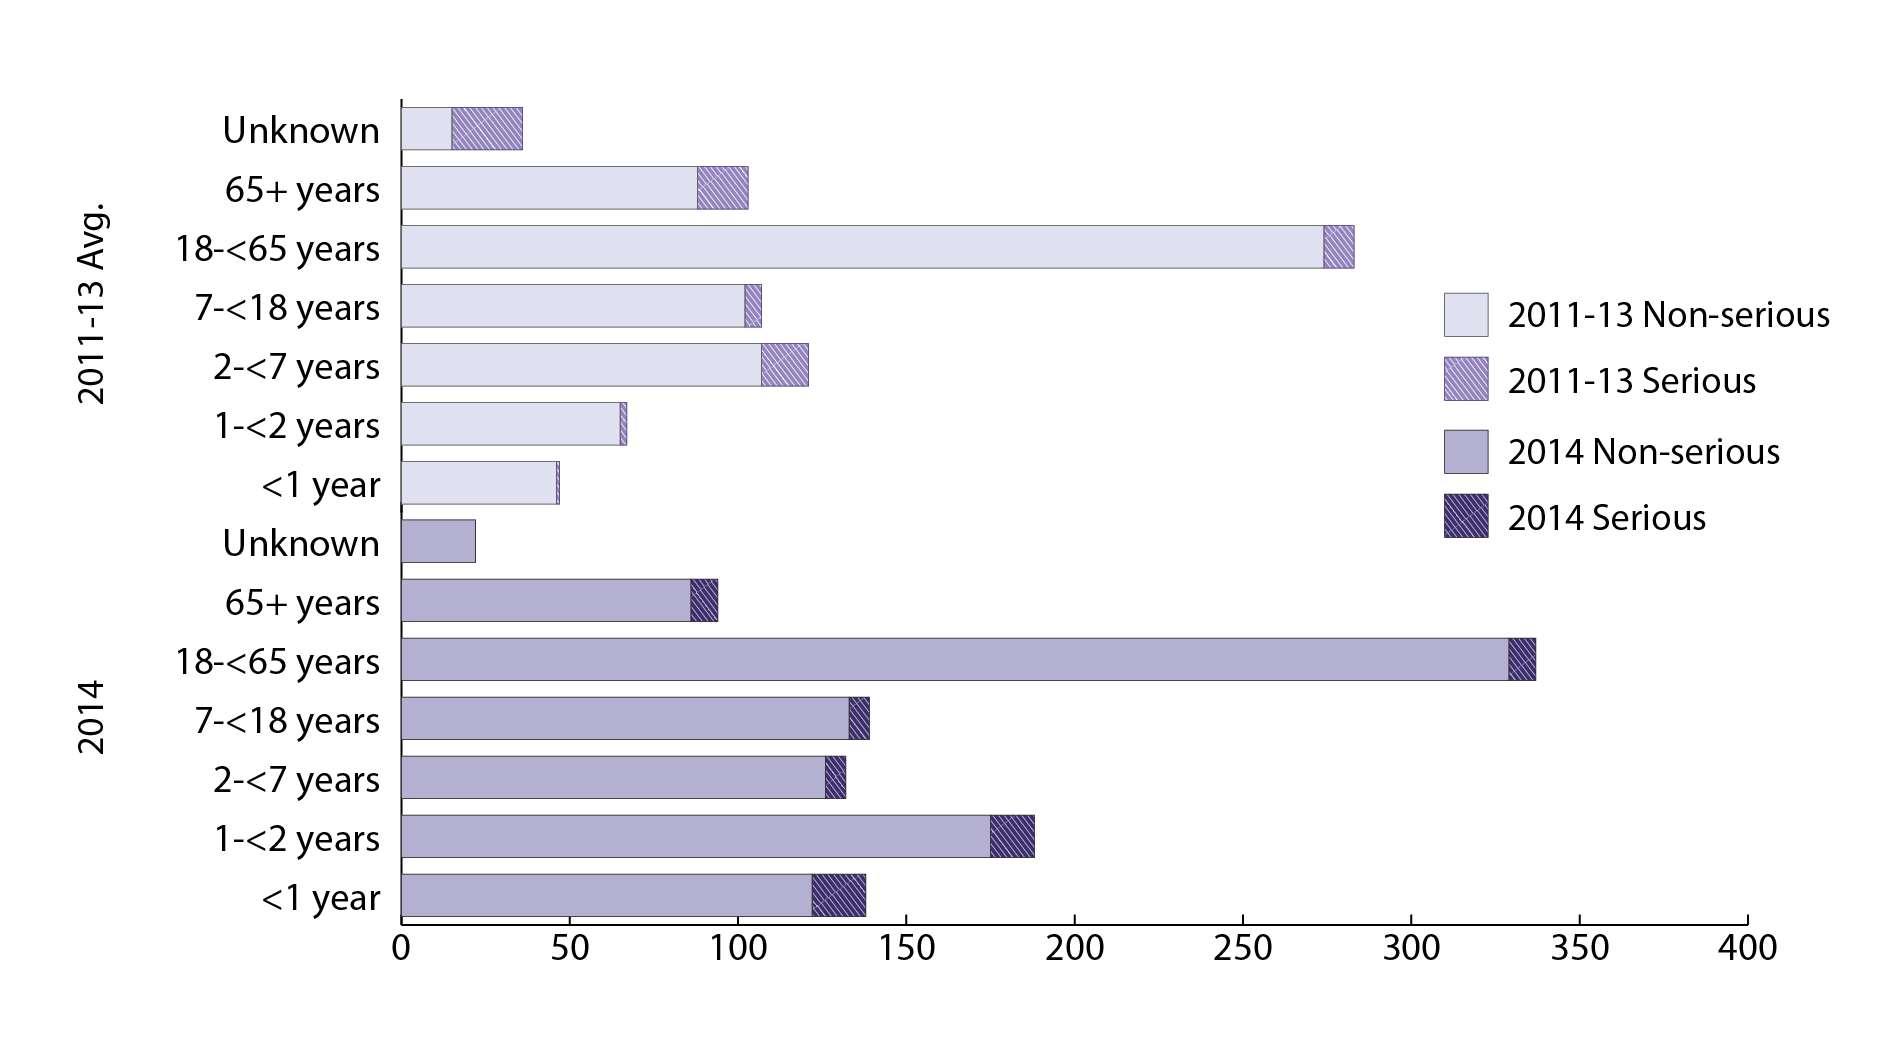
Figure 3: Age distribution for AEFIs reported in 1st Quarter: 2014 vs. average for 2011-2013
The age distribution for all AEFI and serious AEFI reports received in Q1 for 2014 was similar to that seen in previous years.
Text Equivalent
This is a bar graph that shows the total number of non-serious and serious AEFI reports received for specific age-groups by the end of the 1st quarter (January, February and March) of 2014 compared to an average of the 1st quarter for 2011, 2012 and 2013. The x-axis shows the total number of reports ranging from 0 to 400. The y-axis shows the specific age groups separately for 2014 and the 2011-2013 average.
The counts shown in the graph for non-serious/serious AEFI reports for each age group for a) Q1 of 2014 versus the b) Q1 average for 2011-2013 respectively are: <1 year: a) 46/21 versus b) 122/16; 1 to <2 yrs: a) 65/15 vs b) 175/13; 2 to <7 years: a) 107/9 versus b) 126/6; 7 to <18 years: a) 102/5 versus b) 133/6; 18 to <65 years: a) 274/14 versus b) 329/8; 65 years and older: a) 88/2 versus b) 86/8; and no identifiable age: a) 15/1 versus b) 22/0.
Figure 4: Most common vaccines identified in AEFIs reported in 1st Quarter: 2014 vs. average for 2011-2013
The vaccines implicated in AEFI reports for Q1 of 2014 reflected Canada's publicly funded immunization programs and there were no unusual increases in reporting frequency for any specific vaccine. As is typical of Q1, the majority of reports were for seasonal influenza vaccines related to the mass campaigns held each fall and early winter. As noted above (figure 1), the total reports submitted for several vaccines were lower in Q1 2014 relative to the same period average for 2011-2013. Most likely this is a delay in reporting, primarily for non-serious cases, and if so will be reflected by increased numbers in subsequent quarters.

Text Equivalent
This is a bar graph showing total numbers of non-serious and serious AEFI reports received for specific vaccines at the Public Health Agency during the first quarter (January, February and March) of 2014 versus the average of reports received during the first quarters of 2011, 2012 and 2013. The y-axis shows the number of reports, ranging from 0 to 450. The x-axis shows specific vaccine groups based on the antigenic content rather than specific brand.
The vaccine groups shown and the number of non-serious/serious AEFI reports received for each in a) Q1 for 2014 versus b) the average for Q1 for 2011, 2012 and 2013 respectively are: Rotavirus: a) 14/11 versus b) 28/3, DTaP-IPV-Hib: a) 44/16 versus b) 122/14; DTaP-HB-IPV-Hib: a) 14/6 versus b) 53/2; pneumococcal conjugate: a) 54/22 versus b) 172/21; meningococcal conjugate C: a) 62/9 versus b) 163/13; MMR: a) 45/9 versus b) 151/7; MMRV: a) 17/4 versus b) 28/7; Varicella: a) 25/1 versus b) 94/6; DTaP-IPV: a) 20/1 versus b) 36/1; Tdap-IPV: a) 15/1 versus b) 13/1; HPV: a) 18/3 versus b) 56/2; HB: a) 6/3 versus b) 28/1; Tdap: a) 50/1 versus b) 65/1; Influenza: a) 382/25 versus b) 388/16; Zoster: a) 20/0 versus b) 10/1; Pneumococcal polysaccharide: a) 55/4 versus b) 64/5.
Figures 5 & 6: AEFIs reported by main reason and seriousness
Classification of AEFIs for Report Purposes: all AEFI reports are reviewed daily by health professionals to assign a main reason for reporting and the associated severity. The classification adheres closely to the national AEFI reporting form in order to provide meaningful feedback to public health authorities, health professionals and the public regarding the adverse event reporting profile. The main categories used when reporting an AEFI, and those reflected on the graph below, are defined as:
- Reactions at or near the vaccination site: most reported events involve inflammation at or near the site of vaccination. Further details can be found in section 9(a) of the reporting form.
- Allergic or allergic-like events: the most severe allergic event, anaphylaxis, is rare (≤1 episode per 100,000 doses administered) Further details can be found in section 9(b) of the reporting form.
- Neurologic events: seizures are the most commonly reported neurologic event especially in infants and toddlers who are prone to have seizures in association with fever. Such events are reported in Canada relatively frequently because they are actively sought and reported by the IMPACT network. Further details can be found in section 9(c) of the reporting form.
- Rash only: to be classified as 'rash only', the rash is the only sign or symptom reported. This would include hives that onset any time after immunization but are accompanied by no other signs or symptoms. Hives are a frequent occurrence in childhood and a cause is often not found
- Other events specified on the CAEFISS report form: this could include other events such as persistent crying (continuous or unaltered crying ≥ 3 hours, intussesception, hypotonic-hyporesponsive episodes (HHE), Further details can be found in section 9(d) of the reporting form.
Events not clearly falling into one of the categories listed above are classified into one of four additional categories:
- Systemic events: these are primarily events involving many body systems often accompanied by fever. Any recognized syndromes are classified as systemic events and include such illnesses as Kawasaki syndrome, Steven-Johnson syndrome, Henoch-Schonlein purpura, fibromyalgia and serum sickness. In addition evidence for infection of one or more body parts (respiratory infection, bladder infection, etc.) are included in this category as are instances of rash that is non-allergic in origin and is accompanied by other signs and symptoms such as fever, cough and conjunctivitis. General symptoms such as fatigue, malaise, lethargy, headache, myalgias including influenza-like illnesses are classified as systemic events. Finally fever as the only adverse event reported is included in this category.
- Vaccination anxiety related events: this includes fainting (syncope) with or without seizure-like movements which may briefly accompany a fainting episode. Other events included in this category are clusters of events often seen within minutes of immunization indicative of anxiety such as pallor, shakiness, feeling cold, hyperventilation, etc.
- Miscellaneous other events: all other adverse events that don't fit into any of the above categories are captured as miscellaneous events. These may be further categorized by the predominant body system they fall under such as gastrointestinal, cardiac, genitourinary, etc.
- Vaccination error without an associated AEFI: on occasion reports are submitted of an error in immunization without any associated adverse event. Examples include use of an expired product or incorrect administration of a product (e.g. giving a vaccine into the muscle when it should have been injected subcutaneously).
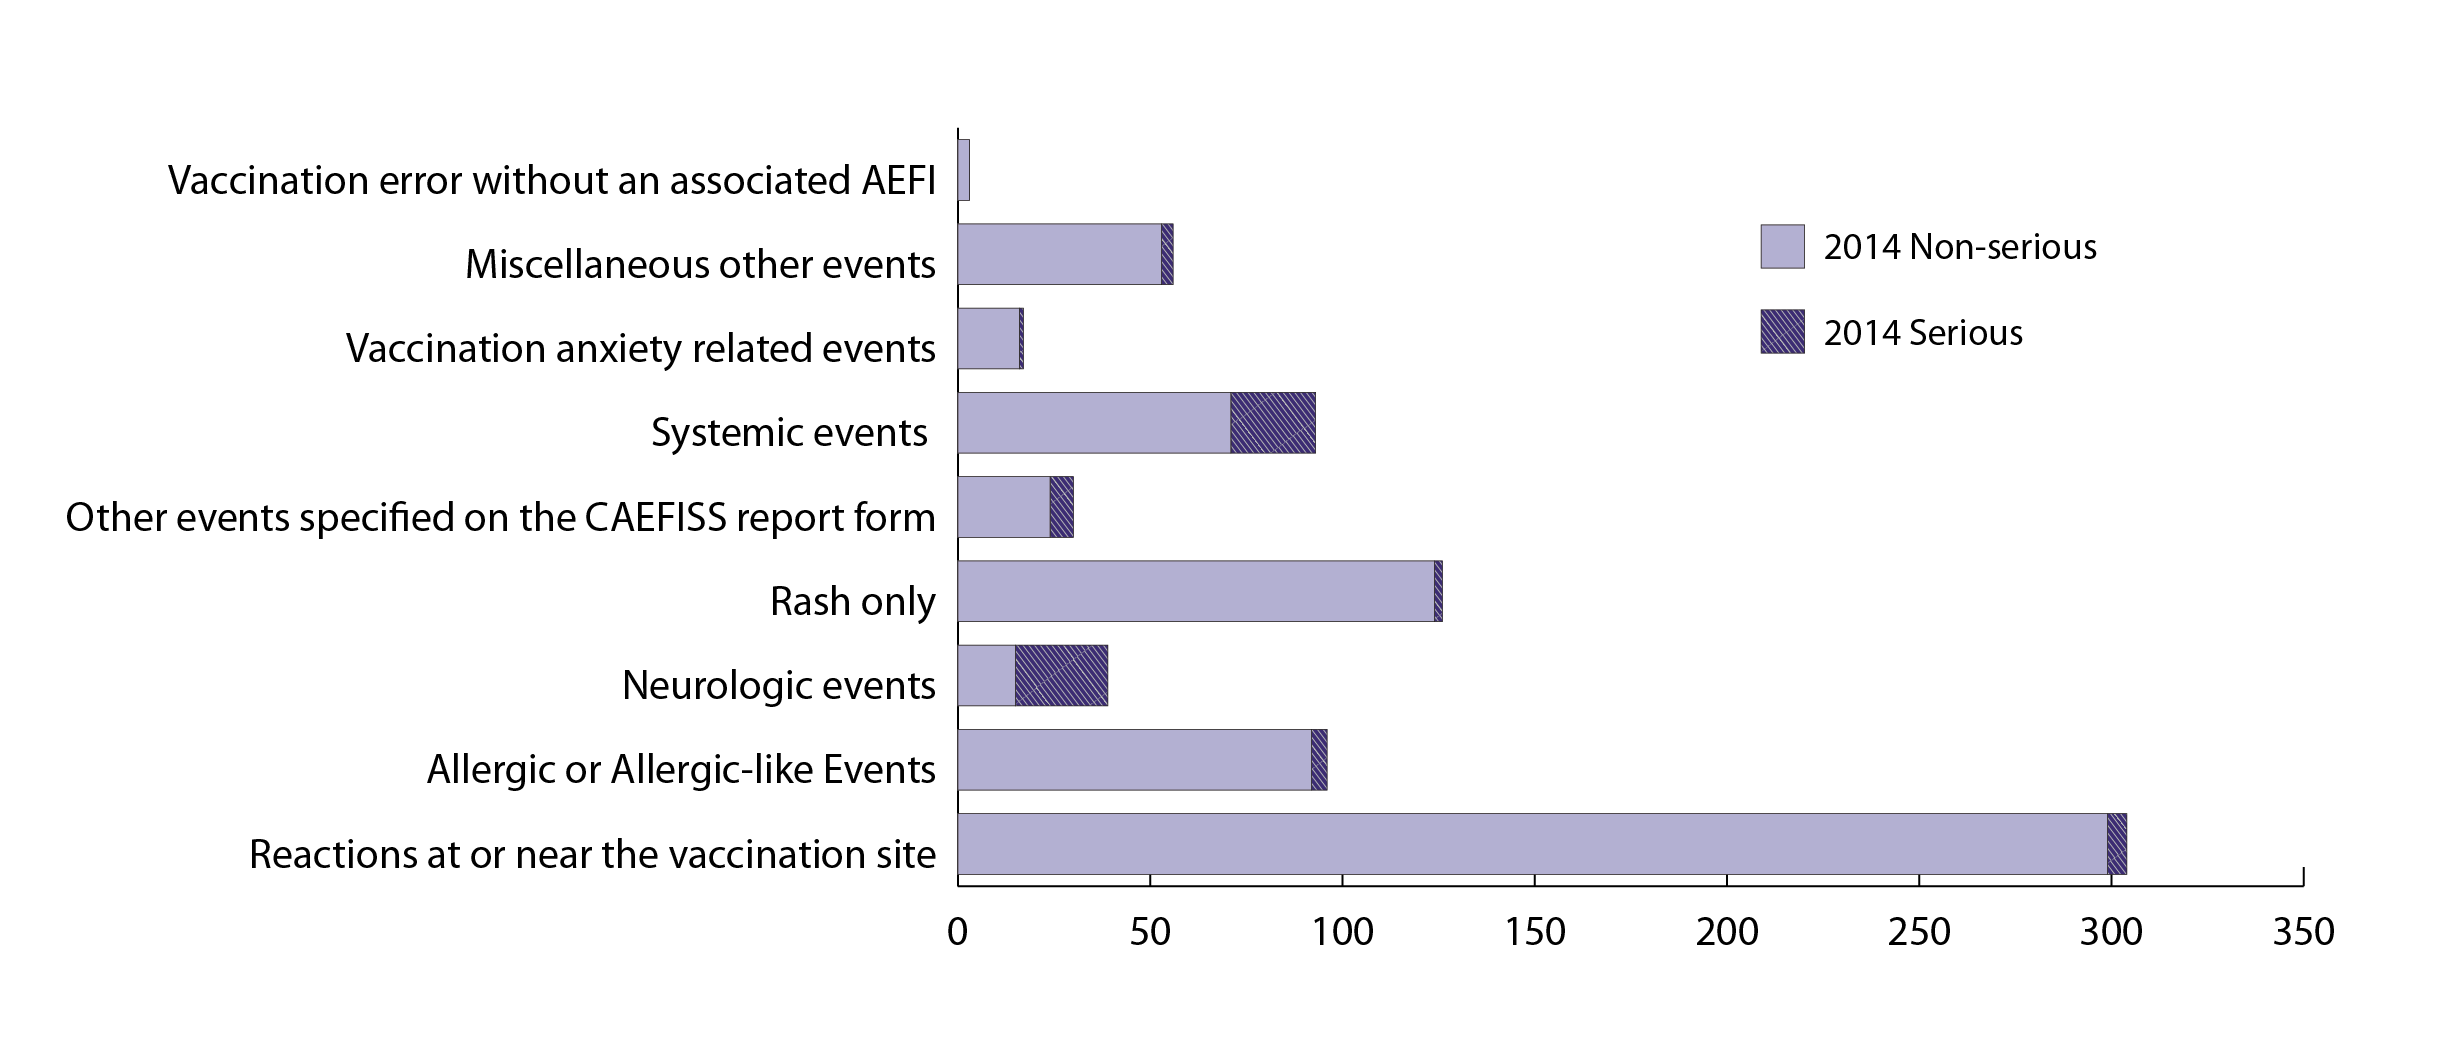
Figure 5: 2014: Q1 AEFI totals by main reason for reporting and seriousness
The main reason for reporting and seriousness of the AEFI for Q1 of 2014 is shown in Figure 5. The graph summarizes the totals for serious and non-serious AEFI reports, classified according to the main reason for reporting. The most frequently reported adverse events were reactions at or near the vaccination site, rash as the only event, allergic or allergic like events and systemic. The vast majority of all reports were non-serious.
Text Equivalent
This is a bar graph showing the total number of non-serious and serious reports categorized by the main reason for reporting received by the Public Health Agency of Canada during the 1st quarter (January, February and March) of 2014.
The y-axis shows the 9 different categories of AEFI and the x-axis shows the total number of reports for each category ranging from 0 to 350.
The respective totals for non-serious and serious AEFI reports received during Q1 of 2014 were: reactions at or near the vaccination site: 299 and 5; allergic or allergic-like events: 92 and 4; neurologic events: 15 and 24; rash only (in other words rash without any other signs or symptoms): 124 and 2; Other events specified on CAEFISS report form: 24 and 6; systemic events: 71 and 22; vaccination anxiety related events: 16 and 1; miscellaneous other events: 53 and 3; vaccination error without an associated AEFI: 3 and 0.
Figure 6: 2011-2013: Q1 Average AEFI totals by main reason for reporting and seriousness
The main reason for reporting and seriousness of the AEFI for Q1 of 2014 against an average for Q1 in 2011, 2012 and 2013 is shown in Figure 6. The trends seen in past years were similar to what was observed for Q1 in 2014.
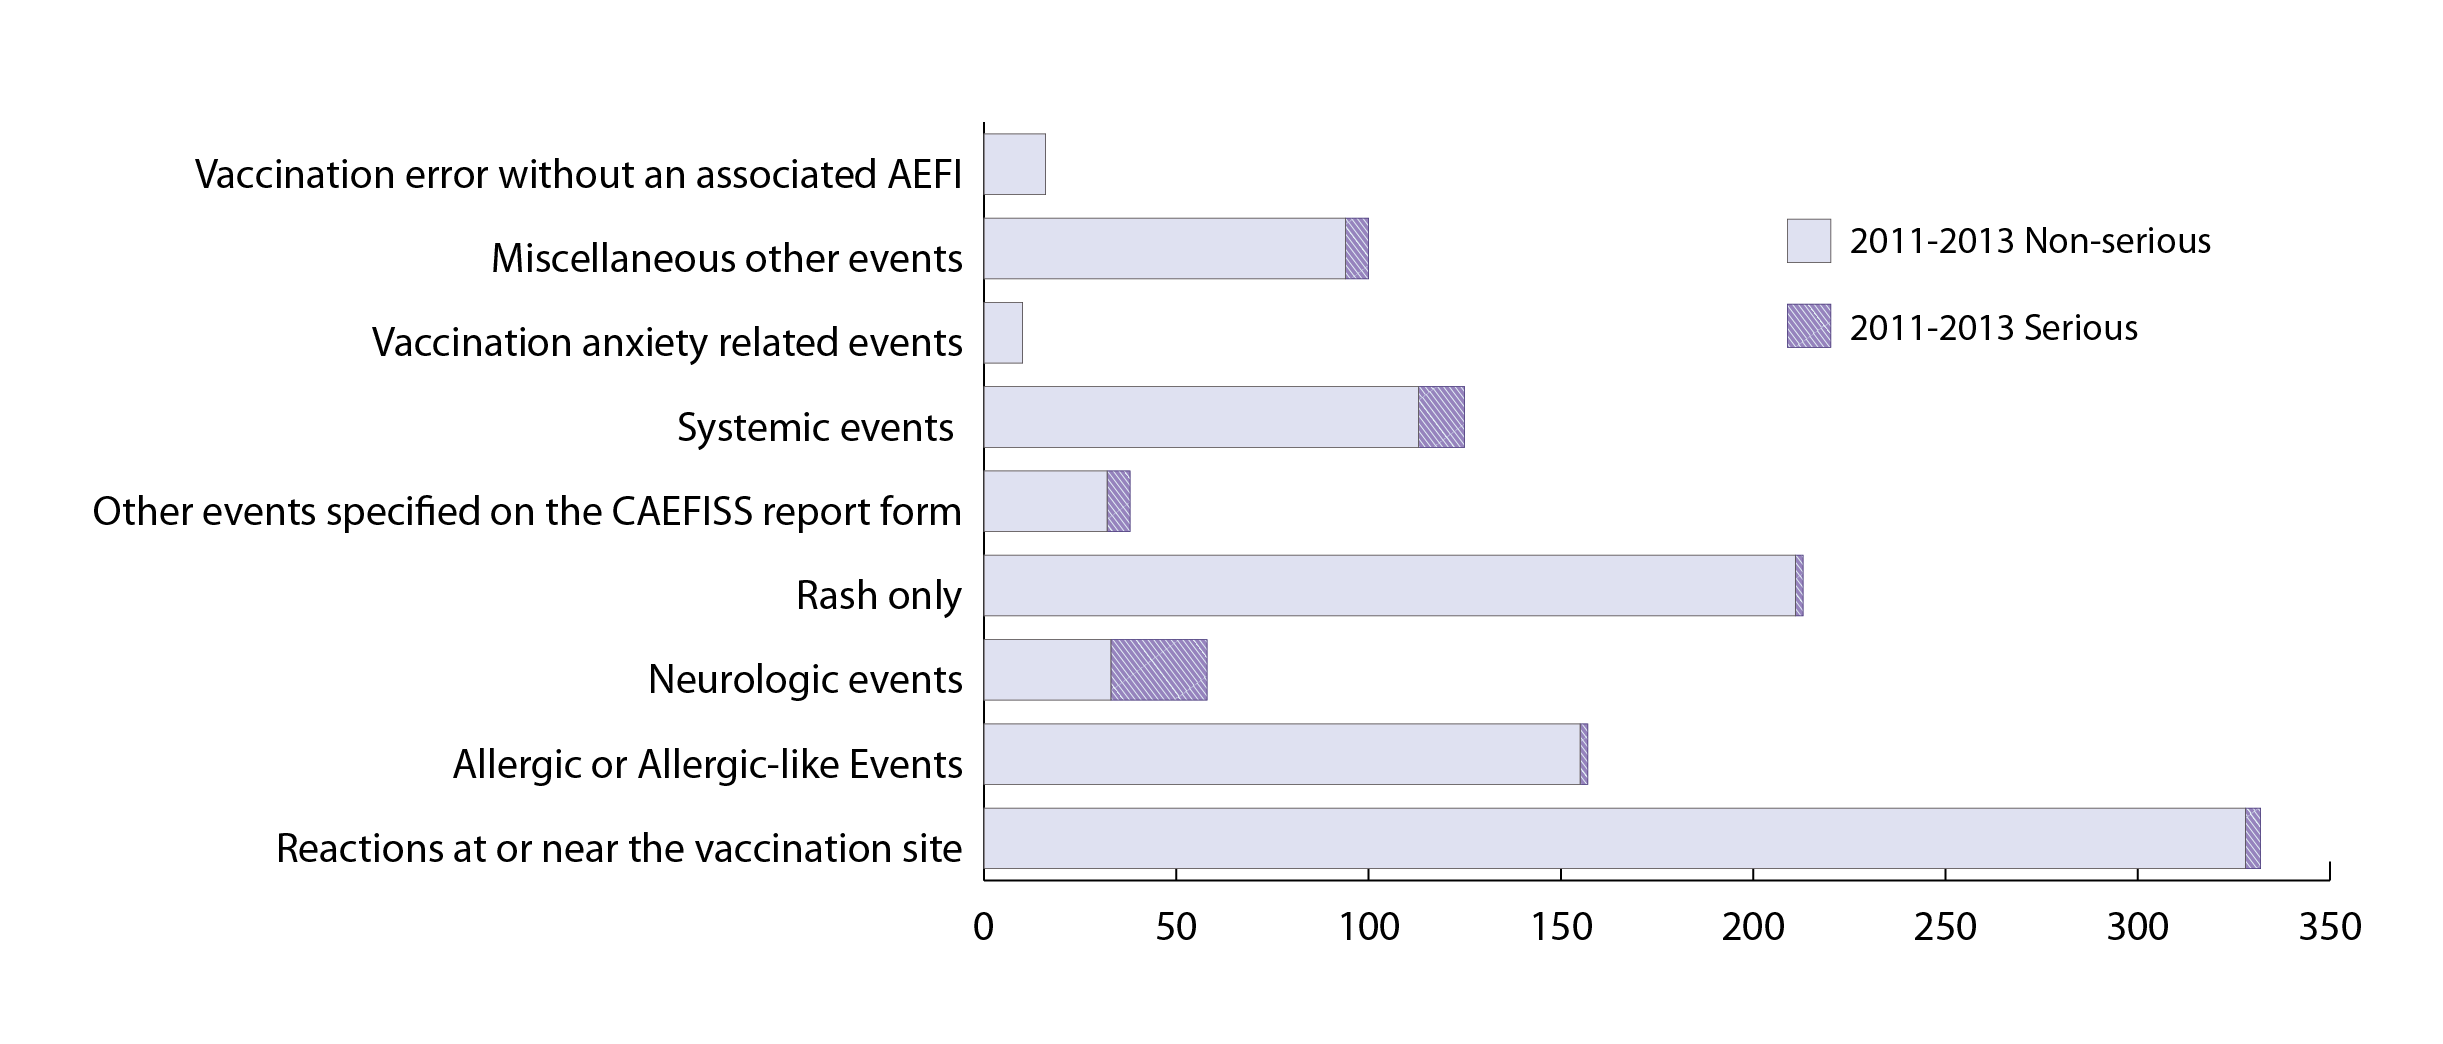
Text Equivalent
This is a bar graph showing the 3 year average (2011, 2012 and 2013) total number of non-serious and serious reports categorized by the main reason for reporting received by the Public Health Agency of Canada during the 1st quarter (January, February and March). This graph is provided as a comparison for Figure 5 which shows the same data for reports received during Q1 of 2014.
The y-axis shows the 9 different categories of AEFI and the x-axis shows the total number of reports for each category ranging from 0 to 350.
The respective average totals for non-serious and serious AEFI reports received during Q1 of 2011, 2012 and 2013 were: reactions at or near the vaccination site: 328 and 4; allergic or allergic-like events: 155 and 2; neurologic events: 33 and 25; rash only (in other words rash without any other signs or symptoms): 211 and 2; Other events specified on CAEFISS report form: 32 and 6; systemic events: 113 and 12; vaccination anxiety related events: 10 and 0; miscellaneous other events: 94 and 6; vaccination error without an associated AEFI: 16 and 0.
Figure 7: Types of serious AEFIs reported in Q1 2014 vs. prior 3 years
There were a total of 67 serious reports in Q1 of 2014 (8.8% of 764 reports total). The average for Q1 from 2011 to 2013 was 57 serious reports (5.4% of 1050 reports total). The single most common reason for reporting serious AEFIs were seizures usually accompanied by fever. Febrile seizures are actively sought by the pediatric hospital-based Immunization Monitoring Program-Active (IMP-Act) network which regularly provides over half of all serious AEFI reported to PHAC for children. Febrile seizures are known to occur after immunization with live attenuated vaccines such as MMR or MMRV as often as once for every 2600 vaccinations given. The events are short-lived and not associated with long term adverse outcomes. The only category with several more reports in 2014 than in previous quarters was systemic events, which was actually several different types of event with no cluster of anything particular.
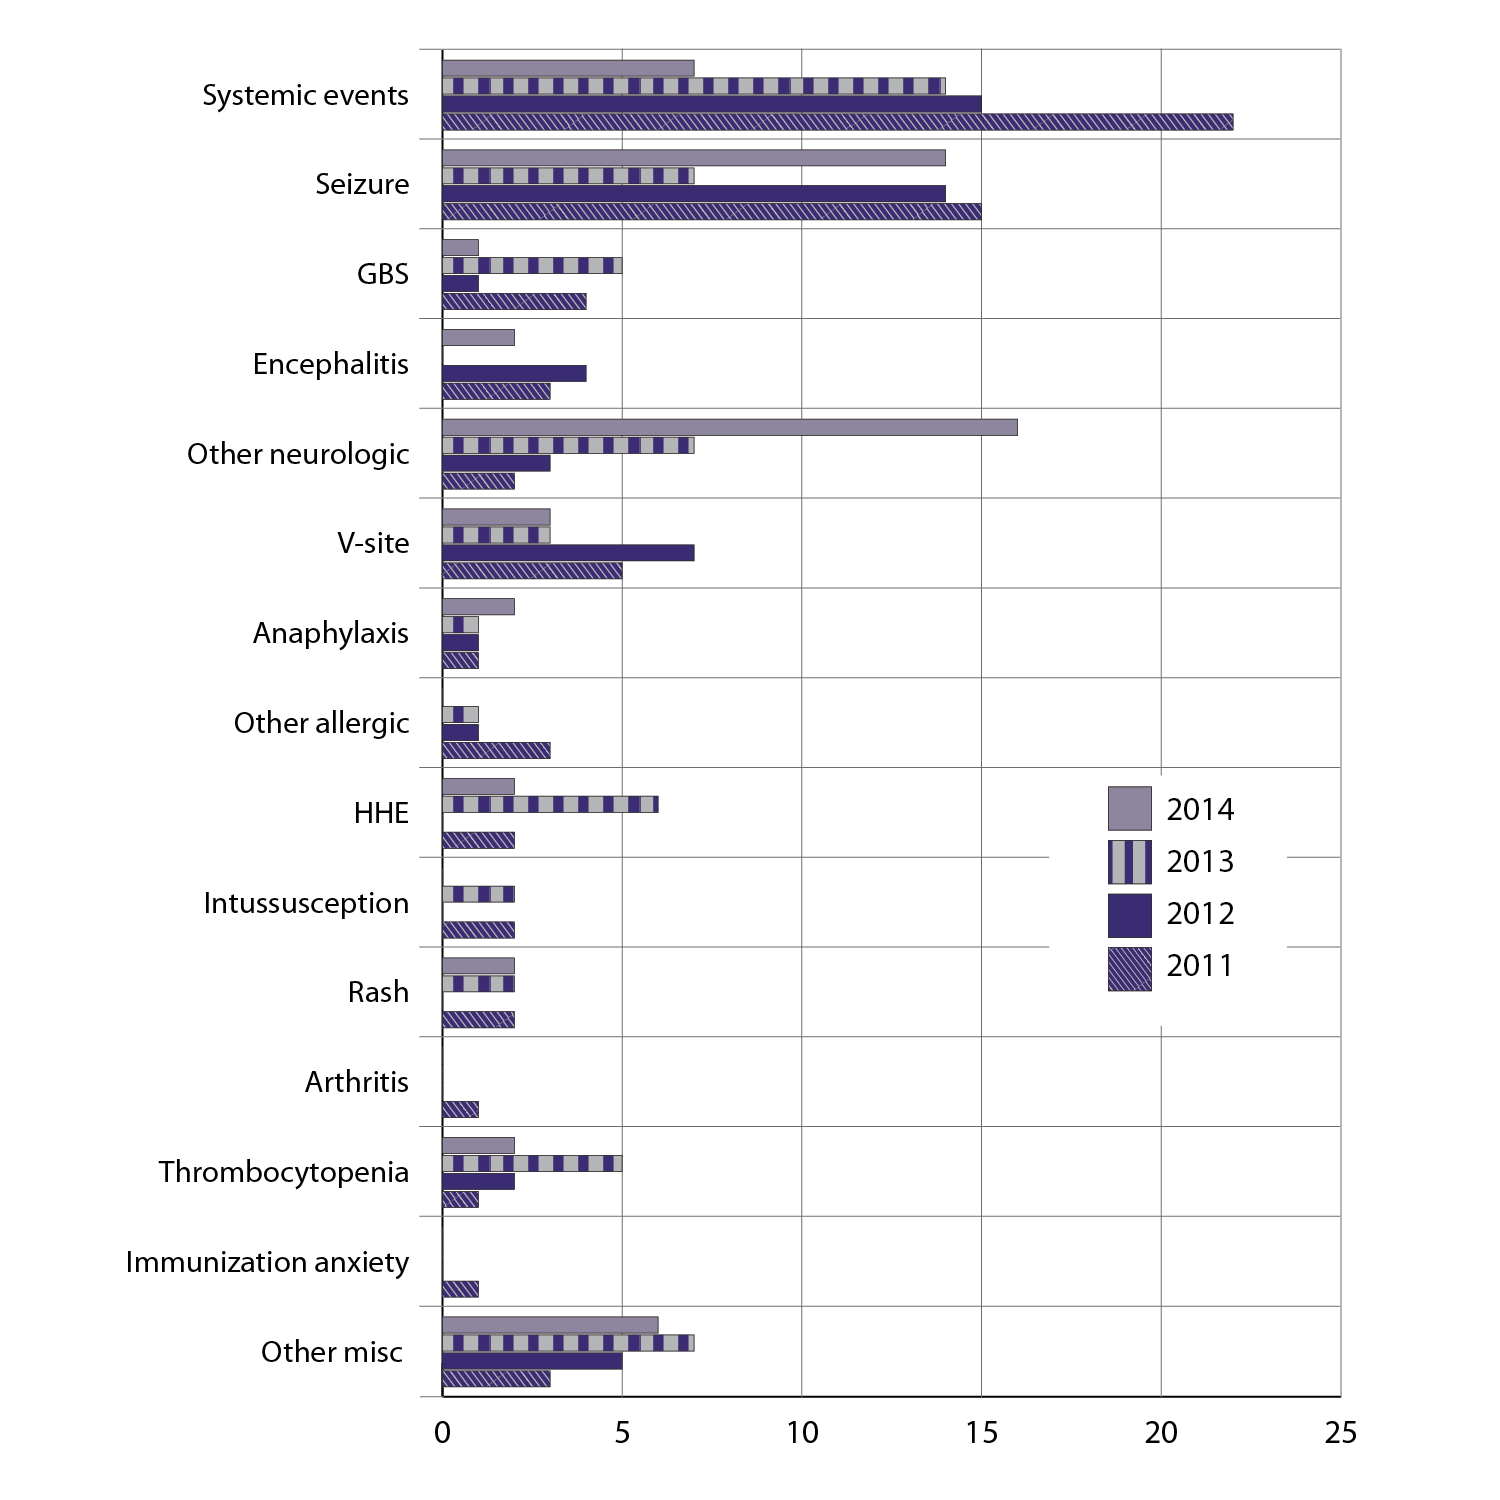
Text Equivalent
This is a bar graph showing the total serious reports of specific AEFIs received during the 1st quarter (January, February and March) for each of four different years: 2011, 2012, 2013 and 2014. The y-axis lists the specific AEFI types as described below. The x-axis shows the total number of reports ranging from 0-25.
For each specific AEFI type the total reports received, respectively during Q1 for 2011, 2012, 2013 and 2014 were: systemic events: 7, 14, 15 and 22; seizure: 14, 7, 14 and 15; Guillain-Barre syndrome: 1, 5, 1 and 4; encephalitis: 2, 0, 4 and 3; other neurologic events: 16, 7, 3 and 2; reactions at or near the vaccination site: 3, 3, 7 and 5; anaphylaxis: 2, 1, 1 and 1; other allergic events: 0, 1, 1 and 3; hypotonic-hyporesponsive episodes: 2, 6, 0 and 2; intussusception: 0, 2, 0 and 2; rash: 2, 2, 0 and 2; arthritis: 0, 0, 0 and 1; thrombocytopenia: 2, 5, 2 and 1; immunization related anxiety: 0, 0, 0 and 1; other miscellaneous events: 6, 7, 5 and 3.
Page details
- Date modified: