
Canadian Integrated Program for Antimicrobial Resistance Surveillance (CIPARS) 2017: Design and Methods
Download the PDF version, 1834 KB
To promote and protect the health of Canadians through leadership, partnership, innovation and action in public health, Public Health Agency of Canada.
Working towards the preservation of effective antimicrobials for humans and animals, Canadian Integrated Program for Antimicrobial Resistance Surveillance.
Également disponible en français sous le titre :
Programme intégré canadien de surveillance de la résistance aux antimicrobiens (PICRA) 2017 : Design et méthodes
To obtain additional information, please contact:
Dolly Kambo
Executive assistant
Public Health Agency of Canada
370 Speedvale Avenue West, Guelph, ON N1H 7M7
Telephone: 519-826-2174
Fax: 519-826-2255
E-mail: phac.cipars-picra.aspc@canada.ca
This publication can be made available in alternative formats upon request.
©Her Majesty the Queen in Right of Canada, as represented by the Minister of Health, 2020
Publication date: December 2020
This publication may be reproduced for personal or internal use only without permission provided the source is fully acknowledged.
Cat.: HP2-4/2017E-3-1-PDF
ISBN: 978-0-660-36793-4
Pub.: 200317
Suggested Citation:
Government of Canada. Canadian Integrated Program for Antimicrobial Resistance Surveillance (CIPARS) 2017: Design and Methods. Public Health Agency of Canada, Guelph, Ontario, 2020.
Table of Contents
- What's new for CIPARS in 2017
- Design and Methods
- Antimicrobial use
- Antimicrobial resistance
- Human surveillance
- Retail meat surveillance
- Abattoir surveillance
- Farm surveillance
- Surveillance of animal clinical isolates
- Feed and feed ingredients
- Bacterial isolation methods
- Serotyping and phage typing methods
- Antimicrobial susceptibility testing methods
- Antimicrobial susceptibility breakpoints
- Data analysis
- Antimicrobial classification
- Appendix
What's new for CIPARS in 2017
Antimicrobial use in animals
- In 2017, Fisheries and Oceans provided quantities of antimicrobials used, sold or distributed for sale for use in marine and freshwater finfish aquaculture.
Antimicrobial resistance
- For 2017, only a partial year of retail sampling was conducted in Ontario and the Prairies, and no sampling occurred in the Atlantic region.
- Sampling for Campylobacter spp. from retail ground turkey was discontinued in 2017 due to low recovery.
- In 2017, shared 2017 FoodNet/CIPARS samples were sequenced using the MiSeq platform from Illumina®; predictive serotype was determined using SISTR (Salmonella in silico Typing Resource).
- For 2017, Salmonella Enteritidis, Heidelberg, and Typhimurium serovar isolates were phagetyped if sent prior to September 28th, 2017; all isolates submitted after this date were not phagetyped.
Design and Methods
Antimicrobial use
Human antimicrobial use monitoring activities within the Public Health Agency of Canada (PHAC) are presented in the Canadian Antimicrobial Resistance Surveillance System (CARSS), Update 2018Footnote 1. Select aspects of IQVIA data (formerly QuintilesIMS) from the CARSS 2017 report are included in the integrated findings of this report (per communication with CARSS).
Quantities of antimicrobials distributed for sale for use in animals
As an estimate of antimicrobials used in animals, data on active ingredients distributed for sale were aggregated and provided to the Public Health Agency of Canada by the Canadian Animal Health Institute (CAHI). CAHI is the trade association representing the companies that manufacture and distribute drugs for administration to food (including fish), sporting, and companion animals in Canada. The association estimates that its members' sales represent approximately 95% of all sales of licensed animal pharmaceutical products in CanadaFootnote 2. CAHI coordinates electronic collection of data from its members. Data collection and analysis are performed by a third party, Impact Vet. The CAHI data include information from 17 companies that manufacture antimicrobials products for use in animals in Canada, and 4 major wholesalers/distributors. The CAHI data on the distribution of antimicrobials for use in animals provide a context to interpret other data on antimicrobial use in animals generated through surveillance or research on farm. They also provide a means to estimate gross temporal changes in antimicrobials used in animals.
The level in the distribution chain that kilograms of active ingredients are reported to CIPARS is at the feed manufacturer/veterinary clinic. Antimicrobial use was assigned to either production animal (inclusive of horses) or companion animal by the manufacturers according to label claim, and in the situation where mixed species was indicated on the label, the manufacturer assigned (estimated) the species as either companion animal or production animal.
These data do not represent actual antimicrobial use in a given year; rather, they reflect the volume of antimicrobials distributed by manufacturers and wholesalers. Distribution values should approximate amounts used, particularly when data from more than one year are included. However, when data from only one year are included, distribution values may vary from amounts actually used because of the time lag between distribution and actual use, as well as stockpiling of antimicrobials at various points in the distribution system. The sales data also do not account for drug wastage due to drug expiry.
The data do not include antimicrobials imported for personal use (own use importation or OUI) under the personal-use provision of the federal Food and Drugs Act and its Regulations, nor do they include imported active pharmaceutical ingredients (API), which are drugs imported in non-dosage form and compounded by a licensed pharmacist or veterinarian. The latest information from an Ipsos/Impact Vet study prepared for CAHI is that the lost opportunity value due to OUI and API was estimated to be 13% of total animal health product sales (personal communication Jean Szkotnicki). The CAHI data do not include prescriptions filled by pharmacists using human labelled drugs for antimicrobials used in companion animals. Hence, the CAHI data underestimate the true volume of antimicrobials used in animals in Canada. Also, the CAHI data do not capture what happens to the drugs after purchase; hence these data cannot provide information the actual antimicrobial use practices, such as dose, duration, reason for use, detailed species-specific information, or extra-label use.
The CAHI data include medicines sold directly to pharmacists that have a focus on dispensing for production medicine. It does not include antimicrobial agents moved from veterinarians to pharmacies and then subsequently dispensed by pharmacies. The latter distribution is captured with the veterinary clinic-level data.
CAHI provides the information in categories, with some antimicrobials not independently reported. This is based on a "3 company accounting rule" established by CAHI to comply with the European Union and the United States' anti-competition regulations. CAHI added in some cases a "90% rule" to be sure not to infringe the regulations in the United States. These accounting rules can result in changes to the categorization of specific antimicrobials over time. For 2017, the antimicrobials are categorized as per Table 1.
| Antimicrobial class | Ingredient |
|---|---|
| Aminoglycosides | Amikacin, apramycin, dihydrostreptomycin, framycetin sulfate, gentamicin, neomycin, spectinomycin, streptomycin |
| β-Lactams/penicillins | Amoxicillin, ampicillin, clavulanic acid, cloxicillin, penicillin |
| Cephalosporins | Cefadroxil, cefalexin, cefapirin, cefazolin, cefovecin, cefoxitin, cefpodoxime, ceftiofur |
| Fluoroquinolones | Ciprofloxacin, danofloxacin, enrofloxacin, marbofloxacin, orbifloxacin, pradofloxacin |
| Chemical coccidiostats and arsenicals | Amprolium, clopidol, decoquinate, diclazuril, halofuginone, narasin, pyrimethamine, robenidine, toltrazuril |
| Ionophore coccidiostats | Lasalocid, maduramicin, monensin, salinomycin |
| Lincosamides | Clindamycin, lincomycin, pirlimycin |
| Macrolides | Erythromycin, gamithromycin, tildipirosin, tilmicosin, tulathromycin, tylosin |
| Other antimicrobials | Avilamycin, bacitracin, bambermycin, chloramphenicol, chlorhexidine gluconate, florfenicol, fusidic acid, novobiocin, polymixin B, tiamulin, virginiamycin |
| Tetracyclines | Chlortetracycline, doxycycline, minocycline, oxytetracycline, tetracycline |
| Trimethoprim and sulfonamides | Sulfadiazine, sulfadoxine, sulfamerazine, sulfamethazine, sulfamethoxazole, sulfaquinoxaline, sulfathiazole, trimethoprim |
Temporal figures and data tables for significance testing
As the CAHI data represent census information, there is no testing of statistical differences between years (i.e., the CAHI data are not data derived from samples). Any difference in findings between years should reflect a true difference in the quantities of antimicrobials distributed for sale by the member companies.
Population correction unit
Changes in the overall quantity of antimicrobials distributed over time may reflect several things, including: true change in use practices, a change in the numbers or types of animals in the population (requiring antimicrobials), changes in disease prevalence necessitating antimicrobial use, and changes in the types of antimicrobials administered. As one way to adjust the sales data for the changing animal populations over time, a denominator accounting for the number of animals and their standardized weights (animal biomass) was applied. This denominator was based on the methodology currently in use by the European Surveillance of Veterinary Antimicrobial Consumption (ESVAC)Footnote 3.
ESVAC adjusts the sales data by a population correction unit (PCU) in which a PCU is a proxy for the animal biomass that is at risk of being treated with antimicrobials. It is a technical measurement only; where 1 PCU = 1 kg of different categories of livestock and slaughtered animals. ESVAC methodology was applied to the greatest extent possible, however population information collected by Statistics Canada and Agriculture and Agri-Food Canada is different in structure somewhat from the data accessed by ESVAC (Eurostat and TRACES), hence direct comparisons of PCU's or mg/PCU with ESVAC participating country data should only be made with due caution.
The PCU is calculated by multiplying the numbers of livestock and slaughtered animals in each species/production state by the theoretical (standardized) weight at the most likely time of treatmentFootnote 4,Footnote 5.
Equation 1 Formula for PCU calculation
Equation 1a. Formula for PCU calculation

Equation 1a - Text Description
The PCU (in kilogram) is calculated by multiplying the numbers of animals by the average weight of animal at treatment (in kilogram).
Equation 1b. Formula for PCU calculation
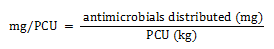
Equation 1b - Text Description
The milligrams per population correction unit (PCU) is calculated by dividing the amount of antimicrobials distributed for use (in milligram) by the PCU value.
National denominator data regarding the number of livestock and slaughtered animals were obtained from Statistics Canada, Agriculture and Agri-Food Canada, Fisheries and Oceans Canada, the Canadian Animal Health Institute, and Equestrian Canada (formerly known as Equine Canada) websites. Note, that some websites periodically update their historic data; hence the data are considered as accurate as possible on the date accessed.
In the fall of 2013, CIPARS met with animal commodity group volunteers, the pharmaceutical industry, and some provincial agriculture government representatives to discuss Canadian average weights at treatment. Using available CIPARS data and input from these participants (committee expert opinion), we jointly developed Canadian average weights at treatment. The rationale is that for some animal species or production stages, Canadian animals might be heavier or lighter than their European equivalents.
In 2017, based on consultation with an industry expert, CIPARS changed the weight of Canadian exported pigs (for feeding) for the PCUCANADA. CIPARS additionally applied the 1 kg weight for poultry imported and exported for the PCUESVAC, but used the reported Canadian weight categories for the PCUCANADA.
Detailed inclusion and exclusion criteria for the PCU denominator
As per ESVAC, exported animals were added to the PCU, whereas imported animals were subtracted, based on the ESVAC assumption that animals are treated in their country of origin. However, it was noted that in the Canadian context, this would vary depending upon the production stage that is crossing the border.
For the purposes of calculating the PCU, production animal species with the largest populations were included, using the same production classes as ESVAC (for the most part - dependent on the availability of the data), with the notable exception that we additionally included beef cows (not included by ESVAC).
Species currently excluded from our PCU calculations include game animals (e.g., moose), "pocket" companion animals (e.g., hamsters, guinea pigs, pet birds), reptiles, and amphibians.
For some production stages, import and export data for poultry are included in a different structure before and after 2009, based on the data available from Statistics Canada. The import and export of poultry for select weight categories were added, which is not included in the ESVAC methodology.
Provincial stratification of the numerator and denominator
There may be subsequent distribution of antimicrobials across provincial borders after being distributed to the veterinary clinics (in particular the movement of medicated feed; for example, anecdotal information was that New Brunswick has a negligible feed-mill industry, they generally purchase their medicated feed from Québec), hence caution should be applied when interpreting the quantities of antimicrobials distributed for sale within each province. Provincial/regional calculations of PCU are pending further discussion.
Overall discussion of strengths and limitations
The CAHI data provides a rough measure of antimicrobials distributed for sale for all animal species, including those not covered by CIPARS farm-level surveillance (with appropriate caveats regarding OUI/API). The PCU metric currently does not take into account the lifespan of the animal, which may affect the interpretation of the quantities of antimicrobials administered to animals. Also, use of a static standard weight may not reflect an industry shift in production affecting the average weights of animals treated, related to weather, trade, or other reasons. Measures of antimicrobial use as reported by broad categories and by a PCU denominator do not account for the amount of the drug needed to achieve therapeutic success. This could affect interpretation of trends. For example, a decrease in the mg/PCU could potentially reflect a switch to using a drug that has smaller daily dose, as opposed to reflecting a decrease in the actual exposure of animals to antimicrobials. The CAHI data should be interpreted as one measure describing antimicrobials used in animals, strong caution should be applied with making inferences to any use practice for a particular animal species.
There have been several advances in detail of these data over the past recent years. Since 2011, the data have been stratified by province, since 2012 stratified by companion animal/production animal, and since 2013 stratified by route of administration.
Quantities of antimicrobials distributed for sale for use on crops
Health Canada's Pest Management Regulatory Agency (PMRA) collects annual Canadian sales data from all pesticide manufacturers. Sales information on antimicrobials registered as pesticides on food crops was kindly provided by PMRA to CIPARS. These data represent antimicrobials administered for the following reasons: fireblight on pome fruits (apples, pears, quince), caneberries and Saskatoon berries; blossom blast and bacterial canker on cherries; stem canker and bacterial spot on greenhouse and field fruiting vegetables (peppers, tomatoes, and eggplant); and walnut blight of walnuts. To protect confidential business information, the data are only presented in combination with data from humans and animals.
Quantities of antimicrobials used in marine and freshwater finfish aquaculture
Fisheries and Oceans Canada (DFO) requires aquaculture industry operators to report on their use of drugs, including antimicrobials, (as authorized under the Food and Drugs Act) and pesticides (as registered under the Pest Control Products Act) under the authority of the Aquaculture Activities Regulations authorized under the Fisheries Act. In an annual report, aquaculture operators are required to report the quantity of drugs and pesticides used throughout the year at each location (i.e., farm site). From these data, the number of prescriptions and frequency of treatment periods are calculated, in addition to measures taken to avoid the need for such use. These data cover all marine and freshwater finfish aquaculture facilities in Canada. Further information on the use of antimicrobials and other products by the aquaculture industry in Canada can be found on DFO's Aquaculture Public Reporting websiteFootnote 6.
Farm surveillance
Farm questionnaire
Broiler chickens
In the broiler chicken Farm Surveillance component of CIPARS, sentinel farm data were collected through questionnaires administered by the poultry veterinarian (or designated practice staff) to the producer (or designated farm staff). The questionnaires collected information related to the hatchery and to the broiler farm. Veterinarians asked the producers for the chick delivery receipts, which contain information required to fill the hatchery-level portion of the questionnaire. Data collected included breeder flock information together with source origin (e.g., province of origin or imported); the age range of the breeder flock whether the hatchery purchased the chicks as hatching eggs or chicks; the antimicrobials used, routes of administration, and the dosage. Additionally, the primary reason for antimicrobial use, such as treatment, prevention, high-risk flock source, or producer request was captured. Also collected were secondary reasons for use, such as avian pathogenic E. coli, Enterococcus cecorum, Salmonella spp., Staphylococcus spp., early clostridial infections and other diseases. Information on vaccines administered in ovo or at the time of hatch were recorded. The veterinarians or designated staff confirmed the information by calling the hatcheries.
The broiler farm portion of the questionnaire was completed by using feed delivery receipts, farm records, prescriptions and/or by asking the producer. Farm demographic information such as quota period, age and estimated weight of birds at the time of visit, farm/barn/floor capacity, as well as biosecurity and animal health information (i.e., vaccines administered at the farm level) were also obtained.
Producers or designated farm personnel were asked about antimicrobial use (AMU) via feed and water. Data were collected on each diet fed to the flock. Information collected on each type of feed included whether the feed contained antimicrobials (medicated feed) or did not contain antimicrobials (non-medicated feed), the total days fed and age of the flocks at the start and end of each ration. Additional information was collected for diets containing antimicrobials including active ingredient(s), their concentration(s) in the feed, and the primary reason(s) for that AMU (growth promotion, disease prevention, or treatment). Secondary AMU reasons were captured if the primary use was for disease prevention or treatment; the list for secondary reasons included the most commonly diagnosed conditions in broilers: yolk sacculitis, septicemia, musculoskeletal diseases, respiratory diseases, necrotic enteritis, coccidiosis, and other diseases (e.g., any non-bacterial etiology such as viral and metabolic).
Data collected on exposure to antimicrobials though water included active ingredient(s) in the drug(s) used, dosage (g or mL/L of drinking water), start and end age of each water medication, the proportion of the flock exposed, and the reason(s) for use. The primary and secondary reasons for prevention and treatment for AMU in water were similar to those described for feed AMU. The producers were also asked if a prescription was provided by a veterinarian and whether the water medication was an over-the-counter purchase.
Based on the required components of the National Avian On-Farm Biosecurity StandardFootnote 7, relevant questions were asked pertaining to the level of biosecurity. Questions on access management, animal health management and operational management were included. Data on flock health status (i.e., diagnosis of the most common bacterial and viral diseases) and vaccine administration from the time of chick placement onwards were also collected.
Grower-finisher pigs
In the grower-finisher's Farm Surveillance component of CIPARS, sentinel farm data were collected through questionnaires administered by the herd veterinarian (or designated staff) to the producer (or designated farm staff). The questionnaires included sections requesting information on AMU, herd demographics and animal health.
Questions pertaining to the number of pigs in the population of interest differed by management system: continuous-flow or all-in-all-out. All-in-all-out management is a production system whereby animals are moved into and out of facilities in distinct groups. By preventing the commingling of groups, the intention is to reduce the spread of diseases. Facilities are normally cleaned and disinfected thoroughly between groups of animals. This type of management is generally all-in-all-out by room or by barn. In continuous-flow operations, animals are continually being added to and removed from the production system.
The AMU questionnaire was designed to collect data for groups of pigs in the grower-finisher production phase. No data on individual pigs were collected. Six pens representative of this population were selected for the collection of fecal specimens for bacterial culture and antimicrobial susceptibility testing. Thus, in herds with all-in-all-out management, the population of interest included all pigs that entered and exited the barn in the same group as the sampled pigs. The population of interest in herds with continuous-flow management was the pigs that entered the grower-finisher unit with the sampled pigs.
Herd owners/managers were asked about AMU via feed, water, and injections. Information collected on each type of feed administered during the grow-finish period included whether the feed contained antimicrobials (medicated feed) or did not contain antimicrobials (non-medicated feed), the average number of weeks each ration was fed and the associated start and end pig weights. Additional information was collected for diets (rations) containing antimicrobials: active antimicrobial ingredient(s), their concentration(s) in the feed, and the primary reason(s) for that AMU (either growth promotion, disease prevention, or treatment). If disease prevention or treatment was selected under the primary reason for AMU, respondents could choose any one of the following secondary reasons for use in feed: respiratory disease, enteric disease, lameness or other diseases. The proportion of pigs fed each diet was also captured.
Data collected on exposure to antimicrobials through water or injection included active ingredient(s) of the drug(s) used, the reason(s) for use and the proportion of pigs exposed. The primary reasons for AMU in water included disease prevention and disease treatment with associated secondary reasons for use being respiratory disease, enteric disease, lameness or other diseases. Only disease treatment reasons were collected for AMU administered by injection. The number of pigs exposed to AMU by water or injection was captured as categorical data with ranges of 1 to 25%, 26 to 50%, 51 to 75% or 76 to 100% of the pigs.
No AMU data were collected for any production phase prior to the grower-finisher phase. Any data regarding AMU in pigs weighing less than 15 kg (33 lb) were excluded because this weight was considered below the industry standard for grower-finisher pigs.
Turkeys
In the turkey Farm Surveillance component of CIPARS, sentinel farm data were collected through questionnaires administered by the poultry veterinarian (or designated practice staff) to the producer (or designated farm staff). Data were collected on the intended market of the birds sampled. The potential markets were; broilers at 5.5 kg average weight and 64 to 71 days of age, light hens at 7.2 kg average weight and 76 to 83 days of age, heavy hens at 9.4 kg average weight and 99 to 106 days of age, light toms at 12.2 kg average weight and 97 to 104 days of age and heavy toms at 15.1 kg average weight and 109 to 116 days of age.
Hatchery drug use was obtained via the poult delivery receipts or by calling the hatcheries (if from domestic source). Data collected included breeder flock information together with source origin (e.g., province of origin or imported); the age range of breeder flock; whether the hatchery purchased the poults as hatching eggs or poults; the antimicrobials used, route of administration, and dosage. Additionally, the primary reason for antimicrobial use such as treatment, prevention, high risk breeder flock source, or producer request was obtained. The targeted bacteria or disease was also recorded; E. coli, Salmonella spp., Staphylococcus spp., or other.
Farm antimicrobial drug use was completed by using feed delivery receipts, farm records, prescriptions and/or by asking the producer. Farm demographic information, age and estimated weight of birds at the time of visit, farm/barn/floor capacity, as well as biosecurity and animal health information (i.e., vaccines administered at the farm level) were also obtained.
Producers or designated farm personnel were asked about AMU via feed and water. Data were collected on each diet fed to the flock. Information collected on each type of feed included whether the feed contained antimicrobials (medicated feed) or did not contain antimicrobials (non-medicated feed), the total days fed and age of the flocks at the start and end of each ration. Additional information was collected for diets containing antimicrobials: active ingredient(s), their concentration(s) in the feed, and the primary reason(s) for that AMU (growth promotion, disease prevention, or treatment). Secondary AMU reasons were captured if the primary use was for disease prevention or treatment; the list for secondary reasons included the most commonly diagnosed conditions in turkeys: yolk sacculitis, septicemia, musculoskeletal diseases, respiratory diseases, enteric diseases, coccidiosis, and other diseases (e.g., any non-bacterial etiology such as viral and metabolic).
Data collected on exposure to antimicrobials though water included active ingredient(s) in the drug(s) used, dosage (g or mL/L of drinking water), start and end age of each water medication, the proportion of the flock exposed, and the reason(s) for use. The primary and secondary reasons for prevention and treatment for AMU in water were similar to those described for feed AMU. The producers were also asked if a prescription was provided by a veterinarian and whether the water medication was an over-the-counter purchase.
Based on the required components of the National Avian On-Farm Biosecurity StandardFootnote 8, relevant questions were asked pertaining to the level of biosecurity. Questions on access management, animal health management and operational management were included. Data on flock health status (i.e., diagnosis of the most common bacterial and viral diseases) and vaccine administration from the time of poult placement onwards were also collected.
Data analysisFootnote 9
Data were entered into a PostGreSQL Database and descriptive statistics were obtained with commercially available softwareFootnote 10.
Broiler chickens
Antimicrobial exposures from the hatching stage to the end of growth or pre-harvest sampling stage (greater than or equal to 30 days) were summarized for each flock. An exposure was defined as any reported use of an active ingredient by a given route of administration. Data were reported as exposure to an active ingredient by a given route of administration, as well as by exposure to an active ingredient by any administration route. These exposures were summarized by antimicrobial active ingredient for frequency table and summed up by class in the quantitative metrics/indicators.
Feed consumption
Estimates of feed intake were based on simple regression and integral calculus. Feed consumption estimates from most recently available performance standards (Ross and Cobb strains) and the performance objectives developed by nutrition companiesFootnote 11,Footnote 12,Footnote 13,Footnote 14,Footnote 15 were loaded into Microsoft™ Excel. From these data, the cumulative feed consumption was calculated using the average of feeding standards for the 2 most common broiler strains and the standards developed by feeding companies (i.e., non-strain specific) for as-hatched broilers (i.e., males and females combined). A plot of feed consumption in grams per bird per day was created.
From the broiler chicken questionnaire the start and end age of the birds was available for each ration. Since the end day of one ration was the start day of the next an algorithm was used to prevent overlapping days for each subsequent ration. Regression parameters were calculated within Microsoft™ Excel by using the plotted feed intake curve. A minimum R-square value of more than 0.99 was required to be considered a good fit of the regression line. To obtain the best fitting regression line, the broiler chicken feeding curve was divided into 3 segments. Segment 1, or the first regression line, the estimates were utilized to calculate feed consumption if the age of the birds when they started or finished the ration was less or equal to 21 days (i.e., equivalent to brooding and early grow-out period) (Table 2). The second regression line estimates (segment 2) were used if the age of the birds when they started or finished the ration was greater than or equal to 35 days of age (i.e., equivalent to finisher phase or extended grow-out period in roasters) (Table 2). All other age ranges had feed consumption based on the third regression line depicted (i.e., grow-out period) (Table 2).
Feed consumption calculations were then based on the regression coefficients that were calculated and presented in Table 2. For each ration the appropriate regression coefficients (based on start and end age of the birds) and the number of days the ration was fed (as entered in the survey) were substituted into the area under the curve formulas provided (Table 2). For each ration, 2 integrals were calculated. The lower integral set "t" as the ration start age and the upper integral set "t" as the ration end age. The difference between the upper and lower integral yielded the estimate of feed intake in g/bird for that ration. Feed consumption was converted from grams to tonnes and multiplied by the number of birds at risk (i.e., total birds minus half of the mortalities) to provide an estimate of total tonnes fed for each ration. The number of birds reported were the total birds delivered in the poultry unit of concern (barn or floor) including the 2% allowance provided by the hatchery. This value was then utilized to calculate the grams of antimicrobial consumed per ration and incorporated into the quantitative analysis.
| Segment of feed curve | Bird age in days | Calculated regression coefficients | R2 | Formula for area under the curve and feed consumption calculation | |||
| β0 | β1 | β2 | β3 | ||||
| 1 | ≤ 21 | 14.096 | 1.2095 | 0.228 | -0.003 | 0.99 | β0t+ β1t2/2+ β2t3/3+ β3t4/4 |
| 2 | ≥ 35 | -13.06 | 4.8777 | 0.085 | -0.0017 | 0.99 | β0t+ β1t2/2+ β2t3/3+ β3t4/4 |
| 3 | All other ages | -27.935 | 8.827 | -0.069 | -5.00E-05 | 0.99 | β0t+ β1t2/2+ β2t3/3+ β3t4/4 |
Water consumption
Estimates of water consumption were based on simple regression and integral calculus. Water consumption estimates were uploaded into Microsoft™ Excel. Estimates were based on daily water consumption chartFootnote 16 and a plot of intake in L/bird/day was created.
From the broiler chicken questionnaire, the start and end age of the birds was available for each water treatment. An algorithm was used to prevent any possible overlapping of age in days for consecutive water treatments with different antimicrobials in the same flock. Regression parameters were calculated within Microsoft™ Excel by using the plotted water intake curve. A minimum R-square value of greater than 0.99 was required to be considered a good fit of the regression line. To obtain the best fitting regression values, the water consumption curve was divided into 3 segments. If the age of the birds when they started and ended the water treatment was less than or equal to 21 days of age, the water consumption was based on the regression line for segment 1 of the curve (Table 3). If the age of the birds when they started or ended the water treatment was less than or equal to 38 days of age, the water consumption was based on the regression line for segment 2 of the curve (Table 3). All other age ranges had water consumption calculated from the regression line for segment 3 of the curve. From the regression coefficients, the water consumption could then be calculated using integral calculus and the area under the curve formula as described above under broiler chicken feed consumption (Table 3).
| Segment of feed curve | Bird age in days | Calculated regression coefficients | R2 | Formula for area under the curve and feed consumption calculation | |||
| β0 | β1 | β2 | β3 | ||||
| 1 | ≤ 21 | 0.0322 | 8.00E-05 | 0.0005 | -7.00E-06 | 0.99 | β0t+ β1t2/2+ β2t3/3+ β3t4/4 |
| 2 | ≥ 38 | 0.0335 | -0.0003 | 0.0005 | -7.00E-06 | 0.99 | β0t+ β1t2/2+ β2t3/3+ β3t4/4 |
| 3 | All other ages | -0.4475 | 0.0417 | -0.0007 | 4.00E-06 | 0.99 | β0t+ β1t2/2+ β2t3/3+ β3t4/4 |
Quantity of antimicrobials used in broiler chickens
Based on the species-specific calculations above, the milligrams of active ingredient were obtained for each route of administration, reported by route and aggregate of all routes. For Equation 2 to Equation 4, total animals pertains to the starting flock or herd population minus half of the reported mortalities.
Equation 2. Estimation of total milligrams in feed (broiler chickens, pigs, and turkeys)
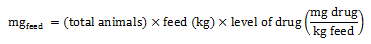
Equation 2 - Text Description
The total milligrams in feed is calculated by multiplying the total number of animals by the quantity of feed consumed (in kilogram), and the level of drug.
Equation 3. Estimation of total milligrams in water (broiler chickens, pigs, and turkeys)
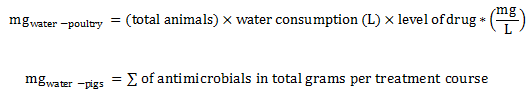
Level of drug* = Inclusion rate indicated in the label x concentration of the drug.
Equation 3 - Text Description
The total milligrams in water for poultry is calculated by multiplying the total number of animals by the quantity of water consumed (in liter) and the level of drug (in milligram of active ingredient by liter).
The total milligrams in water for pigs is calculated by summing the total grams of antimicrobials per treatment course.
Equation 4. Estimation of total milligrams via in ovo or subcutaneous injections (broiler chickens, pigs, and turkeys)

Total animals pertain to the starting herd population minus half of the reported mortality rate at the time of sampling multiplied by the proportion of pigs exposed.
Equation 4 - Text Description
The total milligrams by injection for poultry is calculated by multiplying the total number of broilers by the quantity of milligrams injected by hatching egg or chick.
The total milligrams by injection for pigs is calculated by summing the results of the multiplication of the total number of animals by the result of the multiplication of the concentration of drug (in milligram by milliliter) by the average weight at treatment (in kilogram) and the number of days of drug administration.
Based on the quantity of feed or water consumed, plus quantity administered via injection from the above calculations, the following antimicrobial use metrics or indicators were reported:
Milligrams active ingredient/population correction unit (mg/PCU):
Total milligrams (combined injections, feed, and water) for each antimicrobial/class and overall, adjusted for animal population (1 grow-out cycle) and weight.
- Step 1 population correction unit (PCU) or biomass. (Equation 5): The PCU was calculated by multiplying the total number of animals reported in the questionnaire (equivalent to 1 grow-out cycle; population minus half the mortalities) by the theoretical (standardized) weight at the most likely time of treatment (ESVAC standard weight of 1 kg for broiler, 6.5 kg for turkeys, and 65 kg for swine was used).
- Step 2 mg/PCU (Equation 6): Estimation of mg/PCU for each antimicrobial active ingredient, subsequently aggregated by class, and overall to generate year-specific estimate per species.
Equation 5. Formula for PCU calculation

Equation 5 - Text Description
The PCU (in kilogram) is calculated by multiplying the numbers of animals by the average weight at treatment (in kilogram).
Equation 6. Formula for mg/PCU calculation
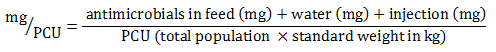
Equation 6 - Text Description
The milligram per population correction unit (PCU) is calculated by dividing the sum of the amount of antimicrobials administered in feed, water and by injection (in milligram) by the PCU value (total population multiplied by the standard weight in kilogram).
Canadian Defined Daily Doses using Canadian doses (DDDvetCA):
The Canadian average labelled daily doses for each antimicrobial were assigned following similar methodology to ESVAC's DDDvet assignment with some exceptionsFootnote 17.
- Step 1 Average daily dose (Equation 7): The average daily dose was determined as follows: each antimicrobial was assigned a DDDvetCA by obtaining all approved doses for chickens, pigs, and turkeys (prevention and treatment purposes) from 2 Canadian referencesFootnote 18,Footnote 19 or from expert opinion, where no labelled product existed (extra-label drug use, ELDU)Footnote 20. The sum of all the doses was then divided by the total number of unique doses.
- Step 2 DDDvetCA (Equation 8): Because the labelled dose (inclusion rates) varied by pharmaceutical form (e.g., g/tonne for products administered via feed, g/L water for products administered via the drinking water, mg/chick or hatching eggs for injectable products), values were standardized in mgdrug/kganimal/day based on the ESVAC approach. As in the ESVAC methodologyFootnote 21, for combination products, DDDvetCA for each antimicrobial component was determined. In broiler chickens and turkeys, this applies to the combination drugs lincomycin-spectinomycin and trimethoprim-sulfadiazine. The values for pigs and chickens are summarized in Table A-3 and Table A-4. Please note that metric development is an iterative process, and thus these values may change (e.g., new products available, change in product labels or approved claims, refinement of the metric).
Equation 7. Average daily dose calculation

- Equation 7 note a
-
All unique doses indicated for treatment and prevention were used to calculate the average daily dose of an antimicrobial; an antimicrobial may have more than one unique dose by product format and/or indication.
Equation 7 - Text Description
The average daily dose is calculated by summing all unique doses divided by the number of unique doses from Canadian references.
Equation 8. Standardization of average daily dose to obtain DDDvetCA with units in mg of drug per kilogram of body weight (animal) per day

Equation 8 - Text Description
The DDDvetCA is calculated by multiplying the average daily dose by the conversion factor.
The nDDDvetCA (Equation 9): For each antimicrobial active ingredient and aggregate of all the antimicrobial active ingredients (yearly total) are adjusted by various species-specific technical units of measurement (e.g., population, weight, days at risk) as described in Equation 9 and Equation 10. Similar to mg/PCU, these indicators are also used for between antimicrobial class and inter-species comparisons over time.
Equation 9. Calculating the number of daily doses in animals using Canadian standards (nDDDvetCA)
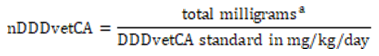
- Equation 9 note a
-
This is the numerator, combining milligrams consumed via feed, water and injections.
Equation 9 - Text Description
The nDDDvetCA is calculated by dividing the total milligrams by the DDDvetCA standard in milligrams per kilograms per day.
Number of Canadian Defined Daily Doses (nDDDvetCA)/1,000 animal-days at risk (Equation 10): Also known as treatment incidence and there are many variations of this equationFootnote 22,Footnote 23,Footnote 24,Footnote 25. This indicator was calculated by dividing the nDDDvetCA (Equation 9) values to the denominator value (flock or herd population minus half of the mortalities multiplied by the ESVAC standard weight and the mean number of days each for one production cycle for the monitored flocks or herds). The days at risk is year-specific (e.g., 2017: 34 days for broiler chickens, 114 days for grower-finisher pigs, and 90 days for turkeys). The final step multiplied the values to 1,000. Please note that Equation 10 differed slightly from the 2016 CIPARS Annual Report; the calculation below was modified to reflect the sequential steps leading to the final antimicrobial use indicator and in line with the methodology described in the literature.
Equation 10. Formula for the number of DDDvetCA/1,000 animal-days at risk

Std. = standard.
Equation 10 - Text Description
The nDDDvetCA per thousand animal-days at risk is calculated by dividing the total antimicrobials (in milligrams) per DDDvetCA (in milligram per by milligrams per kilograms per day) by the value obtained by the multiplication of the total number of animals by the ESVAC standard weight (in kilograms) and the number of days at risk. The result of that division is then multiplied by 1,000.
Number of Canadian Defined Daily Doses/population correction unit (nDDDvet/PCU) (Equation 11): This metric adjusted the nDDDvetCA to the species-specific biomass (see Equation 8, step 2) based on a method described elsewhereFootnote 26.
Equation 11. Formula for the number of DDDvetCA/PCU
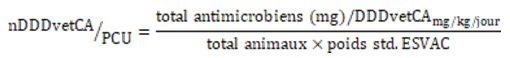
Std. = standard.
Equation 11 - Text Description
The nDDDvetCA per Population correction unit (PCU) is calculated by dividing the total antimicrobials (in milligrams) per DDDvetCA (in milligram per by milligrams per kilograms per day) by the value obtained by the multiplication of the total number of animals by the ESVAC standard weight (in kilograms).
Grower-finisher pigs
Antimicrobial exposures were summarized for each herd. An exposure was defined as any reported use of an active ingredient by a given route of administration in 2017. Data were reported as exposure to an active ingredient by a given route of administration, as well as by exposure to an active ingredient by any administration route. These exposures were summarized by antimicrobial class. It is important to note that antimicrobial exposures through feed tend to involve larger groups of pigs and longer durations of use than antimicrobial exposures via water. Injectable antimicrobials are generally administered on an individual basis to a limited number of pigsFootnote 27.
Feed consumption
Quantitative AMU data (dose and duration) were collected for antimicrobials administered through feed, water, and by injection. The amount of an antimicrobial consumed through feed was estimated from the concentration of the antimicrobial in a given ration multiplied by the cumulative tonnes consumed over the duration of exposure. Estimates of feed intake were based on simple regression equations and integral calculus. Plots of feed consumption per day were created within Microsoft™ Excel, using National Research Council (NRC) tables (Nutrient Requirements of Swine: Eleventh Revised Edition, National Academy of Sciences, 2012) for grower-finisher pigs. Three plots were created to reflect poor (15% less protein deposition per kg feed consumed than the standard pig), medium (standard pig described by NRC), and high (15% more protein deposition than the standard pig) performance. The lightest starting weight recorded for all rations listed on a questionnaire was selected and the corresponding day on the feed consumption table was identified. The number of days the ration was fed was then added to the start day to obtain an end day for that ration. For each successive ration, the number of days the ration was fed was added to the proceeding ration end day. When the reported feeding end day went beyond the NRC table, data were extrapolated up to maximum of 50 additional days.
Regression parameters for each level of pig performance were calculated within Microsoft™ Excel by using the feed intake curve (Table 4). A minimum R-square value higher than 0.99 was required to be considered a good fit of the regression line. From the regression coefficients the feed consumption could then be calculated using integral calculus and the area under the curve formula provided in Table 4 similar to that described above under broiler feed consumption. However, for swine, 3 regression lines (poor, medium and higher performance) were created per ration. Two integrals were calculated using the formula in Table 4. For the lower integral "t" is the start age of the pigs on the ration and for the upper integral "t" is the end age of the pigs on the ration. The difference between the upper and lower integral yielded the estimate of feed intake in kilograms per pig for that ration. For each grower-finisher pig herd an average daily gain (ADG) was calculated based on data provided in the questionnaire; starting and ending weights as well as the number of days pigs were in the grower-finisher stage of production. Farms were categorized as having poor, medium, or high performance by using cut off points which were generated by partitioning the questionnaire ADG data into thirds. High performance herds were defined as herds with an ADG more than 0.8734, medium performance herds had an ADG between 0.8734 to 0.8045, and poor performance herds had ADG less than 0.8045. Based on this categorization, the appropriate regression line and integral were applied to calculate feed consumption. Feed consumption was converted from kilograms to tonnes and multiplied by the number of pigs at risk to provide an estimate of total tonnes fed for each ration. This value was then utilized to calculate the grams of antimicrobial consumed per ration and incorporated in quantitative analyses.
| Pig performance | Calculated regression coefficients | R2 | Formula for area under the curve and feed consumption calculation | ||
|---|---|---|---|---|---|
| β0 | β1 | β2 | |||
| Poor | 0.901 | 0.0243 | -7.00E-05 | 0.99 | β0t+ β1t2/2+ β2t3/3 |
| Medium | 0.8974 | 0.0267 | -9.00E-05 | 0.99 | β0t+ β1t2/2+ β2t3/3 |
| High | 0.8945 | 0.0291 | -0.0001 | 0.99 | β0t+ β1t2/2+ β2t3/3 |
Water consumption
From the grower-finisher pig questionnaire, the total grams of the active ingredient delivered for each water treatment course was available. By obtaining total grams delivered per treatment course there was no need to calculate out the water consumption for the proportion and size of pigs exposed. For each herd, total AMU through water was obtained by summing the grams of either active ingredient, antimicrobial class or any antimicrobial used as required for analysis.
Injection
From the grower-finisher questionnaire, for AMU by injection, the product concentration in mg/mL, the number of days treated, the average weight of the pigs at the time of treatment and the proportion of pigs exposed was available. From these parameters the total mg of antimicrobial can be calculated for the farm. For each herd, total AMU via injection was obtained by summing the milligrams of either active ingredient, antimicrobial class or any antimicrobial used as required for analysis.
Quantity of antimicrobials used in grower-finisher pigs
Please refer to the "Quantity of antimicrobials used in broiler chickens" section (see above) for the quantity of antimicrobial use in grower-finisher pigs calculations.
Turkeys
Antimicrobial exposures from the hatching stage to the end of growth or pre-harvest sampling stage (approximately 1 week prior to slaughter) were summarized for each flock. An exposure was defined as any reported use of an active ingredient by a given route of administration. Data were reported as exposure to an active ingredient by a given route of administration, as well as by exposure to an active ingredient by any administration route. These exposures were summarized by antimicrobial class.
Feed consumption
Estimates of feed intake were based on simple regression and integral calculus. Feed consumption estimates from most recently available references including performance standards for Aviagen (Nicolas)Footnote 28 and Hybrid turkeysFootnote 29 were loaded into Microsoft™ Excel. From these data, the cumulative feed consumption was calculated using the average of feeding standards for the 2 most common broiler strains and the standards developed by feeding companies (i.e., non-strain specific) for as-hatched broilers. Regression calculations were completed for broiler turkeys, turkey hens and Tom turkeys
Feed consumption was calculated on a per ration bases using the same methodology as described above for broiler chicken feed consumption. Separate regression coefficients were calculated for broiler turkeys, hens and toms and were applied appropriately based on the selection of the target market from the survey at the time of data entry. Regression line coefficients and area under the curve formulas are provided in Table 5.
| Bird type | Calculated regression coefficients | R2 | Formula for area under the curve and feed consumption calculation | |||
|---|---|---|---|---|---|---|
| β0 | β1 | β2 | β3 | |||
| Broiler turkeys | -0.1085 | 0.1782 | 0.008 | -0.0003 | 0.99 | β0t+ β1t2/2+ β2t3/3+ β3t4/4 |
| Toms | -0.0545 | 0.1398 | 0.016 | -0.0005 | 0.99 | β0t+ β1t2/2+ β2t3/3+ β3t4/4 |
| Hens | -0.1424 | 0.2016 | 0.002 | -0.0002 | 0.99 | β0t+ β1t2/2+ β2t3/3+ β3t4/4 |
Water consumption
Estimates of water consumption were based on simple regression and integral calculus. Water consumption estimates were uploaded into Microsoft™ Excel from most recently available referenceFootnote 30 and a daily water consumption chart and a plot of intake in litres/bird/day was created.
Water consumption was calculated on a per treatment course basis using the same methodology as described above for broiler chicken water consumption. Separate regression lines were calculated for birds less than or equal to 13 weeks of age and for those greater than 13 weeks of age to achieve the best fitting curve. Regression line coefficients and area under the curve formulas are provided in Table 6.
| Segment of water curve | Bird age in weeks | Calculated regression coefficients | R2 | Formula for area under the curve and water consumption calculation | ||
| β0 | β1 | β2 | ||||
|---|---|---|---|---|---|---|
| 1 | ≤ 13 | -0.0131 | 0.0487 | 0.0019 | 0.99 | β0t+ β1t2/2+ β2t3/3 |
| 2 | > 13 | 0.8922 | 0.0018 | 0.0002 | 0.99 | β0t+ β1t2/2+ β2t3/3 |
Quantity of antimicrobials used in turkeys
Please refer to the "Quantity of antimicrobials used in broiler chickens" section (see above) for the quantity of antimicrobial use in turkey calculations.
Antimicrobial resistance
Human surveillance
Objective(s)
The objective of the Surveillance of Human Clinical Isolates component of CIPARS is to provide a representative and methodologically unified approach to monitor temporal variation in the prevalence of antimicrobial resistance in Salmonella isolated from humans.
Surveillance design
Hospital-based and private clinical laboratories culture human Salmonella isolates in Canada. Although reporting is mandatory through laboratory notification of reportable diseases to the National Notifiable Disease Reporting System, forwarding of Salmonella isolates to provincial reference laboratories is voluntary and passive. A high proportion (84% in 2001)Footnote 31 of Salmonella isolates are forwarded to Provincial Public Health Laboratories (PPHLs), but this proportion may vary among laboratories. The Yukon, Northwest Territories, and Nunavut, which do not have a PPHL counterpart, forwarded their isolates to one of the PPHLs.
Prior to 2002, PPHLs forwarded Salmonella isolates to the Enteric Diseases Program, National Microbiology Laboratory (NML)@Winnipeg, Public Health Agency of Canada (PHAC), Winnipeg, Manitoba for confirmation and subtype characterization. A letter of agreement by which provinces agreed to forward all or a subset of their Salmonella isolates to NML@Winnipeg for CIPARS was signed in 2002 by the PPHLs and PHAC. This agreement officially launched the surveillance program.
To ensure a statistically valid sampling plan, all human Salmonella isolates (outbreak-associated and non-outbreak-associated) received passively by PPHLs in Saskatchewan, Manitoba, New Brunswick, Nova Scotia, Prince Edward Island, and Newfoundland and Labrador were forwarded to the NML. The PPHLs in more heavily populated provinces (British Columbia, Alberta, Ontario, and Québec) forwarded only the isolates received from the 1st to the 15th of each month. However, all human S. Newport and S. Typhi isolates were forwarded to the NML because of concerns of multidrug resistance and clinical importance, respectively.
The PPHLs were also asked to provide a defined set of data for each forwarded isolate, including serovar name, date collected, site of isolation, patient age, sex, and province of residence.
Retail meat surveillance
Objective(s)
The objectives of CIPARS Retail Meat Surveillance component are to provide data on the prevalence of antimicrobial resistance and to monitor temporal variations in selected bacteria found in raw meat at the province/region level.
Surveillance design
Retail Meat Surveillance provides a measure of human exposure to antimicrobial-resistant bacteria via the consumption of undercooked meat. Retail food represents a logical sampling point for surveillance of antimicrobial resistance because it is the endpoint of food animal production. Through meat sample collection and testing, the retail surveillance component provides a measure of human exposure to antimicrobial resistant bacteria through the consumption of meat products available for purchase by Canadian consumers. The scope of the surveillance framework can be modified as necessary (e.g., to evaluate different food commodities, bacteria, or geographic regions) and functions as a research platform for investigation of specific questions regarding antimicrobial resistance in the agri-food sector.
The unit of concern in Retail Meat Surveillance in 2017 was the bacterial isolate cultured from one of the commodities of interest. In this situation, the commodities were raw meat products commonly consumed by Canadians, which originated from the 3 animal species sampled in the Abattoir Surveillance component as well as turkey beginning in 2012. These raw meat products consisted of chicken (legs or wings [skin on]), turkey (ground), pork (chops), and beef (ground).
For ground beef, a systematic collection of extra-lean, lean, medium, and regular ground beef was performed to ensure representation of the heterogeneity of ground beef with respect to its origins (e.g., domestic vs. imported beef or raised beef cattle vs. culled dairy cattle). The meat cuts "legs or wings with skin on", "ground turkey", "pork chops", and "ground beef" were chosen on the basis of suspected high prevalences of the targeted bacterial species within and the low purchase prices of these commoditiesFootnote 32 and for comparability to other international retail surveillance programs.
Bacteria of interest in chicken were Campylobacter, Salmonella, and generic E. coli and Salmonella and generic E. coli only for ground turkey. Recovery of Campylobacter from ground turkey was stopped mid-2016 due to low prevalence; sampling did not continue in 2017. In pork, both Salmonella and E. coli were cultured, but only isolates of E. coli underwent antimicrobial susceptibility testing for routine surveillance and annual reporting. Salmonella was isolated from pork mainly to provide recovery estimates from this commodity for other Public Health Agency of Canada programs. Because the prevalence of Salmonella in pork is low, antimicrobial susceptibility results are not presented on an annual basis but are pooled and presented over a multi-year period in the interest of precision. Recovery of Campylobacter from pork was not attempted because of the low prevalence observed in the initial stages of Retail Meat Surveillance. In beef, only E. coli was cultured and then tested for antimicrobial susceptibility given the low prevalence of Campylobacter and Salmonella in this commodity at the retail level, as determined during the early phase of the program.
Sampling methods
Generally, the sampling protocol was designed to evaluate antimicrobial resistance in certain bacterial species that contaminate retail meat and to which Canadian consumers may subsequently be exposed. In 2017, it primarily involved continuous weekly submission of samples of retail meat from randomly selected geographic areas (i.e., census divisions defined by Statistics Canada), weighted by population, in each participating province.
In 2017, retail meat samples were collected in British Columbia, Prairies (a region including the provinces of Saskatchewan, Alberta, and ManitobaFootnote 33), Ontario, and Québec. Unlike previous years (2013 and 2014), no data were presented in recent years (2015, 2016, and 2017) for the Atlantic region (a region including the provinces of New Brunswick, Nova Scotia, Prince Edward Island, and Newfoundland and LabradorFootnote 34) as retail sampling activities in this region were suspended due to budgetary constraints. Additionally, during the 2017 sampling year in Ontario, only a partial year of retail sampling was conducted due to the availability of sampling technician staff. As a result, the sampling target and subsequent isolate yields in this province were not achieved and therefore, all retail data presented for Ontario in 2017 should be interpreted with caution.
Data from Statistics Canada were used to define strata. This was done by using cumulative population quartiles (or tertiles from a list of census divisions in a province, sorted by population in ascending order. Generally, between 15 and 18 census divisions per province/region were then chosen by means of stratified random selection and weighted by population within each stratum. The number of sampling days allocated to each stratum was also weighted by population and is summarized as follows:
British Columbia
- Stratum 1: 10 divisions selected, with 1 sampling day per division per year
- Stratum 2: 4 divisions selected, with 3 sampling days per division per year
- Stratum 3: 1 division selected, with 20 sampling days per year
Prairies (Alberta only for 2017)
- Stratum 1: 9 divisions selected, with 2 sampling days per division per year
- Stratum 2: 5 divisions selected, with 3 sampling days per division per year
- Stratum 3: 2 divisions selected, with 5 sampling days per division per year
- Stratum 4: 1 division selected, with 7 sampling days per year
Ontario and Québec
- Stratum 1: 10 divisions selected, with 2 sampling days per division per year
- Stratum 2: 4 divisions selected, with 5 sampling days per division per year
- Stratum 3: 2 divisions selected, with 10 sampling days per division per year
- Stratum 4: 1 division selected, with 20 sampling days per year
Generally, field workers in OntarioFootnote 35 and Québec conducted sampling on a weekly basis, and those in British Columbia and the Prairie region conducted sampling every other week. Sampling was less frequent in British Columbia and the Prairie region because of funding constraints, limited laboratory capacity, and a desire to avoid over-sampling at particular stores. Samples were collected on Mondays or Tuesdays for submission to the laboratory by Wednesday. Samples submitted from outside Québec were sent to the same laboratory via 24-hour courier.
In each province in most cases, 2 census divisions were sampled each sampling week. In each census division, 4 stores were selected prior to the sampling day, based on store type. Generally, 3 chain stores and 1 independent market or butcher shop were selected. An exception to this protocol was made in densely populated urban census divisions (e.g., Toronto or Montréal), where 2 chain stores and 2 independent markets or butcher shops were sampled to reflect the presumed shopping behaviour of that subpopulation. Generally speaking, from each store type, we aimed to collect 1 sample of each commodity of interest was for a total of 15 meat samples (4 chicken, 4 turkey, 4 pork, and 3 beef samples) per division per sampling dayFootnote 36. When possible, a given store was sampled only once per sampling year. In some cases due to reduced availability of certain meats and store closures etc., the desired sample yield was not achieved.
Prevalence estimates were used to determine the numbers of samples to be collected, which were based on an expected yield of 100 isolates per commodity per province per year, plus 20% to account for lost or damaged samples. Because sampling was less frequent in British Columbia and the Prairie region than in OntarioFootnote 37 and Québec, the target of 100 isolates per year may not have always been met in those provinces/regions.
Notebook computers containing a custom electronic submission form were used to capture the following store and sample data:
- Type of store
- Number of cash registers (surrogate measure of store volume)
- "Sell-by" or packaging date
- "May contain previously frozen meat" label: yes or no
- Final processing in store: yes, no, or unknown
- Air chilled: yes, no, or unknown (applied to chicken samples only)
- Organic: yes, no, or unknown
- Antimicrobial free: yes, no, or unknown
- Price per kilogram
Individual samples were packaged in sealed zipper-type bags and placed in 16 L thermal coolers for transport. The ambient environmental temperature was used to determine the number of ice packs placed in each cooler (i.e., 1 ice pack for temperatures below 20°C and 2 ice packs for temperatures 20°C or higher). In 1 or 2 coolers per sampling day, instruments for recording temperature dataFootnote 38 were used to monitor temperatures to which samples were exposed.
Abattoir surveillance
Objective(s)
The objectives of the CIPARS Abattoir Surveillance component are to provide nationally representative, annual antimicrobial resistance data for bacteria isolated from animals entering the food chain, and to monitor temporal variations in the prevalence of antimicrobial resistance in these bacteria.
Surveillance design
Abattoir Surveillance only includes animals that originated from premises within Canada. Established in September 2002, this component initially targeted generic Escherichia coli and Salmonella within the food animal commodities associated with the highest per capita meat consumption: beef cattle, broiler chickens, and pigs. In 2003, the component was refined to discontinue Salmonella isolation from beef cattle because of the low prevalence of Salmonella in that population. Campylobacter surveillance was initiated in beef cattle in late 2005 in order to include a pathogen in beef cattle surveillance and to provide data on fluoroquinolone resistance, following the approval of a fluoroquinolone for use in cattle. Campylobacter surveillance was also initiated in chickens in 2010 and pigs in 2012.
In the Abattoir Surveillance component, the unit of concern (i.e., the subject of interest) was the bacterial isolate. The bacteria of interest were isolated from the caecal contents (not carcasses) of slaughtered food animals to avoid misinterpretation related to cross-contamination and to better reflect antimicrobial resistance in bacteria that originated on the farm.
Over 90% of all food-producing animals in Canada are slaughtered in federally inspected abattoirs annuallyFootnote 39. The program is based on the voluntary participation of federally inspected slaughter plants from across Canada. The sampling method was designed with the goal that, across Canada, 150 isolates of Salmonella and generic E. coli and 100 isolates of Campylobacter would be recovered from each of the 3 animal species over a 12 month period. These numbers represented a balance between acceptable statistical precision and affordabilityFootnote 40. The actual number of samples collected was determined for each food animal species on the basis of the expected caecal prevalence of the bacteria in that animal species. For example, if the goal was 150 isolates and the expected bacterial prevalence was 10%, then 1,500 samples would need to be collected and submitted for bacterial isolation.
The sampling design was based on a 2-stage sampling plan, with each commodity handled separately. The first stage consisted of random selection of federally inspected slaughterhouses. The probability of an abattoir being selected was proportional to its annual slaughter volume. The second stage involved systematic selection of animals on the slaughter line. The annual number of caecal samples collected at each abattoir was proportional to its slaughter volume.
Sampling methods
To minimize shipping costs and allow each abattoir to maintain efficiency, the annual total number of samples to be collected in each abattoir was divided by 5, resulting in the number of collection periods. For each collection period, 5 to 7 caecal samples were collected within 5 days, at the convenience of the slaughterhouse staff, provided the 5 animals and associated samples originated from different groups. Sampling from different groups of animals was important to maximize diversity and avoid bias attributable to overrepresentation of particular producers. Collection periods were uniformly distributed throughout the year to avoid any bias that may have resulted from seasonal variation in bacterial prevalence and antimicrobial susceptibility test results.
Forty-five federally inspected slaughter plants (5 beef cattle plants, 26 poultry plants, and 13 swine plants) from across Canada participated in the 2017 CIPARS Abattoir Surveillance component. These plants represented over 95% of the cattle, 70% of the chickens, and 80% of the pigs slaughtered at federally inspected abattoirs in Canada in 2017. Samples were obtained according to a predetermined protocol, with modifications to accommodate various production-line configurations in the different plants. Protocols were designed to avoid conflict with carcass inspection methods, plant-specific Food Safety Enhancement Programs, and Health and Safety requirements. They were also designed to avoid situations of potential cross-contamination. All samples were collected by industry personnel under the oversight of the Veterinarian-in-Charge of the Canadian Food Inspection Agency.
Farm surveillance
Objective(s)
The objectives of the CIPARS Farm Surveillance component are to provide data on antimicrobial use and resistance, to monitor temporal trends in the prevalence of antimicrobial resistance, to investigate associations between antimicrobial use and resistance on feedlot cattle, broiler chickens, grower-finisher pigs, and turkeys, and to provide data for human health risk assessments.
Surveillance design
The Farm Surveillance component was the third active surveillance component implemented by CIPARS. Taken together, with the Abattoir Surveillance and Retail Meat Surveillance components, these data validate the information collected at key points along the farm-to-fork food production chain. This initiative is built on a sentinel farm framework. Questionnaires are used to collect data on farm demographics, animal health and antimicrobial use. Composite pen fecal samples are collected and submitted to laboratories for bacterial isolation and antimicrobial susceptibility testing. The bacteria of interest in broiler chickens, feedlot cattle, and turkey were Campylobacter, Salmonella, and generic E. coli; Salmonella and E. coli were isolated in grower-finisher pigs.
Feedlot cattle
The CIPARS Farm Surveillance feedlot cattle component was initiated in 2016. Sampling is currently only being done in the Alberta FoodNet Canada site, however, expansion into a nation program is the long term objective. Feedlot cattle are sampled at close to market weight. This stage of production was selected because of their proximity to the consumer.
Broiler chickens
The CIPARS Farm Surveillance broiler chicken component was initiated in April 2013 in the 4 major poultry-producing provinces in Canada (British Columbia, Alberta, Ontario, and Québec). In 2014, due to external funding from Saskatchewan Agriculture, Saskatchewan also started to participated in the program. The Broiler Farm Surveillance component samples flocks at least 1 week before shipment for slaughter (i.e., pre-harvest stage). This stage of production was selected because it is most proximal to the consumer of all the farm production stages. Half of the flocks sampled for the year were also sampled at the time of chick placement to determine the resistance profiles of chicks on arrival and carry-over of resistant organism from the previous flock.
Grower-finisher pigs
CIPARS Farm Surveillance swine component was initiated in 2006 in the 5 major pork-producing provinces in Canada (Alberta, Saskatchewan, Manitoba, Ontario, and Québec). The swine industry was selected as the pilot commodity for development of the Farm Surveillance infrastructure because the Canadian Quality Assurance (CQA®) program had been extensively implemented by the industry and because, in 2006, unlike in the other major livestock commodities, there had not been a recent outbreak of foreign animal disease in pigs. The Farm Surveillance component concentrates on grower-finisher pigs. Pigs in this stage of production were chosen because of their proximity to the consumer.
Turkeys
The CIPARS Farm Surveillance turkey component was initiated in 2016 in the 3 major poultry-producing provinces in Canada (British Columbia, Ontario, and Québec). The turkey Farm Surveillance component samples flocks at least 1 week before shipment for slaughter (i.e., pre-harvest stage). This stage of production was selected because it is most proximal to the consumer of all the farm production stages.
Sampling methods
Feedlot cattle
Feedlot veterinarians, with feedlots in the FoodNet Canada (FNC) Alberta Sentinel site, were purposively selected from the list of veterinarians practicing feedlot medicine. Enrolled veterinarians then recruited sentinel herds to participate in this voluntary surveillance program. Enrolled feedlots were to be representative of the veterinary practice profile. The number of sentinel herds targeted for sampling is 30; which is the required number for the FNC sentinel site. To preserve the anonymity of participating producers, herd veterinarians collected the samples and data and submit coded information to the Public Health Agency of Canada.
Feedlots were visited once per year for sample and data collection. Pooled fecal samples were collected from 6 pens of cattle that were close to market weight (ideally greater than 120 days on feed and greater than 500 kg). Veterinarians were asked to distribute their sampling visits across the year to account for seasonal variations in pathogen prevalence and diseases that may drive AMU on farms.
A 1 page survey sheet was included with each sampling kit in order to collect information for both FNC and CIPARS. Data requested for each pen of cattle sampled included minimum and maximum days on feed, minimum and maximum weight of cattle in the pen, the average pen capacity, the feedlot capacity, and current inventory. Other information requested, for FNC purposes, related to water source, and water treatments.
Broiler chickens
Poultry veterinarians recruited sentinel flocks to participate in this voluntary national surveillance program. The number of sentinel flocks allocated to each of the 4 participating province/regions (British Columbia, Prairies [Alberta and Saskatchewan], Ontario and Québec) was proportional to the national total of quota-holding producers, except in the FoodNet Canada sentinel sites, where a minimum of 30 flocks were sampled. In Alberta, laboratory testing for all flocks was provided by the Alberta Agriculture and Forestry, Agri-Food Laboratories Branch. In Saskatchewan, the Saskatchewan Ministry of Agriculture provided full financial support for 9 flocks.
To preserve the anonymity of participating producers, poultry veterinarians collected the samples and data and submitted coded information to Public Health Agency of Canada (PHAC). The Canadian Hatchery Federation (CHF) and the Canadian Poultry and Egg Processors Council ensured confidentiality by holding the key to hatcheries; only the coded information was known to PHAC.
Poultry veterinary practices were purposively selected from each province. Each veterinarian recruited a predetermined number of sentinel farm sites proportional to their practice profile and availability by use of specific inclusion and exclusion criteria. To be included, farms were required to be a Safe, Safer, Safest™ compliant quota-holding broiler operations (i.e., broilers are the major commodity reared on-site but producers may also have other animal species and/or commodities). Antibiotic-free, raised without antibiotics or organic production systems were selected proportional to the veterinarian's practice profile. Veterinarians also ensured that selected farms were also representative of all the CHF hatcheries supplying chicks and representative of the feed mills supplying feeds in the province of their practice, and were geographically distributed (i.e., not neighboring flocks). Additionally, these farms were demographically reflective of the veterinary practice and overall broiler industry profile (e.g., variety of flock management: poor to excellent performing flocks, variety in volume of chicks placed: low to high flock densities). These criteria helped ensure that the flocks enrolled were representative of most broiler flocks raised in Canada. The veterinarians were also asked to distribute their sampling visits across the year to account for seasonal variations in pathogen prevalence and diseases that may drive AMU at the hatchery and on farms.
Sentinel broiler flocks were visited during the last week of growth (chickens more than 30 days of age), once per year for sample and data collection. Four pooled fecal samples, representing 1 per floor quadrant with at least 10 fecal droppings were collected from randomly selected barns and floors (if multiple level/pen barn). On a trial basis, a proportion of the flocks were also visited when the chicks arrived at the barn. Using a sterile sponge, 2 environmental barn surface samples and 3 meconium samples were collected. The meconium samples were collected from the liners (chick pads) of the boxes used to ship chicks from the hatchery to the barn.
Grower-finisher pigs
Swine veterinarians recruited sentinel herds to participate in this voluntary national surveillance program. The number of sentinel herds allocated to each of the 5 participating provinces was proportional to the national total of grower-finisher pig units, except in Saskatchewan, where 3 additional sentinel herds were included. Support for the 3 extra herds, was provided by the Saskatchewan Ministry of Agriculture.
To preserve the anonymity of participating producers, herd veterinarians collected the samples and data and submitted coded information to the PHAC. In the case of corporate herds, noncorporate supervisory veterinarians ensured confidentiality by holding the key to corporate herd codes. This step was taken because knowing a corporate veterinarian's name could have identified the corporation associated with the herd, thereby breaking anonymity.
All veterinarians practicing swine medicine in each participating province are eligible to participate in the program. Each veterinarian selected a predetermined number of sentinel farm sites by use of specific inclusion and exclusion criteria. To be included, herds were required to be CQA®validated, produce more than 2,000 market pigs per year, and be representative of the characteristics (i.e., similar production volumes and types of production systems) and geographic distribution of herds in the veterinarian's swine practice. Herds were excluded when they were regarded as organic with respect to animal husbandry, were fed edible residual material, or were raised on pasture. These criteria helped ensure that the herds enrolled were representative of most grower-finisher pig herds in Canada.
Sentinel grower-finisher pig herds were visited once per year for sample and data collection. Pooled fecal samples were collected from 6 pens of pigs that were close to market weight (i.e., more than 80 kg [175 lb]). Veterinarians were asked to distribute their sampling visits across the year to account for seasonal variations in pathogen prevalence and diseases that may drive AMU on farms.
Turkeys
Poultry veterinarians recruited sentinel flocks to participate in this voluntary national surveillance program. The number of sentinel flocks allocated to each of the 3 participating province/regions (British Columbia, Ontario and Québec) was proportional to the national total of quota-holding producers, except in the FoodNet Canada sentinel sites, where a minimum of 30 flocks were sampled.
To preserve the anonymity of participating producers, poultry veterinarians collected the samples and data and submitted coded information to Public Health Agency of Canada (PHAC). The Canadian Hatchery Federation (CHF) and the Canadian Poultry and Egg Processors Council ensured confidentiality by holding the key to hatcheries; only the coded information was known to PHAC.
Poultry veterinary practices were purposively selected from each province. Each veterinarian recruited a predetermined number of sentinel farm sites proportional to their practice profile and availability by use of specific inclusion and exclusion criteria. To be included, farms were required to be a TFC On-Farm Food Safety Program©compliant, quota-holding broiler operations (i.e., turkeys are the major commodity reared on-site but producers may also have other animal species and/or commodities). Antibiotic-free, raised without antibiotics or organic production systems were selected proportional to the veterinarian's practice profile. Veterinarians also ensured that selected farms were also representative of all the CHF hatcheries supplying poults and representative of the feed mills supplying feeds in the province of their practice, and were geographically distributed (i.e., not neighboring flocks). Additionally, these farms were demographically reflective of the veterinary practice and overall turkey industry profile (e.g., variety of flock management: poor to excellent performing flocks, variety in volume of poults placed: low to high flock densities). These criteria helped ensure that the flocks enrolled were representative of most turkey flocks raised in Canada. The veterinarians were also asked to distribute their sampling visits across the year to account for seasonal variations in pathogen prevalence and diseases that may drive AMU at the hatchery and on farms.
Sentinel turkey flocks were visited during the last week of growth (turkeys, last week of growth depending on the marketing weight category: broilers, light hens, heavy hens, light toms, heavy toms), once per year for sample and data collection. Four pooled fecal samples, representing 1 per floor quadrant with at least 10 fecal droppings were collected from randomly selected barns and floors (if multiple level/pen barn).
Surveillance of animal clinical isolates
Objective(s)
The objective of Surveillance of Animal Clinical Isolates is to detect emerging antimicrobial resistance patterns as well as new serovar/resistance pattern combinations in Salmonella.
Surveillance design
This component of CIPARS relies on samples that are typically collected and submitted to veterinary diagnostic laboratories by veterinarians and/or producers. Consequently, sample collection and submission, as well as Salmonella isolation techniques varied among laboratories over the year.
Salmonella isolates were sent by provincial and private animal health laboratories from across the country to the Salmonella Reference Laboratory (SRL) at the National Microbiology Laboratory (NML)@Guelph with the exception of Québec, where isolates from animal health laboratories were sent to the Laboratoire d'épidémiosurveillance animale du Québec, du ministère de l'Agriculture, des Pêcheries et de l'Alimentation du Québec for serotyping. Isolates and serotyping results for S. Enteritidis and S. Typhimurium from Québec were then forwarded to the NML@Guelph for phage typing and antimicrobial resistance testing. Isolates from Québec that were not S. Enteritidis or S. Typhimurium were serotyped at NML@Guelph. It is important to note that not all isolates received by provincial animal health laboratories were forwarded to the NML@Guelph, with the exception of isolates received by provincial animal health laboratories in British Columbia, Ontario, Québec, and Prince Edward Island. Therefore, coverage may have varied considerably among provinces.
Samples submitted for testing may have been collected from sick animals, animal feed, the animal's environment, or non-diseased animals from the same herd or flock. Results from chicken, turkey, cattle, pigs, and horses are reported. Cattle isolates could have originated from dairy cattle, milk-fed or grain-fed veal, or beef cattle. Chicken isolates were largely from layer hens or broiler chickens, but could also have been from primary layer breeders or broiler breeder birds. A proportion of the turkey isolates might have been recovered from turkey-related environmental samples.
Feed and feed ingredients
Sampling design
Data from the Feed and Feed Ingredients component of CIPARS were obtained from monitoring programs of the Canadian Food Inspection Agency (CFIA) and a few isolates from provincial authorities.
The CFIA collects samples of animal feed under 2 different programs: Program 15A (Monitoring Inspection: Salmonella) and Program 15E (Directed Inspection: Salmonella). Under Program 15A, feeds produced at feed mills, rendering facilities, ingredient manufacturers, and on-farm facilities are sampled and tested for Salmonella. Although this program makes use of a random sampling process, extra attention is paid to feeds that are more likely to have a higher degree of Salmonella contamination, such as those that contain rendered animal products, oilseed meals, fish meals, grains, and mashes. Program 15E targets feeds or ingredients from establishments that:
- produce rendered animal products, other feeds containing ingredients in which Salmonella could be a concern (e.g., oilseed meal or fishmeal), or a significant volume of poultry feed.
- are known to have repeated problems with Salmonella contamination.
- have identified a Salmonella serovar that is highly pathogenic (e.g., Typhimurium, Enteritidis, or Newport).
Program 15E is a targeted program; samples are not randomly selected.
Bacterial isolation methods
All samples were cultured by use of standard protocols as described below. All primary isolation of human Salmonella isolates was conducted by hospital-based or private clinical laboratories in participating provinces/regions. Most primary isolation of Escherichia coli, Salmonella, and Campylobacter from agri-food samples was conducted at the National Microbiology Laboratory (NML)@Saint-Hyacinthe. Part of the primary isolation for Farm Surveillance was conducted at the Agri-Food Laboratory of the Alberta Agriculture and Rural Development. Samples from the CIPARS Surveillance of Animal Clinical Isolates component were cultured by various participating laboratories. Most primary bacterial isolation of samples from Feed and Feed Ingredients was conducted by the CFIA: Laboratory Services Division (Calgary or Ottawa).
Salmonella
Surveillance of Human Clinical Isolates
Hospital-based and private clinical laboratories isolated and identified Salmonella from human samples according to approved methodsFootnote 41,Footnote 42,Footnote 43,Footnote 44.
Surveillance of agri-food isolates (Retail Meat Surveillance, Abattoir Surveillance, and Farm Surveillance)
The method used to isolate Salmonella was a modification of the MFLP-75 methodFootnote 45. This method allowed isolation of viable and motile Salmonella from fecal (Farm Surveillance) matter, caecal (Abattoir Surveillance) content, and meat (Retail Meat Surveillance) from agri-food samples. It is based on the ability of Salmonella to multiply and be motile in modified semi-solid Rappaport Vassiliadis (MSRV) medium at 42°C.
Retail Meat Surveillance: depending on the sample type either 1 chicken legFootnote 46, 1 pork chop or 25 g of ground turkey was added to 225 mL of Buffered Peptone Water (BPW). One hundred milliliters of the peptone rinse were kept for Campylobacter and/or E. coli isolation. Chicken and turkey samples were left in the remaining volume of peptone rinse and incubated at 35 ± 1°C for 24 hours. Afterward, a MSRV plate was inoculated with 0.1 mL of the rinse and incubated at 42 ± 1°C for 24 to 72 hours. Migration greater than or equal to 20mm were then streaked onto MacConkey agar. Suspect colonies were screened for purity and used to inoculate triple-sugar-iron and urea agar slants. Presumptive Salmonella isolates were assessed using the indole test, and their identities were verified by means of slide agglutination with Salmonella Poly A-I and Vi antiserum.
Abattoir Surveillance and Farm Surveillance: a 25 g portion of each beef, pig, broiler chicken, or turkey caecal/fecal sample were mixed with 225 mL of BPW. Chicken caecal/fecal contents were weighed and mixed with BPW at a ratio of 1:10. Environmental and chick meconium sponges were mixed with 100 mL of BPW. Samples were incubated at 35 ± 1°C for 24 hours. Afterward, the method used was the same as the one described in the Salmonella Retail Meat Surveillance section.
Surveillance of animal clinical isolates
Salmonella was isolated according to standard procedures, which varied among laboratories. Most methods for detecting Salmonella in animal clinical isolates were similar in principle and involved pre-enrichment, selective enrichment, differential and selective plating, isolation, and biochemical and serological confirmation of the selected isolates.
Feed and feed ingredients
Under both Canadian Food Inspection Agency programs (15A and 15E), all samples were collected aseptically and submitted for bacterial culture and isolation. For Salmonella isolation, MSRV medium was used.
Escherichia coli
Retail Meat Surveillance
Fifty milliliters of the peptone rinse prepared as stated in the Salmonella Retail Meat Surveillance section were mixed with 50 mL of double strength EC Broth and incubated at 42 ± 1°C for 24 hours. One loopful of the mixture was then streaked onto Eosin Methylene Blue agar and incubated at 35 ± 1°C for 24 hours. Suspect colonies were screened for purity and transferred onto trypticase soy agar with 5% sheep blood. Presumptive E. coli colonies were assessed using Simmons citrate and indole tests. The E. coli isolates with negative indole test results were confirmed using a bacterial identification test kitFootnote 47.
Abattoir Surveillance and Farm Surveillance
One drop of the peptone mixture prepared as earlier stated in the Surveillance of Agri-Food Isolates/Salmonella Abattoir Surveillance and Farm Surveillance section was streaked onto MacConkey agar and incubated at 35 ± 1°C for 18 to 24 hours. Suspect lactose-fermenting colonies were screened for purity and transferred onto Luria-Bertani agar. Presumptive E. coli colonies were assessed as in the Retail Meat Surveillance for E. coli.
Campylobacter
Retail Meat Surveillance
Fifty milliliters of the peptone rinse prepared as previously stated in the Salmonella Retail Meat Surveillance section, were mixed with 50 mL of double-strength Bolton broth and incubated in a microaerophilic atmosphere at 42 ± 1°C for 44 to 48 hours. A swab saturated with broth was then swabbed then streaked using 3 quadrants onto a modified Charcoal Cefoperazone Deoxycholate Agar (mCCDA) plate and incubated in a microaerophilic atmosphere at 42 ± 1°C for 24 to 72 hours. Suspect colonies were streaked onto a second mCCDA and incubated. From the second mCCDA plate, a colony was then streaked onto a Mueller Hinton with citrated sheep's blood agar plate and incubated in a microaerophilic atmosphere at 42 ± 1°C for 24 to 48 hours. Presumptive Campylobacter colonies were identified using the following tests: Gram stain, oxidase, and catalase. A multiplex PCR (mPCR)Footnote 48 was used to speciate colonies. Specific genomic targets (hippuricase in C. jejuni and aspartokinase in C. coli) were amplified by mPCR from bacterial lysates. Products were visualized on agarose gel and identified based on their specific molecular size using the QIAxcel®methodFootnote 49. An internal universal control (16s rRNA) was incorporated into the PCR method. The priming oligonucleotides used in the PCR were highly specific for C. jejuni or C. coli and will not amplify DNA present in any other Campylobacter spp. or non-Campylobacter organisms. Unidentified species of Campylobacter are collectively referred to in the CIPARS reports as "Campylobacter spp.". However, when used alone, the term "Campylobacter" refers to all Campylobacter species.
Abattoir Surveillance and Farm Surveillance
One milliliter of BPW mixture prepared as previously stated in the Salmonella Abattoir Surveillance and Farm Surveillance sections, was mixed with 9 mL of Hunt's enrichment broth (HEB) and incubated in a microaerophilic atmosphere at 35 ± 1°C for 4 hours. After this first incubation, 36 μL of sterile cefoperazone were added to the HEB tubes which were then sent back to microaerophilic incubation, this time at 42 ± 1°C for 20 to 24 hours. A swab saturated with HEB was then used to inoculate a mCCDA plate and incubated at 42 ± 1°C in microaerophilic conditions for 24 to 72 hours. Suspect colonies were assessed as described earlier in the Campylobacter Retail Meat Surveillance section.
Serotyping and phage typing methods
Salmonella
Surveillance of Human Clinical Isolates
In general, clinical laboratories forwarded their Salmonella isolates to their Provincial Public Health Laboratory (PPHL) for identification and serotyping. The PPHL further forwarded Salmonella isolates to the National Microbiology Laboratory (NML)@Winnipeg according to the predefined testing protocol. Isolate identities were confirmed by the NML@Winnipeg when isolates received did not have a serovar nameFootnote 50 or when inconclusive results arose during phage typing. The O or somatic antigens of the Salmonella isolates were serotyped by use of a slide agglutination methodFootnote 51. At the NML@Winnipeg, Salmonella H or flagellar antigens were detected via slide and confirmatory tube agglutination methods. Salmonella isolates were maintained at room temperature between 25° and 35°C until typed.
Phage typing was performed at the NML@Winnipeg for isolates of the following Salmonella serovars: Enteritidis, Heidelberg, Typhimurium, Hadar, Newport, Typhi, Paratyphi BFootnote 52, Paratyphi B var. L(+) tartrate (+), Infantis, Thompson, Oranienburg, Panama, 4,[5],12:b:-, and 4,[5],12:i:-. For phage typing the standard technique described by Anderson and WilliamsFootnote 53 was followed. Isolates were streaked onto nutrient agar plates and incubated at 37°C for 18 hours. Three to 5 smooth colonies were selected and used to inoculate 4.5 mL of phage brothFootnote 54, which was then incubated for 1.5 to 2 hours in a shaking water bath at 37°C to attain bacterial growth with a turbidity equivalent to 1 McFarland standard. Phage agar platesFootnote 55 were flooded with approximately 2 mL of culture medium, and the excess liquid was removed with a Pasteur pipette. Flooded plates were allowed to dry for 15 minutes at room temperature. Afterward, approximately 10 mL of each serovar-specific typing phage was used to inoculate the bacterial lawn by means of a multiple inoculating syringe methodFootnote 56. The plates were incubated at 37°C overnight, and lytic patterns were subsequently interpretedFootnote 57.
Salmonella Enteritidis strains were phage typed with typing phages obtained from the International Centre for Enteric Phage Typing (ICEPT), Central Public Health Laboratory, Colindale, United KingdomFootnote 58. The phage-typing protocol and phages for S. Typhimurium, developed by CallowFootnote 59 and further extended by AndersonFootnote 60 and Anderson and colleaguesFootnote 61 were obtained from the ICEPT. The S. Heidelberg phage typing protocol and phages were supplied by the NML@WinnipegFootnote 62. Isolates that reacted with the phages but did not conform to any recognized phage type were designated as atypical. Strains that did not react with any of the typing phages were designated as "untypable".
The Identification and Serotyping unit and the Phage Typing unit at the NML@Winnipeg have attained International Standards Organization (ISO) 17025 accreditation by the Standards Council of Canada. These identification and Serotyping, Phage Typing, and Antimicrobial Resistance units participate in the annual Global Food-borne Infections Network (WHO-GFN), External Quality Assurance System of the World Health Organization, the Enter-net (a European network for the surveillance of human gastrointestinal infections) proficiency program for Salmonella, and a strain exchange with the NML@Guelph and NML@Saint-Hyacinthe (Salmonella and Escherichia coli). The NML@Winnipeg and the Centre for Foodborne, Environmental and Zoonotic Infectious Diseases have been strategic planning members of the WHO-GFN program since 2002.
Surveillance of agri-food, animal clinical and feed isolates
Animal clinical Salmonella isolates from Québec were serotyped at the Laboratoire d'épidémiosurveillance animale du Québec, du ministère de l'Agriculture, des Pêcheries et de l'Alimentation du Québec and were sent to the OIE Salmonella Reference Laboratory (SRL) NML@GuelphFootnote 63 (previously known as Laboratory for Foodborne Zoonoses). Serotyping was re-tested in Guelph by the OIE Salmonella Reference Laboratory (SRL) on only problematic isolates. Phage typing was also conducted by the SRL on Salmonella isolates of serovars Enteritidis, Heidelberg, and Typhimurium sent prior to September, 2017. All isolates submitted after September 28th, 2017 were not phagetyped. All other Salmonella isolates tested as part of CIPARS, including clinical isolates from other provinces, were submitted to the SRL for serotyping.
Serotyping of CIPARS isolates was carried out using either the traditional phenotypic serotyping method or a DNA microarray-based alternative method called the Salmonella GenoSerotyping Array (SGSA)Footnote 64. In addition, shared 2017 FoodNet Canada/CIPARS samples were sequenced using the MiSeq platform from Illumina®; predictive serotype was determined using SISTR (Salmonella in silico Typing Resource). The phenotypic serotyping method detects O or somatic antigens of the Salmonella isolates via slide agglutinationFootnote 65. The H or flagellar antigens were identified with a microtitre plate well precipitation methodFootnote 66. The antigenic formulae and serovars of the Salmonella isolates were identified and designated as per White-Kauffmann-Le Minor (WKL) schemeFootnote 67. The SGSA detects the genes encoding surface O and H antigens and reports the corresponding Salmonella serovar in accordance with the existing WKL serotyping scheme.
For phage typing, the standard technique by Anderson and WilliamsFootnote 68 and described above was followed. Prior to September 2017, phage typing was performed on isolates of Salmonella serovars Enteritidis, Typhimurium, and Heidelberg; the sources of the typing phages for these 3 serovars were the same as described above for Surveillance of Human Clinical Isolates.
With the exception of Whole Genome Sequencing and in silico serotype prediction by SISTR, the SRL is ISO 17025 accredited by the Standards Council of Canada. The SRL participates in the annual inter-laboratory exchange of serotyping panels with up to 2 other laboratories and External Quality Assurance System of the World Health Organization proficiency program.
Antimicrobial susceptibility testing methods
All Salmonella isolates of human origin were tested for antimicrobial susceptibility at the National Microbiology Laboratory (NML)@Winnipeg and all Salmonella isolates of agri-food or feed origin were tested for antimicrobial susceptibility at the NML@Guelph. The majority of Campylobacter and Escherichia coli isolates from all agri-food components were tested at the NML@Saint-Hyacinthe. One isolate per positive sample was submitted for antimicrobial susceptibility testing.
All three sites are ISO/IEC 17025-accredited for antimicrobial susceptibility testing. The NML@Winnipeg is a World Health Organization Collaboration Centre for Preparedness and Response to Enteric Pathogens and their Antimicrobial Resistance. The NML@Guelph laboratory participates in external proficiency programs for antimicrobial susceptibility testing for Salmonella. The NML@Saint-Hyacinthe laboratory participates in inter-agency proficiency programs for identification and antimicrobial susceptibility testing of Salmonella, E. coli, and Campylobacter with the National Antimicrobial Resistance Monitoring System, United States (NARMS).
Salmonella and Escherichia coli
The minimum inhibitory concentration (MIC) values for Salmonella and E. coli were determined by use of the Sensititre Complete Automated broth microdilution methodFootnote 69,Footnote 70. This automated incubation and reading system uses microtitre plates containing various concentrations of dehydrated antimicrobials. The CMV4AGNF plateFootnote 71 was designed by the NARMS and contains 14 antimicrobials (see Table 7, Antimicrobial Susceptibility Breakpoints' section).
Isolates were streaked onto a Mueller Hinton plate and incubated at 35 ± 1°C for 18 to 20 hours to obtain isolated colonies. One colony was chosen from the plate and re-streaked onto Mueller Hinton agar plates (NML@Guelph uses MacConkey agar for E. coli) for growth. The plates were incubated at 35 ± 1°C for 18 to 20 hours. A 0.5-McFarland suspension was prepared by transferring bacterial growth from the agar plates into 5.0 mL of sterile, demineralized water. Ten microliters of the water-bacteria suspension were transferred to 11 mL of Mueller Hinton broth (MHB). This suspension was dispensed onto CMV4AGNF testing plates at 50 µL per well and the plates were sealed with adhesive plastic sheets. After 18-hours of incubation at 35 ± 1°C the plates were read automatically with the fluorometric plate reading systemFootnote 72. In accordance with standards set by the Clinical and Laboratory Standards Institute (CLSI)Footnote 73, the quality control strains Staphylococcus aureus ATCC 29213, Escherichia coli ATCC 25922, Pseudomonas aeruginosa ATCC 27853, and Enterococcus faecalis ATCC 29212 were used to ensure validity of the MIC values.
Campylobacter
The MIC values for Campylobacter were determined by means of the broth microdilution methodFootnote 74. The CAMPY plates designed by NARMS and containing 9 dehydrated antimicrobials were used (see Table 8, Antimicrobial Susceptibility Breakpoints section). Colonies were streaked onto Mueller Hinton agar plates with 5% sheep blood and incubated in a microaerophilic atmosphere at 42 ± 1°C for 24 hours. A 0.5-McFarland suspension of bacterial growth was prepared by transferring selected bacterial colonies into a tube containing 5 mL of MHB. Afterward, 100 µL of the MHB were transferred to 11 mL of MHB with laked horse blood. The mixture was dispensed onto CAMPY plates at 100 µL per well. The plates were sealed with perforated adhesive plastic sheets. After a 24-hour incubation in microaerophilic atmosphere at 42 ± 1°C, plates were read using the Sensititre Vizion SystemFootnote 75. Campylobacter jejuni ATCC 33560 was used as quality control organism. The MIC values obtained were interpreted according to CLSI standardsFootnote 76.
Antimicrobial susceptibility breakpoints
| no data | Antimicrobial | Range tested (μg/mL) | BreakpointsTable 7 footnote a (μg/mL) | ||
|---|---|---|---|---|---|
| S | I | R | |||
| I | Amoxicillin-clavulanic acid | 1.0/0.5-32/16 | ≤ 8/4 | 16/8 | ≥ 32/16 |
| Ceftriaxone | 0.25-64 | ≤ 1 | 2 | ≥ 4 | |
| Ciprofloxacin | 0.015-4 | ≤ 0.06 | 0.12-0.5 | ≥ 1 | |
| Meropenem | 0.06-4 | ≤ 1 | 2 | ≥ 4 | |
| II | Ampicillin | 1-32 | ≤ 8 | 16 | ≥ 32 |
| AzithromycinTable 1 footnote b | 0.25-32 | ≤ 16 | N/A | ≥ 32 | |
| Cefoxitin | 0.5-32 | ≤ 8 | 16 | ≥ 32 | |
| Gentamicin | 0.25-16 | ≤ 4 | 8 | ≥ 16 | |
| Nalidixic acid | 0.5-32 | ≤ 16 | N/A | ≥ 32 | |
| StreptomycinTable 1 footnote b | 2-64 | ≤ 16 | N/A | ≥ 32 | |
| Trimethoprim-sulfamethoxazole | 0.12/2.38-4/76 | ≤ 2/38 | N/A | ≥ 4/76 | |
| III | Chloramphenicol | 2-32 | ≤ 8 | 16 | ≥ 32 |
| Sulfisoxazole | 16-256 | ≤ 256 | N/A | ≥ 512 | |
| Tetracycline | 4-32 | ≤ 4 | 8 | ≥ 16 | |
| IV | no data | no data | no data | no data | no data |
Roman numerals I to IV indicate the ranking of antimicrobials based on importance in human medicine as outlined by the Veterinary Drugs Directorate. S = susceptible. I = intermediate susceptibility. R = resistant. N/A = not applicable. |
|||||
| no data | Antimicrobial | Range tested (μg/mL) | BreakpointsTable 8 footnote a (μg/mL) | ||
|---|---|---|---|---|---|
| S | I | R | |||
| I | Ciprofloxacin | 0.015-64 | ≤ 1 | 2 | ≥ 4 |
| TelithromycinTable 8 footnote b | 0.015-8 | ≤ 4 | 8 | ≥ 16 | |
| II | AzithromycinTable 8 footnote b | 0.015-64 | ≤ 2 | 4 | ≥ 8 |
| ClindamycinTable 8 footnote b | 0.03-16 | ≤ 2 | 4 | ≥ 8 | |
| Erythromycin | 0.03-64 | ≤ 8 | 16 | ≥ 32 | |
| GentamicinTable 8 footnote b | 0.12-32 | ≤ 2 | 4 | ≥ 8 | |
| Nalidixic acidTable 8 footnote b | 4-64 | ≤ 16 | 32 | ≥ 64 | |
| III | FlorfenicolTable 8 footnote b,Table 8 footnote c | 0.03-64 | ≤ 4 | N/A | N/A |
| Tetracycline | 0.06-64 | ≤ 4 | 8 | ≥ 16 | |
| IV | no data | no data | no data | no data | no data |
Roman numerals I to IV indicate the ranking of antimicrobials based on importance in human medicine as outlined by the Veterinary Drugs Directorate. S = susceptible. I = intermediate susceptibility. R = resistant. N/A = not applicable. |
|||||
Data analysis
Human and agri-food surveillance
Data management
Laboratory data from human and agri-food surveillance components originated in 2 computer programs (NML@Winnipeg Labware and NML@Guelph and NML@Saint-Hyacinthe Labware) and were subsequently transferred to a central data repository using intermediary computer softwareFootnote 77. Data were then transferred to a SAS®-based harmonized databaseFootnote 78 called the Data Extraction and Analysis (DEXA) application. Additional antimicrobial resistance variables used for analysis were derived within the DEXA application; this application was also used as a central data access point.
Recovery rate
For Retail Meat Surveillance, Abattoir Surveillance, and the Farm Surveillance components, recovery rate was defined as the number of positive bacterial culture results divided by the total number of samples submitted for culture.
Resistant isolates
The percentage of isolates with resistance to one or more antimicrobials was defined as the number of isolates resistant to at least one antimicrobial divided by the total number of isolates tested for each antimicrobial, multiplied by 100.
The breakpoints used for interpretation of antimicrobial susceptibility results are listed in Table 7 and Table 8 (see the previous section). Intermediate Minimum Inhibitory Concentration (MIC) values were categorized as susceptible for all analyses. A new ceftriaxone breakpoint was officially adopted by the CLSI in January 2010 and was applied to all CIPARS data, including historical data. A new Enterobacteriaceae plate, CMV4AGNF, was utilized beginning in January 2016. Notable changes to the new plate included:
- The removal of ceftiofur (Category I)
- The addition of meropenem (Category I)
- The adjustment of the azithromycin MIC susceptibility testing range (0.25 to 32 μg/mL)
- The changing of the streptomycin breakpoint to greater than or equal to 32 μg/mL.
Resistance patterns
The total number of antimicrobials in each resistance pattern was calculated by summing the number of antimicrobials to which each isolate was resistant. The most common resistance pattern may include patterns with only 1 antimicrobial. In this case, like for the most common patterns including 2 or more antimicrobials, the number of isolates reported includes only those resistant to this specific pattern (i.e., without any additional resistance to other antimicrobials).
Statistical analysis
Data were analyzed with various statistical softwareFootnote 79, and outputs were exported into a spreadsheet applicationFootnote 80. All tables and figures were generated with the spreadsheet application.
For Farm Surveillance, statistical analyses were performed to account for clustering of antimicrobial resistance within feedlot cattle herds, swine herds, chicken flocks or turkey flocks through generalized estimating equations (GEE)Footnote 81. All statistical models included a binary outcome, logit-link function, and exchangeable correlation structure. Null binomial response models were used to estimate the prevalence of resistance to each antimicrobial. From each null model, the intercept (β0) and 95% confidence intervals were used to calculate population-averaged prevalence estimates with the formula [1 + exp(-β0)]-1. When the prevalence was 0%, a model was run with a single positive isolate to determine the upper confidence interval only.
Temporal analysis
Temporal analyses were performed for selected antimicrobials. Only 1 antimicrobial per antimicrobial class was selected among those antimicrobials commonly used in the agri-food and/or human sectors. Some antimicrobials were excluded from the temporal analyses for the following reasons:
- Resistance to the antimicrobial was absent or at a very low prevalence, or the breakpoint was debatable and other antimicrobials could be used to provide a surrogate measure of resistance or intermediate susceptibility (e.g., nalidixic acid for ciprofloxacin).
- The isolate was cross-resistant to another selected antimicrobial (e.g., amoxicillin-clavulanic acid and ceftiofur).
- The antimicrobial has been banned for use in the agri-food sector, and resistance to this drug is maintained because of the use of another/other antimicrobial(s) (e.g., chloramphenicol).
Logistic regression models (asymptotic or exact depending on prevalence of the outcome variable) were developed with year as an independent categorical variable. Data were analyzed with commercial softwareFootnote 82. Farm Surveillance data were adjusted for clustering at the herd level for grower-finisher pigs and flock level for broiler chickens. Components with regional or provincial temporal analysis had the current proportion of isolates resistant to a specific antimicrobial compared to those proportions observed in the previous surveillance year and 5 years previously. For broiler chickens, the 2017 data was compared to 2016 and 2013 data. For components with national temporal analysis, the current proportion of isolates resistant to a specific antimicrobial were compared to those proportions observed in the previous surveillance year, 5 years previously (for comparison between components), and 10 years previously (or the first year of surveillance). In a few specific instances, the first comparison year may vary to reflect the implementation of new CIPARS components (e.g., 2006 for the Farm Surveillance component in grower-finisher pigs and addition of the broiler chicken Farm Surveillance component in 2013). For ampicillin and ceftriaxone (previously ceftiofur), special temporal analyses have been conducted for E. coli and Salmonella isolated from retail chicken or abattoir chickens to compare the current year's data with that of 2004 and 2006. This was due to a change in ceftiofur use practices by Québec chicken hatcheries in early 2005 and in 2007 (start and end of the voluntary period of withdrawal respectively). These special analyses were also conducted for human Salmonella Heidelberg isolates because this human serovar was suspected to originate from chicken. A P-value less than or equal to 0.05 was considered significant for all temporal analyses.
Antimicrobial classification
Categorization of antimicrobials based on importance in human importance
Categories of antimicrobials used in this report were taken from the document Categorization of Antimicrobial Drugs Based on Importance in Human MedicineFootnote 83 by Health Canada's Veterinary Drugs Directorate (Table 9). Antimicrobials are considered to be of Very High Importance in Human Medicine (Category I) when they are essential for the treatment of serious bacterial infections and there is no or limited availability of alternative antimicrobials for effective treatment. These antimicrobials include amoxicillin-clavulanic acid, ceftriaxone (ceftiofurFootnote 84), ciprofloxacin, and telithromycin. Antimicrobials of High Importance in Human Medicine (Category II) consist of those that can be used to treat a variety of infections, including serious infections, and for which alternatives are generally available. Bacteria resistant to antimicrobials of this category are generally susceptible to Category I antimicrobials, which could be used as alternatives. Antimicrobials of Medium Importance in Human Medicine (Category III) are used in the treatment of bacterial infections for which alternatives are generally available. Infections caused by bacteria resistant to these antimicrobials can, in general, be treated with Category II or I antimicrobials. Antimicrobials of Low Importance in Human Medicine (Category IV) are currently not used in human medicine.
| no data | Category of importance in human medicine | Antimicrobial class |
|---|---|---|
| I | Very high importance | Carbapenems |
| Cephalosporins - the third and fourth-generations | ||
| Fluoroquinolones | ||
| Glycopeptides | ||
| Glycylcyclines | ||
| Ketolides | ||
| Lipopeptides | ||
| Monobactams | ||
| Nitroimidazoles (metronidazole) | ||
| Oxazolidinones | ||
| Penicillin-β-lactamase inhibitor combinations | ||
| Polymyxins (colistin) | ||
| Therapeutic agents for tuberculosis (e.g. ethambutol, isoniazid, pyrazinamide, and rifampin) | ||
| II | High importance | Aminoglycosides (except topical agents) |
| Cephalosporins - the first and second-generations (including cephamycins) | ||
| Fusidic acid | ||
| Lincosamides | ||
| Macrolides | ||
| Penicillins | ||
| Quinolones (except fluoroquinolones) | ||
| Streptogramins | ||
| Trimethoprim-sulfamethoxazole | ||
| III | Medium importance | Aminocyclitols |
| Aminoglycosides (topical agents) | ||
| Bacitracins | ||
| Fosfomycin | ||
| Nitrofurans | ||
| Phenicols | ||
| Sulfonamides | ||
| Tetracyclines | ||
| Trimethoprim | ||
| IV | Low importance | Flavophospholipols |
| Ionophores | ||
Roman numerals I to IV indicate categories of importance to human medicine as outlined by the Veterinary Drugs Directorate. |
||
List of antimicrobials from the farm broiler chicken and turkey questionnaire
| no data | ATCvet class | Antimicrobial |
|---|---|---|
| Antimicrobials administered via feed | ||
| II | Aminoglycosides, other (QJ01GB) | Neomycin (QJ01GB05) |
| Apramycin (QJ01GB90) | ||
| Lincosamides (QJ01FF) | Lincomycin (AJ01FF02) | |
| Lincosamides-aminocyclitol combinations (QJ01RA94) | Lincomycin-spectinomycin (No ATCvet code) | |
| Macrolides (QJ01FA) | Erythromycin (QJ01FA01) | |
| Tylosin (QJ01FA90) | ||
| Penicillins (QJ01RA) | Penicillin (QJ01RA01) | |
| Procaine benzylpenicillin (QJ01CE09) | ||
| Streptogramins (QJ01FG) | Virginiamycin (QJ01FG90) | |
| III | Bacitracins (QA07AA) | Bacitracin (QA07AA93) |
| Sulfonamides, plain and in combination, intestinal (QP51AG) | Sulfamethazine (No ATCvet code) | |
| Trimethoprim-sulfadiazine (No ATCvet code) | ||
| Tetracyclines (QJ01AA) | Chlortetracycline (QJ01AA03) | |
| Oxytetracycline (QJ01AA06) | ||
| Tetracycline (QJ01AA07) | ||
| IV | Flavophospholipids | Bambermycin (No ATCvet code) |
| Ionophores, agents against protozoal diseases (QP51A) | Lasalocid (QP51AH02) | |
| Maduramicin (QP51AX10) | ||
| Monensin (QP51AH03) | ||
| Narasin (QP51AH04) | ||
| Narasin-nicarbazin combination (QP51AH54) | ||
| Salinomycin (QP51AH01) | ||
| N/A | Arsenicals, agents against protozoal diseases (QP51AD) | 4-Nitrophenylarsonic acid (No ATCvet code) |
| Chemical coccidiostats, other protozoal (QP51AX) | Amprolium (QP51AX09) | |
| Clopidol (No ATCvet code) | ||
| Decoquinate (QP51AX14) | ||
| Diclazuril (QP51AJ03) | ||
| Nicarbazin (QP51AE03) | ||
| Robenidine (QP51AX13) | ||
| Zoalene/dinitolmide (QP51AX12) | ||
| Orthosomycin | Avilamycine (No ATCvet code) | |
| Antimicrobials administered via drinking water | ||
| I | Fluoroquinolones | Enrofloxacin (QJ01MA90) |
| II | Aminoglycosides, other (QJ01GB) | Neomycin (QJ01GB05) |
| Apramycin (QJ01GB90) | ||
| Lincosamides, combination with other antimicrobials | Lincomycin-spectinomycin (QJ01RA94) | |
| Macrolides (QJ01FA) | Erythromycin (QJ01FA01) | |
| Tylosin (QJ01FA90) | ||
| Penicillins, with extended spectrum (QJ01CA) | Amoxicillin (QJ01CA04) | |
| Penicillins (QJ01RA) | Penicillin (QJ01RA90) | |
| Penicillins, combination with other antibacterials (QJ01RA) | Penicillin-streptomycin (QJ01RA01) | |
| III | Amphenicols (QJ01BA) | Florfenicol (QJ01BA90) |
| Sulfonamides, plain and in combination, intestinal (QP51AG) | Sulfamethazine (No ATCvet code) | |
| Sulfaquinoxaline (QP51AG03) | ||
| Sulfaquinoxaline-pyrimethamine (No ATCvet code) | ||
| Tetracyclines (QJ01AA) | Chlortetracycline (QJ01AA03) | |
| Oxytetracycline (QJ01AA06) | ||
| Tetracycline (QJ01AA07) | ||
| Tetracyclines and combinations (QJ01RA90) | Oxytetracycline-neomycin (No ATCvet code) | |
| Tetracycline-neomycin (No ATCvet code) | ||
| Antimicrobials administered via subcutaneous or in ovo injections | ||
| I | Third-generation cephalosporins (QJ01DD) | Ceftiofur (QJ01DD90) |
| II | Aminoglycosides, other (QJ01GB) | Gentamicin (QJ01GB03) |
| Lincosamides-aminocyclitol combinations (QJ01RA94) | Lincomycin-spectinomycin (No ATCvet code) | |
ATC = Anatomical Therapeutic Chemical. Roman numerals I to IV indicate categories of importance to human medicine as outlined by the Veterinary Drugs Directorate. N/A = not applicable (no classification available at the time of writing of this report). The ATCvet system for classification of veterinary medicines is based on the same overall principles as the ATC system for substances used in human medicine. This system is a tool for exchanging and comparing data on drug use in veterinary medicine at international, national or local levelsFootnote 85. |
||
List of antimicrobials from the farm swine questionnaire
| no data | ATCvet class | Antimicrobial |
|---|---|---|
| I | Third-generation cephalosporins (QJ01DD) | Ceftiofur (QJ01DD90) |
| Fluoroquinolones | Enrofloxacin (QJ01MA90) | |
| II | Amphenicols (QJ01BA) | Florfenicol (QJ01BA90) |
| Penicillins with extended spectrum (QJ01CA) | Ampicillin (QJ01CA01) | |
| Amoxicillin (QJ01CA04) | ||
| β-Lactamase sensitive penicillins (QJ01CE) | Penicillin (QJ01CE01) | |
| Combination of sulfadoxine and trimethoprim (QJ01EW) | Trimethoprim-sulfadoxine (QJ01EW13) | |
| Macrolides (QJ01FA) | Erythromycin (QJ01FA01) | |
| Tylosin (QJ01FA90) | ||
| Tilmicosin (QJ01FA91) | ||
| Tulathromycin (QJ01FA94) | ||
| Lincosamides (QJ01FF) | Lincomycin (QJ01FF02) | |
| Streptogramins (QJ01FG) | Virginiamycin (QJ01FG90) | |
| Other aminoglycosides (QJ01GB) | Neomycin (QJ01GB05) | |
| Combinations of antibacterials (QJ01RA) | Penicillin-streptomycin (QJ01RA01) | |
| Chlortetracycline-sulfamethazine-penicillin (QJ01RA90) | ||
| Oxytetracycline-neomycin (QJ01RA90) | ||
| Tetracycline-neomycin (QJ01RA90) | ||
| Lincomycin-spectinomycin (QJ01RA94) | ||
| Other antibacterials (QJ01XX) | Spectinomycin (QJ01XX04) | |
| III | Tetracyclines (QJ01AA) | Chlortetracycline (QJ01AA03) |
| Oxytetracycline (QJ01AA06) | ||
| Tetracycline (QJ01AA07) | ||
| Chlortetracycline, combinations (QJ01AA53) | ||
| Sulfonamides (QJ01EQ) | Combinations of sulfonamides (QJ01EQ30) | |
| Pleuromutilins (QJ01XQ) | Tiamulin (QJ01XQ01) | |
| Other antibacterials (QJ01XX) | Bacitracin (QJO1XX10) | |
| IV | No ATCvet code | Bambermycin (No ATCvet code) |
| Pyranes and hydropyranes (QP51AH) | Salinomycin (QP51AH01) | |
ATC = Anatomical Therapeutic Chemical. Roman numerals I to IV indicate categories of importance to human medicine as outlined by the Veterinary Drugs Directorate. The ATCvet system for classification of veterinary medicines is based on the same overall principles as the ATC system for substances used in human medicine. This system is a tool for exchanging and comparing data on drug use in veterinary medicine at international, national or local levelsFootnote 87. |
||
Appendix
Abbreviations
Canadian provinces, territories, and regions
Provinces
- BC
- British Columbia
- AB
- Alberta
- SK
- Saskatchewan
- MB
- Manitoba
- ON
- Ontario
- QC
- Québec
- NB
- New Brunswick
- NS
- Nova Scotia
- PE
- Prince Edward Island
- NL
- Newfoundland and Labrador
Territories
- YT
- Yukon
- NT
- Northwest Territories
- NU
- Nunavut
RegionsFootnote 88
Prairies: AB, SK, MB
Maritimes: NB, NS, PE
Atlantic: NB, NS, PE, NL
Antimicrobials
- AMC
- Amoxicillin-clavulanic acid
- AMP
- Ampicillin
- AZM
- Azithromycin
- CHL
- Chloramphenicol
- CIP
- Ciprofloxacin
- CLI
- Clindamycin
- CRO
- Ceftriaxone
- ERY
- Erythromycin
- FLR
- Florfenicol
- FOX
- Cefoxitin
- GEN
- Gentamicin
- MEM
- Meropenem
- NAL
- Nalidixic acid
- SSS
- Sulfisoxazole
- STR
- Streptomycin
- SXT
- Trimethoprim-sulfamethoxazole
- TEL
- Telithromycin
- TET
- Tetracycline
- TIO
- Ceftiofur
Important resistance patterns
- A2C-AMP
- Amoxicillin-clavulanic acid, cefoxitin, ceftiofur, and ampicillin
- ACSSuT
- Ampicillin, chloramphenicol, streptomycin, sulfisoxazole, and tetracycline
Other abbreviations
- APP
- Actinobacillus pleuropneumoniae
- APEC
- Avian pathogenic Escherichia coli
- FNC
- FoodNet Canada
- IBV
- Infectious Bronchitis Virus
- PCVAD
- Porcine Circovirus Associated Disease
- PDAR
- Pig-days at risk
- PED
- Porcine Epidemic Diarrhea
- PRRS
- Porcine Reproductive and Respiratory Syndrome
- TGE
- Transmissible gastroenteritis
- VDD
- Veterinary Drugs Directorate, Health Canada
Supplemental data
| Route of administration | European route of administration | Antimicrobial | Average dose basis | Average dose | DDDvetCA (mgdrug/kganimal/day) |
|---|---|---|---|---|---|
| Feed | Oral | Avilamycin | TP | 22.5 | 2.9 |
| Bacitracin | TP | 77.9 | 10.1 | ||
| Chlortetracycline | TP | 128.3 | 16.7 | ||
| Erythromycin | TP | 220.0 | 28.6 | ||
| Oxytetracycline | TP | 128.3 | 16.7 | ||
| Procaine penicillin G | TP | 41.3 | 5.4 | ||
| Sulfadiazine-trimethoprimTable A-1 footnote a (ELDU) | TP | 83.3 | 10.8 | ||
| Trimethoprim-sulfadiazineTable A-1 footnote a (ELDU) | TP | 16.8 | 2.2 | ||
| Tylosin | TP | 200.0 | 26.0 | ||
| Virginiamycin | TP | 22.0 | 2.9 | ||
| Injectable | Parenteral | Ceftiofur (ELDU) | TP | 2.6 | 2.6 |
| Gentamicin | TP | 10.8 | 10.8 | ||
| Lincomycin-spectinomycinTable A-1 footnote a (ELDU) | TP | 6.0 | 6.0 | ||
| Spectinomycin-lincomycinTable A-1 footnote a (ELDU) | TP | 12.0 | 12.0 | ||
| Water | Oral | Amoxicillin | TP | 52.0 | 12.0 |
| Apramycin (ELDU) | TP | 100.0 | 23.0 | ||
| Enrofloxacin (ELDU) | TP | 25.0 | 5.8 | ||
| Erythromycin | TP | 86.7 | 19.9 | ||
| Lincomycin | TP | 16.0 | 3.7 | ||
| Lincomycin-spectinomycinTable A-1 footnote a | TP | 277.5 | 63.8 | ||
| Neomycin | TP | 94.8 | 21.8 | ||
| Oxytetracycline | TP | 81.9 | 18.8 | ||
| Penicillin G | TP | 178.3 | 41.0 | ||
| Penicillin G (supp) | TP | 16.5 | 3.8 | ||
| Spectinomycin-lincomycinTable A-1 footnote a | TP | 555.0 | 127.7 | ||
| Streptomycin (supp) | TP | 85.2 | 19.6 | ||
| Sulfamethazine | TP | 1027.8 | 236.4 | ||
| Sulfaquinoxaline | TP | 317.2 | 72.9 | ||
| Tetracycline | TP | 93.1 | 21.4 | ||
| Tylosin | TP | 312.5 | 71.9 | ||
| Sulfaquinoxaline-pyrimethamineTable A-1 footnote a | TP | 48.8 | 11.2 | ||
Extra-label drug use (ELDU) poultry, dose, or doses were derived from expert opinion or veterinary consultationsFootnote 89. TP = treatment and prevention. GP = growth promotion. Supp = supplement or product has lower level of drug. Average dose = average of all doses indicated in available products listed in the Compendium of Medicating Ingredients BrochureFootnote 90 and Compendium of Veterinary ProductsFootnote 91; values were multiplied to the standard values for either feed or water intake (see Table A-3) to obtain the DDDvetCA standard for poultry. DDDvetCA = Canadian Defined Daily Doses for animals (average labelled dose) in milligrams per kilogram broiler chicken or turkey per day (mgdrug/kganimal/day). DDDvetCA standards for products with much lower dosing than preventive and treatment uses such as ionophores, chemical coccidiostats and products intended mainly for growth promotion (flavophospolipids and penicillin G via feed) were developed and are available in the previous year's report or can be obtained upon request. The total number of DDDvetCA for these products are not included in this report. |
|||||
| Route of administration | Antimicrobial | Average dose basis | Average dose | DDDvetCA (mgdrug/kganimal/day) |
|---|---|---|---|---|
| Feed | Avilamycin | TP | 80.0 | 3.2 |
| Bacitracin | TP | 113.4 | 4.5 | |
| Bambermycin | GP | 3.0 | 0.1 | |
| Chlortetracycline | TP | 260.3 | 10.4 | |
| Lincomycin | TP | 124.7 | 5.0 | |
| Lincomycin-spectinomycinTable A-2 footnote a | TP | 22.0 | 0.9 | |
| Narasin | GP | 15.0 | 0.6 | |
| Oxytetracycline | TP | 189.4 | 7.6 | |
| Penicillin G | TP | 32.1 | 1.3 | |
| Salinomycin | GP | 25.0 | 1.0 | |
| Spectinomycin-lincomycinTable A-2 footnote a | TP | 22.0 | 0.9 | |
| Sulfamethazine | TP | 110.0 | 4.4 | |
| Tiamulin | TP | 116.0 | 4.6 | |
| Tilmicosin | TP | 300.0 | 12.0 | |
| Tylosin | TP | 77.0 | 3.1 | |
| Tylvalosin | TP | 42.5 | 1.7 | |
| Virginiamycin | TP | 82.5 | 3.3 | |
| Injectable | Ampicillin | TP | 6.0 | 6.0 |
| Benzathine Penicillin G-combinationTable A-2 footnote a | TP | 1.2 | 1.2 | |
| Ceftiofur | TP | 3.0 | 3.0 | |
| Ceftiofur-long acting | TP | 1.0 | 1.0 | |
| Enrofloxacin | TP | 7.5 | 7.5 | |
| Florfenicol | TP | 7.5 | 7.5 | |
| Gentamicin | TP | 1.3 | 1.3 | |
| Lincomycin | TP | 10.0 | 10.0 | |
| Oxytetracycline | TP | 5.9 | 5.9 | |
| Procaine penicillin G | TP | 13.5 | 13.5 | |
| Procaine penicillin G-long acting | TP | 6.7 | 6.7 | |
| Procaine penicillin G-combinationTable A-2 footnote a | TP | 1.5 | 1.5 | |
| Sulfadoxine-trimethoprimTable A-2 footnote a | TP | 13.3 | 13.3 | |
| Tiamulin | TP | 11.0 | 11.0 | |
| Trimethoprim-sulfadoxineTable A-2 footnote a | TP | 2.4 | 2.4 | |
| Tulathromycin | TP | 0.3 | 0.3 | |
| Tylosin | TP | 5.5 | 5.5 | |
| Water | Amoxicillin | TP | 200.0 | 20.0 |
| Apramycin | TP | 100.0 | 10.0 | |
| Lincomycin | TP | 33.3 | 3.3 | |
| Lincomycin-spectinomycinTable A-2 footnote a | TP | 22.2 | 2.2 | |
| Neomycin | TP | 115.9 | 11.6 | |
| Oxytetracycline | TP | 146.4 | 14.6 | |
| Penicillin G | TP | 178.0 | 17.8 | |
| Spectinomycin-lincomycinTable A-2 footnote a | TP | 44.4 | 4.4 | |
| Sulfamerazine (supp) | TP | 32.9 | 3.3 | |
| Sulfamethazine | TP | 789.7 | 79.0 | |
| Sulfamethazine (supp) | TP | 62.8 | 6.3 | |
| Sulfapyridine | TP | 333.3 | 33.3 | |
| Sulfathiazole | TP | 462.1 | 46.2 | |
| Sulfathiazole (supp) | TP | 103.0 | 10.3 | |
| Tetracycline | TP | 85.9 | 8.6 | |
| Tiamulin | TP | 49.0 | 4.9 | |
| Tylosin | TP | 166.5 | 16.7 | |
| Tylvalosin | TP | 50.0 | 5.0 | |
| Bolus | Neomycin (supp) | TP | 7.5 | 7.5 |
| Neomycin | TP | 19.7 | 19.7 | |
| Oxytetracycline | TP | 29.3 | 29.3 | |
| Spectinomycin | TP | 18.8 | 18.8 | |
| Succinylsulfathiazole (supp) | TP | 36.0 | 36.0 | |
| Sulfaguanidine | TP | 83.8 | 83.8 | |
| Sulfamethazine | TP | 118.1 | 118.1 | |
| Sulfanilamide | TP | 73.1 | 73.1 | |
| Sulfathiazole | TP | 57.4 | 57.4 | |
| Tetracycline | TP | 15.3 | 15.3 | |
| Toltrazuril | TP | 20.0 | 20.0 | |
TP = treatment and prevention. GP = growth promotion. Supp = supplement or product has lower level of drug. Average dose = average of all doses indicated in available products listed in the Compendium of Medicating Ingredients BrochureFootnote 92 and Compendium of Veterinary ProductsFootnote 93; values were multiplied to the standard values for either feed or water intake (in Table A-4) to obtain the Canadian DDDvetCA standard values for pigs. DDDvetCA = Canadian Defined Daily Doses for animals (average labelled dose) in milligrams per kilogram pig per day (mgdrug/kganimal/day). |
||||
| Standard values feed and water intake | Poultry |
|---|---|
| Canadian standard turkey poult weight (kg at hatch)Table A-3 footnote a | 0.06 |
| Canadian standard chick weight (kg at hatch)Table A-3 footnote a | 0.042 |
| Canadian standard broiler weight (kg)Table A-3 footnote a | 1.0 |
| Canadian standard feed to weight ratio | 0.13 |
| Canadian standard water to weight ratio | 0.23 |
| ESVAC feed to weight ratio (kg feed/kg animal)Table A-3 footnote b | 0.13 |
| ESVAC water to weight ratio (L water/kg animal)Table A-3 footnote b | 0.23 |
ESVAC = European Surveillance of Veterinary Antimicrobial Consumption. DDDA = Defined daily dose for animals. |
|
| Standard values feed and water intake | Swine |
|---|---|
| Canadian standard piglet weight (kg) | 4.00 |
| Canadian standard grower-finisher pig weight (kg) | 65.00 |
| Canadian standard water intake (for a 65 kg pig) (L)Table A-4 footnote a | 6.50 |
| Canadian standard feed intake (for a 65 kg pig) (kg) | 2.18 |
| Canadian standard feed to weight ratio | 0.04 |
| Canadian standard water to weight ratio | 0.10 |
| ESVAC Feed to weight ratio (kg feed/kg animal)b | 0.04 |
| ESVAC Water to weight ratio (L water/kg animal)b | 0.10 |
ESVAC = European Surveillance of Veterinary Antimicrobial Consumption. |
|
CIPARS AMR and AMU data flow summary
Figure A-1 Summary of the CIPARS samples and data flow, 2017
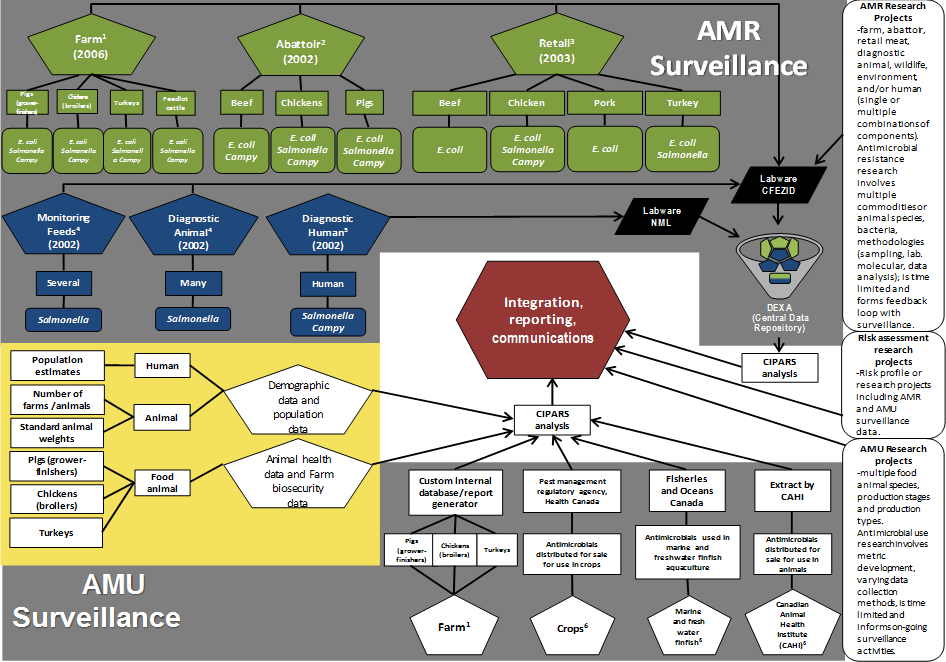
Green shape = Active surveillance; primary data, primarily for prevalence estimation. Blue shape = Passive surveillance; secondary data, primarily for AMR detection.
CFEZID = Centre for Food-borne, Environmental and Zoonotic Infectious Diseases. NML = National Microbiology Laboratory.
1-6 CIPARS project leads: 1 David Léger (david.leger@canada.ca), Sheryl Gow (sheryl.gow@canada.ca) and Agnes Agunos (agnes.agunos@canada.ca); 2 Anne Deckert (anne.deckert@canada.ca); 3,4,5 Brent Avery (brent.avery@canada.ca); 4,5 Colleen Murphy (colleen.murphy@canada.ca); 5 Amrita Bharat (amrita.bharat@canada.ca) and Michael Mulvey (michael.mulvey@canada.ca); 6 Carolee Carson (carolee.carson@canada.ca).
CIPARS Program Coordinators: Rebecca Irwin (rebecca.irwin@canada.ca), Richard Reid-Smith (richard.reid-smith@canada.ca), and Michael Mulvey (michael.mulvey@canada.ca).
Figure A-1 - Text Description
This diagram summarises all of the Canadian Integrated Program for Antimicrobial Resistance Surveillance (CIPARS) components and all the data sources that are pulled together for analysis and reporting purposes.
The top half (grey area) of the figure includes all of the antimicrobial resistance (AMR) components of CIPARS. The antimicrobial use (AMU) components of CIPARS are along the bottom of the figure (grey area). Additional data sources are shown (yellow area and areas on the right side of the diagram): demographic, population, animal health, farm biosecurity, research, and risk assessment data. All these data will be analysed, integrated, reported, and communicated (white area in the center of the figure).
AMR Section (top half/grey area)
Active surveillance components (green shapes)
The three AMR active surveillance components (farm, abattoir and retail) are depicted:
The farm component started in 2006 and includes samples collected from grower-finisher pigs, broiler chickens, turkeys, and beef cattle on farms. Escherichia coli, Salmonella, and Campy are isolated from chicken, turkey and beef samples.
The abattoir component was initiated in 2002 and includes samples collected from beef cattle, chickens, and pigs. Escherichia coli, Salmonella, and Campylobacter are isolated from beef and chicken samples and also, E. coli and Campylobacter are isolated from pig samples.
The retail component was started in 2003 and involves collection of beef, chicken, pork, and turkey retail meat samples. Escherichia coli are isolated from all meat types. Salmonella are isolated from chicken and turkey samples, and Campylobacter are isolated from chicken samples only.
Passive surveillance components (blue shapes)
In addition to the active AMR surveillance components, there are three passive surveillance components of CIPARS: monitoring feeds (for animals), diagnostic animal, and diagnostic human.
The monitoring feed component can cover several feed sample types and the diagnostic animal component can include many animal species. All passive AMR components include Salmonella isolates but Campylobacter is also isolated from human diagnostic isolates.
AMR Research
Additionally, AMR research projects can involve multiple commodities, animal species, bacteria, and methodologies (sampling, laboratory, molecular and, data analysis). These projects are time limited and complement the data captured through routine AMR surveillance.
AMR data analysis
Lastly, all the human AMR data are entered into the Labware-NML data management system (black box) at the National Microbiology Laboratory (NML) and all of the data from agri-food AMR surveillance components are entered into Labware-CFEZID (black box) at the Centre for Food-borne, Environmental and Zoonotic Infectious Diseases (CFEZID). Results from AMR research projects are also entered into Labware-CFEZID. All data are then put into DEXA, a central data repository, and accessed by CIPARS analysts.
AMU Section (bottom half/grey area)
The four AMU surveillance components (farm, crops, marine and freshwater finfish, and the Canadian Animal Health Institute) are depicted:
The Farm AMU data are collected from grower-finisher pigs, broiler chickens, and turkeys and are entered into a custom internal database and report generator. Both the crop data and marine and freshwater finfish aquaculture summarise the quantity of antimicrobials distributed for sale for use; these data are provided directly to CIPARS from the Pest Management Regulatory Agency of Health Canada and from Fisheries and Oceans Canada. The Canadian Animal Health Institute (CAHI) data summarise the quantity of antimicrobials distributed for sale for use in animals; these data are provided directly to CIPARS from CAHI.
The data from AMU surveillance components are complemented by AMU research projects. These projects involve multiple food animal species, production stages, and production types. Antimicrobial use research involves metric development, varying data collection methods, is time limited and informs on-going surveillance activities.
Other Information (yellow area)
Demographic/population data are required to interpret the AMU data that are collected. For humans, the demographic data accessed consists of population estimates; for animals, the population data consists of the number of farms and animals and standard animal weights. The animal health and biosecurity data collected at the farm are also important to interpret AMU data from food animal (pigs, chickens, and turkeys).
Integrating, Reporting and Communications (red shape)
All animal AMU data are pulled together by CIPARS analysts and the human AMU data are analysed by a different group of analysts. All of CIPARS analysis (AMR and AMU) as well as AMR and AMU research projects and risk assessment projects feed into data integration, reporting and other types of communication.
Footnotes
- Footnote 1
-
Executive summary available at: https://www.canada.ca/en/public-health/services/publications/drugs-health-products/canadian-antimicrobial-resistance-surveillance-system-2018-report-executive-summary.html. Accessed December 2018. Full report available upon request.
- Footnote 2
-
Canadian Animal Health Institute - About Us. Available at: http://cahi-icsa.ca/about/. Accessed October 2017.
- Footnote 3
-
European Medicines Agency. European Surveillance of Veterinary Antimicrobial Consumption, 2017-Sales of veterinary antimicrobial agents in 30 European countries in 2015. (EMA/184855/2017). Available at: http://www.ema.europa.eu/docs/en_GB/document_library/Report/2017/10/WC500236750.pdf. Accessed October 2017.
- Footnote 4
-
European Medicines Agency. European Surveillance of Veterinary Antimicrobial Consumption, 2017-Sales of veterinary antimicrobial agents in 30 European countries in 2015. (EMA/184855/2017). Available at: http://www.ema.europa.eu/docs/en_GB/document_library/Report/2017/10/WC500236750.pdf. Accessed October 2017.
- Footnote 5
-
Trends in the sales of veterinary antimicrobial agents in 9 European countries-Reporting period: 2005-2009. European Medicines Agency. European Surveillance of Veterinary Antimicrobial Consumption (ESVAC). Available at: www.ema.europa.eu/docs/en_GB/document_library/Report/2011/09/WC500112309.pdf. Accessed October 2017.
- Footnote 6
-
Available at: http://www.dfo-mpo.gc.ca/aquaculture/management-gestion/apr-rpa-reporting-eng.htm. Accessed June 2019.
- Footnote 7
-
Government of Canada. Animal biosecurity: National avian on-farm biosecurity standard. Available at: www.inspection.gc.ca/DAM/DAM-animals-animaux/STAGING/text-texte/terr_biosec_avian_standard_1375192173847_eng.pdf. Accessed September 2014.
- Footnote 8
-
Government of Canada. Animal biosecurity: National avian on-farm biosecurity standard. Available at: www.inspection.gc.ca/DAM/DAM-animals-animaux/STAGING/text-texte/terr_biosec_avian_standard_1375192173847_eng.pdf. Accessed September 2014.
- Footnote 9
-
Please refer to the "Quantity of antimicrobials used in broiler chickens" section for the quantity of antimicrobial use in grower-finisher pigs and turkey calculations.
- Footnote 10
-
Microsoft Excel®2003 and Microsoft Access®2003, Microsoft Corp., Redmond, WA, USA; SAS®9.1, SAS Institute Inc., Cary, NC, USA.
- Footnote 11
-
Cobb-Vantress, Inc. Products: Cobb 500™. Broiler Performance and Nutrition Supplement. Revised December 2012. Available at: https://cobb-guides.s3.amazonaws.com/a71b8bc0-bbd4-11e6-bd5d-55bb08833e29.pdf. Accessed October 2017.
- Footnote 12
-
Cobb-Vantress, Inc. Products: Cobb 700™. Broiler Performance and Nutrition Supplement. Revised July 2015. Available at: http://www.cobb-vantress.com/docs/default-source/cobb-700-guides/cobb700_broiler_performance_nutrition_supplement_english9294AABB12037B70EE475E39.pdf. Accessed September 2016.
- Footnote 13
-
Aviagen. Ross 308. Available at: http://en.aviagen.com/assets/Tech_Center/Ross_Broiler/Ross-308-Broiler-PO-2014-EN.pdf. Accessed October 2017.
- Footnote 14
-
Aviagen. Ross 708. Available at: http://en.aviagen.com/assets/Tech_Center/Ross_Broiler/Ross-708-Broiler-PO-2014-EN.pdf. Accessed October 2017.
- Footnote 15
-
Wallenstein Feeds (Revised March 2016) and Trouw Nutrition, formerly Nutreco Canada Inc. (version received, October, 2016).
- Footnote 16
-
Provided by Trouw Nutrition, formerly Nutreco Canada Inc. (version received October, 2016).
- Footnote 17
-
European Medicines Agency, 2016: Defined daily doses for animals (DDDvet) and defined course doses for animals (DCDvet). European Surveillance of Veterinary Antimicrobial Consumption (ESVAC). Accessed on January 2017.
- Footnote 18
-
CFIA, 2016b: Compendium of Medicating Ingredient Brochure. Available at: http://www.inspection.gc.ca/animals/feeds/medicating-ingredients/eng/1300212600464/1320602461227. Accessed on January 2017.
- Footnote 19
-
Canadian Animal Health Institute, 2016: Compendium of Veterinary Products. Available at: https://bam.naccvp.com/?u=country&p=msds. Accessed on January 2017.
- Footnote 20
-
Canadian Association of Poultry Veterinarians. Available at: http://www.capv-acva.ca/BroilerChicken.htm. Accessed on January 2017.
- Footnote 21
-
European Medicines Agency, 2016. European Surveillance of Veterinary Antimicrobial Consumption. Defined daily doses for animals (DDDvet) and defined course doses for animals (DCDvet) (ESVAC). Available at: http://www.ema.europa.eu/docs/en_GB/document_library/Other/2016/04/WC500205410.pdf. Accessed January 2017.
- Footnote 22
-
Persoons D, Dewulf J, Smet A, Herman L, Heyndrickx M, Martel A, et al. Antimicrobial use in Belgian broiler production. Prev Vet Med. 2012.
- Footnote 23
-
Timmerman T, Dewulf J, Catry B, Feyen B, Opsomer G, de Kruif A, Maes D. 2006. Quantification and evaluation of antimicrobial drug use in group treatments for fattening pigs in Belgium. Prev. et Med. 74:251-263.
- Footnote 24
-
Collineau L, Belloc C, Stärk KD, Hémonic A, Postma M, Dewulf J, Chauvin C. 2017. Guidance on the Selection of Appropriate Indicators for Quantification of Antimicrobial Usage in Humans and Animals. Zoonoses Public Health. 64:165-184.
- Footnote 25
-
The AACTING-network. Guidelines for collection, analysis and reporting of farm-level antimicrobial use, in the scope of antimicrobial stewardship. Available at: http://www.aacting.org/guidelines/. Accessed on March 2018.
- Footnote 26
-
European Centre for Disease Prevention and Control (ECDC), European Food Safety Authority (EFSA) and European Medicines Agency (EMA). Second joint report on the integrated analysis of the consumption of antimicrobial agents and occurrence of antimicrobial resistance in bacteria from humans and food-producing animals-Joint Interagency Antimicrobial Consumption and Resistance Analysis (JIACRA) Report. Available at: http://www.ema.europa.eu/docs/en_GB/document_library/Report/2017/07/WC500232336.pdf. Accessed on October 2017.
- Footnote 27
-
Version April, 2009. Available at: www.hc-sc.gc.ca/dhp-mps/vet/antimicrob/amr_ram_hum-med-rev-eng.php. Accessed February 2017.
- Footnote 28
-
Nicolas Performance Objectives. Available at: http://www.aviagenturkeys.us/uploads/2015/12/21/nicholas_comm_perf_obj_select_2015.pdf. Accessed on October 2017.
- Footnote 29
-
Hybrid turkeys performance goals. Available at: http://resources.hybridturkeys.com/commercial/birds. Accessed on October 2017.
- Footnote 30
-
Available at: http://www.aviagenturkeys.us/uploads/2015/12/21/Aviagen%20Breeder%20Guide%202015.pdf. Accessed October, 2017.
- Footnote 31
-
Report of the 2001 Canadian Laboratory Study, National Studies on Acute Gastrointestinal Illness, Division of Enteric, Foodborne and Waterborne Diseases, 2002.
- Footnote 32
-
Ravel A. Antimicrobial Surveillance in food at retail - Proposal for a pilot project. 2002. 13 pp.
- Footnote 33
-
No retail sampling was conducted in Manitoba to-date or Saskatchewan in 2017.
- Footnote 34
-
No retail sampling was conducted in Newfoundland and Labrador.
- Footnote 35
-
For 2017, due to limited sampling technician availability, only a partial year's worth of retail sampling was conducted in Ontario and the Prairies. Sampling target and isolate yields were therefore not achieved. All 2017 Ontario and Prairie retail data should be interpreted with caution. Additionally in 2017, retail sampling activities in the Atlantic region were suspended due to budgetary constraints.
- Footnote 36
-
At 1 store in each division (except the Atlantic region), the beef sample was not collected to minimize over-sampling of this commodity.
- Footnote 37
-
For 2017, due to limited sampling technician availability, only a partial year's worth of retail sampling was conducted in Ontario and the Prairies. Sampling target and isolate yields were therefore not achieved. All 2017 Ontario and Prairie retail data should be interpreted with caution. Additionally in 2017, retail sampling activities in the Atlantic region were suspended due to budgetary constraints.
- Footnote 38
-
Ertco Data Loggerä, West Patterson, NJ, USA.
- Footnote 39
-
Agriculture and Agri-Food Canada. Red meat market information. Available at http://agriculture.canada.ca/eng/industry-markets-and-trade/market-information-by-sector/red-meat-and-livestock/red-meat-and-livestock-market-information/slaughter. Accessed October 2017.
- Footnote 40
-
Ravel A. Development of the Canadian antimicrobial resistance surveillance system (agri-food sector)-sampling design options. Presented to the National Steering Committee on Antimicrobial Resistance in Enterics, Canada, 2001. 79 pp.
- Footnote 41
-
Kauffman F. The Bacteriology of Enterobacteriaceae. Baltimore: Williams and Wilkins Co, 1966.
- Footnote 42
-
Ewing WH. Edwards and Ewing's Identification of Enterobacteriaceae. 4th ed. New York: Elsevier Science Publishing Co, 1986.
- Footnote 43
-
Le Minor L. Guidelines for the preparation of Salmonella antisera. Paris, France: WHO Collaborating Centre for Reference and Research on Salmonella, Pasteur Institute, 2001.
- Footnote 44
-
Murray PR, Baron EJ, Pfaller MA, et al, eds. Manual of Clinical Microbiology. 8th ed. Washington DC, ASM Press, 2005.
- Footnote 45
-
Compendium of Analytical Methods, Health Protection Branch, Methods of Microbiological Analysis of Food, Government of Canada.
- Footnote 46
-
When legs with skin on were not available, wings with skin on or other cuts were purchased instead.
- Footnote 47
-
API®20E system.
- Footnote 48
-
The multiplex PCR speciation of Campylobacter jejuni and Campylobacter coli was based on the following published method. Person S, KE Olsen. Multiplex PCR for identification of Campylobacter coli and Campylobacter jejuni from pure cultures and directly on stool samples. J Med Microbiol 2005; 54:1043-1047.
- Footnote 49
-
Qiagen®. QIAxcel®DNA Handbook, 5th Edition November 2014. Available at: https://www.qiagen.com/ca/resources/resourcedetail?id=f6158498-a857-4a2f-b40b-569fba3793e2&lang=en. Accessed on October 2016.
- Footnote 50
-
Grimont PAD, Weill F-X. Antigenic formulae of the Salmonella serovars. 9th ed. Paris, France: WHO Collaborating Centre for Reference and Research on Salmonella, Institut Pasteur, 2007.
- Footnote 51
-
Ewing WH. Edwards and Ewing's Identification of Enterobacteriaceae. 4th ed. New York: Elsevier Science Publishing Co, 1986.
- Footnote 52
-
Salmonella Paratyphi B does not include S. Paratyphi B var. L (+) tartrate (+), formerly called S. Paratyphi var. Java. The biotype of S. Paratyphi B included here is tartrate (-) and associated with severe typhoid-like fever. Salmonella Paratyphi B var. L (+) tartrate (+) is commonly associated with gastrointestinal illness.
- Footnote 53
-
Anderson E, Williams R. Bacteriophage typing of enteric pathogens and staphylococci and its use in epidemiology. J Clin Pathol 1956; 9: 94-127.
- Footnote 54
-
Difcoä phage broth, Difco Laboratories, Baltimore, MD; pH 6.8.
- Footnote 55
-
Difcoä phage agar, Difco Laboratories.
- Footnote 56
-
Farmer J, Hickman F, Sikes J. Automation of Salmonella typhi phage-typing. Lancet 1975; 2(7939): 787-790.
- Footnote 57
-
Anderson E, Williams R. Bacteriophage typing of enteric pathogens and staphylococci and its use in epidemiology. J Clin Pathol 1956; 9: 94-127.
- Footnote 58
-
Ward L, de Sa J, Rowe B. A phage-typing scheme for Salmonella Enteritidis. Epidemiol Infect 1987; 99: 291-294.
- Footnote 59
-
Callow B. A new phage typing scheme for Salmonella Typhimurium. J Hyg (Lond) 1959; 57: 346-359.
- Footnote 60
-
Anderson E. The phagetyping of Salmonella other than S. Typhi. In: Van Oye E, ed. The World Problem of Salmonellosis. The Hague, The Netherlands: Dr W. Junk Publishers, 1964; 89-100.
- Footnote 61
-
Anderson E, Ward L, de Saxe M, et al. Bacteriophage-typing designations of Salmonella Typhimurium. J Hyg (Lond) 1977; 78: 297-300.
- Footnote 62
-
Demczuk W, Soule G, Clark C, et al. Phage-based typing scheme for Salmonella enterica serovar Heidelberg, a causative agent of food poisonings in Canada. J Clin Microbiol 2003; 41: 4279-4284.
- Footnote 63
-
Office Internationale des Épizooties (OIÉ); World Organisation for Animal Health, Reference Laboratory for Salmonellosis, Guelph, Ontario.
- Footnote 64
-
Yoshida C., et al. Multi-laboratory evaluation of the rapid genoserotyping array (SGSA) for the identification of Salmonella serovars. Diag Microbiol & Infect Dis 2014; 80:185-190.
- Footnote 65
-
Ewing WH. Edwards and Ewing's Identification of Enterobacteriaceae. 4th ed. New York: Elsevier Science Publishing Co, 1986.
- Footnote 66
-
Shipp C, Rowe B. A mechanised microtechnique for Salmonella serotyping. J Clin Pathol 1980; 33: 595-597.
- Footnote 67
-
Grimont PAD, Weill F-X. Antigenic Formulae of the Salmonella Serovars. 9th ed. Cedex, France: Collaborating Center for Reference and Research on Salmonella, Institut Pasteur, 2007.
- Footnote 68
-
Anderson E, Williams R. Bacteriophage typing of enteric pathogens and staphylococci and its use in epidemiology. J Clin Pathol 1956; 9: 94-127.
- Footnote 69
-
Clinical and Laboratory Standards Institute (CLSI) M7-A10.
- Footnote 70
-
SensititreTM Trek Diagnostic Systems Ltd, West Sussex, England.
- Footnote 71
-
SensititreTM Trek Diagnostic Systems Ltd, West Sussex, England.
- Footnote 72
-
ARISä, Trekä Diagnostic Systems Ltd, West Sussex, England.
- Footnote 73
-
CLSI M100-S27.
- Footnote 74
-
CLSI M45-A3.
- Footnote 75
-
SensititreTM Trek Diagnostic Systems Ltd, West Sussex, England.
- Footnote 76
-
CLSI M45-A3.
- Footnote 77
-
Oracle®, Oracle Corp., Redwood Shores, CA, USA.
- Footnote 78
-
SAS®9.3, SAS Institute Inc., Cary, NC, USA.
- Footnote 79
-
SAS®9.3; and Stata®13 SE, Stata Corp., College Station, TX, USA.
- Footnote 80
-
Microsoft®Excel 2010, Microsoft Corp.
- Footnote 81
-
PROC GENMOD, SAS®9.3.
- Footnote 82
-
Stata®13 SE.
- Footnote 83
-
Health Canada. 2009. Categorization of Antimicrobial Drugs Based on Importance in Human Medicine. Version April, 2009. Available at: https://www.canada.ca/en/health-canada/services/drugs-health-products/veterinary-drugs/antimicrobial-resistance/categorization-antimicrobial-drugs-based-importance-human-medicine.html. Accessed July 2017.
- Footnote 84
-
Ceftiofur is licensed for use in animals only. Resistance to ceftiofur is generally detected in combination with resistance to amoxicillin-clavulanic acid, cefoxitin, ampicillin and ceftriaxone (A2C-AMP-CRO resistance pattern).
- Footnote 85
-
World Health Organization Collaborating Center for Drug Statistics Methodology. ATCvet. Available at: www.whocc.no/atcddd. Accessed May 2017.
- Footnote 86
-
World Health Organization Collaborating Center for Drug Statistics Methodology. ATCvet. Available at: www.whocc.no/atcddd. Accessed May 2017.
- Footnote 87
-
World Health Organization Collaborating Center for Drug Statistics Methodology. Available at: www.whocc.no/atcddd. Accessed May 2017.
- Footnote 88
-
In 2017, not all provinces are represented in each surveillance component for the Prairies and the Atlantic region.
- Footnote 89
-
Canadian Association of Poultry Veterinarians. Available at: http://www.capv-acva.ca/BroilerChicken.htm. Accessed January 2017.
- Footnote 90
-
CFIA, 2016b: Compendium of Medicating Ingredient Brochure. Available at: http://www.inspection.gc.ca/animals/feeds/medicating-ingredients/eng/1300212600464/1320602461227. Accessed on January 2017.
- Footnote 91
-
Canadian Animal Health Institute, 2016: Compendium of Veterinary Products. Available at: https://bam.naccvp.com/?u=country&p=msds. Accessed on January 2017.
- Footnote 92
-
CFIA, 2016b: Compendium of Medicating Ingredient Brochure. Available at: http://www.inspection.gc.ca/animals/feeds/medicating-ingredients/eng/1300212600464/1320602461227. Accessed on January 2017.
- Footnote 93
-
Canadian Animal Health Institute, 2016: Compendium of Veterinary Products. Available at: https://bam.naccvp.com/?u=country&p=msds. Accessed on January 2017.
- Footnote 94
-
Available at: http://www.ema.europa.eu/ema/index.jsp?curl=pages/includes/document/document_detail.jsp?webContentId=WC500184369&mid=WC0b01ac058009a3dc. Accessed January 2017.
- Footnote 95
-
Available at: http://www.sites.ext.vt.edu/newsletter-archive/livestock/aps-06_07/aps-349.html. Accessed on January 2017. Available at: http://www.sites.ext.vt.edu/newsletter-archive/livestock/aps-06_07/aps-349.html. Accessed on January 2017.
- Footnote 96
-
Available at: http://www.ema.europa.eu/ema/index.jsp?curl=pages/includes/document/document_detail.jsp?webContentId=WC500184369&mid=WC0b01ac058009a3dc. Accessed January 2017.