
Canadian Integrated Program for Antimicrobial Resistance Surveillance (CIPARS) 2017: Integrated Findings
Download the PDF version, 4402 KB
To promote and protect the health of Canadians through leadership, partnership, innovation and action in public health, Public Health Agency of Canada.
Working towards the preservation of effective antimicrobials for humans and animals, Canadian Integrated Program for Antimicrobial Resistance Surveillance.
Également disponible en français sous le titre :
Programme intégré canadien de surveillance de la résistance aux antimicrobiens (PICRA) 2017 : Résultats intégrés
To obtain additional information, please contact:
Dolly Kambo
Executive assistant
Public Health Agency of Canada
370 Speedvale Avenue West, Guelph, ON N1H 7M7
Telephone: 519-826-2174
Fax: 519-826-2255
E-mail: phac.cipars-picra.aspc@canada.ca
This publication can be made available in alternative formats upon request.
©Her Majesty the Queen in Right of Canada, as represented by the Minister of Health, 2020
Publication date: January 2020
This publication may be reproduced for personal or internal use only without permission provided the source is fully acknowledged.
Cat.: HP2-4/2017E-2-PDF
PDF ISBN: 978-0-660-32669-6
Pub.: 190361
Suggested Citation:
Government of Canada. Canadian Integrated Program for Antimicrobial Resistance Surveillance (CIPARS) 2017: Integrated Findings. Public Health Agency of Canada, Guelph, Ontario, 2020.
On this page
- Overview of CIPARS activities
- What's new for CIPARS in 2017
- 2017 Key findings
- Integrated findings and discussion
- Glossary
Questions?
phac.cipars-picra.aspc@canada.ca
https://www.canada.ca/en/public-health/services/surveillance/canadian-integrated-program-antimicrobial-resistance-surveillance-cipars/cipars-reports.html
CIPARS 2017: Figures and Tables
Overview of CIPARS activities
Figure 1. CIPARS brings together diverse sources of data in a robust and sound manner
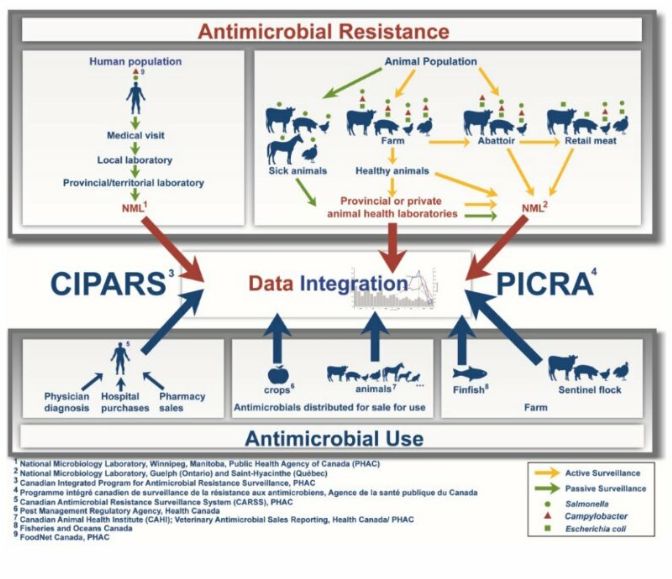
Figure 1 - Text Description
CIPARS brings together diverse sources of data in a robust and sound manner
This diagram represents all of the surveillance components that contribute to the Canadian Integrated Program for Antimicrobial Resistance Surveillance (CIPARS). The top half of the figure depicts all of the surveillance components related to antimicrobial resistance. On the left side, a component of passive surveillance (green arrows) associated with clinical samples of Salmonella (green circle) and Campylobacter (red triangle) of human origin is presented. These human samples are taken during the medical visit and sent to a local laboratory, then to a provincial/territorial laboratory, and finally to the National Microbiology Laboratory of Public Health Agency of Canada (PHAC) in Winnipeg. On the right side, there is a passive surveillance component (green arrows) and three active surveillance components (yellow arrows) from the Agri-Food sector. The passive surveillance component (green arrows) relies on clinical samples from sick animals (cattle, pigs, chickens, horses, and turkeys) that are submitted to provincial or private animal health laboratories for the isolation of Salmonella (green circle). Further on the right are presented the active surveillance components (yellow arrows) based on animal samples from the farm (cattle, pigs, chickens and turkeys), the abattoir (beef cattle, chickens, pigs) and also on retail meat samples (beef, pork, chicken and turkey). In general, samples from diseased animals are sent to the PHAC National Microbiology Laboratory in Guelph through provincial or private animal health laboratories. For other Agri-Food samples, most will be sent directly to the Saint-Hyacinthe National Microbiology Laboratory of the PHAC for the isolation of Salmonella (green circle), Campylobacter (red triangle), and Escherichia coli (green square).
The bottom of the diagram lists the surveillance components for antimicrobial use. On the left, three components related to the use of antimicrobials in humans and based on physician diagnostic data, hospital purchases and pharmacy sales data are shown. The data from humans are analyzed by the Canadian Antimicrobial Resistance Surveillance System of the PHAC and will be integrated with other CIPARS data. In the center, there is a component that monitors antimicrobials distributed for sale for use in crops. These data are processed by Health Canada's Pest Management Regulatory Agency and are also incorporated into some CIPARS data. There is also a component that monitors antimicrobials distributed to animals. This includes antimicrobials distributed for sale for use in production animals (cattle, pigs, chickens, turkey, etc.) and companion animals (dogs, cats, horses, etc.). The latter are processed by the Canadian Animal Health Institute and are sent to CIPARS for further integration. On the right, there are two surveillance components related to antimicrobial use on farm, the finfish antimicrobial use data (processed by Fisheries and Oceans Canada) and the sentinel flock antimicrobial use data (cattle, pigs, chickens and turkeys).
The central section of this diagram illustrates the collection of all data related to antimicrobial resistance and antimicrobial use within the CIPARS program. All data collected are integrated to figure out trend evolution and status of antimicrobial resistance and use in humans and the agri-food sector in Canada.
What's new for CIPARS in 2017
We are modernizing how we share our information with different audiences and are transitioning to new communication tools and formats. In the meantime, CIPARS will continue to deliver the same information, but in a modified manner.
For the 2017 data, we will be releasing 4 documents:
- Executive summary
- Figures and Tables (summarized information with little accompanying text)
- Design and Methods
- Integrated Findings
Antimicrobial use
- Fisheries and Oceans Canada provided data on antimicrobial use in marine and freshwater finfish aquaculture.
Antimicrobial resistance
- Only a partial year of retail sampling was conducted in Ontario and the Prairies, and no sampling occurred in the Atlantic region.
- Sampling for Campylobacter spp. from retail ground turkey was discontinued due to low recovery.
2017 Key findings
Antimicrobial use
In 2017, fewer farms participating in CIPARS surveillance reported using antimicrobials:
- Antimicrobial sales decreased between 2016 and 2017
- For broiler chicken and pig farms participating in CIPARS surveillance, the overall reported quantity of antimicrobials used declined. For turkey farms participating, there was a small increase in the overall reported use
- The types of antimicrobials used varied by animal species
- Based on sentinel farm data, antimicrobial use in turkeys was generally lower than antimicrobial use in broiler chickens
The reductions in antimicrobial use on broiler chicken and pig farms may be in response to new policy regulations for medically important antimicrobials (eliminating use for growth promotion and available by prescription only).
Antimicrobial resistance
Since 2011, we have observed an increasing number of human and agri-food isolates resistant to more than 5 antimicrobial classes.
Integrated antimicrobial use and resistance data
Chicken and people
Ceftiofur use in poultry
The poultry industry initiative to eliminate use of Category I antimicrobials (including the 3rd generation cephalosporin ceftiofur) for disease prevention appears to have had the desired effect to reduce antimicrobial resistance:
- There has been no reported ceftiofur use in broiler chickens since 2015
- There has been a reduction in resistance in both E. coli and Salmonella recovered from chickens on farm, at slaughter, and in chicken purchased at grocery stores
- Importantly, in Salmonella isolates recovered from people, resistance to the third generation cephalosporin ceftriaxone also declined
Campylobacter
There are currently regional differences in the prevalence of fluoroquinolone-resistant Campylobacter from chickens and chicken meat.
In 2017, resistance to ciprofloxacin was more commonly identified in human Campylobacter isolates and retail chicken from British Columbia compared to Alberta and Ontario.
Integrated findings and discussion
Integrated antimicrobial use
Antimicrobials are grouped into categories based on their importance to human medicine and the potential consequences of resistance to these drugs:
- Category I: Very high importance
Examples: cephalosporins (3rd and 4th generation), carbapenems, fluoroquinolones - Category II: High importance
Examples: macrolides, penicillins - Category III: Medium importance
Examples: aminoglycosides, tetracyclines - Category IV: Low importance
Examples: ionophores, chemical coccidiostats
Similar to 2016, antimicrobials of low importance (Category IV, with the exception of flavophospholipids) were removed from the integrated AMU reporting. Data will be available in other CIPARS products.
Note: chemical coccidiostats are considered unclassified antimicrobials.
For reporting data on antimicrobials used in animals, we use different metrics or ways of reporting the information.
Why do we use different metrics?
- There are several different ways to collect, analyze, and report antimicrobial use data.
- No single approach is appropriate for all purposes. Certain metrics are better suited to looking at trends over time, while others may be more appropriate for comparing different regions or different host species, and others may be better for understanding relationships between use and resistance.
Comparing humans, animals, and crops
Canada is a major producer of food animals for domestic and international markets.
Figure 2. Human and animal population estimates with total kilograms of antimicrobials distributed and/or sold in 2017
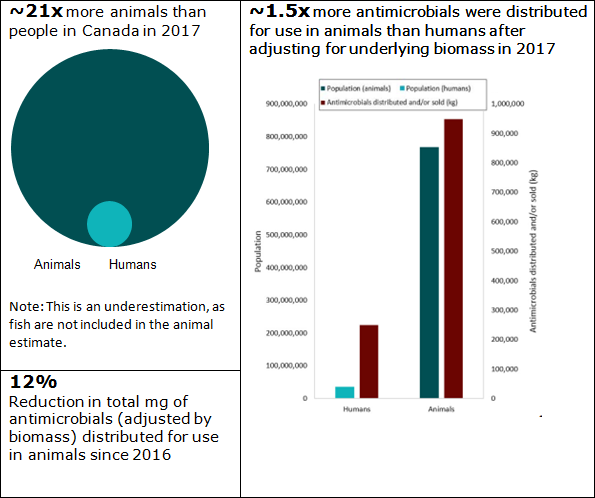
Figure 2 - Text Description
| Population | Estimated number | Ratio | Antimicrobials distributed and/or sold (kg) |
|---|---|---|---|
| Humans | 36,540,268 | 1 | 249,026 |
| Animals | 768,334,311 | 21 | 948,615 |
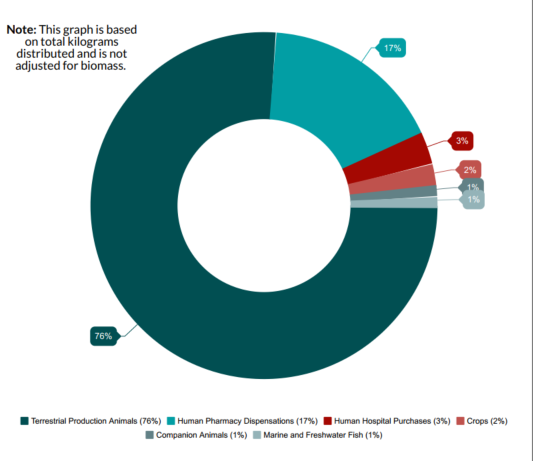
Approximately 77% of antimicrobials distributed or soldFigure 3 footnote * (when measured by kilograms of active ingredient) in 2017 were intended for production animals, 20% were for humans, 2% for crops and 1% for companion animals.
Figure 3. Proportion of total kilograms of antimicrobials distributed and/or sold in Canada in 2017, by sector
- Figure 3 footnote *
-
When measured by kilograms of active ingredient.
Figure 3 - Text Description
| Antimicrobials distributed and/or sold | % |
|---|---|
| Companion animals | 1% |
| Crops | 2% |
| Human hospital purchases | 3% |
| Human pharmacy dispensations | 17% |
| Terrestrial production animals | 76% |
| Marine and freshwater fish | 1% |
| Total (across all sectors) | 100% |
Note: This graph is based on total kilograms distributed and is not adjusted for biomass. Animal distribution data currently does not account for quantities imported for own use, or as active pharmaceutical ingredients for further compounding; hence are underestimates of total quantities used. |
|
Figure 4. The proportions of total kilograms of antimicrobial classes distributed or sold in 2017 in humans, production animals, and companion animals
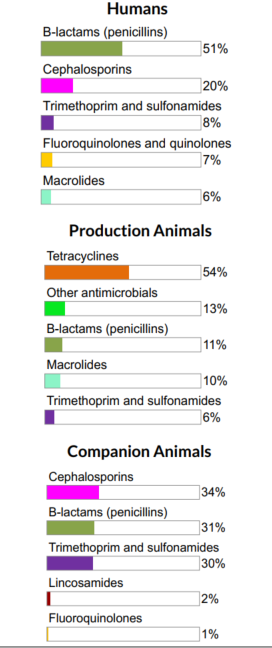
Figure 4 - Text Description
| Humans | Production Animals | Companion Animals | |||
|---|---|---|---|---|---|
| Antimicrobial Class | % | Antimicrobial Class | % | Antimicrobial Class | % |
| Beta-lactams/penicillins | 51% | Tetracyclines | 54% | Cephalosporins | 34% |
| Cephalosporins | 20% | Other antimicrobials | 13% | Beta-lactams/penicillins | 31% |
| Trimethoprim and sulfonamides | 8% | Beta-lactams/penicillins | 11% | Trimethoprim and sulfonamides | 30% |
| Fluoroquinolones and quinolones | 7% | Macrolides | 10% | Lincosamides | 2% |
| Macrolides | 6% | Trimethoprim and sulfonamides | 6% | Fluoroquinolones | 1% |
For both humans and animals, the β-lactams (penicillins) were one of the main antimicrobial classes distributed/sold on a per kg of antimicrobial basis.
Similar antimicrobials are licensed for use in humans and animals; however, some antimicrobial classes are sold or distributed more for use in humans than animals and vice-versa.
- Tetracyclines (Category III) are used predominantly in production animals
- The relative quantity of cephalosporins and Fluoroquinolones (Category I) intended for use in humans is higher compared to animals
Note: Cephalosporins are β-lactam antimicrobials, but we are displaying them separately for visualization purposes.
The total quantities of antimicrobials distributed for sale for use in production animals declined, both when measured in total kg and kg adjusted by biomass. These are the lowest reported values since surveillance began.
Figure 5. Quantities of antimicrobials distributed for use in animals
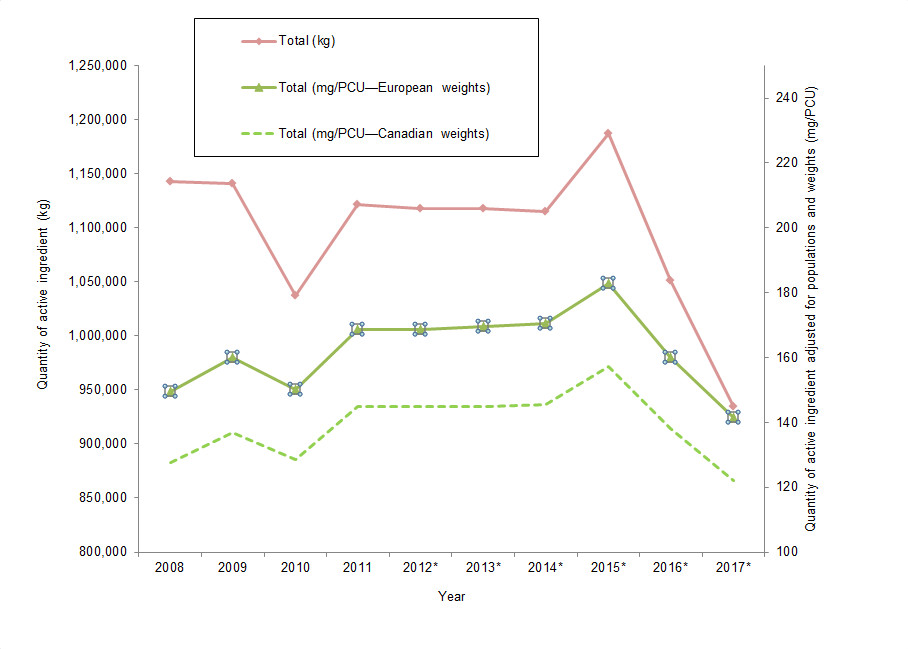
Figure 5 - Text Description
| Year | Total (kg) | Total (mg/PCU European weights) | Total (mg/PCU Canadian weights) |
|---|---|---|---|
| 2008 | 1,143,187 | 150 | 128 |
| 2009 | 1,141,213 | 160 | 137 |
| 2010 | 1,037,313 | 150 | 129 |
| 2011 | 1,121,715 | 168 | 145 |
| 2012Figure 5 footnote * | 1,117,457 | 169 | 145 |
| 2013Figure 5 footnote * | 1,118,097 | 170 | 145 |
| 2014Figure 5 footnote * | 1,114,837 | 170 | 146 |
| 2015Figure 5 footnote * | 1,187,136 | 183 | 157 |
| 2016Figure 5 footnote * | 1,051,010 | 160 | 138 |
| 2017Figure 5 footnote * | 934,873 | 141 | 122 |
|
|||
Figure 6. Quantities of antimicrobials used (mg/PCU) by Canada (2017) and countries participating in the European Surveillance of Veterinary Antimicrobial Consumption (ESVAC) network (2016)
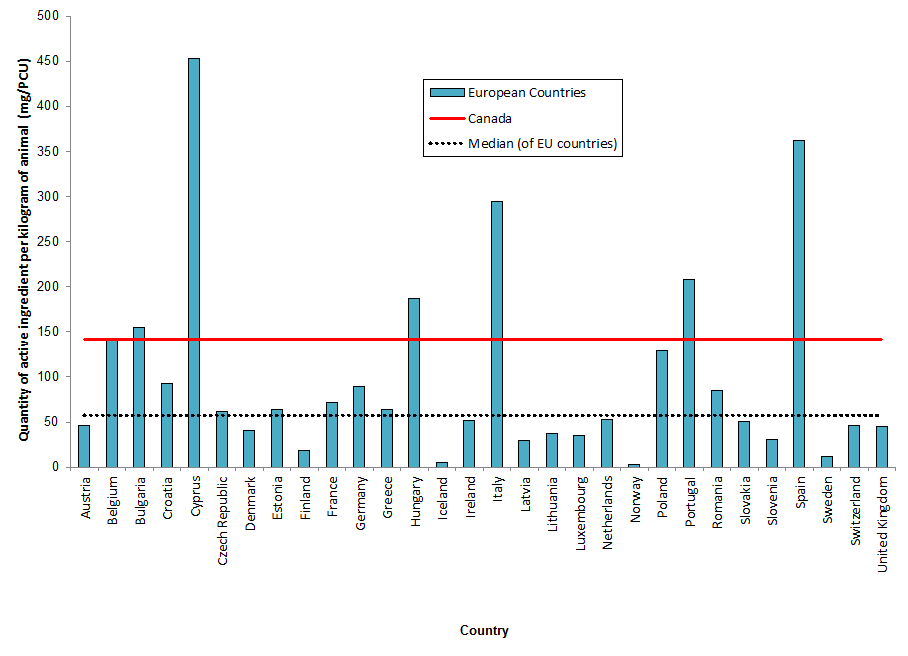
Figure 6 - Text Description
| European Countries | mg/PCU | Canada | Median of EU countries |
|---|---|---|---|
| Austria | 46 | 141 | 57 |
| Belgium | 140 | 141 | 57 |
| Bulgaria | 155 | 141 | 57 |
| Croatia | 93 | 141 | 57 |
| Cyprus | 453 | 141 | 57 |
| Czech Republic | 61 | 141 | 57 |
| Denmark | 41 | 141 | 57 |
| Estonia | 64 | 141 | 57 |
| Finland | 19 | 141 | 57 |
| France | 72 | 141 | 57 |
| Germany | 89 | 141 | 57 |
| Greece | 64 | 141 | 57 |
| Hungary | 187 | 141 | 57 |
| Iceland | 5 | 141 | 57 |
| Ireland | 52 | 141 | 57 |
| Italy | 295 | 141 | 57 |
| Latvia | 30 | 141 | 57 |
| Lithuania | 38 | 141 | 57 |
| Luxembourg | 36 | 141 | 57 |
| Netherlands | 53 | 141 | 57 |
| Norway | 3 | 141 | 57 |
| Poland | 129 | 141 | 57 |
| Portugal | 208 | 141 | 57 |
| Romania | 85 | 141 | 57 |
| Slovakia | 50 | 141 | 57 |
| Slovenia | 30 | 141 | 57 |
| Spain | 363 | 141 | 57 |
| Sweden | 12 | 141 | 57 |
| Switzerland | 47 | 141 | 57 |
| United Kingdom | 45 | 141 | 57 |
Data Sources: Canadian Animal Health Institute (CAHI), European Surveillance of Veterinary Antimicrobial Consumption (ESVAC), Fisheries and Oceans Canada, Health Canada's Pest Management Regulatory Agency, human pharmacy and hospital data from IQVIA via the Canadian Antimicrobial Resistance Surveillance System, Statistics Canada, Agriculture and Agri-food Canada, and Equine Canada.
Comparing farm antimicrobial use data
Comparison of antimicrobial classes (kg of active ingredient)
There are important differences in the types and relative quantities of antimicrobials reported for use between food animal species, which is why we need ongoing surveillance across the food animal species.
Figure 7.1 The relative quantities of antimicrobial classes reported for use (mg/PCU) in animals in 2017: broiler chickens
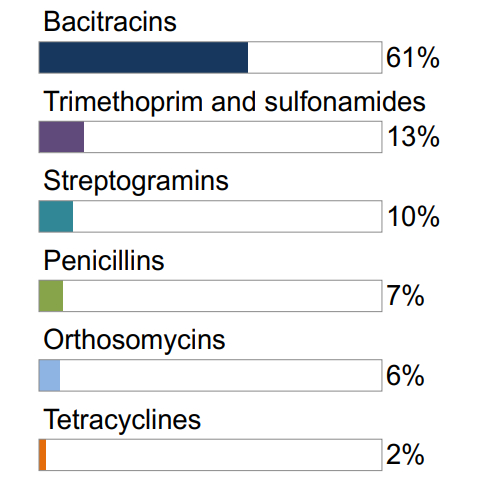
Not shown: macrolides (1%), aminoglycosides (1%), lincosamides-aminocyclitols (<1%)
Figure 7.2 The relative quantities of antimicrobial classes reported for use (mg/PCU) in animals in 2017: grower-finisher pigs
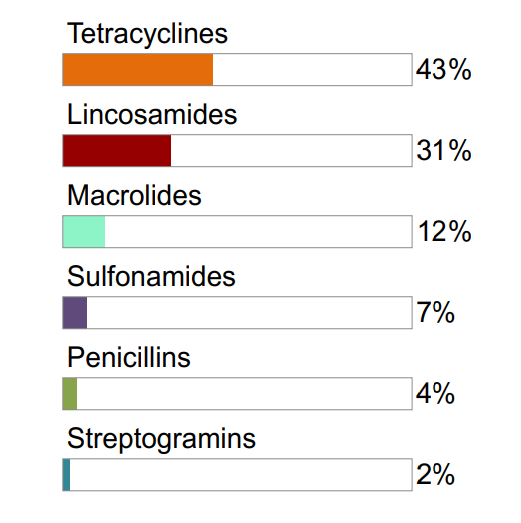
Not shown: pleuromutilins (1%)
Figure 7.3 The relative quantities of antimicrobial classes reported for use (mg/PCU) in animals in 2017: turkeys
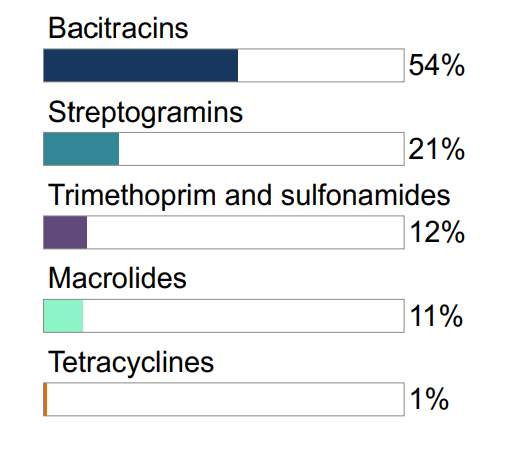
Figure 7.1, 7.2, 7.3 - Text Description
| Broiler Chickens | Grower-Finisher Pigs | Turkeys | |||
|---|---|---|---|---|---|
| Antimicrobial Class | % | Antimicrobial Class | % | Antimicrobial Class | % |
| Bacitracins | 61% | Tetracyclines | 43% | Bacitracins | 54% |
| Trimethoprim and sulfonamides | 13% | Lincosamides | 31% | Streptogramins | 21% |
| Streptogramins | 10% | Macrolides | 12% | Trimethoprim and sulfonamides | 12% |
| Penicillins | 7% | Sulfonamides | 7% | Macrolides | 11% |
| Orthosomycins | 6% | Penicillins | 4% | Tetracyclines | 1% |
| Tetracyclines | 2% | Streptogramins | 2% | ||
Not shown: penicillins (<1%)
Temporal trends in antimicrobial use
Broiler chickens
Farm surveillance showed a reduction in antimicrobial use in 2017 compared with 2016 data in broiler chickens.
When we accounted for the number and weight of chickens, the top reported antimicrobials were:
- Bacitracins
- Trimethoprim
- Streptogramins
When we accounted for the number of doses, the top reported antimicrobials were:
- Bacitracins
- Streptogramins
- Orthosomycins
Figure 8. Temporal trends in mg/PCU in broiler chickens in Canada, 2013 to 2017
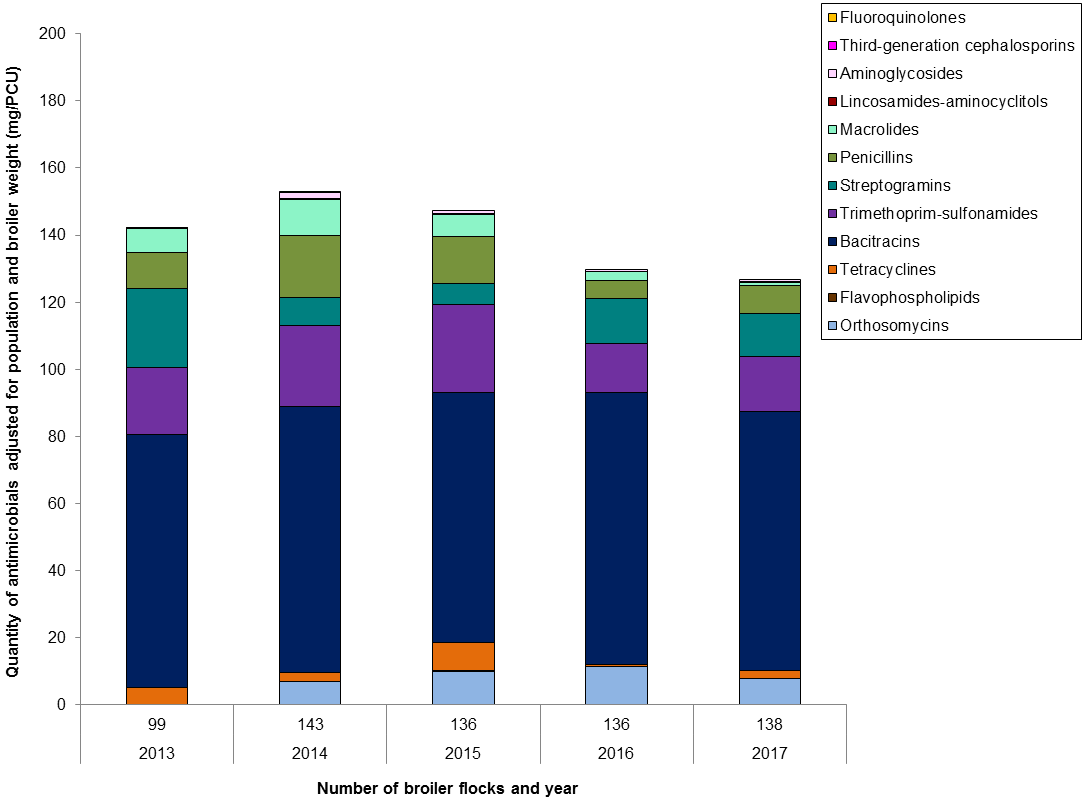
Figure 8 - Text Description
| Year | 2013 | 2014 | 2015 | 2016 | 2017 | |
|---|---|---|---|---|---|---|
| Number of flocks | 99 | 143 | 136 | 136 | 138 | |
| Antimicrobial class | ||||||
| I | Fluoroquinolones | < 0.1 | 0 | 0 | 0 | 0 |
| Third-generation cephalosporins | < 0.1 | < 0.1 | 0 | 0 | 0 | |
| II | Aminoglycosides | < 0.1 | 2 | 1 | 0.5 | 1 |
| Lincosamides-aminocyclitols | 0.1 | 0.1 | 0.2 | 0.1 | 0.1 | |
| Macrolides | 7 | 11 | 7 | 3 | 1 | |
| Penicillins | 11 | 19 | 14 | 5 | 8 | |
| Streptogramins | 24 | 8 | 6 | 14 | 13 | |
| Trimethoprim and sulfonamides | 20 | 24 | 26 | 14 | 16 | |
| III | Bacitracins | 75 | 79 | 74 | 82 | 77 |
| Tetracyclines | 5 | 3 | 8 | 0 | 2 | |
| IV | Flavophospholipids | 0.2 | 0 | 0.3 | < 0.1 | 0.1 |
| N/A | Orthosomycins | 0 | 7 | 10 | 11 | 8 |
| Total | 142 | 153 | 147 | 130 | 127 | |
Figure 9. Temporal trends in nDDDvetCA/1000 chicken-days at risk in broiler chickens, 2013 to 2017
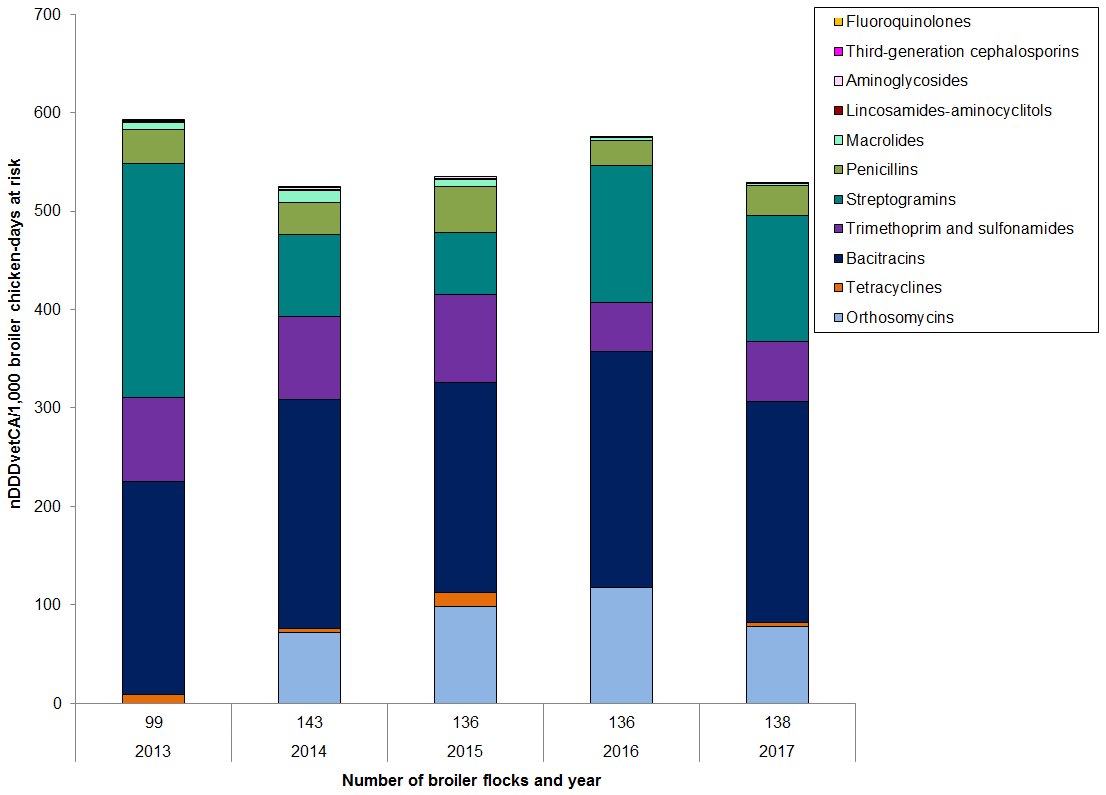
Figure 9 - Text Description
| Year | 2013 | 2014 | 2015 | 2016 | 2017 | |
|---|---|---|---|---|---|---|
| Number of flocks | 99 | 143 | 136 | 136 | 138 | |
| Antimicrobial class | ||||||
| I | Fluoroquinolones | 0.04 | 0 | 0 | 0 | 0 |
| Third-generation cephalosporins | 1 | 0.1 | 0 | 0 | 0 | |
| II | Aminoglycosides | 0.0 | 2 | 2 | 1 | 1 |
| Lincosamides-aminocyclitols | 0.5 | 0.5 | 1 | 0.5 | 0.5 | |
| Macrolides | 8 | 12 | 7 | 3 | 1 | |
| Penicillins | 34 | 33 | 47 | 25 | 31 | |
| Streptogramins | 237 | 83 | 63 | 139 | 128 | |
| Trimethoprim and sulfonamides | 85 | 85 | 89 | 50 | 61 | |
| III | Bacitracins | 217 | 232 | 213 | 239 | 224 |
| Tetracyclines | 9 | 4 | 15 | 1 | 4 | |
| N/A | Orthosomycins | 0 | 72 | 98 | 117 | 79 |
| Total | 591 | 524 | 535 | 576 | 529 | |
Grower-finisher pigs
A grower-finisher pig is a pig that is approximately 25 kilograms to market weight. Farm surveillance showed a reduction in antimicrobials used in feed in 2017 compared with 2016 data in grower-finisher pigs.
When we accounted for the number and weight of pigs, the top reported antimicrobials were:
- Tetracycline
- Lincosamides
- Macrolides
When we accounted for the number of doses, the top reported antimicrobials were:
- Lincosamides
- Tetracyclines
- Macrolides
Figure 10. Temporal trends in mg/PCU in grower-finisher pigs in Canada, 2009 to 2017
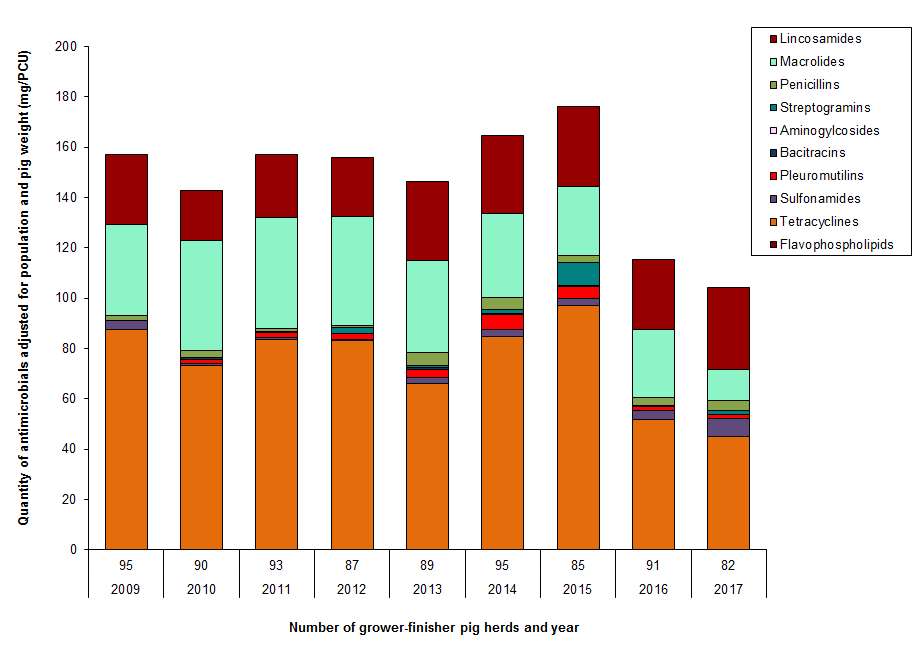
Figure 10 - Text Description
| Year | 2009 | 2010 | 2011 | 2012 | 2013 | 2014 | 2015 | 2016 | 2017 | |
|---|---|---|---|---|---|---|---|---|---|---|
| Number of herds | 95 | 90 | 93 | 87 | 89 | 95 | 85 | 91 | 82 | |
| Antimicrobial class | ||||||||||
| II | Lincosamides | 28.0 | 20.1 | 25.1 | 23.2 | 31.3 | 31.1 | 31.9 | 28.1 | 32.6 |
| Macrolides | 35.9 | 43.7 | 44.2 | 43.3 | 36.8 | 33.2 | 27.3 | 27.0 | 12.5 | |
| Penicillins | 2.0 | 2.5 | 1.2 | 0.8 | 4.9 | 4.9 | 3.0 | 2.9 | 3.7 | |
| Streptogramins | < 0.1 | < 0.1 | < 0.1 | 2.6 | 0.8 | 1.3 | 9.0 | 0.4 | 1.6 | |
| III | Aminogylcosides | 0.2 | 0.1 | 0.4 | 0.0 | 0.0 | 0.6 | 0.4 | 0.0 | 0.0 |
| Bacitracins | 0.0 | 0.8 | 0.0 | 0.0 | 0.8 | 0.0 | 0.0 | 0.0 | 0.0 | |
| Pleuromutilins | < 0.1 | 1.7 | 1.8 | 2.1 | 3.2 | 6.0 | 4.7 | 1.9 | 1.5 | |
| Sulfonamides | 3.3 | 0.8 | 0.9 | 0.5 | 2.3 | 2.7 | 2.7 | 3.5 | 7.3 | |
| Tetracyclines | 87.5 | 73.0 | 83.6 | 83.1 | 66.3 | 84.7 | 97.0 | 51.6 | 44.9 | |
| IV | Flavophospholipids | 0.1 | 0.1 | < 0.1 | 0.1 | < 0.1 | < 0.1 | 0.1 | 0.2 | 0.2 |
| Total | no data | 157.1 | 142.9 | 157.2 | 155.7 | 146.4 | 164.6 | 176.3 | 115.5 | 104.3 |
Figure 11. Temporal trends in nDDDvetCA/1000 pig-days at risk in grower-finisher pigs, 2009 to 2017
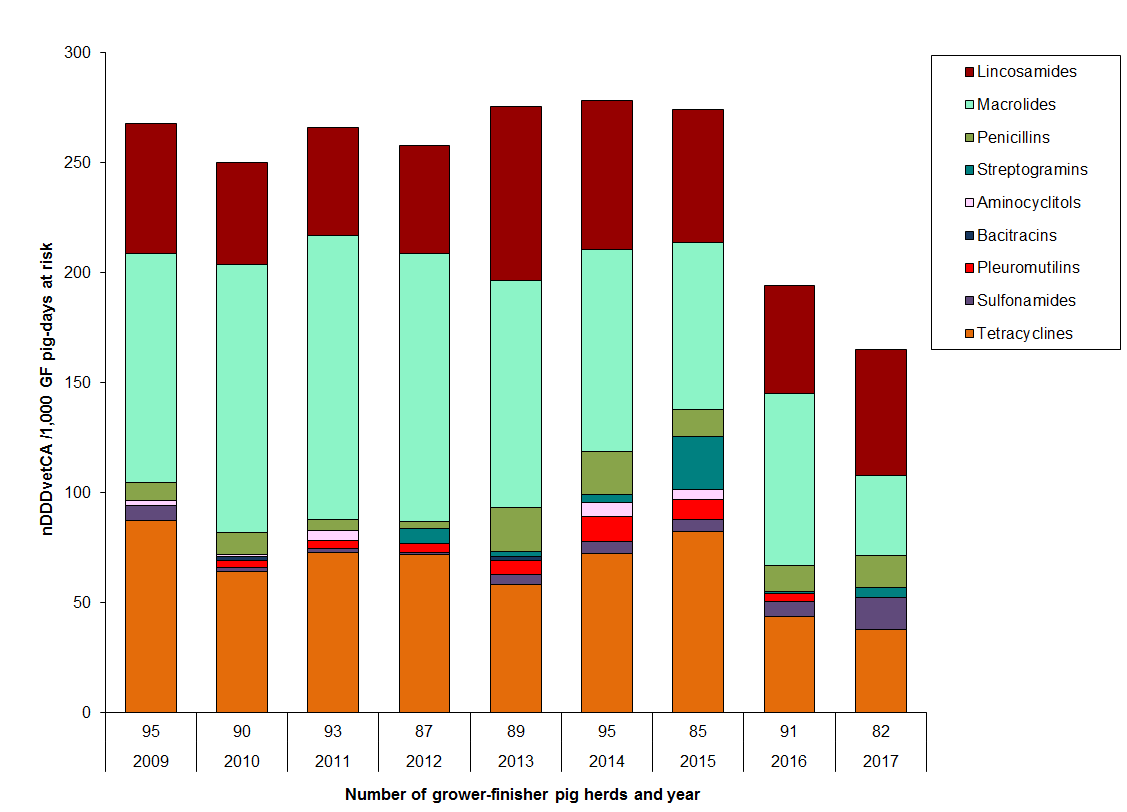
Figure 11 - Text Description
| Year | 2009 | 2010 | 2011 | 2012 | 2013 | 2014 | 2015 | 2016 | 2017 | |
|---|---|---|---|---|---|---|---|---|---|---|
| Number of herds | 95 | 90 | 93 | 87 | 89 | 95 | 85 | 91 | 82 | |
| Antimicrobial | ||||||||||
| II | Lincosamides | 59 | 47 | 49 | 49 | 79 | 68 | 60 | 49 | 57 |
| Macrolides | 104 | 122 | 129 | 122 | 103 | 92 | 76 | 78 | 37 | |
| Penicillins | 8 | 10 | 5 | 3 | 20 | 20 | 12 | 11 | 15 | |
| Streptogramins | 0.1 | 0.1 | 0.3 | 7 | 2 | 4 | 24 | 1 | 4 | |
| III | Aminocyclitols | 2 | 1 | 4 | 0 | 0 | 6 | 4 | 0 | 0 |
| Bacitracins | 0 | 2 | 0 | 0 | 2 | 0 | 0 | 0 | 0 | |
| Pleuromutilins | 0.1 | 3 | 4 | 4 | 6 | 11 | 9 | 4 | 0 | |
| Sulfonamides | 7 | 2 | 2 | 1 | 5 | 5 | 5 | 7 | 15 | |
| Tetracyclines | 87 | 64 | 73 | 72 | 58 | 72 | 82 | 44 | 38 | |
| Total | 268 | 250 | 266 | 258 | 276 | 278 | 274 | 194 | 168 | |
Turkeys
The overall reported antimicrobial use in turkeys was much lower than for broiler chickens and grower-finisher pigs in 2017.
When we accounted for the number and weight of turkeys, the top reported antimicrobials were:
- Bacitracins
- Streptogramins
- Trimethoprim and sulfonamides
When we accounted for the number of doses, the top reported antimicrobials were:
- Streptogramins
- Bacitracins
- Trimethoprim and sulfonamides
Figure 12. Temporal trends in mg/PCU in turkeys in Canada, 2016 to 2017
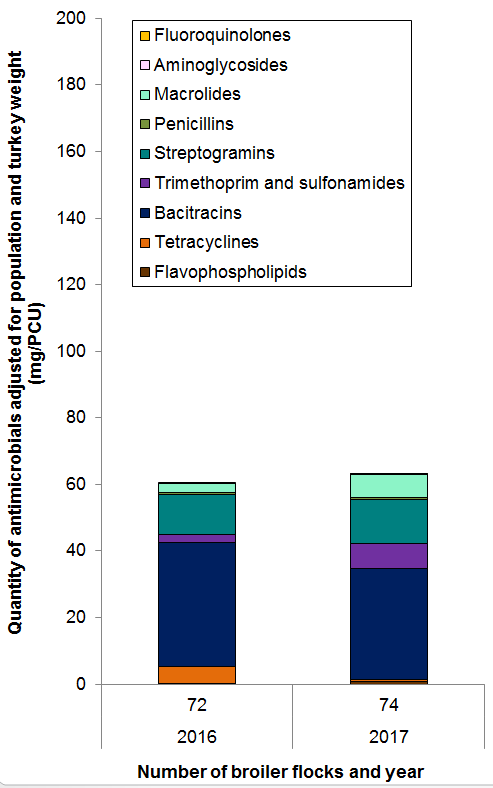
Figure 12 - Text Description
| Year | 2016 | 2017 |
|---|---|---|
| Number of flocks | 72 | 74 |
| Antimicrobial class | ||
| Flavophospholipids | 0 | 1 |
| Tetracyclines | 5 | 1 |
| Bacitracins | 37 | 33 |
| Trimethoprim and sulfonamides | 2 | 8 |
| Streptogramins | 12 | 13 |
| Penicillins | 1 | 1 |
| Macrolides | 3 | 7 |
| Aminoglycosides | 0.4 | 0.2 |
| Fluoroquinolones | 0 | 0 |
| Total | 60.6 | 63.1 |
Figure 13. Temporal trends in nDDDvetCA/1000 turkey-days at risk in turkeys, 2016 to 2017
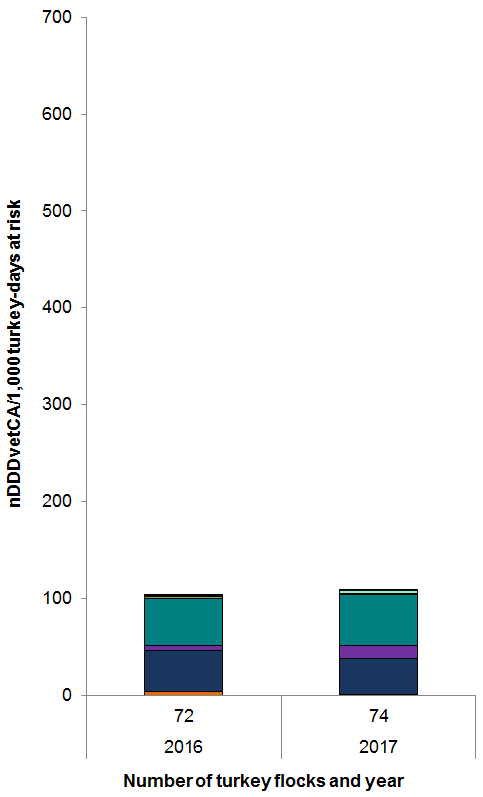
Figure 13 - Text Description
| Year | 2016 | 2017 |
|---|---|---|
| Number of flocks | 72 | 74 |
| Antimicrobial class | ||
| Tetracyclines | 4 | 0 |
| Bacitracins | 43 | 38 |
| Trimethoprim and sulfonamides | 5 | 13 |
| Streptogramins | 48 | 52 |
| Penicillins | 2 | 1 |
| Macrolides | 1 | 3 |
| Aminoglycosides | 0 | 0 |
| Fluoroquinolones | 1 | 0 |
| Total | 103 | 108 |
Reasons for antimicrobial use
- In broiler chickens, turkeys and grower-finisher pigs, the predominant reason for administering antimicrobials in 2017 was for disease prevention
- In 2017, the overall reported antimicrobial use in broiler chickens and grower- finisher pigs declined
Figure 14. Quantity of antimicrobials used (mg/PCU) by reason for use; CIPARS Farm 2013 to 2017
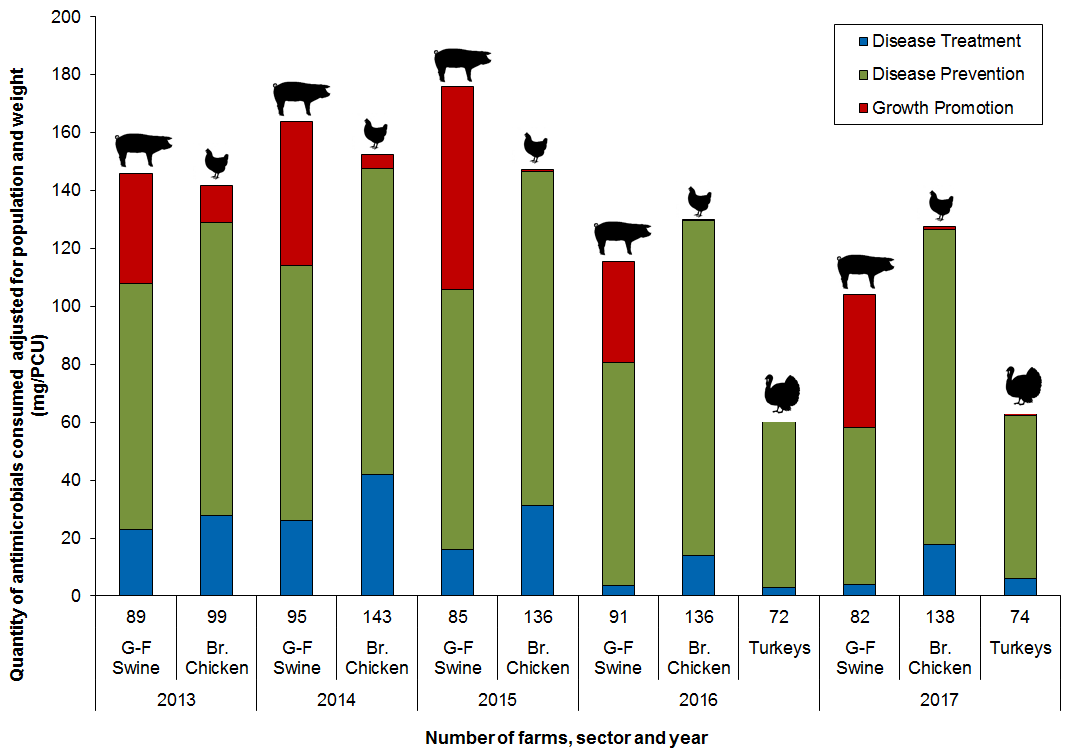
Figure 14 - Text Description
| Year | 2013 | 2014 | 2015 | 2016 | 2017 | |||||||
|---|---|---|---|---|---|---|---|---|---|---|---|---|
| Sector | G-F Swine | Br. Chicken | G-F Swine | Br. Chicken | G-F Swine | Br. Chicken | G-F Swine | Br. Chicken | Turkeys | G-F Swine | Br. Chicken | Turkeys |
| Number of Farms | 89 | 99 | 95 | 143 | 85 | 136 | 91 | 136 | 72 | 82 | 138 | 74 |
| Disease Treatment | 23 | 28 | 26 | 42 | 16 | 31 | 4 | 14 | 3 | 4 | 18 | 6 |
| Disease Prevention | 85 | 101 | 88 | 106 | 90 | 115 | 77 | 116 | 58 | 54 | 109 | 56 |
| Growth Promotion | 38 | 13 | 50 | 5 | 70 | 1 | 35 | 0 | 0 | 46 | 1 | 1 |
| Total | 146 | 142 | 164 | 152 | 176 | 147 | 116 | 130 | 61 | 104 | 127 | 63 |
Swine data are for antimicrobial use in feed only; chicken and turkey data include all routes of administration.
Integrated antimicrobial resistance data
In this section, we highlight 2 resistance stories: highly drug resistant Salmonella and fluoroquinolone-resistant Campylobacter.
The number of highly drug resistant isolates are increasing
- In 2017, CIPARS tested for resistance to 7 antimicrobial classes
- While there is no international standard defining highly resistant isolates, CIPARS considers isolates which have resistance to 6 or more classes of antimicrobials to be highly drug resistant
Highly drug resistant Salmonella
- Between 2008 and 2016, there was a substantial increase in the number of highly resistant Salmonella isolates from agri-food and human sources; however, there was a decrease in 2017
- In 2017, 76 Salmonella isolates were identified as highly drug resistant from the following sources:
Cattle
- Sick cattle (clinical isolates)
- Most of these have been S. Dublin and S. Typhimurium
Swine
- Healthy pigs (farm and abattoir isolates)
- Sick pigs (clinical isolates)
Human
- All clinical isolates
- Some isolates demonstrate resistance to all 7 classes of antimicrobials
Figure 15. Number of Salmonella isolates resistant to 6 or more antimicrobial classes from 2008 to 2017
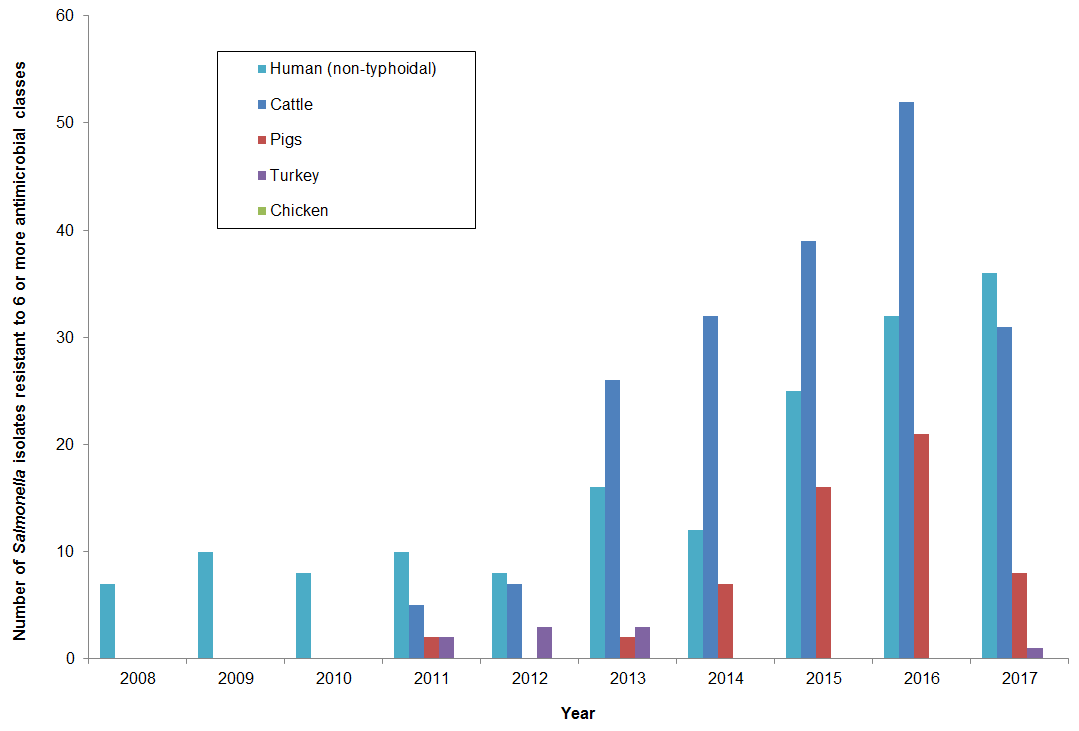
Figure 15 - Text Description
| Year | Cattle | Pigs | Chicken | Turkey | Human (non-typhoidal) |
|---|---|---|---|---|---|
| 2008 | 0 | 0 | 0 | 0 | 7 |
| 2009 | 0 | 0 | 0 | 0 | 10 |
| 2010 | 0 | 0 | 0 | 0 | 8 |
| 2011 | 5 | 2 | 0 | 2 | 10 |
| 2012 | 7 | 0 | 0 | 3 | 8 |
| 2013 | 26 | 2 | 0 | 3 | 16 |
| 2014 | 32 | 7 | 0 | 0 | 12 |
| 2015 | 39 | 16 | 0 | 0 | 25 |
| 2016 | 52 | 21 | 0 | 0 | 32 |
| 2017 | 31 | 8 | 0 | 1 | 36 |
- In E. coli, one important difference is that highly resistant E. coli isolates were detected from chickens, in addition to other host species.
Fluoroquinolone resistance in Campylobacter
- Resistance to ciprofloxacin in Campylobacter from chicken(s) continued to vary over time and across regions, although the highest proportion of resistant isolates across all surveillance components continued to be from British Columbia
- Resistance to ciprofloxacin was more commonly identified in human isolates from British Columbia compared to Alberta and Ontario
- Despite the different trends in resistance to ciprofloxacin among Campylobacter isolates from different surveillance components and regions, there has been no reported fluoroquinolone use on sentinel broiler chicken farms since 2013
Figure 16. Ciprofloxacin resistance in Campylobacter isolates from chicken over time and between regions; CIPARS 2011 to 2017
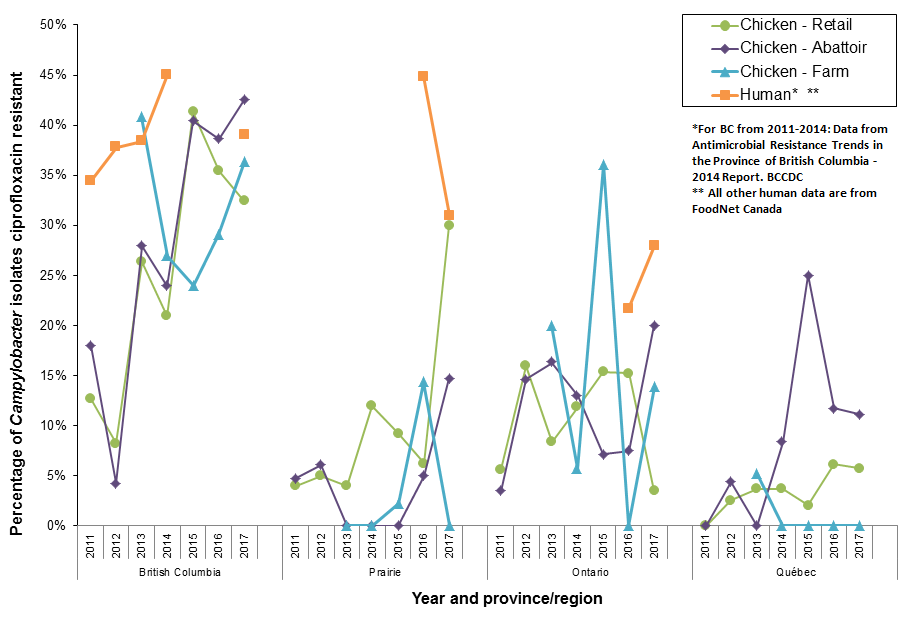
Figure 16 - Text Description
| Population | Province | Number of Isolates | Year | % |
|---|---|---|---|---|
| Retail Chicken | British Columbia | 71 | 2011 | 13% |
| 73 | 2012 | 8% | ||
| 57 | 2013 | 26% | ||
| 43 | 2014 | 21% | ||
| 46 | 2015 | 41% | ||
| 65 | 2016 | 35% | ||
| 74 | 2017 | 32% | ||
| Abattoir Chicken | 39 | 2011 | 18% | |
| 47 | 2012 | 4% | ||
| 43 | 2013 | 28% | ||
| 46 | 2014 | 24% | ||
| 52 | 2015 | 40% | ||
| 44 | 2016 | 39% | ||
| 47 | 2017 | 43% | ||
| Farm Chicken | 27 | 2013 | 41% | |
| 26 | 2014 | 27% | ||
| 25 | 2015 | 24% | ||
| 31 | 2016 | 29% | ||
| 44 | 2017 | 36% | ||
| HumanTable 16 footnote *,Table 16 footnote ** | 222 | 2011 | 34% | |
| 276 | 2012 | 38% | ||
| 232 | 2013 | 38% | ||
| 222 | 2014 | 45% | ||
| Not applicable | 2015 | Not applicable | ||
| Not applicable | 2016 | Not applicable | ||
| 28 | 2017 | 39% |
| Population | Province | Number of Isolates | Year | % |
|---|---|---|---|---|
| Retail Chicken | Prairies | 25 | 2011 | 4% |
| 40 | 2012 | 5% | ||
| 25 | 2013 | 4% | ||
| 67 | 2014 | 12% | ||
| 65 | 2015 | 9% | ||
| 16 | 2016 | 6% | ||
| 10 | 2017 | 30% | ||
| Abattoir Chicken | 21 | 2011 | 5% | |
| 33 | 2012 | 6% | ||
| 21 | 2013 | 0% | ||
| 36 | 2014 | 0% | ||
| 24 | 2015 | 0% | ||
| 20 | 2016 | 5% | ||
| 34 | 2017 | 15% | ||
| Farm Chicken | 15 | 2013 | 0% | |
| 11 | 2014 | 0% | ||
| 46 | 2015 | 2% | ||
| 28 | 2016 | 14% | ||
| 30 | 2017 | 0% | ||
| HumanTable 16 footnote *,Table 16 footnote ** | not applicable | 2011 | not applicable | |
| not applicable | 2012 | not applicable | ||
| not applicable | 2013 | not applicable | ||
| not applicable | 2014 | not applicable | ||
| not applicable | 2015 | not applicable | ||
| 29 | 2016 | 45% | ||
| 69 | 2017 | 31% |
| Population | Province | Number of Isolates | Year | % |
|---|---|---|---|---|
| Retail Chicken | Ontario | 71 | 2011 | 6% |
| 88 | 2012 | 16% | ||
| 84 | 2013 | 8% | ||
| 76 | 2014 | 12% | ||
| 39 | 2015 | 15% | ||
| 46 | 2016 | 15% | ||
| 29 | 2017 | 3% | ||
| Abattoir Chicken | 29 | 2011 | 3% | |
| 41 | 2012 | 15% | ||
| 43 | 2013 | 16% | ||
| 62 | 2014 | 13% | ||
| 42 | 2015 | 7% | ||
| 67 | 2016 | 7% | ||
| 40 | 2017 | 20% | ||
| Farm Chicken | 20 | 2013 | 20% | |
| 35 | 2014 | 6% | ||
| 36 | 2015 | 36% | ||
| 26 | 2016 | 0% | ||
| 36 | 2017 | 14% | ||
| HumanTable 16 footnote *,Table 16 footnote ** | not applicable | 2011 | not applicable | |
| not applicable | 2012 | not applicable | ||
| not applicable | 2013 | not applicable | ||
| not applicable | 2014 | not applicable | ||
| not applicable | 2015 | not applicable | ||
| 106 | 2016 | 22% | ||
| 18 | 2017 | 28% |
| Population | Province | Number of Isolates | Year | % |
|---|---|---|---|---|
| Retail Chicken | Québec | 57 | 2011 | 0% |
| 79 | 2012 | 3% | ||
| 58 | 2013 | 4% | ||
| 54 | 2014 | 4% | ||
| 49 | 2015 | 2% | ||
| 49 | 2016 | 6% | ||
| 52 | 2017 | 6% | ||
| Abattoir Chicken | 9 | 2011 | 0% | |
| 23 | 2012 | 4% | ||
| 11 | 2013 | 0% | ||
| 12 | 2014 | 8% | ||
| 8 | 2015 | 25% | ||
| 17 | 2016 | 12% | ||
| 9 | 2017 | 11% | ||
| Farm Chicken | 19 | 2013 | 5% | |
| 21 | 2014 | 0% | ||
| 10 | 2015 | 0% | ||
| 8 | 2016 | 0% | ||
| 12 | 2017 | 0% | ||
| HumanTable 16 footnote *,Table 16 footnote ** | not applicable | 2011 | not applicable | |
| not applicable | 2012 | not applicable | ||
| not applicable | 2013 | not applicable | ||
| not applicable | 2014 | not applicable | ||
| not applicable | 2015 | not applicable | ||
| not applicable | 2016 | not applicable | ||
| not applicable | 2017 | not applicable |
Integrated antimicrobial use and resistance data
Ceftriaxone resistance in non-typhoidal Salmonella and generic E. coli
Ceftriaxone is a Category I antimicrobial (very high importance to human medicine) that is used to treat a variety of human infections. They are the preferred option for the treatment of serious, potentially life-threatening human infections.
Although ceftriaxone is not used in animals, a similar drug (ceftiofur) is used to treat a range of animal infections. In most situations, if an organism is resistant to one of these drugs, it will also be resistant to the other.
Because Category I antimicrobials are those considered most important to human health, the poultry industry took steps to reduce their use. In mid-2014, the poultry industry implemented a national ban on the use of Category I antimicrobials for disease prevention purposes.
Subsequent data have shown no reported use of ceftiofur in sentinel broiler chicken flocks since 2015 as well as reduced resistance in both E. coli and Salmonella from chickens and chicken meat.
- Most ceftriaxone resistance in humans has been observed in isolates of Salmonella Heidelberg. Resistance to ceftriaxone in Salmonella Heidelberg isolates from humans decreased from 15% in 2016 to 12% in 2017
- We are seeing similar declines in ceftriaxone resistance in isolates from chicken at abattoir and on farm, and similar trends in ceftriaxone resistance in E. coli isolates
Figure 17. Reduction in reported use of ceftiofur on farm and changing resistance to ceftriaxone in non-typhoidal Salmonella and E. coli from humans and chicken sources between 2013 and 2017
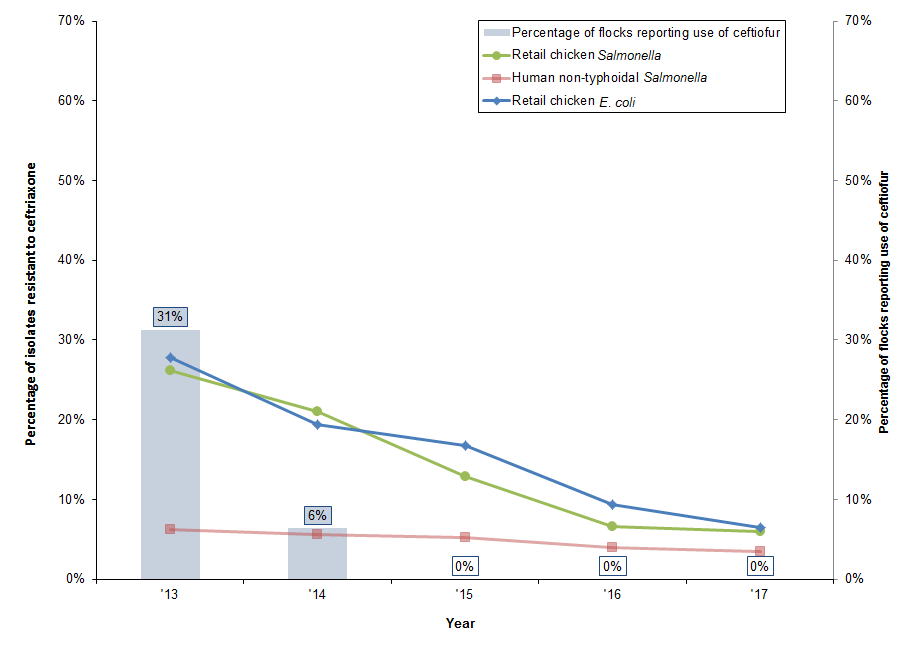
Figure 17 - Text Description
| Year | 2013 | 2014 | 2015 | 2016 | 2017 |
|---|---|---|---|---|---|
| Component | Isolates resistant to ceftriaxone | ||||
| Retail chicken Salmonella | 26% | 21% | 13% | 7% | 6% |
| Human non-typhoidal Salmonella | 6% | 6% | 5% | 4% | 4% |
| Retail chicken E. coli | 28% | 19% | 17% | 9% | 6% |
| Percentage of flocks reporting the use of ceftiofur | |||||
| Broiler chicken flocks on farm | 31% | 6% | 0% | 0% | 0% |
The reduction in use of ceftiofur and associated reduction in ceftriaxone resistance in chickens and humans is a good example of a successful intervention to limit antimicrobial resistance that CIPARS continues to follow.
Glossary
| Antimicrobial class | Antimicrobials are grouped into the same class if they have a common chemical structure and method to kill or stop the growth of bacteria. CIPARS uses the Clinical and Laboratory Standards Institute to define antimicrobial class. |
| Biomass and Population Correction Unit (PCU) | The PCU accounts for the size of the population, including the number and weight (biomass) of animals or people in the population. CIPARS adjusts (or corrects) for the "size" of populations to interpret antimicrobial use, consumption or sales data using methods reported by the European Surveillance of Veterinary Antimicrobial Consumption. |
| DDDvet | This is an acronym for the "Defined Daily Dose for animals". The amount of antimicrobials given during a treatment (dose) will vary depending on the antimicrobial, how the antimicrobial is given (e.g. by injection, through water or feed) and the population treated (cattle, chickens, pigs). CIPARS uses this metric to adjust for this variation and help interpret antimicrobial use data. |
| mg/PCU | An antimicrobial use metric that adjusts the quantity (milligram/mg) of antimicrobial used, consumed or distributed by the size of the population. |
| nDDDvet/1000 animal-days | An antimicrobial use metric that adjusts for both variation in the amount of antimicrobial given during a treatment (DDDvet), and the length of time that an animal or group of animals are treated to help interpret antimicrobial use data. |
CIPARS will continue to monitor and communicate the impact of changing antimicrobial use practices on the occurrence of antimicrobial resistance to preserve the effectiveness of antimicrobials in animals and humans.
CIPARS analysts are working to develop new ways of identifying emerging issues and integrating data across various host species, bacterial species, and across regions.