
Audit of Employment Equity Representation in Acting Appointments
Table of Contents
- Executive summary
- Introduction
- Acting appointments in the federal public service
- Focus of the audit
- Audit objectives and approach
- Representation of employment equity groups in acting appointments
- Measures in place to promote access to appointments for employment equity groups
- Considering employment equity in acting appointments
- Conclusion
- Recommendations
- Moving forward: the Public Service Commission of Canada’s response
- Annex A: About the audit
- Annex B: Representation of employment equity groups in acting appointments by occupational category
- Annex C: Representation of visible minority sub-groups in acting appointments by occupational category
Executive summary
About the audit
This audit was undertaken to examine trends in the representation of designated employment equity groups in acting federal public service appointments as well as organizational staffing practices related to employment equity.
The audit had 3 objectives and activities:
- To determine whether the 4 designated employment equity groups are proportionately represented in acting appointments
- We conducted a system-wide data analysis of 106 148 acting appointments between 2011 and 2021, covering all departments and agencies subject to the Public Service Employment Act.
- To determine what systems and practices departments and agencies have in place to promote access to appointments for employment equity groups
- We conducted a review of practices and documentation that promote access to all types of appointments for employment equity groups in effect from April 2020 to March 2021 in 14 selected departments and agencies.
- To determine the extent to which hiring managers consider employment equity when making acting appointments
- We conducted a review of a random sample of 350 acting appointments made between April 1, 2020, and March 31, 2021, by these same 14 departments and agencies.
Main findings
The audit found that, between 2011 and 2021, representation in acting appointments for 3 of the 4 employment equity groups was on par with or exceeded their representation in the federal public service.
While results related to the representation of women, Indigenous Peoples and members of visible minorities in acting appointments indicate that these groups obtained a share of acting appointments that was on par with or exceeded their representation in the federal public service, employees with disabilities were consistently underrepresented in acting appointments. Having said this, the audit findings pointed to improved results for all 4 employment equity groups over time. Our analysis by occupational category showed that all 4 groups were underrepresented in acting appointments in the Technical occupational category.
For the 4 largest sub-groups of members of visible minorities, representation in acting appointments of Black, South Asian/East Indian and Non-White West Asian/North African/Arab employees was generally on par with or exceeded their representation in the public service. However, employees who self-identified as Chinese were underrepresented in acting appointments in 9 of the 10 years examined.
Our review of staffing practices looked at organizational measures that promoted access for employment equity groups. It showed that all 14 departments and agencies examined implemented a variety of measures to promote access to appointments for employment equity groups.
We reviewed 350 acting appointments in these 14 departments and agencies to determine whether sub-delegated managers considered employment equity groups when making acting appointments (for example, when a group is underrepresented in the organization). While employment equity consideration may have been present for all 350 acting appointments reviewed, we found documented evidence of this in one third of the acting appointments examined.
Based on the audit findings, the following 3 recommendations were identified:
Recommendation 1: Deputy heads should monitor acting appointments so that members of all employment equity groups are not disadvantaged, especially persons with disabilities and members of visible minorities sub-groups where gaps have been identified.
Recommendation 2: Deputy heads should implement measures to improve the representation of employment equity groups in acting appointments for positions in the Technical occupational category.
Recommendation 3: The PSC should share data on employment equity representation in acting appointments with departments and agencies to support deputy heads in identifying solutions and making appropriate changes for more inclusive staffing practices.
Introduction
- The Public Service Commission of Canada (PSC) is responsible for promoting and safeguarding a merit-based, representative and non-partisan federal public service. To fulfill its accountability to Parliament, the PSC undertakes oversight activities, such as audits, to assess the health and integrity of the staffing system.
- The PSC’s enabling legislation, the Public Service Employment Act, was amended in June 2021 to strengthen diversity and inclusion. The preamble of the act now includes an explicit commitment by the Government of Canada to an inclusive public service that reflects the diversity of Canada’s population. The amendments also provide explicit authorities related to identifying and mitigating biases and barriers in appointment processes that disadvantage equity-seeking groups.
- According to the Employment Equity Act, when delivering its mandate under the Public Service Employment Act, the PSC is responsible for identifying and eliminating employment barriers for the 4 designated employment equity groups: women, Aboriginal Peoples, persons with disabilities and members of visible minorities.
- In January 2021, the PSC published the results of the Audit of Employment Equity Representation in Recruitment, which focused on employment equity representation at key stages of external advertised appointment processes. The audit provided evidence of where barriers may exist in the recruitment process for members of designated employment equity groups.
- This is the PSC’s second audit looking at the representation of designated employment equity groups. The focus of this audit is on internal acting appointments.
Acting appointments in the federal public service
- The Public Service Employment Regulations define an acting appointment as ″the temporary performance of the duties of another position by an employee, if the performance of those duties would have constituted a promotion had they been appointed to the position.″ Although the length of an acting appointment is typically known at the onset, it can be extended based on operational needs of the organization. Anacting appointment of 4 months or more is subject to merit, meaning that those appointed must meet the established qualifications required for the work to be performed.
- Acting appointments allow managers to accommodate temporary vacancies, providing them with flexibility to address short-term human resources needs while ensuring continuity of operations. They also allow employees to gain work experience in various fields as they contribute to different projects. In this way, acting appointments represent developmental opportunities for employees and may help determine their readiness for promotion.
- From fiscal years 2011 to 2012 through to 2020 to 2021, there were 140 143 acting appointments of 4 months or more. They represented, on average, about 45% of all internal appointments under the Public Service Employment Act.
Focus of the audit
- Acting appointments provide employees with an opportunity to gain experience and develop new skills that may ultimately impact their career development and chances of promotion.
- A PSC statistical study on acting appointments and subsequent promotions in the federal public service, released in 2007, explored whether acting appointments provide employees with an advantage in terms of gaining a subsequent promotion. One of the key observations of the study was that employees who were offered acting appointments saw their chances of promotion increased. The study found that the rate of promotion within the first 4 months following the end of an acting appointment was estimated at 41.3%. The percentage over the same period for non-acting employees was about 6%.
- In preparation for this audit, we consulted key diversity and inclusion stakeholders. They shared their concerns about barriers that may exist for certain employment equity groups for acting opportunities. For stakeholders, acting appointments represent an important way to gain experience and to successfully compete in subsequent promotion opportunities.
- The audit was undertaken to examine the trends in the representation of employment equity groups in acting appointments as well as organizational practices related to employment equity considerations in staffing. Audit results identify areas where barriers may exist for certain groups of employees and where changes should be implemented to support inclusive staffing practices.
- The 2021 amendments to the Public Service Employment Act introduced a definition for equity-seeking groups, which comprises groups of persons who are disadvantaged on the basis of one or more of the 13 prohibited grounds of discrimination identified in the Canadian Human Rights Act. Equity-seeking groups include, in addition to a number of other groups, the 4 designated employment equity groups under the Employment Equity Act: women, Aboriginal peoples Footnote 1, persons with disabilities and members of visible minorities.
- Given the scope of the audit and limitations in available data for equity-seeking groups, the audit focused on the representation of the 4 designated employment equity groups. Where sufficient data existed to draw meaningful conclusions, the representation of certain visible minority sub-groups was also examined.
Audit objectives and approach
- The audit had 3 objectives and activities:
- Objective 1: To determine whether the 4 designated employment equity groups are proportionately represented in acting appointments
- We conducted a system-wide data analysis of 106 148 acting appointments between 2011 and 2021, covering all departments and agencies subject to the Public Service Employment Act to identify trends and gaps in representation.
- Objective 2: To determine what systems and practices departments and agencies have in place to promote access to appointments for employment equity groups
- We conducted a review of practices and documentation that promote access to all types of appointments for employment equity groups in effect from April 2020 to March 2021 in 14 selected departments and agencies.
- Objective 3: To determine the extent to which hiring managers consider employment equity when making acting appointments
- We conducted a review of a random sample of 350 acting appointments made between April 1, 2020, and March 31, 2021, by these same 14 departments and agencies.
- Objective 1: To determine whether the 4 designated employment equity groups are proportionately represented in acting appointments
- More information on the audit’s scope and methodology, as well as the list of participating departments and agencies, can be found in Annex A of this report.
Representation of employment equity groups in acting appointments
- The audit examined the gaps and trends in the representation of the 4 employment equity groups, including some visible minorities sub-groups, in acting appointments of 6 months or more to identify areas where systemic barriers may exist for employees pursuing acting appointment opportunities.
Representation overall
- To determine the representation overall, we compared employment equity groups’ representation in acting appointments of 6 months or more Footnote 2, from 2011 to 2021, to their representation in the federal public service overall during that same period. The 10-year period allows for the identification of trends in representation over time. This analysis included a total of 106 148 acting appointments.
Representation by occupational categories
- The analysis was further refined to employment equity groups’ representation in acting appointments of 6 months or more compared to their representation in the following 6 occupational categories that make up most of the public service workforce:
- Administrative and Foreign Service
- Administrative Support
- Executive
- Operational
- Scientific and Professional
- Technical
- This part of the analysis focused on 5 years of combined data (2016 to 2021) and included a total of 62 003 acting appointments. To serve as the basis for comparison, occupational category population included all employees whose substantive position was within that same occupational category. The Executive category was compared to the population of the Executive group plus pre-determined feeder groups to the Executive group from non-Executive classifications.
- It is important to note that gaps in representation ranging from +/- 0.1% to 0% or representing fewer than 5 acting appointments were considered too small to draw meaningful conclusions.
- The next section of this report presents results for each of the 4 employment equity groups: women, Indigenous Peoples, persons with disabilities and members of visible minorities. It also looks at 4 of the visible minorities sub-groups for which sufficient data was available. These include employees who self-identified as Black, Chinese, South Asian/East Indian, and Non-White West Asian/North African/Arabs.
Women
Representation overall
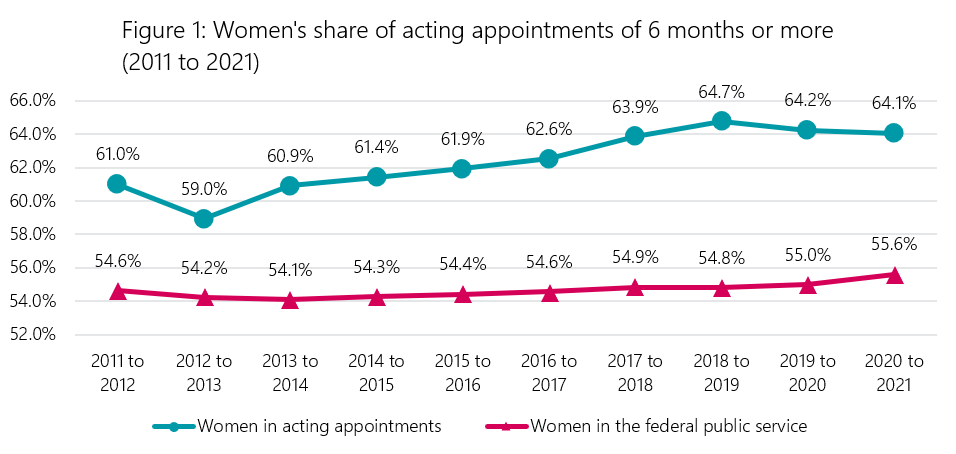
- Women’s representation in acting appointments exceeded their representation in the federal public service for every year of the 10-year period examined (2011 to 2021). As of the most recent data analyzed (2020 to 2021), women’s representation was 8.5 percentage points higher in acting appointments than their representation in the federal public service overall.
Text version
| Fiscal year | 2011 to 2012 | 2012 to 2013 | 2013 to 2014 | 2014 to 2015 | 2015 to 2016 | 2016 to 2017 | 2017 to 2018 | 2018 to 2019 | 2019 to 2020 | 2020 to 2021 |
|---|---|---|---|---|---|---|---|---|---|---|
| Women in acting appointments | 61.0% | 59.0% | 60.9% | 61.4% | 61.9% | 62.6% | 63.9% | 64.7% | 64.2% | 64.1% |
| Women in the federal public service | 54.6% | 54.2% | 54.1% | 54.3% | 54.4% | 54.6% | 54.9% | 54.8% | 55.0% | 55.6% |
Representation by occupational categories
- We noted that in 5 of the 6 occupational categories analyzed, women exceeded their representation in acting appointments when compared to their representation in those occupational categories. The Technical occupational category was the only category where women were underrepresented over the cumulative 5-year period observed (2016 to 2021). This means that in that specific category, women were appointed to fewer acting opportunities compared to their representation within this category.
- For more information on the representation of employment equity groups in acting appointments by occupational category, please refer to Annex B.
Intersectionality
- The audit examined the intersectionality between women and other employment equity groups to determine the impact of belonging to more than one group. Looking at intersectionality allows us to capture the unique experience of specific groups, such as Indigenous women, women who are members of visible minorities and women with disabilities. Our analysis showed that, from 2011 to 2021, the average proportion of each of these 3 intersectional groups in acting appointments of 6 months or more was on par with or exceeded their respective average proportion of the public service. These findings are consistent with the overall results observed for all women.
Indigenous Peoples
Representation overall
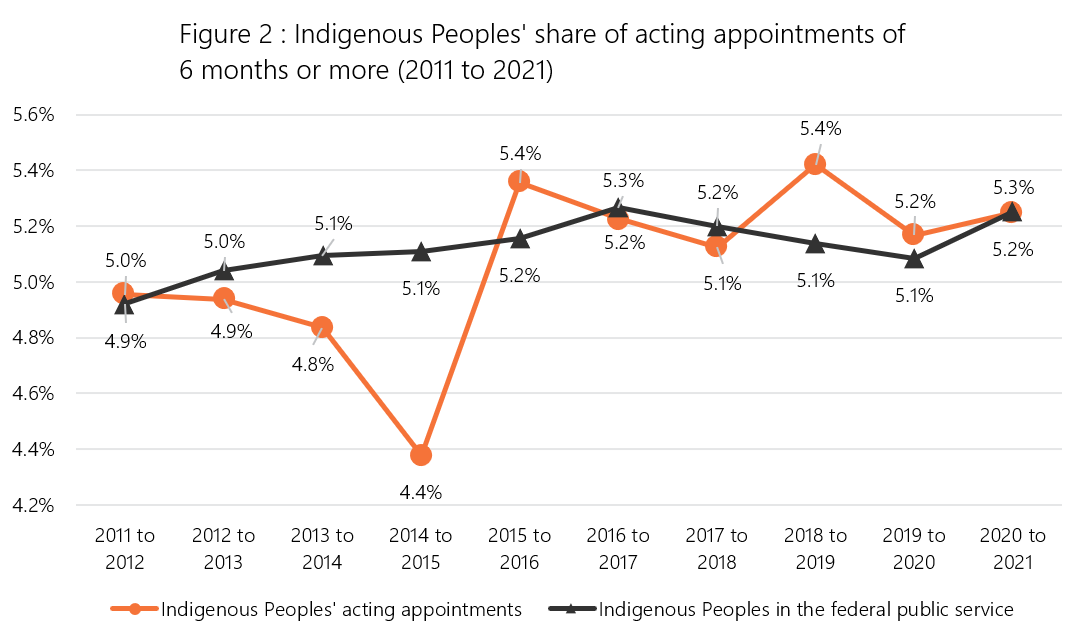
- Representation of Indigenous Peoples fluctuated over the 10 years. Since 2015 to 2016, Indigenous employees’ representation in acting appointments has generally been on par with their representation in the federal public service.
Text version
| Fiscal year | 2011 to 2012 | 2012 to 2013 | 2013 to 2014 | 2014 to 2015 | 2015 to 2016 | 2016 to 2017 | 2017 to 2018 | 2018 to 2019 | 2019 to 2020 | 2020 to 2021 |
|---|---|---|---|---|---|---|---|---|---|---|
| Indigenous Peoples’ acting appointments | 5.0% | 4.9% | 4.8% | 4.4% | 5.4% | 5.2% | 5.1% | 5.4% | 5.2% | 5.2% |
| Indigenous Peoples in the federal public service | 4.9% | 5.0% | 5.1% | 5.1% | 5.2% | 5.3% | 5.2% | 5.1% | 5.1% | 5.3% |
Representation by occupational categories
- The audit found that in 4 of the 6 occupational categories analyzed, Indigenous employees exceeded their representation in acting appointments when compared to their representation in those occupational categories. The Technical and the Administrative Support categories were the 2 categories in which Indigenous employees were underrepresented over the 5-year period. Their share of acting appointments was 1.4 percentage points lower in the Technical category, while it was 1.5 percentage points lower in the Administrative Support category.
Persons with disabilities
Representation overall
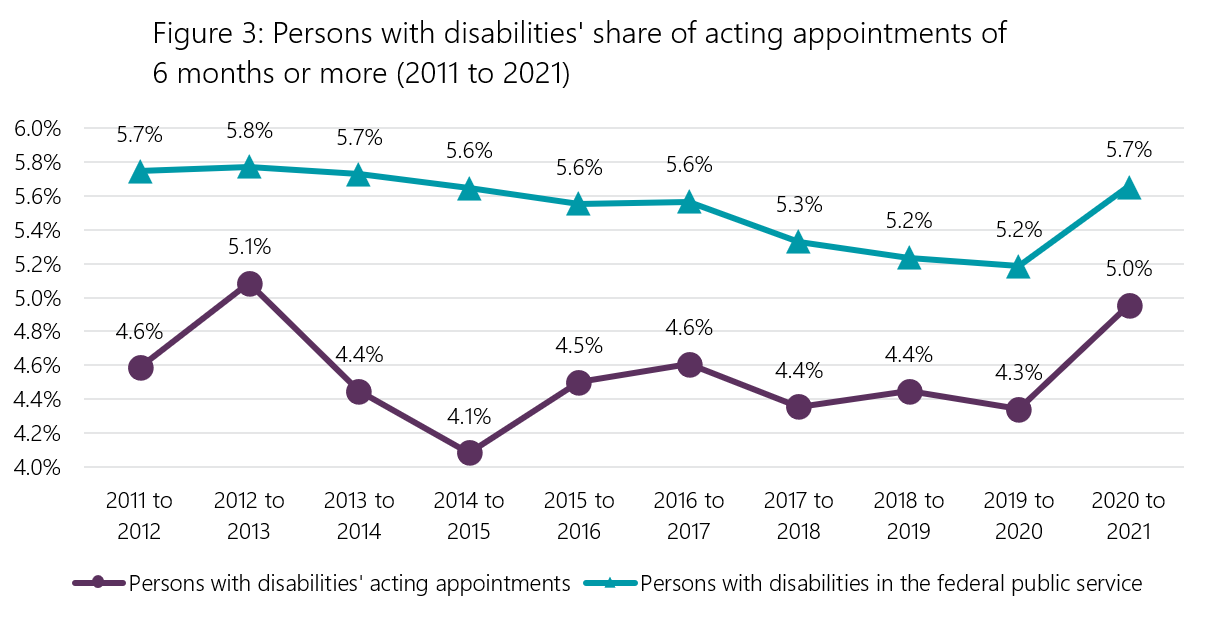
- Persons with disabilities experienced the most gaps in representation in acting appointments of all 4 employment equity groups. They were consistently underrepresented in acting appointments in comparison to their representation in the federal public service across all 10 years analyzed. As well, they experienced the largest gaps in representation of all the employment equity groups. This gap was as high as at 1.5 percentage points below their expected representation in acting appointments in 2014 to 2015. While their representation has been improving since then, as of the most recent data analyzed (2020 to 2021), there remained a 0.7 percentage point difference between employees with disabilities’ representation in acting appointments and their representation in the public service overall (5% compared to 5.7%). This 0.7 percentage point gap represents a shortfall of 114 acting appointments.
Text version
| Fiscal year | 2011 to 2012 | 2012 to 2013 | 2013 to 2014 | 2014 to 2015 | 2015 to 2016 | 2016 to 2017 | 2017 to 2018 | 2018 to 2019 | 2019 to 2020 | 2020 to 2021 |
|---|---|---|---|---|---|---|---|---|---|---|
| Persons with disabilities’ acting appointments | 4.6% | 5.1% | 4.4% | 4.1% | 4.5% | 4.6% | 4.4% | 4.4% | 4.3% | 5.0% |
| Persons with disabilities in the federal public service | 5.7% | 5.8% | 5.7% | 5.6% | 5.6% | 5.6% | 5.3% | 5.2% | 5.2% | 5.7% |
Representation by occupational categories
- The data show that persons with disabilities’ representation in acting appointments was lower than their representation in 5 of the 6 occupational categories analyzed. The largest gap was in the Executive category where their representation in acting appointments was 1.8 percentage points lower than their representation within this category (3.6% compared to 5.4%).
- The audit findings show that more targeted efforts are needed to address these trends and eliminate barriers to the full participation of persons with disabilities in the workplace. Access to development opportunities, such as acting appointments, is key to the career progression of persons with disabilities.
Members of visible minorities
Representation overall
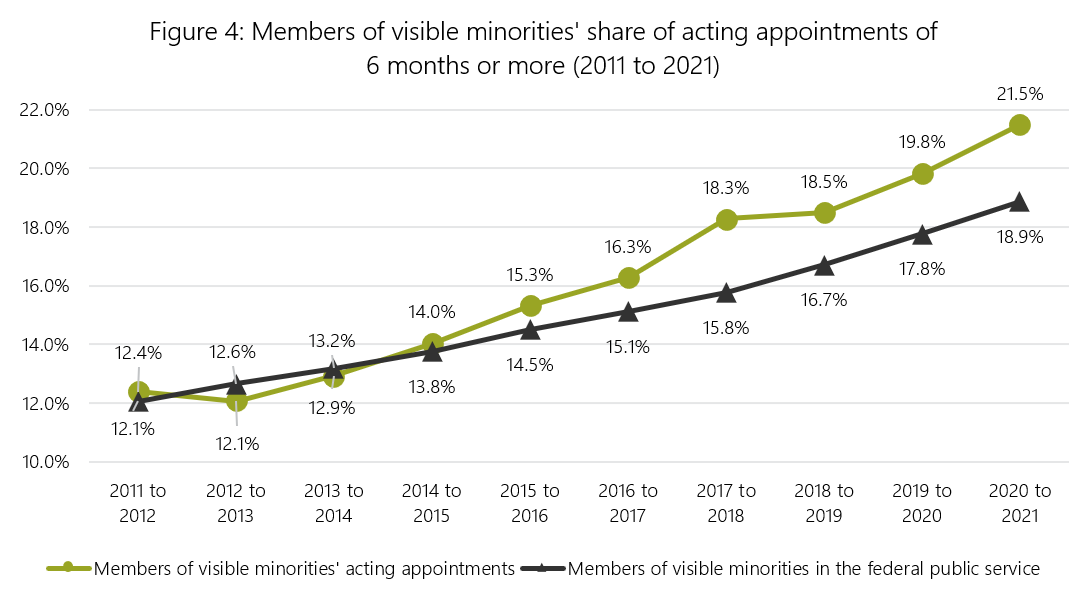
- The representation of members of visible minorities in acting appointments has been improving since 2014 to 2015, consistently surpassing their representation in the overall public service population. As of the most recent data analyzed (2020 to 2021), visible minorities’ representation was 2.6 percentage points higher than their representation in the federal public service overall (21.5% compared to 18.9%).
Text version
| Fiscal year | 2011 to 2012 | 2012 to 2013 | 2013 to 2014 | 2014 to 2015 | 2015 to 2016 | 2016 to 2017 | 2017 to 2018 | 2018 to 2019 | 2019 to 2020 | 2020 to 2021 |
|---|---|---|---|---|---|---|---|---|---|---|
| Members of visible minorities’ acting appointments | 12.4% | 12.1% | 12.9% | 14.0% | 15.3% | 16.3% | 18.3% | 18.5% | 19.8% | 21.5% |
| Members of visible minorities in the federal public service | 12.1% | 12.6% | 13.2% | 13.8% | 14.5% | 15.1% | 15.8% | 16.7% | 17.8% | 18.9% |
Representation by occupational categories
- We noted that members of visible minorities exceeded their representation in acting appointments in 4 of the 6 occupational categories analyzed. However, they experienced a 2.4 percentage points underrepresentation in the Technical category, and a 0.3 percentage point underrepresentation in the Executive category.
Visible minorities sub-groups
- We examined the representation of the 4 largest sub-groups of visible minorities. These included employees who self-identified as Black, Chinese, South Asian/East Indian, and Non-White West Asian/North African/Arab.
Representation overall
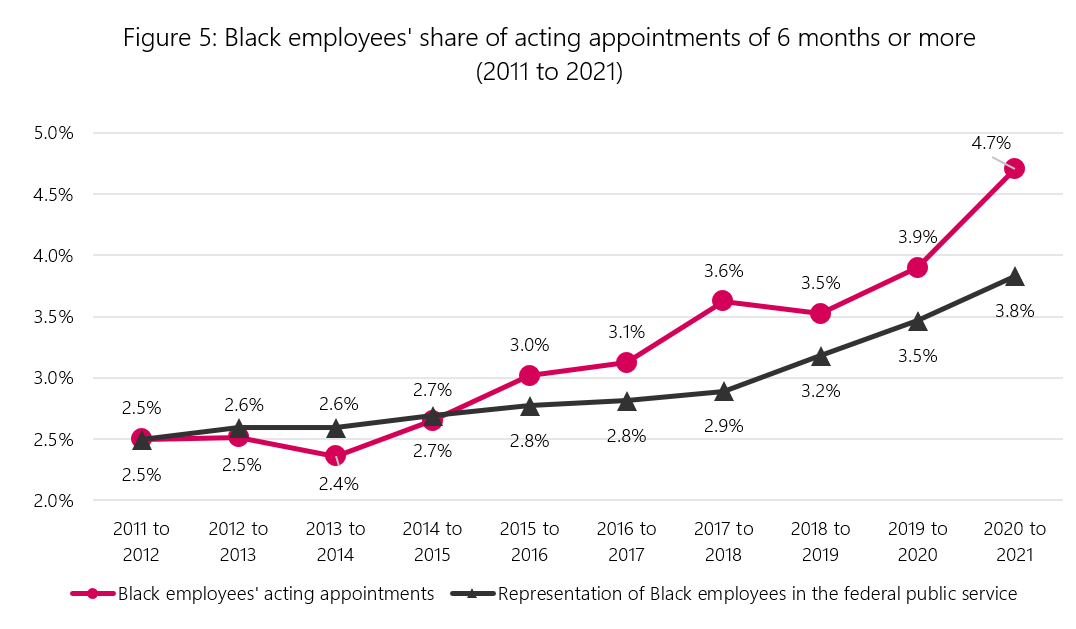
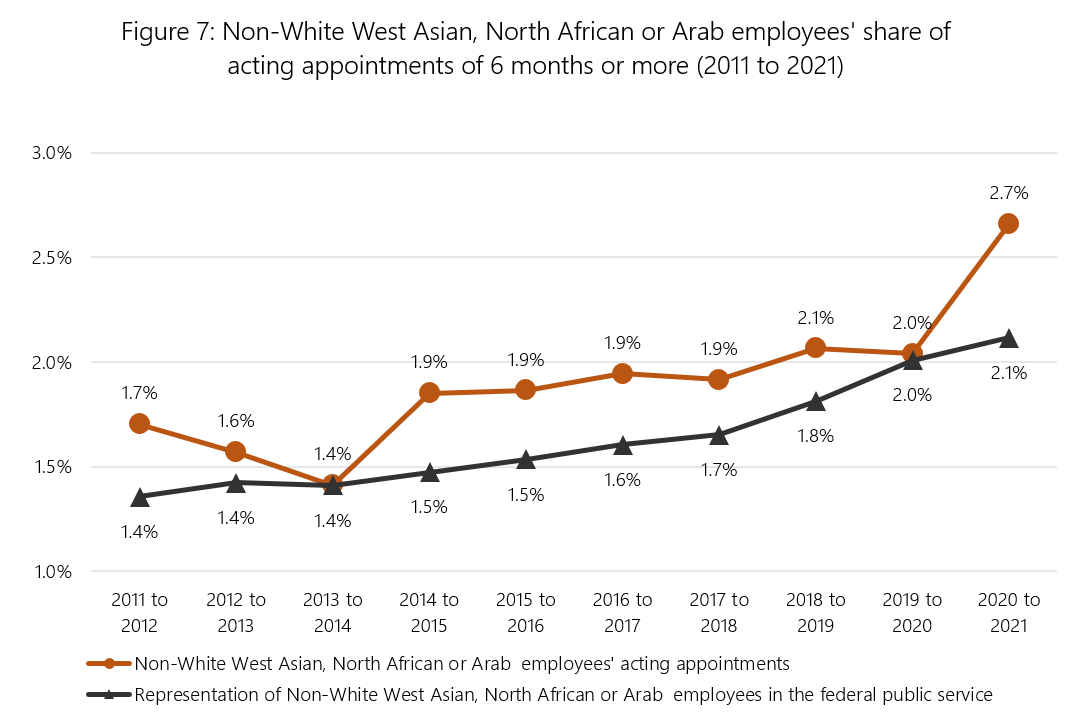
- Between 2011 and 2021, representation of Black, South Asian/East Indian and Non-White West Asian/North African/Arab employees was generally on par with or exceeded their representation in the federal public service overall. Specifically for Black and South Asian/East Indian employees, an increase in representation has been noted in the most recent years analyzed. As of 2020 to 2021, their representation in acting appointments exceeded their population representation share. That same year, for example, Black employees received 141 more acting appointments than their representation share in the federal public service. Contrary to these sub-groups, employees who self-identified as Chinese were underrepresented in acting appointments in 9 of the 10 years analyzed. For example, in 2018 to 2019, the 0.5 percentage point gap between their representation in the federal public service and their share of acting appointments represented 63 acting appointments.
Text version
| Fiscal year | 2011 to 2012 | 2012 to 2013 | 2013 to 2014 | 2014 to 2015 | 2015 to 2016 | 2016 to 2017 | 2017 to 2018 | 2018 to 2019 | 2019 to 2020 | 2020 to 2021 |
|---|---|---|---|---|---|---|---|---|---|---|
| Black employees’ acting appointments | 2.5% | 2.5% | 2.4% | 2.7% | 3.0% | 3.1% | 3.6% | 3.5% | 3.9% | 4.7% |
| Representation of Black employees in the federal public service | 2.5% | 2.6% | 2.6% | 2.7% | 2.8% | 2.8% | 2.9% | 3.2% | 3.5% | 3.8% |
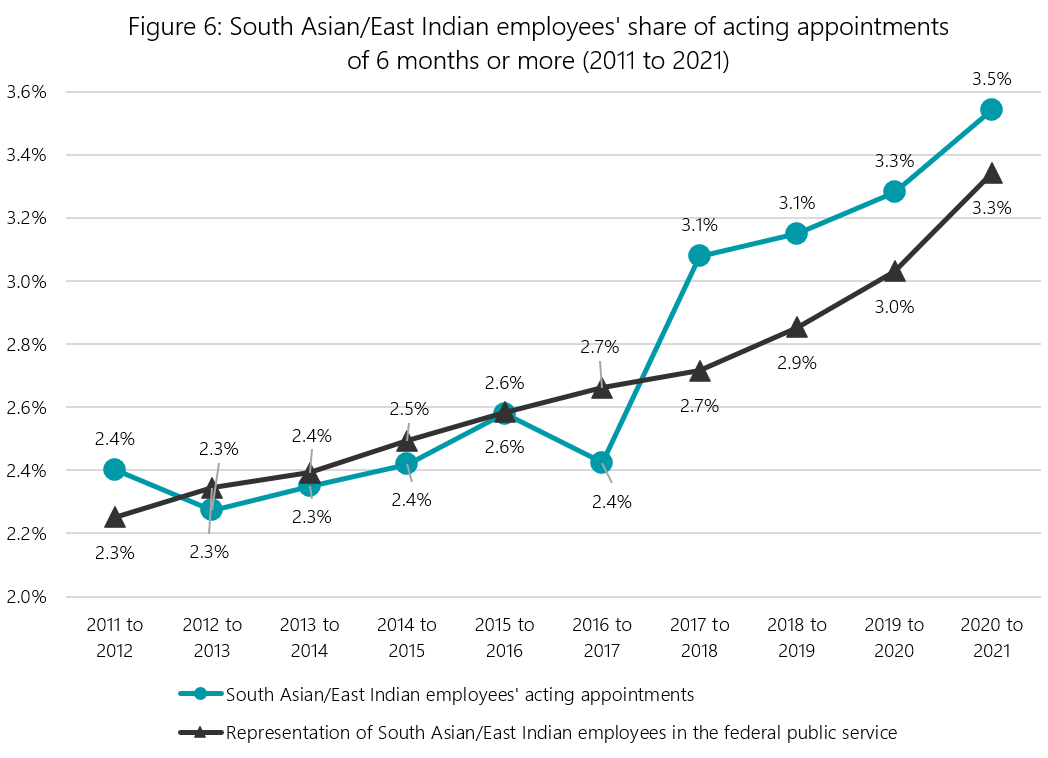
Text version
| Fiscal year | 2011 to 2012 | 2012 to 2013 | 2013 to 2014 | 2014 to 2015 | 2015 to 2016 | 2016 to 2017 | 2017 to 2018 | 2018 to 2019 | 2019 to 2020 | 2020 to 2021 |
|---|---|---|---|---|---|---|---|---|---|---|
| South Asian/East Indian employees’ acting appointments | 2.4% | 2.3% | 2.3% | 2.4% | 2.6% | 2.4% | 3.1% | 3.1% | 3.3% | 3.5% |
| Representation of South Asian/East Indian employees in the federal public service | 2.3% | 2.3% | 2.4% | 2.5% | 2.6% | 2.7% | 2.7% | 2.9% | 3.0% | 3.3% |
Text version
| Fiscal year | 2011 to 2012 | 2012 to 2013 | 2013 to 2014 | 2014 to 2015 | 2015 to 2016 | 2016 to 2017 | 2017 to 2018 | 2018 to 2019 | 2019 to 2020 | 2020 to 2021 |
|---|---|---|---|---|---|---|---|---|---|---|
| Non-White West Asian, North African, or Arab employees’ acting appointments | 1.7% | 1.6% | 1.4% | 1.9% | 1.9% | 1.9% | 1.9% | 2.1% | 2.0% | 2.7% |
| Representation of Non-White West Asian, North African, or Arab employees in the federal public service | 1.4% | 1.4% | 1.4% | 1.5% | 1.5% | 1.6% | 1.7% | 1.8% | 2.0% | 2.1% |
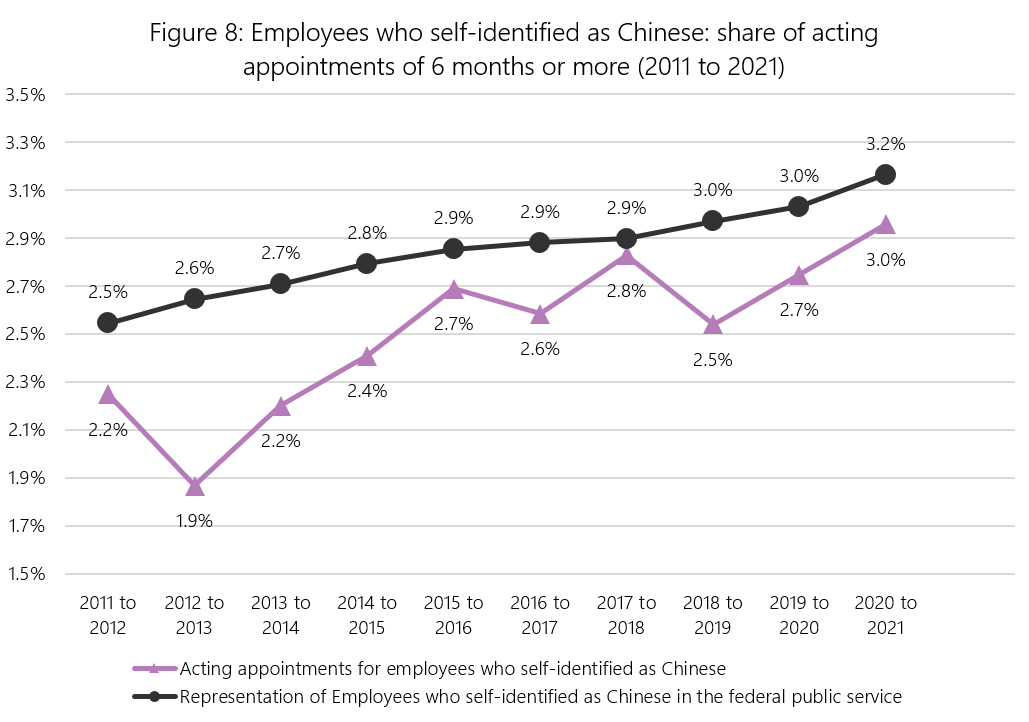
Text version
| Fiscal year | 2011 to 2012 | 2012 to 2013 | 2013 to 2014 | 2014 to 2015 | 2015 to 2016 | 2016 to 2017 | 2017 to 2018 | 2018 to 2019 | 2019 to 2020 | 2020 to 2021 |
|---|---|---|---|---|---|---|---|---|---|---|
| Acting appointments for employees who self-identified as Chinese | 2.2% | 1.9% | 2.2% | 2.4% | 2.7% | 2.6% | 2.8% | 2.5% | 2.7% | 3.0% |
| Representation of employees who self-identified as Chinese in the federal public service | 2.5% | 2.6% | 2.7% | 2.8% | 2.9% | 2.9% | 2.9% | 3.0% | 3.0% | 3.2% |
Representation by occupational categories
- Black and South Asian/East Indian employees’ representation in acting appointments exceeded their representation in 4 of the 6 occupational categories. Black employees were underrepresented in the Scientific and Professional and the Administrative Support categories, while South Asian/East Indian employees were underrepresented in the Scientific and Professional and the Technical categories. Representation of Non-White West Asian/North African/Arab employees was on par with or exceeded their representation in all 6 occupational categories. For their part, employees who self-identified as Chinese were underrepresented in the following 4 occupational categories: Executive Group, Scientific and Professional, Administrative and Foreign Service and Technical.
- These varying levels of representation of visible minority sub-groups in acting appointments, especially when comparing gaps of employees who self-identified as Chinese to those other sub-groups, highlight the importance of examining each sub-group’s own experience and context to better understand their reality relating to developmental opportunities.
- For more information on visible minority sub-groups’ representation in acting appointments by occupational category, please refer to Annex C.
Increase in the share of non-advertised acting appointments for employment equity groups
- In recent years, the increase in non-advertised appointment processes and its impact on representation has been a topic of interest. The most recent data analysis conducted by the PSC on non-advertised appointments by employment equity groups (2020 to 2021 update) focused on the increase in non-advertised appointments since 2016 to 2017 (promotions and acting appointments combined). These analyses revealed that the increase had no adverse effect on the non-advertised appointment share for employment equity group members.
- In this audit, for each employment equity group, we compared the share of acting appointments (6 months or more) that were non-advertised since 2016 to 2017 to the share of acting appointments that were non-advertised for the public service overall. Our analysis shows that the share of acting appointments for employment equity groups has not been negatively impacted by the increase in non-advertised acting appointments across the federal public service. In fact, this share increased for each of the 4 groups and some gaps have closed, as shown in the table below.
| Fiscal year | 2016 to 2017 | 2017 to 2018 | 2018 to 2019 | 2019 to 2020 | 2020 to 2021 |
|---|---|---|---|---|---|
| Federal public service | 67% | 74% | 79% | 83% | 87% |
| Women | 67% | 73% | 79% | 83% | 87% |
| Indigenous Peoples | 71% | 74% | 79% | 85% | 87% |
| Persons with disabilities | 56% | 74% | 77% | 84% | 86% |
| Members of visible minorities | 61% | 74% | 79% | 82% | 88% |
Measures in place to promote access to appointments for employment equity groups
- The PSC Appointment Framework sets the expectation for sub-delegated managers to consider employment equity objectives when making appointments. We examined how this was carried out in departments and agencies, and how employment equity considerations were articulated in appointment frameworks and practices.
- We reviewed the measures in effect during the scope of the audit (April 2020 to March 2021) from 14 participating departments and agencies to determine what systems and practices they had in place to promote access to appointments for employment equity groups. A measure was defined as any plan, policy, practice, governance or initiative the organization had put in place relating to employment equity objectives or obligations in staffing.
- The audit found that deputy heads had established a variety of employment equity measures to support inclusive appointment processes within their departments and agencies. All 14 departments and agencies had in place measures that aligned with the requirements and the flexibilities stemming from the PSC Appointment Framework. They had an attestation form that must be signed by those being sub-delegated, pledging that they will consider employment equity objectives when exercising their sub-delegated appointment and appointment-related authorities. As well, the direction established by the deputy heads on the use of advertised and non-advertised appointment processes included factors to be considered by sub-delegated managers in choosing the type of process, such as:
- organizational employment equity gaps
- access to an internal inventory of Indigenous candidates
- the possibility to offer a non-advertised acting appointment to someone who self-declared or self-identified as a member of a designated employment equity group
- Most departments and agencies also provided sub-delegated managers with the authority to limit or expand the area of selection to employment equity groups in an appointment process. With regards to the requirement for sub-delegated persons to articulate in writing their selection decision, most departments and agencies included employment equity considerations as part of the decision-making process. For example, some organizations provided a series of questions to guide the strategic discussion between human resources advisors and sub-delegated managers.
- The audit also found that departments and agencies did implement measures, based on their own context, to promote access to appointments for employment equity groups. More than half (8 of 14) of the departments and agencies had governance in place, such as steering committees, anti-racism task forces, and various types of working groups focused on developing employment equity action plans and related staffing strategies. In some organizations, these plans contained specific provisions to increase promotion of acting appointments and other development opportunities for members of employment equity groups. For example, there was one strategy to reduce the gaps for women and Indigenous Peoples in senior management ranks by offering acting appointments at the EX-level.
Exhibit 1: Employment equity self-assessment checklist
To support hiring managers and human resources professionals in their day-to-day staffing responsibilities, 2 organizations developed an employment equity self-assessment checklist that includes various considerations at key steps of the staffing process. - In addition to the above measures, participating departments and agencies developed different tools to assist sub-delegated managers in considering employment equity objectives in appointment processes. These included information sessions, HR bulletins, information placemats, assessment board guides, flash cards, demographic dashboards, checklists and practical guides or toolkits on inclusive recruitment.
- The audit did not assess whether the organizational measures supported the achievement of expected outcomes. As well, at the time of the audit, many organizations were in the process of developing new initiatives in response to the January 2021 Call to Action on Anti‑Racism, Equity, and Inclusion in the Federal Public Service.
Considering employment equity in acting appointments
- In keeping with the PSC’s Appointment Delegation and Accountability Instrument, sub-delegated persons must sign an attestation form that attests that, in exercising their sub-delegated authorities, they will consider employment equity objectives.
- To determine the extent to which hiring managers considered employment equity when making acting appointments, we examined a sample of 350 acting appointments of 6 months or more in the same 14 participating departments and agencies. This review was an opportunity to examine whether sub-delegated managers were guided by employment equity objectives, strategies or requirements when making acting appointments.
- For this specific audit, the review was limited to written appointment information provided by departments and agencies. In the documents reviewed, we looked for written references suggesting that employment equity was considered during the appointment process.
- In 118 of the 350 (33.7%) acting appointments examined, we found documented evidence that the sub-delegated manager considered employment equity. We noted that consideration occurred at different stages of the acting appointment process. For example:
- the area of selection was limited to employment equity groups
- employment equity was identified as an organizational need
- employment equity was among the reasons identified in the articulation of the selection decision
Exhibit 2: Manager’s attestation related to employment equity and diversity
In an organization, sub-delegated managers had to attest, at the assessment stage, that training on bias-free assessment was completed and that they were aware of the inventory of employment equity group members available to participate in appointment processes. - For the remaining 232 acting appointments, we found no written evidence on file that employment equity had been considered. In the context of this audit, the absence of a written reference does not necessarily mean that employment equity was not considered. The hiring manager may have considered employment equity at some point, without documenting it.
- For the 118 acting appointments where the audit established that employment equity was considered, we determined whether the appointment process and related decisions were aligned with the measures established by the organization to promote access to appointments for employment equity groups. We found that in 107 of the 118 (90.7%) acting appointments, the staffing processes and decisions were aligned with the organizational measures in place. In most cases, these organizational measures prescribed or encouraged the use of standard wording related to employment equity in the job advertisement, the notice of acting appointment, or the statement of merit criteria. In some cases, employment equity as an organizational need on the statement of merit criteria was also observed and aligned with the measures in place within these departments and agencies. For the remaining 11 (9.3%) acting appointments, although we concluded that employment equity was considered, we could not determine whether it was related to a specific organizational measure the organization had put in place.
Conclusion
- Identifying gaps in representation in acting appointments facilitates focus on areas where changes may be required to remove barriers encountered by certain groups of employees in appointment processes.
- Our audit results showed that women’s representation in acting appointments exceeded their representation in the public service for each year during the 10-year period analyzed. As for Indigenous Peoples and visible minorities, they were initially underrepresented in acting appointments when compared to their proportional share of the public service population. However, those gaps have since closed, and their share of acting appointments, as of 2020 to 2021, exceeded that representation. Results for persons with disabilities show that they were consistently underrepresented in acting appointments in comparison to their representation in the public service. They also experienced the most significant gaps out of the 4 employment equity groups.
- At the occupational category level, while the representation of women, Indigenous employees and members of visible minorities in acting appointments exceeded their representation in at least 4 of the 6 occupational categories analyzed, employees with disabilities were underrepresented in 5 occupational categories. We noted that all 4 employment equity groups were underrepresented in the Technical category.
- With regards to the 4 largest sub-groups of members of visible minorities, representation of Black, South Asian/East Indian and Non-White West Asian/North African/Arab employees in acting appointments, between 2011 and 2021, was mostly on par with, or exceeded their representation in the public service overall. In contrast, employees who self-identified as Chinese were underrepresented in 9 of the 10 years analyzed.
- The above results show that not all employment equity groups and sub-groups were proportionately represented in acting appointments, specifically persons with disabilities and employees who self-declared as Chinese were not. Results also illustrate that within employment equity groups, representation in acting appointments varies from one sub-group to another. This highlights the importance of looking at disaggregated data to better understand each sub-group’s experience and develop solutions accordingly.
- The audit also examined how employment equity considerations were articulated in departments’ and agencies’ appointment frameworks and practices. It determined that, during the scope of the audit, deputy heads of all 14 departments and agencies examined had established measures to promote access to appointments for employment equity groups. While most of the measures focused on flexibilities stemming from the PSC Appointment Framework, others were organization-specific and related to organizational governance.
- Lastly, the audit found documented evidence for about a third of the 350 acting appointments reviewed that hiring managers considered employment equity when making acting appointments.
- This audit points to areas where improvements in staffing practices are required to achieve representation in the workplace and provide all public servants with opportunities to realize their full potential. Deputy heads should consider the results of this audit within their own organizational context and develop solutions to ensure barrier-free and inclusive appointment processes.
Recommendations
Recommendation 1: Deputy heads should monitor acting appointments so that members of all designated employment equity groups are not disadvantaged, especially persons with disabilities and members of visible minorities sub-groups where gaps have been identified.
Recommendation 2: Deputy heads should implement measures to improve the representation of employment equity groups in acting appointments to positions in the Technical occupational category.
Recommendation 3: The PSC should share data on employment equity representation in acting appointments with departments and agencies to support deputy heads in identifying solutions and making appropriate changes for more inclusive staffing practices.
Moving forward: the Public Service Commission of Canada’s response
- The findings of this audit show positive progress, reflecting the efforts made by departments and agencies to strengthen diversity and inclusion.
- Acting appointments provide important developmental opportunities for employees and may serve as a gateway to promotion. For this reason, continuous efforts must be made to identify and address potential barriers for all employment equity groups, to improve representation where gaps exist.
- The PSC will continue to support departments and agencies by focusing on refining tools and guidance documents to address biases and barriers in assessment.
- We will also expand data collection to include more equity-seeking groups to enhance our understanding of hiring practices and outcomes. We will share this data with departments so that they can monitor acting appointments, through employment system reviews and other mechanisms, to identify any barriers.
- While the PSC and deputy heads work to achieve progress related to the audit recommendations, continuous discussions and engagement with stakeholders should continue to take place. We firmly believe that concerted efforts can lead to sustained and meaningful progress.
Annex A: About the audit
Audit objectives
The objectives of this audit were:
- To determine whether the 4 designated employment equity groups are proportionately represented in acting appointments
- To determine what systems and practices departments and agencies have in place to promote access to appointments for employment equity groups
- To determine the extent to which hiring managers consider employment equity when making acting appointments
Scope and methodology
The audit included:
- a data analysis to determine system-wide representation of employment equity groups in acting appointments
- the review of organizational documentation with respect to systems and practices in place between April 2020 and March 2021 in 14 departments and agencies
- the review of a random sample of 350 advertised and non-advertised acting appointments of 6 months or more made between April 2020 and March 2021
Audit methodology for objective 1
Audit methodology for objective 1 included system-wide data analysis to identify trends and gaps in representation of employment equity groups in acting appointments. This analysis included acting appointments of 6 months or more made, over a period of 10 years, in all departments and agencies of the federal public service subject to the Public Service Employment Act.
Overall representation in acting appointments from 2011 to 2021 (10 years)
- Representation rates of each employment equity group and sub-group in all acting appointments of 6 months or more compared to their representation in the federal public service during the 10-year period.
Representation in acting appointments by occupational category, cumulative 2016 to 2021
- Representation rates of each employment equity group and sub-group in all acting appointments of 6 months or more compared to their representation in the population for each of the following 6 occupational categories:
- Administrative and Foreign Service
- Administrative Support
- Executive
- Operational
- Scientific and Professional
- Technical
- This part of the analysis focused on the most recent 5 years (2016 to 2021) of data combined, available at the time we conducted the audit.
- The 4 largest visible minorities sub-groups for which sufficient data was available to draw observations included employees who self-identified as Black, Chinese, South Asian/East Indian, and Non-White West Asian/North African/Arab.
Data
- The dataset used for objective 1 is derived from 2 internal data sources. The first data source, the Jobs-Based Analytical Information System, contains transactional data gathered from the government’s pay system. This data source was used to identify the acting appointment status and length, as well as most of the explanatory variables used in the analysis, such as occupational category.
- The second data source was used to determine employment equity status. Data on women are based on the number of applicants who identified their gender in their Public Service Resourcing System profile or from the federal government pay system, when available. Data on employment equity status for Indigenous Peoples, persons with disabilities, and members of visible minorities were drawn from a combination of voluntary self-declaration of employment equity membership provided by individuals as part of their application, as well as self-identification of employment equity membership voluntarily provided by individuals upon appointment to the public service.
Audit methodology for objective 2
Audit methodology for objective 2 included a review of documentation relating to organizational measures promoting access to appointments for employment equity groups, in effect between April 1, 2020, and March 31, 2021. These included documents such as plans, policies, guidelines, departmental initiatives and organizational reports related to employment equity in staffing. For each measure, departments and agencies were asked to indicate how they were communicated within the organization, as well as the approach to assessing the performance of its employment equity measures with respect to appointments, if applicable.
Audit methodology for objective 3
Audit methodology for objective 3 included a review of a sample of 350 advertised and non-advertised acting appointments of 6 months or more made between April 1, 2020, and March 31, 2021, across the 14 participating departments and agencies. For each acting appointment included in the sample, the audit team reviewed documents such as the advertisement, the results of the person appointed, the articulation of the selection decision, the Notice of Acting Appointment and the offer of acting appointment.
Sampling of the 14 participating departments and agencies
- All departments and agencies that were part of the concurrent system-wide staffing audit were excluded from this audit to minimize audit burden in the staffing system. Departments with low numbers of acting appointments during the scope period were not included, except for the PSC, as it was deemed relevant for it to be subject to the audit as well.
Sampling of the 350 acting appointments
- The target population included all advertised and non-advertised acting appointments of 6 months or more, with an appointment start date from April 1, 2020, to March 31, 2021, from medium and large departments and agencies that fall under the jurisdiction of the Public Service Employment Act.
- The audit sample included 350 acting appointments from 14 departments and agencies. A maximum of 25 acting appointment processes were randomly selected per organization (22 non-advertised and 3 advertised).
Due to the design of the sample, the audit is unable to report on results at the organizational level. The audit sample was designed to provide system-wide results only.
Participating departments and agencies
The PSC thanks the departments and agencies included in this audit for providing appointment files and information to support our audit work.
- Crown-Indigenous Relations and Northern Affairs Canada
- Department of Indigenous Services
- Employment and Social Development Canada
- Fisheries and Oceans Canada
- Global Affairs Canada
- Health Canada
- Immigration, Refugees and Citizenship Canada
- Innovation, Science and Economic Development Canada
- Justice Canada (Department of)
- National Defence
- Public Health Agency of Canada
- Public Service Commission of Canada
- Royal Canadian Mounted Police
- Veterans Affairs Canada
Annex B: Representation of employment equity groups in acting appointments by occupational category
Period covered: 2016 to 2021 (5 years combined)
| Occupational category | Executive group | Scientific and Professional | Administrative and Foreign Service | Technical | Administrative Support | Operational |
|---|---|---|---|---|---|---|
| Acting | 54.5% | 61.1% | 67.9% | 27.2% | 78.7% | 23.1% |
| Population | 50.6% | 53.7% | 60.4% | 28.5% | 77.0% | 22.6% |
| Occupational category | Executive Group | Scientific and Professional | Administrative and Foreign Service | Technical | Administrative Support | Operational |
|---|---|---|---|---|---|---|
| Acting | 4.9% | 3.7% | 5.6% | 3.2% | 5.0% | 7.9% |
| Population | 4.4% | 3.3% | 5.3% | 4.6% | 6.5% | 7.4% |
| Occupational category | Executive Group | Scientific and Professional | Administrative and Foreign Service | Technical | Administrative Support | Operational |
|---|---|---|---|---|---|---|
| Acting | 3.6% | 3.6% | 4.9% | 3.2% | 5.7% | * |
| Population | 5.4% | 4.4% | 5.8% | 4.0% | 6.9% | 4.4% |
| Occupational Category | Executive Group | Scientific and Professional | Administrative and Foreign Service | Technical | Administrative Support | Operational |
|---|---|---|---|---|---|---|
| Acting | 12.2% | 20.7% | 20.2% | 7.4% | 23.9% | 9.2% |
| Population | 12.5% | 20.4% | 18.2% | 9.8% | 18.9% | 7.1% |
* Gaps ranging from +/- 0.1% to 0% or representing fewer than 5 acting appointments are considered too small to draw meaningful conclusions.
Annex C: Representation of visible minority sub-groups in acting appointments by occupational category
Period covered: 2016 to 2021 (5 years combined)
| Occupational category | Executive Group | Scientific and Professional | Administrative and Foreign Service | Technical | Administrative Support | Operational |
|---|---|---|---|---|---|---|
| Acting | 1.9% | 2.8% | 4.4% | 1.3% | 4.5% | 2.0% |
| Population | 1.9% | 2.9% | 3.7% | 1.1% | 4.9% | 1.6% |
| Occupational Category | Executive Group | Scientific and Professional | Administrative and Foreign Service | Technical | Administrative Support | Operational |
|---|---|---|---|---|---|---|
| Acting | 2.7% | 3.7% | 3.2% | 1.1% | 4.5% | 1.8% |
| Population | 2.5% | 3.8% | 3.0% | 2.0% | 3.0% | 1.3% |
| Occupational category | Executive Group | Scientific and Professional | Administrative and Foreign Service | Technical | Administrative Support | Operational |
|---|---|---|---|---|---|---|
| Acting | * | 3.1% | 2.2% | * | 1.5% | * |
| Population | 1.9% | 2.6% | 2.1% | 0.9% | 1.4% | 0.4% |
| Occupational category | Executive Group | Scientific and Professional | Administrative and Foreign Service | Technical | Administrative Support | Operational |
|---|---|---|---|---|---|---|
| Acting | 1.3% | 3.9% | 2.7% | 1.4% | 3.6% | 0.6% |
| Population | 2.0% | 4.8% | 3.1% | 2.2% | 2.3% | 0.5% |
* Gaps ranging from +/- 0.1% to 0% or representing fewer than 5 acting appointments are considered too small to draw meaningful conclusions.
Catalogue # SC3-197/2024E-PDF
ISBN # 978-0-660-73135-3