
Citizenship of Applicants and External Appointments
Period of 2015-16 to 2020-21
Accessibility
As of the date of publication, this document has been verified for accessibility.
If you encounter any issues with this document, please contact the author.
Candidate for Open Government
Background
This report examines how frequently non-citizens and permanent residents apply for and are appointed to jobs advertised to the general public. It also explores the employment equity representation of citizens, non-citizens and permanent resident applicants and appointments.
Prior to the recent amendments to the Public Service Employment Act, permanent residents were eligible to work in the public sector, however, Canadian citizens were given priority in advertised external appointment processes. Amendments to the Act in 2021, made through Bill C-30, were intended to remove potential barriers to employment from the hiring process and to provide a level playing field at the federal level for permanent residents. These changes are not reflected in the current report, which extends the results of the previous 2020 report by two years, from 2018-19 to 2020-21. The data used in our future updates will, however, allow us to analyse the impact of the legislative changes based on this benchmark report.
Executive Summary
The scope of this report covers the period between 2015-16 and 2020-21. Results show that:
- There has been an ongoing increase in the number and share of permanent resident applicants.
- Despite increases in their recruitment, permanent residents make up a smaller share of hires than applicants.
- Applicants who identify themselves as visible minorities are more likely to be non-citizens than their non-visible minorities counterparts. Further, non-citizens are less likely to be hired than citizens.
- As a result, there are fewer non-citizen visible minority applicants that are appointed.
- Most non-citizen applicants and hires are permanent residents.
- The percentage of non-citizen applicants for all employment equity designated groups is higher for men than for women.
Citizenship Status of Applicants and External Appointments
- In 2020-2021, there were 375,473 unique applicants to jobs open to the public, an increase from 368,763 in 2018-2019 (see Annex 2, Table A2-1).
- The share of non-citizen applicants to jobs advertised to the public increased from 14.5% (53,602) in 2018-2019 to 17.1% (64,184) in 2020-2021.
- In 2020-2021, there were 19,065 external appointments from jobs open to the public for which citizenship could be identified (external hires), a decrease from 20,012 in 2018-2019.
- Canadian citizens accounted for 97.5% (18,594) of all external appointments in that year.
- Non-citizen hires in 2020-2021 accounted for 2.5% (471) of the total, the same share as in 2018-2019.
- Given the preference for the appointment of qualified Canadian citizens, the share of external hires that are non-citizens continued to be well below their relative share of applicants.
Citizenship and Employment Equity
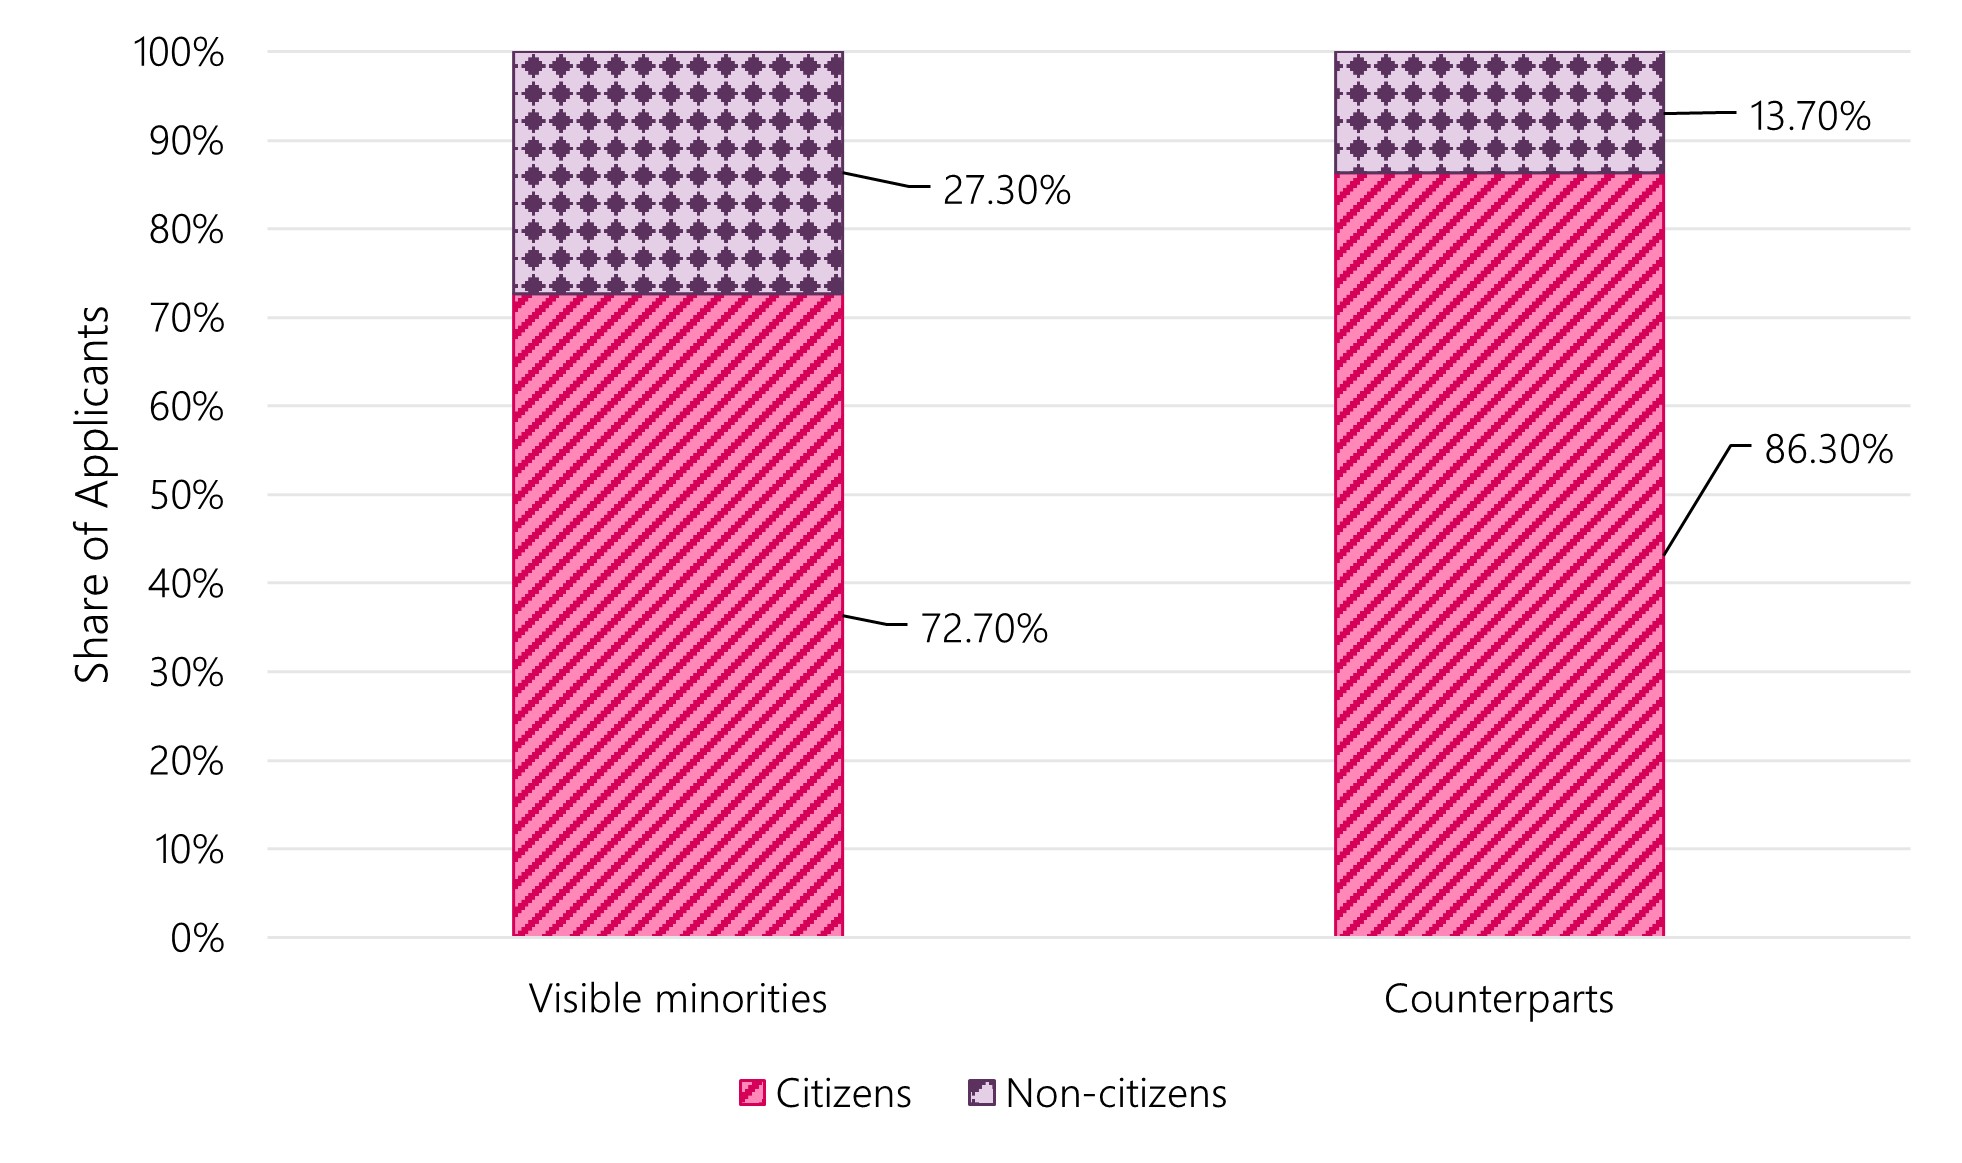
Of all applicants, non-citizens account for 27.3% of visible minority applicants, compared to 13.7% of non-visible minority applicants (see Graph 1). This is an increase from 22.9% and 12.1%, respectively, in 2018-2019.
Graph 1: Applicant Shares: Visible Minorities versus Counterparts, PSEA Organisations (2020-21)
Text version
| Employment equity group | Citizens | Non-citizens |
|---|---|---|
| Visible minorities | 72.7% | 27.3% |
| Counterparts | 86.3% | 13.7% |
Visible minority applicants are more likely to be non-citizens than their counterparts.Footnote 1 Further, non-citizens are less likely to be hired than citizens. As a result, there are fewer non-citizen visible minority applicants that are appointed.
As seen in Graph 2, visible minorities represent 25% of all applicants and 23% of hires.
- When the analysis is restricted to Canadian citizens, visible minorities represent 18.2% of applicants and 21.8% of hires.
- However, among non-citizens, visible minorities represent 6.8% of all applicants but only 1.2% of all hires.
- Other factors, such as foreign credentials, may contribute to the drop-off of non-citizens between the application and appointment stage.
Graph 2: Visible Minorities as Applicants and External Appointments, Citizens versus Non-Citizens, PSEA Organisations (2020-21)

Text version
| Representation type | Citizens | Non-citizens | Total percent |
|---|---|---|---|
| Visible minority applicants | 18.2% | 6.8% | 25% |
| Visible minority hires | 21.8% | 1.2% | 23% |
Permanent Residents and Other Non-citizens
There are different types of non-citizenship.Footnote 2 The following section describes applicant and appointment shares of permanent residents compared to other non-citizens.
Applicants
- Most non-citizen applicants are permanent residents.
- Two-thirds (43,135) of the 64,184 non-citizen applicants in 2020-2021 were permanent residents, while the remaining one-third (21,049) were other non-citizens.
- Visible minority representation is highest among permanent resident applicants compared to other citizenship statuses.
- In 2020-2021, 44.2% of permanent resident applicants to external job advertisements were visible minorities, compared to 22.0% for citizens and 31.3% for other non-citizens. This is an increase from 38.4%, 20.1% and 27.5%, respectively, in 2018-2019 (see Annex 2, Table A2-6 and Graph 3).Footnote 3
External Appointments
- Most non-citizen hires are permanent residents.
- In 2020-2021, of the 2.5% of hires who were non-citizens, over 8 in 10 (384 hires) were permanent residents, while the remaining hires (87 hires) were other non-citizens.
- Visible minority representation is highest among external hires who are permanent residents compared to other citizenship statuses (see Graph 4, Annex 2, Table A2-11).
- In 2020-2021, 49.5% of external appointments who were permanent residents were members of visible minorities, compared to 22.3% of citizens and 40.2% of other non-citizens.
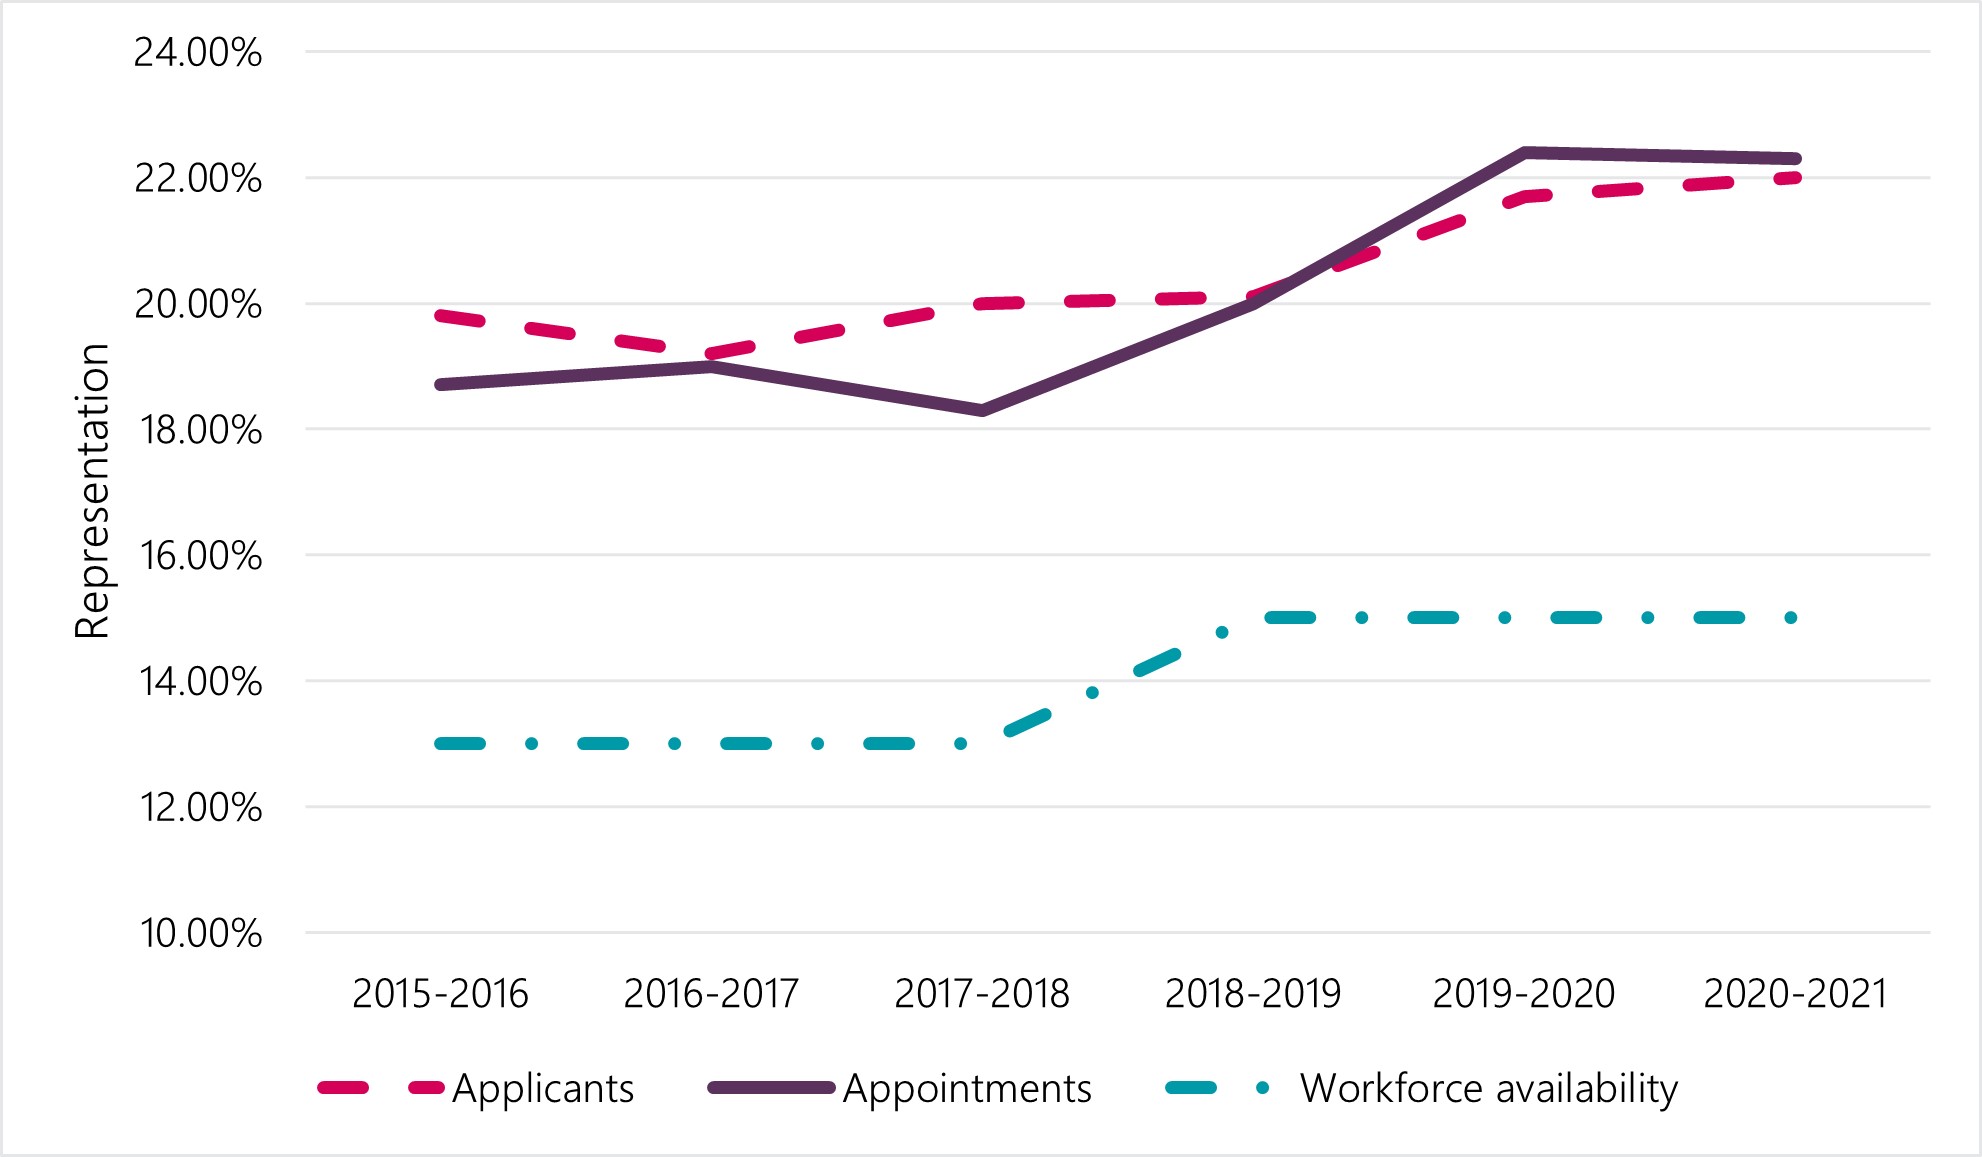
Graph 3: Visible Minority Representation Among Applicants and External Appointments, Canadian citizens, PSEA Organisations (2015-2021)
Text version
| Fiscal Year | 2015-2016 | 2016-2017 | 2017-2018 | 2018-2019 | 2019-2020 | 2020-2021 |
|---|---|---|---|---|---|---|
| Applicants | 19.8% | 19.2% | 20.0% | 20.1% | 21.7% | 22.0% |
| Appointments | 18.7% | 19.0% | 18.3% | 20.0% | 22.4% | 22.3% |
| Workforce Availability | 13.0% | 13.0% | 13.0% | 15.3% | 15.3% | 15.3% |
Graph 4: Visible Minority Representation Among Applicants and External Appointments, Permanent residents, PSEA Organisations (2015-2021)

Text version
| Representation type | 2015-2016 | 2016-2017 | 2017-2018 | 2018-2019 | 2019-2020 | 2020-2021 |
|---|---|---|---|---|---|---|
| Applicants | 39.7% | 41.0% | 42.1% | 38.4% | 42.7% | 44.2% |
| Appointments | 45.3% | 48.9% | 44.9% | 48.3% | 49.6% | 49.5% |
| Workforce Availability | 13.0% | 13.0% | 13.0% | 15.3% | 15.3% | 15.3% |
Graph 5: Visible Minority Representation Among Applicants and External Appointments, Other non-citizens, PSEA Organisations (2015-2021)

Text version
| Representation type | 2015-2016 | 2016-2017 | 2017-2018 | 2018-2019 | 2019-2020 | 2020-2021 |
|---|---|---|---|---|---|---|
| Applicants | 26.9% | 28.0% | 28.0% | 27.5% | 29.1% | 31.3% |
| Appointments | 33.3% | 32.4% | 25.5% | 44.4% | 37.3% | 40.2% |
| Workforce Availability | 13.0% | 13.0% | 13.0% | 15.3% | 15.3% | 15.3% |
Intersectionality with gender
Non-citizen men make up a higher percentage of applicants in all three employment equity groups than women (Annex 2, Table A2-12).
- In 2020-2021, non-citizens represented 9.2% of Indigenous man applicants (down from 10.6% in 2018-19) and 4.3% of Indigenous woman applicants (up from 3.5%).
- Non-citizens made up 30.9% of visible minority men and 26.4% of visible minority women in 2020-2021. As compared to 2018-2019, this represents an increase from 26.7% and 22.2%, respectively.
- As of 2020-2021, non-citizens accounted for 7.9% of men applicants declaring having disabilities and 4.1% from women applicants with disabilities. In 2018-2019, these percentages were 6.8% and 3.3%, respectively.
- Non-citizens represented 5.9% of visible minority men and 4.7% of visible minority women external hires in 2020-2021. Compared to 2018-2019, this represents a decrease from 6.4% and 5.2%, respectively (see Annex 2, Table A2-13).Footnote 4
Conclusion
In this updated report, two more years of applicant and appointment data have been included since the last publication. In line with our previous findings, there is an overall increase in non-citizens applying for jobs advertised in the public domain. Non-citizens, however, remain less likely to be appointed than Canadian citizens, and their appointment share has remained about the same since 2018-2019 (2.5%).
In June 2021, the Public Service Employment Act was amended to address systemic biases and barriers to equity in the workplace. The amendments also include providing permanent residents with the same preference as Canadian citizens in advertised external appointment processes. The PSC will monitor the impact of these legislative changes on permanent resident hiring.
Annex 1 - Methodology
For this analysis, all jobs open to the public for indeterminate and term positions for a duration of three months or greater, that closed between April 1, 2015, and March 31, 2021, were evaluated. Similarly, all external appointments for indeterminate and term positions for a duration of three months or greater between April 1, 2015, and March 31, 2021, are included.
We assess the citizenship of external appointments by matching existing public servants to the Public Service Resourcing System (PSRS) applications using a deterministic record linkage process.
We assess the employment equity status of applicants based on the self-declaration provided in their applications on the PSRS. Information on women applicants is only available as of April 1, 2016. Also, when gender is considered, only applicants who self-declared their gender as a ‘man’ or ‘woman’ are included. For external appointments, we analyze employee’s self-identification as collected by the Treasury Board Secretariat in the Employment Equity Data Bank (EEDB). The most recent available data from the EEDB is up to March 31, 2021.
The workforce availability (WFA) based on the 2016 Census was first publicly released in the 2018-2019 Report on Employment Equity. All fiscal years before 2018-2019 in this report are compared to the WFA based on the 2011 Census.
| Employment equity groups | Previous WFA benchmark (2011 Census) |
WFA benchmark (2016 Census) |
|---|---|---|
| Women | 52.5% | 52.7% |
| Indigenous peoples | 3.4% | 4.0% |
| Persons with disabilities | 4.4% | 9.0% |
| Members of visible minorities | 13.0% | 15.3% |
Source: Treasury Board Secretariat, Employment Equity in the Public Service of Canada for Fiscal Year 2018 to 2019.
Annex 2 – Results
Note: Applicant data for women cannot be reported prior to 2016-2017 due to a change in data capture. Counterparts are applicants or external appointments for which the person did not self-declare or self-identify as belonging to the employment equity group being considered. For example, the counterparts of Indigenous are applicants who did not self-declare as Indigenous or external appointees who did not self-identify as Indigenous.
| Representation type | 2015-2016 | 2016-2017 | 2017-2018 | 2018-2019 | 2019-2020 | 2020-2021 |
|---|---|---|---|---|---|---|
| Applicants | 203,419 | 219,584 | 247,035 | 368,763 | 314,830 | 375,473 |
| Citizens | 184,406 (90.7%) |
198,600 (90.4%) |
217,078 (87.9%) |
315,161 (85.5%) |
264,973 (84.2%) |
311,289 (82.9%) |
| Non-citizens | 19,013 (9.3%) |
20,984 (9.6%) |
29,957 (12.1%) |
53,602 (14.5%) |
49,857 (15.8%) |
64,184 (17.1%) |
| Permanent residents | 14,241 | 15,270 | 20,666 | 37,716 | 33,606 | 43,135 |
| Other non-citizens | 4,772 | 5,714 | 9,291 | 15,886 | 16,251 | 21,049 |
| Representation type | 2015-2016 | 2016-2017 | 2017-2018 | 2018-2019 | 2019-2020 | 2020-2021 |
|---|---|---|---|---|---|---|
| Appointments | 10,402 | 13,818 | 16,628 | 20,012 | 20,427 | 19,065 |
| Citizens | 10,243 (98.5%) |
13,606 (98.5%) |
16,303 (98.0%) |
19,517 (97.5%) |
19,948 (97.7%) |
18,594 (97.5%) |
| Non-citizens | 159 (1.5%) |
212 (1.5%) |
325 (2.0%) |
495 (2.5%) |
479 (2.3%) |
471 (2.5%) |
| Permanent residents | 150 | 178 | 274 | 387 | 377 | 384 |
| Other non-citizens | 9 | 34 | 51 | 108 | 102 | 87 |
| Employment equity group | Citizenship Status | 2015-2016 | 2016-2017 | 2017-2018 | 2018-2019 | 2019-2020 | 2020-2021 |
|---|---|---|---|---|---|---|---|
| Visible minority | Citizen applicants | 84.0% | 82.9% | 79.4% | 77.1% | 75.1% | 72.7% |
| Visible minority | Non-citizen applicants | 16.0% | 17.1% | 20.6% | 22.9% | 24.9% | 27.3% |
| Counterparts | Citizen applicants | 92.5% | 92.4% | 90.3% | 87.9% | 87.1% | 86.3% |
| Counterparts | Non-citizen applicants | 7.5% | 7.6% | 9.7% | 12.1% | 12.9% | 13.7% |
| Representation type | Applicants versus appointments | 2015-2016 | 2016-2017 | 2017-2018 | 2018-2019 | 2019-2020 | 2020-2021 |
|---|---|---|---|---|---|---|---|
| Percent of visible minoritiesFootnote 5 | Applicants | 21.3% | 21.0% | 22.2% | 22.3% | 24.3% | 25.0% |
| Percent of visible minority - citizens | Applicants | 19.8% | 19.3% | 20.0% | 20.1% | 21.7% | 22.0% |
| Percent of visible minority - non-citizens | Applicants | 36.5% | 37.5% | 37.7% | 35.1% | 38.3% | 40.0% |
| Representation type | Applicants versus appointments | 2015-2016 | 2016-2017 | 2017-2018 | 2018-2019 | 2019-2020 | 2020-2021 |
|---|---|---|---|---|---|---|---|
| Percent of visible minoritiesFootnote 6 | Appointments | 19.1% | 19.4% | 18.8% | 20.7% | 23.0% | 22.9% |
| Percent of visible minority - citizens | Appointments | 18.7% | 19.0% | 18.3% | 20.0% | 22.4% | 22.3% |
| Percent of visible minority - non-citizens | Appointments | 44.7% | 46.2% | 41.9% | 47.5% | 47.0% | 47.8% |
| Representation type | Applicants versus appointments | 2015-2016 | 2016-2017 | 2017-2018 | 2018-2019 | 2019-2020 | 2020-2021 |
|---|---|---|---|---|---|---|---|
| Canadian citizens | Applicants | 19.8% | 19.2% | 20.0% | 20.1% | 21.7% | 22.0% |
| Permanent residents | Applicants | 39.7% | 41.0% | 42.1% | 38.4% | 42.7% | 44.2% |
| Other non-citizens | Applicants | 26.9% | 28.0% | 28.0% | 27.5% | 29.1% | 31.3% |
| Representation type | Applicants versus appointments | 2015-2016 | 2016-2017 | 2017-2018 | 2018-2019 | 2019-2020 | 2020-2021 |
|---|---|---|---|---|---|---|---|
| Canadian citizens | Appointments | 18.7% | 19.0% | 18.3% | 20.0% | 22.4% | 22.3% |
| Permanent residents | Appointments | 45.3% | 48.9% | 44.9% | 48.3% | 49.6% | 49.5% |
| Other non-citizens | Appointments | 33.3% | 32.4% | 25.5% | 44.4% | 37.3% | 40.2% |
| Citizens | 43.4% | 43.4% | 43.1% | 39.4% | 40.7% | 37.7% |
|---|---|---|---|---|---|---|
| Non-citizens | 35.1% | 35.3% | 31.1% | 26.0% | 26.1% | 24.6% |
| Employment equity group | Citizenship Status | 2015-2016 | 2016-2017 | 2017-2018 | 2018-2019 | 2019-2020 | 2020-2021 |
|---|---|---|---|---|---|---|---|
| Visible minority | Citizen external hires | 96.4% | 96.3% | 95.6% | 94.3% | 95.2% | 94.9% |
| Visible minority | Non-citizen external hires | 3.6% | 3.7% | 4.4% | 5.7% | 4.8% | 5.1% |
| Counterparts | Citizen external hires | 99.0% | 99.0% | 98.6% | 98.4% | 98.4% | 98.3% |
| Counterparts | Non-citizen external hires | 1.0% | 1.0% | 1.4% | 1.6% | 1.6% | 1.7% |
| Citizenship Status | 2015-2016 | 2016-2017 | 2017-2018 | 2018-2019 | 2019-2020 | 2020-2021 |
|---|---|---|---|---|---|---|
| Citizens | 41.7% | 42.5% | 41.5% | 37.7% | 39.5% | 36.5% |
| Non-citizens | 39.2% | 38.4% | 33.5% | 26.7% | 26.5% | 24.4% |
| Representation type | Citizenship Status | 2015-2016 | 2016-2017 | 2017-2018 | 2018-2019 | 2019-2020 | 2020-2021 |
|---|---|---|---|---|---|---|---|
| Indigenous peoples | Canadian Citizens | 3.7% | 3.6% | 3.6% | 3.4% | 3.5% | 3.3% |
| Indigenous peoples | Permanent Residents | 0.8% | 0.7% | 0.7% | 0.8% | 0.8% | 0.7% |
| Indigenous peoples | Other Non-Citizens | 2.2% | 1.7% | 2.3% | 2.2% | 2.3% | 1.5% |
| Persons with disabilities | Canadian Citizens | 2.8% | 2.9% | 3.1% | 3.0% | 3.4% | 3.7% |
| Persons with disabilities | Permanent Residents | 0.9% | 1.0% | 0.9% | 0.8% | 1.0% | 1.1% |
| Persons with disabilities | Other Non-Citizens | 0.6% | 0.8% | 1.1% | 0.8% | 1.0% | 0.8% |
| Visible minority | Canadian Citizens | 19.8% | 19.2% | 20.0% | 20.1% | 21.7% | 22.0% |
| Visible minority | Permanent Residents | 39.7% | 43.0% | 42.1% | 38.4% | 42.7% | 44.2% |
| Visible minority | Other Non-Citizens | 26.9% | 28.0% | 28.0% | 27.5% | 29.1% | 31.3% |
| Women | Canadian Citizens | N/A | 55.6% | 55.4% | 57.0% | 57.6% | 59.5% |
| Women | Permanent Residents | 45.1% | 44.6% | 44.7% | 46.4% | 47.0% | 50.3% |
| Women | Other Non-Citizens | 39.7% | 40.2% | 36.8% | 38.8% | 37.4% | 44.2% |
| Employment equity group by gender | 2015-2016 | 2016-2017 | 2017-2018 | 2018-2019 | 2019-2020 | 2020-2021 |
|---|---|---|---|---|---|---|
| Indigenous peoples - Women | N/A | 1.9% | 2.7% | 3.5% | 3.3% | 4.3% |
| Indigenous peoples - Men | N/A | 4.6% | 8.0% | 10.6% | 12.0% | 9.2% |
| Counterparts of Indigenous peoples – Women | N/A | 8.4% | 10.4% | 12.5% | 13.4% | 15.2% |
| Counterparts of Indigenous peoples - Men | N/A | 12.9% | 16.3% | 19.1% | 21.0% | 21.8% |
| Members of visible minorities - Women | N/A | 16.6% | 20.1% | 22.2% | 23.6% | 26.4% |
| Members of visible minorities – Men | N/A | 20.8% | 24.4% | 26.7% | 29.0% | 30.9% |
| Counterparts of members of visible minorities - Women | N/A | 6.1% | 7.5% | 9.5% | 9.8% | 11.1% |
| Counterparts of members of visible minorities - Men | N/A | 10.4% | 13.6% | 16.6% | 18.0% | 18.2% |
| Persons with disabilities - Women | N/A | 2.5% | 3.5% | 3.3% | 4.0% | 4.1% |
| Persons with disabilities - Men | N/A | 4.9% | 5.8% | 6.8% | 7.4% | 7.9% |
| Counterparts of persons with disabilities - Women | N/A | 8.3% | 10.3% | 12.5% | 13.4% | 15.2% |
| Counterparts of persons with disabilities – Men | N/A | 12.8% | 16.3% | 19.2% | 21.1% | 21.9% |
| Employment equity group by gender | 2015-2016 | 2016-2017 | 2017-2018 | 2018-2019 | 2019-2020 | 2020-2021 |
|---|---|---|---|---|---|---|
| Members of visible minorities - Women | 3.2% | 3.1% | 3.3% | 5.2% | 4.1% | 4.7% |
| Members of visible minorities – Men | 4.1% | 4.5% | 5.7% | 6.4% | 5.7% | 5.9% |
| Counterparts of members of visible minorities - Women | 0.9% | 0.8% | 1.2% | 1.5% | 1.5% | 1.4% |
| Counterparts of members of visible minorities - Men | 1.3% | 1.3% | 1.7% | 1.8% | 1.8% | 2.1% |
| Representation type | Applicants versus appointments | 2015-2016 | 2016-2017 | 2017-2018 | 2018-2019 | 2019-2020 | 2020-2021 |
|---|---|---|---|---|---|---|---|
| Indigenous peoples | Applicants | 1.1% | 1.0% | 1.2% | 1.2% | 1.3% | 1.0% |
| Indigenous peoples | Appointments | 2.5% | 1.4% | 2.8% | 2.2% | 2.9% | 1.9% |
| Persons with disabilities | Applicants | 0.8% | 0.9% | 1.0% | 0.8% | 1.0% | 1.0% |
| Persons with disabilities | Appointments | 2.5% | 0.45% | 0.9% | 1.2% | 1.5% | 1.5% |
| Visible minority | Applicants | 36.5% | 37.5% | 37.7% | 35.1% | 38.3% | 40.0% |
| Visible minority | Appointments | 44.7% | 46.2% | 41.8% | 47.5% | 47.0% | 47.8% |
| Women | Applicants | N/A | 43.4% | 42.3% | 44.1% | 43.8% | 48.3% |
| Women | Appointments | 50.3% | 46.7% | 47.7% | 51. 7% | 52.8% | 51.6% |
| Representation type | Citizenship status | 2015-2016 | 2016-2017 | 2017-2018 | 2018-2019 | 2019-2020 | 2020-2021 |
|---|---|---|---|---|---|---|---|
| Indigenous peoples | Canadian Citizens | 4.1% | 4.6% | 4.1% | 4.3% | 4.0% | 4.0% |
| Indigenous peoples | Permanent Residents | 2.0% | 1.7% | 2.2% | 1.3% | 2.4% | 1.3% |
| Indigenous peoples | Other Non-Citizens | 11.1% | 0.0% | 5.9% | 5.6% | 4.9% | 4.6% |
| Persons with disabilities | Canadian Citizens | 3.3% | 4.0% | 3.7% | 3.8% | 4.2% | 4.9% |
| Persons with disabilities | Permanent Residents | 2.7% | 0.6% | 0.7% | 1.0% | 1.9% | 1.8% |
| Persons with disabilities | Other Non-Citizens | 0.0% | 0.0% | 2.0% | 1.9% | 0.0% | 0.0% |
| Visible minority | Canadian Citizens | 18.7% | 19.0% | 18.3% | 20.0% | 22.4% | 22.3% |
| Visible minority | Permanent Residents | 45.3% | 48.9% | 44.9% | 48.3% | 49.6% | 49.5% |
| Visible minority | Other Non-Citizens | 33.3% | 32.4% | 25.5% | 44.4% | 37.3% | 40.2% |
| Women | Canadian Citizens | 58.4% | 579% | 58.6% | 57.0% | 58.3% | 60.2% |
| Women | Permanent Residents | 50.7% | 48.3% | 47.4% | 53.5% | 54.1% | 54.2% |
| Women | Other Non-Citizens | 44.4% | 38.2% | 49.0% | 45.4% | 48.0% | 40.2% |
| Representation type | Citizenship | Gender | 2015-2016 | 2016-2017 | 2017-2018 | 2018-2019 | 2019-2020 | 2020-2021 |
|---|---|---|---|---|---|---|---|---|
| Visible Minority | Citizens | Women applicants | N/A | 9.9% | 10.3% | 10.8% | 11.9% | 12.5% |
| Visible Minority | Citizens | Men applicants | N/A | 8.7% | 9.1% | 8.8% | 9.5% | 9.2% |
| Visible Minority | Citizens | Women appointments | 10.8% | 11.1% | 10.7% | 11.6% | 13.2% | 13.2% |
| Visible Minority | Citizens | Men appointments | 7.9% | 7.9% | 7.7% | 8.4% | 9.2% | 9.1% |
| Visible Minority | Permanent Residents | Women applicants | N/A | 18.7% | 19.5% | 18.8% | 21.0% | 29.5% |
| Visible Minority | Permanent Residents | Men applicants | N/A | 14.3% | 14.6% | 14.2% | 15.2% | 27.5% |
| Visible Minority | Permanent Residents | Women appointments | 23.3% | 24.2% | 19.7% | 25.1% | 25.5% | 27.9% |
| Visible Minority | Permanent Residents | Men appointments | 22.0% | 24.7% | 25.2% | 23.3% | 24.1% | 21.6% |
| Visible Minority | Other non-citizens | Women applicants | N/A | 13.6% | 13.2% | 13.1% | 13.8% | 21.5% |
| Visible Minority | Other non-citizens | Men applicants | N/A | 14.3% | 14.6% | 14.2% | 15.2% | 19.1% |
| Visible Minority | Other non-citizens | Women appointments | 22.2% | 14.7% | 11.8% | 24.1% | 17.6% | 14.9% |
| Visible Minority | Other non-citizens | Men appointments | 11.1% | 17.6% | 13.7% | 20.4% | 19.6% | 25.3% |
| Representation type | Gender | 2015-2016 | 2016-2017 | 2017-2018 | 2018-2019 | 2019-2020 | 2020-2021 |
|---|---|---|---|---|---|---|---|
| Citizens | All | 43.4% | 43.4% | 43.1% | 39.4% | 40.7% | 37.7% |
| Citizens | Visible minority | 41.7% | 42.5% | 41.5% | 37.7% | 39.5% | 36.5% |
| Citizens | Visible minority - Men | N/A | 41.3% | 40.1% | 37.0% | 38.5% | 36.3% |
| Citizens | Visible minority - Women | N/A | 42.6% | 41.6% | 37.0% | 39.4% | 36.0% |
| Non-citizens | All | 35.1% | 35.3% | 31.1% | 26.0% | 26.1% | 24.6% |
| Non-citizens | Visible minority | 39.2% | 38.4% | 33.5% | 26.7% | 26.5% | 24.4% |
| Non-citizens | Visible minority - Men | N/A | 39.1% | 33.9% | 26.7% | 27.3% | 24.7% |
| Non-citizens | Visible minority - Women | N/A | 37.2% | 32.2% | 25.8% | 25.1% | 23.8% |
| Employment equity group | 2015-2016 | 2016-2017 | 2017-2018 | 2018-2019 | 2019-2020 | 2020-2021 |
|---|---|---|---|---|---|---|
| Indigenous peoples | 3.1% | 2.8% | 4.3% | 5.7% | 6.3% | 5.7% |
| Counterparts of Indigenous peoples | 9.6% | 9.8% | 12.4% | 14.8% | 16.2% | 17.4% |
| Members of visible minorities | 16.0% | 17.1% | 20.6% | 22.9% | 24.9% | 27.3% |
| Counterparts of members of visible minorities | 7.5% | 7.6% | 9.7% | 12.1% | 12.9% | 13.7% |
| Persons with disabilities | 2.9% | 3.3% | 4.1% | 4.4% | 5.1% | 5.4% |
| Counterparts of persons with disabilities | 9.5% | 9.7% | 12.4% | 14.8% | 16.2% | 17.5% |
| Women | N/A | 8.1% | 10.1% | 12.2% | 13.1% | 14.8% |
| Men | N/A | 12.7% | 16.1% | 18.9% | 20.8% | 21.5% |
| Visible Minority – Gender Identification | Representation type | Citizens | Non-citizens | Total |
|---|---|---|---|---|
| Women | Applicants | 10.3% | 3.7% | 14.0% |
| Women | Appointments | 12.9% | 0.6% | 13.5% |
| Men | Applicants | 7.6% | 3.4% | 11.0% |
| Men | Appointments | 8.9% | 0.6% | 9.5% |