
Federal public servants participating in jobs open to the public
- Most applicants to federal public service jobs advertised to the public are from outside the federal government (“external candidates”).
- Since 2016-2017, only 15 to 18 percent of applicants to jobs open to the public were federal public servants (“internal candidates”).
- However, internal candidates make up a much larger share of hires.
- In 2018-2019, 39 percent of all appointments stemming from jobs advertised to the public resulted in the appointment of an internal candidate.
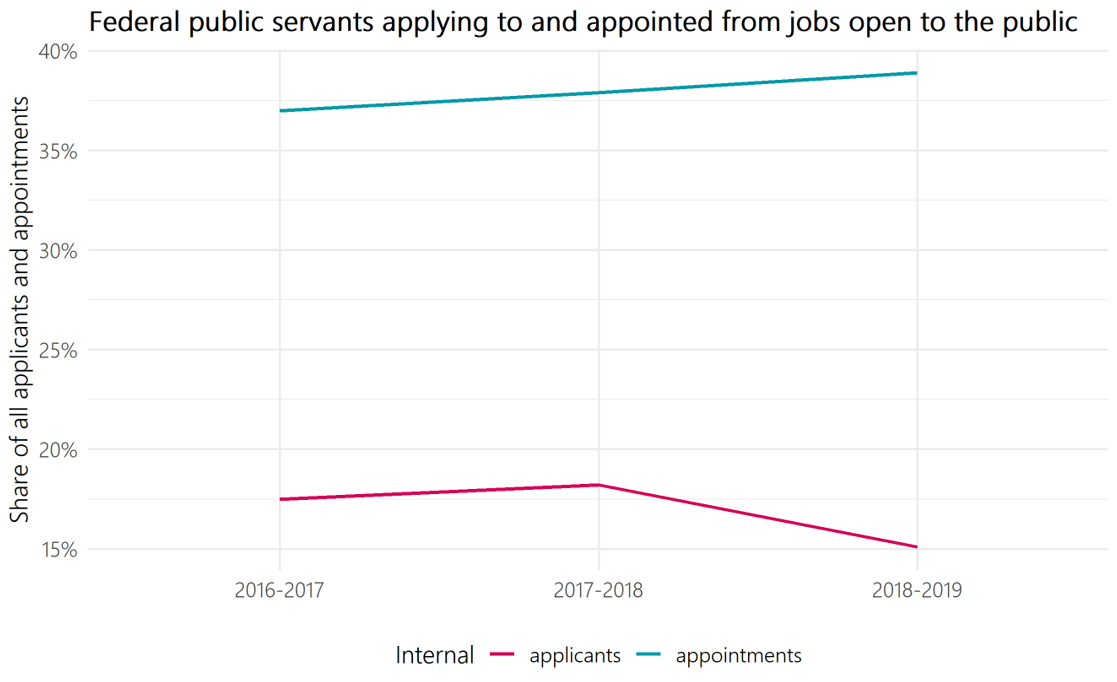
Text version
Fiscal year |
Share of applicants who are federal public servants |
Share of hires who are federal public servants |
|---|---|---|
2016-2017 |
17.5% |
37.0% |
2017-2018 |
18.2% |
37.9% |
2018-2019 |
15.1% |
38.9% |
Representation of federal public servants and of those applying from outside government
- Across all four employment equity groups, the representation amongst internal candidates who apply to or are appointed from jobs advertised to the public is higher than their representation amongst external candidates.
- With the exception of persons with disabilities, the representation of employment equity groups in jobs advertised to the public is above their respective workforce availability for both internal and external candidates.

Text version
| Representation type | 2016-2017 |
2017-2018 |
2018-2019 |
|---|---|---|---|
Applicants |
3.1% |
3.0% |
2.8% |
Appointments |
4.5% |
4.1% |
4.5% |
| Representation type | 2016-2017 |
2017-2018 |
2018-2019 |
|---|---|---|---|
Applicants |
4.5% |
4.3% |
4.6% |
Appointments |
5.5% |
5.3% |
5.2% |
| Representation type | 2016-2017 |
2017-2018 |
2018-2019 |
|---|---|---|---|
Applicants |
2.4% |
2.5% |
2.3% |
Appointments |
3.7% |
3.5% |
3.9% |
| Representation type | 2016-2017 |
2017-2018 |
2018-2019 |
|---|---|---|---|
Applicants |
4.4% |
4.7% |
4.8% |
Appointments |
4.6% |
4.7% |
4.9% |
| Representation type | 2016-2017 |
2017-2018 |
2018-2019 |
|---|---|---|---|
Applicants |
20.2% |
21.4% |
21.7% |
Appointments |
19.4% |
18.9% |
20.2% |
| Representation type | 2016-2017 |
2017-2018 |
2018-2019 |
|---|---|---|---|
Applicants |
24.8% |
25.5% |
25.7% |
Appointments |
20.0% |
20.7% |
21.6% |
| Representation type | 2016-2017 |
2017-2018 |
2018-2019 |
|---|---|---|---|
Applicants |
47.4% |
47.6% |
50.1% |
Appointments |
58.4% |
58.9% |
56.5% |
| Representation type | 2016-2017 |
2017-2018 |
2018-2019 |
|---|---|---|---|
Applicants |
52.3% |
52.2% |
54.2% |
Appointments |
63.5% |
60.8% |
60.7% |
Indigenous peoples
- Indigenous peoples have a higher representation rate amongst internal candidates than amongst external candidates at both the application and appointment stage.
- For both internal and external candidates, Indigenous people had a higher share of appointments than their representation as applicants.
- The share of external Indigenous candidate appointments is above their workforce availability of 4.0%, even though their share as external applicants was below the workforce availability.
Persons with disabilities
- Persons with disabilities applicants have a higher representation amongst internal candidates than amongst external candidates. A similar result is observed at the appointment stage.
- In contrast to the other groups, the share of applicants and appointments (internal or external) for persons with disabilities is below the workforce availability of 9.0% for persons with disabilities.
Visible minorities
- Visible minority applicants have a higher representation amongst internal candidates than amongst external candidates. Again, a similar result is observed at the appointment stage.
- In contrast to the other groups, for both internal and external candidates, visible minorities have a higher representation as applicants than at the appointment stage.
- Their share as applicants and appointments for internal and external candidates are above the workforce availability of 15.3% for visible minorities.
Women
- Women applicants had a higher representation amongst internal candidates when compared to representation amongst external candidates. This was also the case for their representation amongst those appointed.
- For both internal and external candidates, women had a higher share of appointments than their representation as applicants.
- The share of appointments for internal and external candidates is above the workforce availability of 52.5% for women. However, only the share of applicants for internal candidates in 2018-2019 is above workforce availability for women.
Methodology
For this analysis, all jobs open to the public for indeterminate and term positions for a duration of three months or greater that closed between April 1, 2016 and March 31, 2019 were evaluated. Similarly, all external hires and internal appointment types, including promotions, laterals, and deployments, for indeterminate and term positions for a duration of three months or greater between April 1, 2016 and March 31, 2019 are included.
We determine if applicants to jobs open to the public are from internal candidates by determining whether they provided a Personal Record Identifier (PRI) as part of their application. Providing a PRI is voluntary, so these results are a lower bound on the number of internal candidates applying to jobs open to the public. We assess whether internal candidates are appointed from jobs open to the public by matching existing public servants to Public Service Resourcing System (PSRS) applications using a deterministic record linkage process. For this assessment we consider all internal appointment types, including promotions, laterals, and deployments. The match rate of the record linkage process was 86%.
Employment equity status of applicants is based on their self-declaration provided in the PSRS application. For hires, we refer to their self-identification as collected by the Treasury Board Secretariat in the Employment Equity Data Bank (EEDB). The most recent available data from the EEDB is up to March 31, 2019.
The workforce availability (WFA) based on the 2016 Census was first publicly released in the 2018-2019 Report on Employment Equity. All fiscal years before 2018-2019 in this report are compared to the WFA based on the 2011 Census.
Employment equity designated groups |
Previous WFA benchmark (2011 Census) |
WFA benchmark (2016 Census) |
Women |
52.5% |
52.7% |
Indigenous peoples |
3.4% |
4.0% |
Persons with disabilities |
4.4% |
9.0% |
Members of visible minorities |
13.0% |
15.3% |
Source: Treasury Board Secretariat, Employment Equity in the Public Service of Canada for Fiscal Year 2018 to 2019