
Public Services and Procurement Canada
Planned spending and human resources: 2023 to 2024 Departmental Plan
Document navigation for "2023 to 2024 Departmental Plan"
On this page
This section provides an overview of Public Services and Procurement Canada (PSPC) planned spending and human resources for the next 3 fiscal years and compares planned spending for 2023 to 2024 with actual spending for the current year and the previous year.
Planned spending
The following graph presents planned spending (voted and statutory) over time.
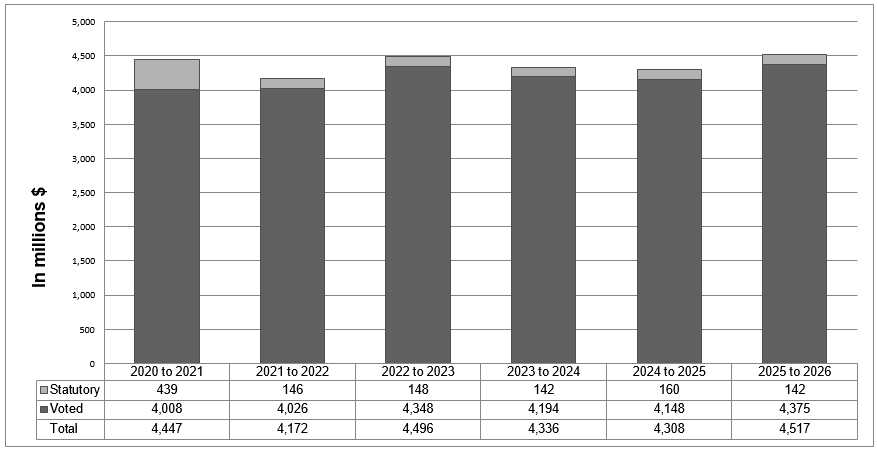
Departmental spending for the fiscal year 2020 to 2021 to the fiscal year 2025 to 2026: Text version
This bar graph illustrates the spending trend for Public Services and Procurement Canada for fiscal years 2020 to 2021, 2021 to 2022, 2022 to 2023, 2023 to 2024, 2024 to 2025 and 2025 to 2026. Financial figures are presented in dollars along the y-axis (vertical), starting at $0, ending at $5 million and increasing by $500 000. These are graphed against fiscal years 2020 to 2021 to 2025 to 2026 on the x-axis (horizontal)
There are 2 items identified for each fiscal year: statutory spending and voted spending.
In 2020 to 2021, actual spending was $439 million for statutory items and $4,008 million for voted items. The total was $4,447 million.
In 2021 to 2022, actual spending was $146 million for statutory items and $4,026 million for voted items. The total was $4,172 million.
In 2022 to 2023, forecast spending is $148 million for statutory items and $4,348 million for voted items. The total is $4,496 million.
In 2023 to 2024, planned spending is $142 million for statutory items and $4,194 million for voted items. The total is $4,336 million.
In 2024 to 2025, planned spending is $160 million for statutory items and $4,148 million for voted items. The total is $4,308 million.
In 2025 to 2026, planned spending is $142 million for statutory items and $4,375 million for voted items. The total is $4,517 million.
The departmental spending trend graph presents trends in PSPC’s planned and actual spending over time. The data representing actual spending (from fiscal year 2020 to 2021 to fiscal year 2021 to 2022), forecast spending (for fiscal year 2022 to 2023) and planned spending (for fiscal year 2023 to 2024 to fiscal year 2025 to 2026), is broken down between statutory and voted expenditures.
Analysis of the variances in actual spending, forecast spending and planned spending is provided in the budgetary planning summary for core responsibilities and internal services section.
The following table shows information on spending for each of PSPC’s core responsibilities and for its internal services for 2023 to 2024 and other relevant fiscal years.
| Core responsibilities and internal services | 2020 to 2021 actual expenditures | 2021 to 2022 actual expenditures | 2022 to 2023 forecast spending | 2023 to 2024 budgetary spending (as indicated in Main Estimates) | 2023 to 2024 planned spending | 2024 to 2025 planned spending | 2025 to 2026 planned spending |
|---|---|---|---|---|---|---|---|
| Purchase of goods and services | 505,799,452 | 248,612,162 | 179,715,858 | 165,857,889 | 165,857,889 | 156,827,378 | 157,440,393 |
| Payments and accounting | 620,095,297 | 584,208,702 | 626,578,435 | 318,700,151 | 318,700,151 | 318,329,073 | 317,683,322 |
| Property and infrastructure | 2,755,014,069 | 2,821,959,418 | 3,158,804,845 | 3,410,522,465 | 3,410,522,465 | 3,426,970,107 | 3,633,495,150 |
| Government-wide support | 181,625,449 | 155,082,347 | 160,252,956 | 156,544,379 | 156,544,379 | 136,961,762 | 135,580,873 |
| Procurement Ombudsman | 4,091,748 | 3,995,892 | 4,974,428 | 4,249,776 | 4,249,776 | 4,249,776 | 4,249,776 |
| Subtotal | 4,066,626,015 | 3,813,858,521 | 4,130,326,522 | 4,055,874,660 | 4,055,874,660 | 4,043,338,096 | 4,248,449,514 |
| Internal services | 380,244,932 | 358,493,710 | 365,925,580 | 279,731,031 | 279,731,031 | 264,490,871 | 268,056,036 |
| Total | 4,446,870,947 | 4,172,352,231 | 4,496,252,102 | 4,335,605,691 | 4,335,605,691 | 4,307,828,967 | 4,516,505,550 |
Totals may not add up due to rounding.
The variances observed are explained as follows:
- for 2023 to 2024, the department plans to spend approximately $161 million less than the 2022 to 2023 forecasted spending
- the decrease is due primarily to the following:
- the end of incremental funding received in order to stabilize the pay operations and decrease the backlog of pay transactions
- funding will be adjusted should future approvals be received
- the decrease in funding requirements for information technology projects
- partially offset by funding to deliver on the department’s property and infrastructure projects
- the end of incremental funding received in order to stabilize the pay operations and decrease the backlog of pay transactions
- the decrease is due primarily to the following:
- for 2025 to 2026, the department plans to spend $181 million more than in 2023 to 2024
- the increase is due primarily to the following:
- the department’s current funding approval to deliver on the modernization of its major infrastructure projects
- funding will be realigned should future approvals be received
- the department’s current funding approval to deliver on the modernization of its major infrastructure projects
- the increase is due primarily to the following:
The following table reconciles gross planned spending with net planned spending for 2023 to 2024.
| Core responsibilities and internal services | 2023 to 2024 planned gross spending | 2023 to 2024 planned revenues netted against expenditures | 2023 to 2024 planned net spending |
|---|---|---|---|
| Purchase of goods and services | 322,769,241 | 156,911,352 | 165,857,889 |
| Payments and accounting | 496,118,144 | 177,417,993 | 318,700,151 |
| Property and infrastructure | 6,545,459,787 | 3,134,937,322 | 3,410,522,465 |
| Government-wide support | 497,164,825 | 340,620,446 | 156,544,379 |
| Procurement Ombudsman | 4,249,776 | 0 | 4,249,776 |
| Subtotal | 7,865,761,773 | 3,809,887,113 | 4,055,874,660 |
| Internal services | 364,473,074 | 84,742,043 | 279,731,031 |
| Total | 8,230,234,847 | 3,894,629,156 | 4,335,605,691 |
The department’s major sources of revenues netted against expenditures are collected through the Real Property Federal Accommodation and Infrastructure Program as well as through its 3 active revolving funds.
The Real Property Services Revolving Fund (RPSRF) collects most revenues by providing real property services such as project delivery, facility management and advisory services. The Real Property Federal Accommodation and Infrastructure Program generates revenues mainly through:
- provision of spaces, conference rooms and parking
- preparation of spaces for occupancy
- production and distribution of utilities
Revenues are also collected through the Optional Services Revolving Fund (OSRF) which provides travel and vaccines procurement services, as well as through the Translation Bureau Revolving Fund (TBRF) which provides translation, interpretation and other linguistic services.
Planned human resources
The following table shows information on human resources, in full-time equivalents (FTEs), for each of PSPC’s core responsibilities and for its internal services for 2023 to 2024 and the other relevant years.
Human resources planning summary for core responsibilities and internal services
| Core responsibilities and internal services | 2020 to 2021 actual full‑time equivalents | 2021 to 2022 actual full-time equivalents | 2022 to 2023 forecast full-time equivalents | 2023 to 2024 planned full-time equivalents | 2024 to 2025 planned full-time equivalents | 2025 to 2026 planned full-time equivalents |
|---|---|---|---|---|---|---|
| Purchase of goods and services | 1,910 | 2,106 | 2,193 | 2,291 | 2,312 | 2,320 |
| Payments and accounting | 4,684 | 4,585 | 4,792 | 2,438 | 2,420 | 2,429 |
| Property and infrastructure | 4,226 | 4,405 | 4,650 | 4,718 | 4,777 | 4,845 |
| Government-wide support | 2,579 | 2,514 | 2,653 | 2,690 | 2,708 | 2,711 |
| Procurement Ombudsman | 29 | 28 | 29 | 30 | 30 | 30 |
| Subtotal | 13,428 | 13,638 | 14,317 | 12,167 | 12,246 | 12,335 |
| Internal services | 3,195 | 3,138 | 3,263 | 3,259 | 3,237 | 3,233 |
| Total | 16,623 | 16,776 | 17,580 | 15,426 | 15,483 | 15,569 |
Totals may not add up due to rounding.
Estimates by vote
Information on PSPC’s organizational appropriations is available in the 2023 to 2024 Government Expenditure Plan and Main Estimates.
Future-oriented condensed statement of operations
The future‑oriented condensed statement of operations provides an overview of PSPC’s operations for fiscal year 2022 to 2023 to fiscal year 2023 to 2024.
The forecast and planned amounts in this statement of operations were prepared on an accrual basis. The forecast and planned amounts presented in other sections of the departmental plan were prepared on an expenditure basis. Amounts may therefore differ.
A more detailed future‑oriented statement of operations and associated notes, including a reconciliation of the net cost of operations to the requested authorities, are available on Public Services and Procurement Canada’s website.
Future‑oriented condensed statement of operations for the year ending March 31, 2024 (in dollars)
| Financial information | 2022 to 2023 forecast results | 2023 to 2024 planned results | Difference (2023 to 2024 planned results minus 2022 to 2023 forecast results) |
|---|---|---|---|
| Total expenses | 6,995,729,403 | 6,461,278,617 | (534,450,786) |
| Total revenues | 3,381,890,256 | 3,091,088,598 | (290,801,658) |
| Net cost of operations before government funding and transfers | 3,613,839,147 | 3,370,190,019 | (243,649,128) |
The net cost of operations is forecasted to decrease by $243.6 million in 2023 to 2024 compared to 2022 to 2023. This decrease is primarily attributable to:
- the end of incremental funding received in order to stabilize the pay operations and decrease the backlog of pay transactions
- funding will be adjusted should future approvals be received
- the decrease in funding requirements for information technology projects