
Annex I: Self-identification data collection in support of equity, diversity and inclusion
This annex represents a data set drawn from the self-identification questionnaire for tri-agency and agency-specific (CIHR, NSERC, SSHRC and CFI) major funding opportunities from the 2023 competition year.Footnote 1 The tables and figures from the data set present a snapshot of self-identification information regarding the four designated groups as defined in the Employment Equity Act: women, Indigenous Peoples, members of visible minoritiesFootnote 2 and persons with disabilities.Footnote 3 Completing the self-identification questionnaire is mandatory; however, all questions provide an option to select “I prefer not to answer.”
The data set presents a summary of the application and award ratesFootnote 4,Footnote 5 of tri-agency and agency-specific major funding opportunities (Table 1a; Figures 1a-1d).Footnote 6 The data distinguish between application and award rates for research and training programs, and provide an overview of the nominations and active chairs awards for the Canada Research Chairs Program (CRCP) (Table 1b), as well as an overview of the team leaders for the CFI Innovation Fund (Table 1c).
Application and award rates for tri-agency and agency-specific major funding opportunities
Application and award rates for major funding opportunities for competition year 2023 are outlined below. The data are collected from the questionnaires completed by the individual who has the primary responsibility for the application. Data were suppressed for the application and award rates when the numerator was less than 10.
| Women | Indigenous Peoples | Persons with disabilities | Members of visible minorities | |||||
|---|---|---|---|---|---|---|---|---|
Research Program |
App. rate |
Award rate |
App. rate |
Award rate |
App. rate |
Award rate |
App. rate |
Award rate |
SSHRC Insight Grants |
49.0% |
50.7% |
1.8% |
2.2% |
6.9% |
6.7% |
26.7% |
23.9% |
SSHRC Partnership Grants |
61.0% |
63.9% |
2.1% |
- |
8.8% |
8.4% |
21.7% |
19.6% |
NSERC Discovery Grants |
23.6% |
23.9% |
0.6% |
0.6% |
3.2% |
2.8% |
33.1% |
29.3% |
NSERC Partnership GrantsFootnote * |
25.2% |
23.7% |
0.4% |
- |
2.5% |
2.8% |
35.3% |
35.7% |
New Frontiers in Research FundFootnote ** |
38.5% |
46.1% |
- |
- |
5.6% |
10.3% |
41.6% |
29.1% |
CIHR Project Grants |
36.3% |
37.4% |
0.8% |
- |
5.0% |
3.9% |
26.1% |
21.4% |
CFI John R. Evans Leaders Fund |
45.0% |
46.0% |
- |
- |
5.7% |
6.6% |
34.2% |
32.7% |
Training Program |
App. rate |
Award rate |
App. rate |
Award rate |
App. rate |
Award rate |
App. rate |
Award rate |
Canada Graduate Scholarships - Master'sFootnote ** |
61.8% |
64.8% |
2.8% |
2.8% |
12.3% |
12.0% |
28.4% |
27.8% |
Vanier Canada Graduate ScholarshipsFootnote ** |
58.6% |
53.6% |
5.6% |
6.6% |
13.3% |
13.3% |
40.3% |
39.2% |
Banting Postdoctoral FellowshipsFootnote ** |
38.7% |
34.3% |
- |
- |
8.9% |
- |
32.8% |
31.4% |
SSHRC Doctoral Awards |
64.6% |
66.2% |
4.8% |
3.3% |
18.5% |
17.8% |
24.2% |
25.1% |
SSHRC Postdoctoral Fellowships |
56.8% |
58.7% |
- |
- |
12.9% |
- |
21.6% |
19.3% |
NSERC Postdoctoral Fellowships |
34.2% |
40.3% |
- |
- |
7.4% |
- |
35.4% |
35.9% |
NSERC Postgraduate Scholarships (Doctoral) |
42.8% |
45.8% |
1.7% |
2.5% |
9.4% |
8.4% |
31.1% |
29.6% |
CIHR Postdoctoral Fellowships |
53.8% |
48.3% |
- |
- |
6.7% |
8.2% |
34.5% |
30.6% |
CIHR Doctoral Research Awards |
65.7% |
64.5% |
2.6% |
- |
12.5% |
11.8% |
37.1% |
42.4% |
Women and individuals from gender equity seeking groups |
Indigenous Peoples |
Persons with disabilities |
Racialized individuals |
|||||
Program |
NominationsFootnote * |
Representation (March 2024) |
NominationsFootnote * |
Representation (March 2024) |
NominationsFootnote * |
Representation (March 2024) |
NominationsFootnote * |
Representation (March 2024) |
Canada Research Chairs Program |
56.8%Footnote ** |
48.6% |
6.8% |
4.1% |
7.6% |
7.8% |
39.3% |
29.4% |
| Women | Indigenous Peoples | Persons with disabilities | Visible minorities | |||||
|---|---|---|---|---|---|---|---|---|
| Program | Application % | Award % | Application % | Award % | Application % | Award % | Application % | Award % |
CFI Innovation Fund |
30.5% |
30.3% |
- |
- |
5.6% |
8.4% |
23.6% |
21.3% |
Note: Figures 1a-1d below are visual representations of the data provided in Table 1a, above.
Figure 1a: Application and award rates for women by tri-agency and agency-specific funding opportunities
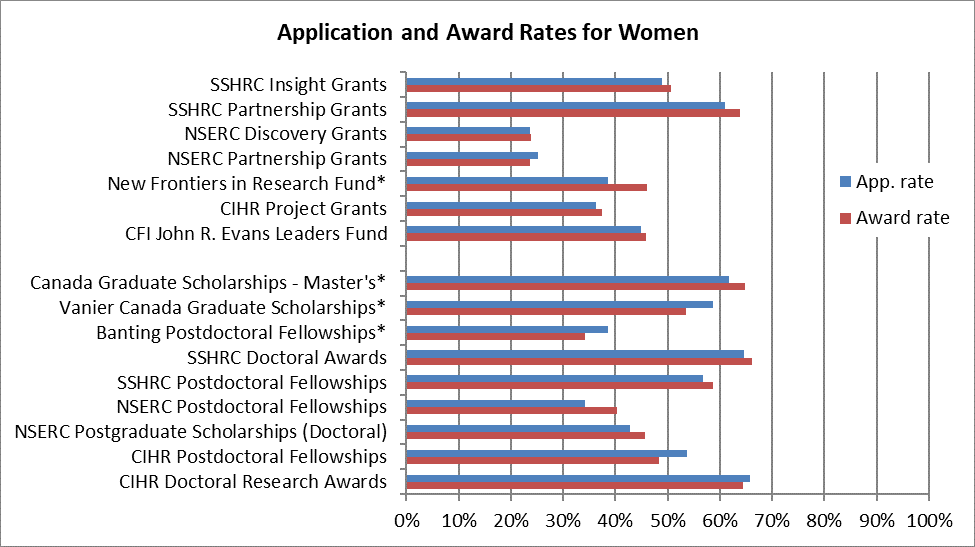
*Tri-agency funding opportunities
Description of Figure 1a
This horizontal bar graph shows, in percentages, the application and award rates for women by tri-agency and agency-specific funding opportunity for the 2023 competition year. The y-axis lists the funding opportunities. The x-axis shows the percentages, from 0 to 100%.
The New Frontiers in Research Fund, Canada Graduate Scholarships‒Master’s, Vanier Canada Graduate Scholarships and Banting Postdoctoral Fellowships are each marked with an asterisk to indicate they are tri-agency funding opportunities. All other funding opportunities listed are agency-specific.
The horizontal bar graph shows the application and award rates for women, by funding opportunity, as follows:
- For SSHRC Insight Grants, the application rate was 49.0% and the award rate was 50.7%.
- For SSHRC Partnership Grants, the application rate was 61.0% and the award rate was 63.9%.
- For NSERC Discovery Grants, the application rate was 23.6% and the award rate was 23.9%.
- For NSERC Partnership Grants, the application rate was 25.2% and the award rate was 23.7%.
- For the New Frontiers in Research Fund, the application rate was 38.5% and the award rate was 46.1%.
- For CIHR Project Grants, the application rate was 36.3% and the award rate was 37.4%.
- For the CFI John R. Evans Leaders Fund, the application rate was 45.0% and the award rate was 46.0%.
- For the Canada Graduate Scholarships‒Master’s program, the application rate was 61.8% and the award rate was 64.8%.
- For Vanier Canada Graduate Scholarships, the application rate was 58.6% and the award rate was 53.6%.
- For Banting Postdoctoral Fellowships, the application rate was 38.7% and the award rate was 34.3%.
- For SSHRC Doctoral Awards, the application rate was 64.6% and the award rate was 66.2%.
- For SSHRC Postdoctoral Fellowships, the application rate was 56.8% and the award rate was 58.7%.
- For NSERC Postdoctoral Fellowships, the application rate was 34.2% and the award rate was 40.3%.
- For the NSERC Postgraduate Scholarships–Doctoral program, the application rate was 42.8% and the award rate was 45.8%.
- For CIHR Postdoctoral Fellowships, the application rate was 53.8% and the award rate was 48.3%.
- For CIHR Doctoral Research Awards, the application rate was 65.7% and the award rate was 64.5%.
Figure 1b: Application and award rates for Indigenous Peoples by tri-agency and agency-specific funding opportunities

*Tri-agency funding opportunities
Description of Figure 1b
This horizontal bar graph shows, in percentages, the application and award rates for Indigenous Peoples, by tri-agency and agency-specific funding opportunity for the 2023 competition year. The y-axis lists the funding opportunities. The x-axis shows the percentages, from 0 to 10%.
The New Frontiers in Research Fund, Canada Graduate Scholarships‒Master’s, Vanier Canada Graduate Scholarships and Banting Postdoctoral Fellowships are each marked with an asterisk to indicate they are tri-agency funding opportunities. All other funding opportunities listed are agency-specific.
The horizontal bar graph shows the application and award rates for Indigenous Peoples, by funding opportunity, as follows:
- For SSHRC Insight Grants, the application rate was 1.8% and the award rate was 2.2%.
- For SSHRC Partnership Grants, the application rate was 2.1% and the award rate is represented by a dash. A dash indicates categories where fewer than 10 responses were received.
- For NSERC Discovery Grants, the application rate was 0.6% and the award rate was 0.6%.
- For NSERC Partnership Grants, the application rate was 0.4% and the award rate is represented by a dash. A dash indicates categories where fewer than 10 responses were received.
- For the New Frontiers in Research Fund, the application rate is represented by a dash and the award rate is represented by a dash. A dash indicates categories where fewer than 10 responses were received.
- For CIHR Project Grants, the application rate was 0.8% and the award rate is represented by a dash. A dash indicates categories where fewer than 10 responses were received.
- For the CFI John R. Evans Leaders Fund, the application rate is represented by a dash and the award rate is represented by a dash. A dash indicates categories where fewer than 10 responses were received.
- For the Canada Graduate Scholarships‒Master’s program, the application rate was 2.8% and the award rate was 2.8%.
- For Vanier Canada Graduate Scholarships, the application rate was 5.6% and the award rate was 6.6%.
- For Banting Postdoctoral Fellowships, the application rate is represented by a dash and the award rate is represented by a dash. A dash indicates categories where fewer than 10 responses were received.
- For SSHRC Doctoral Awards, the application rate was 4.8% and the award rate was 3.3%.
- For SSHRC Postdoctoral Fellowships, the application rate is represented by a dash and the award rate is represented by a dash. A dash indicates categories where fewer than 10 responses were received.
- For NSERC Postdoctoral Fellowships, the application rate is represented by a dash and the award rate is represented by a dash. A dash indicates categories where fewer than 10 responses were received.
- For the NSERC Postgraduate Scholarships–Doctoral program, the application rate was 1.7% and the award rate was 2.5%.
- For CIHR Postdoctoral Fellowships, the application rate is represented by a dash and the award rate is represented by a dash. A dash indicates categories where fewer than 10 responses were received.
- For CIHR Doctoral Research Awards, the application rate was 2.6% and the award rate is represented by a dash. A dash indicates categories where fewer than 10 responses were received.
Figure 1c: Application and award rates for persons with disabilities by tri-agency and agency-specific funding opportunities
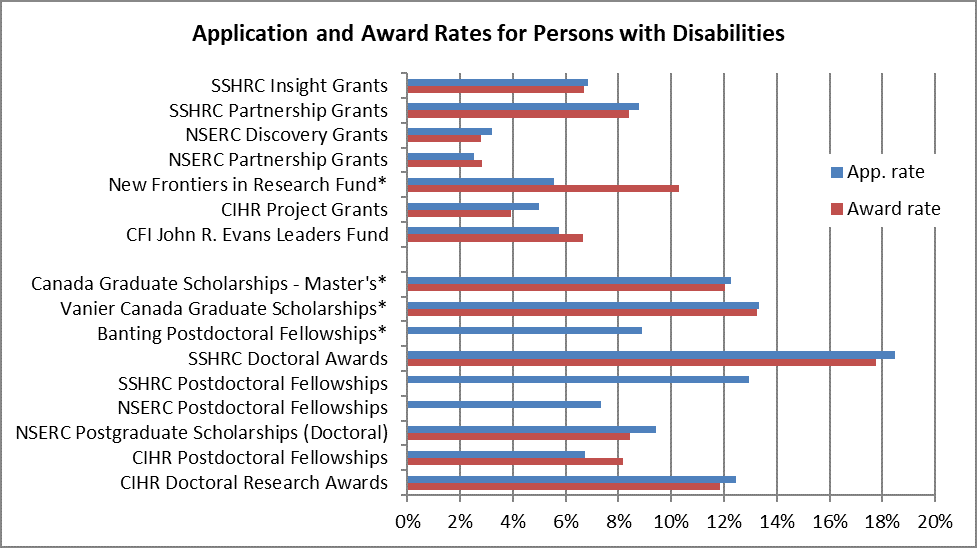
*Tri-agency funding opportunities
Description of Figure 1c
This horizontal bar graph shows, in percentages, the application and award rates for persons with disabilities by tri-agency and agency-specific funding opportunity for the 2023 competition year. The y-axis lists the funding opportunities. The x-axis shows the percentages, from 0 to 20%.
The New Frontiers in Research Fund, Canada Graduate Scholarships‒Master’s, Vanier Canada Graduate Scholarships and Banting Postdoctoral Fellowships are each marked with an asterisk to indicate they are tri-agency funding opportunities. All other funding opportunities listed are agency-specific.
The horizontal bar graph shows the application and award rates for persons with disabilities, by funding opportunity, as follows:
- For SSHRC Insight Grants, the application rate was 6.9% and the award rate was 6.7%.
- For SSHRC Partnership Grants, the application rate was 8.8% and the award rate was 8.4%.
- For NSERC Discovery Grants, the application rate was 3.2% and the award rate was 2.8%.
- For NSERC Partnership Grants, the application rate was 2.5% and the award rate was 2.8%.
- For the New Frontiers in Research Fund, the application rate was 5.6% and the award rate was 10.3%.
- For CIHR Project Grants, the application rate was 5.0% and the award rate was 3.9%.
- For the CFI John R. Evans Leaders Fund, the application rate was 5.7% and the award rate was 6.6%.
- For the Canada Graduate Scholarships‒Master’s program, the application rate was 12.3% and the award rate was 12.0%.
- For Vanier Canada Graduate Scholarships, the application rate was 13.3% and the award rate was 13.3%.
- For Banting Postdoctoral Fellowships, the application rate was 8.9% and the award rate is represented by a dash. A dash indicates categories where fewer than 10 responses were received.
- For SSHRC Doctoral Awards, the application rate was 18.5% and the award rate was 17.8%.
- For SSHRC Postdoctoral Fellowships, the application rate was 12.9% and the award rate is represented by a dash. A dash indicates categories where fewer than 10 responses were received.
- For NSERC Postdoctoral Fellowships, the application rate was 7.4% and the award rate is represented by a dash. A dash indicates categories where fewer than 10 responses were received.
- For the NSERC Postgraduate Scholarships–Doctoral program, the application rate was 9.4% and the award rate was 8.4%.
- For CIHR Postdoctoral Fellowships, the application rate was 6.7% and the award rate was 8.2%.
- For CIHR Doctoral Research Awards, the application rate was 12.5% and the award rate was 11.8%.
Figure 1d: Application and award rates for members of visible minorities by tri-agency and agency-specific funding opportunities

*Tri-agency funding opportunities
Description of Figure 1d
This horizontal bar graph shows, in percentages, the application and award rates for members of visible minorities by tri-agency and agency-specific funding opportunity for the 2023 competition year. The y-axis lists the funding opportunities. The x-axis shows the percentages, from 0 to 50%.
The New Frontiers in Research Fund, Canada Graduate Scholarships‒Master’s, Vanier Canada Graduate Scholarships and Banting Postdoctoral Fellowships are each marked with an asterisk to indicate they are tri-agency funding opportunities. All other funding opportunities listed are agency-specific.
The horizontal bar graph shows the application and award rates for members of visible minorities, by funding opportunity, as follows:
- For SSHRC Insight Grants, the application rate was 26.7% and the award rate was 23.9%.
- For SSHRC Partnership Grants, the application rate was 21.7% and the award rate was 19.6%.
- For NSERC Discovery Grants, the application rate was 33.1% and the award rate was 29.3%.
- For NSERC Partnership Grants, the application rate was 35.3% and the award rate was 35.7%.
- For the New Frontiers in Research Fund, the application rate was 41.6% and the award rate was 29.1%.
- For CIHR Project Grants, the application rate was 26.1% and the award rate was 21.4%.
- For the CFI John R. Evans Leaders Fund, the application rate was 34.2% and the award rate was 32.7%.
- For the Canada Graduate Scholarships‒Master’s program, the application rate was 28.4% and the award rate was 27.8%.
- For Vanier Canada Graduate Scholarships, the application rate was 40.3% and the award rate was 39.2%.
- For Banting Postdoctoral Fellowships, the application rate was 32.8% and the award rate was 31.4%.
- For SSHRC Doctoral Awards, the application rate was 24.2% and the award rate was 25.1%.
- For SSHRC Postdoctoral Fellowships, the application rate was 21.6% and the award rate was 19.3%.
- For NSERC Postdoctoral Fellowships, the application rate was 35.4% and the award rate was 35.9%.
- For the NSERC Postgraduate Scholarships–Doctoral program, the application rate was 31.1% and the award rate was 29.6%.
- For CIHR Postdoctoral Fellowships, the application rate was 34.5% and the award rate was 30.6%.
- For CIHR Doctoral Research Awards, the application rate was 37.1% and the award rate was 42.4%.
Notes:
- A dash (‒) indicates categories where fewer than 10 responses were received.
- The CRCP requires that all nominees submit a self-identification form as part of a complete nomination package; as such, the data presented in this table correspond to the nomination rate in 2023 funding cycles and program representation as of March 2024. This data must not be used to calculate award rates or success rates. For additional program statistics, consult the program website.
- The CRC nominations represent the number of nominations in all cycles of the reporting year (e.g. 2023-1 and 2023-2) in which nominees self-identify as a member of an underrepresented group.
- Program representation reflects the percentage of active chairs as of March 2024 who self-identify as a member of an underrepresented group.