
Report on hepatitis B and C in Canada: 2017
Download the alternative format
(PDF format, 1.35 MB, 35 pages)
Organization: Public Health Agency of Canada
Published: July 2019
Cat: HP37-22E-PDF
ISBN: 2369-3843
Pub.: 190057
Table of contents
- Foreword
- Acknowledgements
- Abbreviations
- List of figures and tables
- Executive summary
- 1.0 Introduction
- 2.0 Methods
- 3.0 Hepatitis B
- 3.1 Acute hepatitis B
- 3.2 Chronic hepatitis B
- 4.0 Hepatitis C
- 5.0 Discussion
- References
- Appendix A. Reporting rates of acute and chronic HBV infections in Canada by province and territory, CNDSS, 2008-2017
- Appendix B. Rates of reported acute and chronic HBV infections in Canada overall and by sex, CNDSS, 2008-2017
- Appendix C. Rates of reported HCV infections in Canada by sex, CNDSS, 2008-2017
- Appendix D. Rates of reported HCV infections in Canada by province and territory, CNDSS, 2008-2017
Foreword
The Centre for Communicable Diseases and Infection Control, Public Health Agency of Canada (PHAC), is pleased to present the Report on Hepatitis B and C in Canada: 2017. This report intends to provide information on trends in cases and rates of hepatitis B virus (HBV) and hepatitis C virus (HCV) infections to the public health community, to decision-makers and to the general public. This release follows the publication in April 2019 of a detailed Report on Hepatitis B and C in Canada: 2016.
Both HBV and HCV infections are notifiable in Canada. The Report on Hepatitis B and C in Canada: 2017 is based on surveillance data reported to the Canadian Notifiable Disease Surveillance System (CNDSS) by provincial and territorial health authorities.
Any comments and suggestions that would improve the usefulness of future publications are appreciated and should be sent to the attention of the staff of the Centre for Communicable Diseases and Infection Control, Public Health Agency of Canada at ccdic-clmti@phac-aspc.gc.ca.
Acknowledgements
The publication of this report would not have been possible without the collaboration of epidemiological units in all provinces and territories, whose continuous contribution to national HBV and HCV infection surveillance is gratefully appreciated.
This report was prepared by the Centre for Communicable Diseases and Infection Control, Infectious Disease Prevention and Control Branch, Public Health Agency of Canada.
Abbreviations
- AB
- Alberta
- BC
- British Columbia
- CCDIC
- Centre for Communicable Diseases and Infection Control
- CDC
- US Centres for Disease Control and Prevention
- CNDSS
- Canadian Notifiable Disease Surveillance System
- HBV
- Hepatitis B Virus
- HCV
- Hepatitis C Virus
- MB
- Manitoba
- NB
- New Brunswick
- NL
- Newfoundland and Labrador
- NS
- Nova Scotia
- NT
- Northwest Territories
- NU
- Nunavut
- ON
- Ontario
- PE
- Prince Edward Island
- PHAC
- Public Health Agency of Canada
- P/T
- Provincial/Territorial
- QC
- Quebec
- SK
- Saskatchewan
- US
- United States
- WHO
- World Health Organization
- YT
- Yukon
List of figures and tables
- Figure 1. Number of reported cases and rates of acute HBV infection by sex in Canada, CNDSS, 2008-2017
- Figure 2. Rates of reported cases of acute HBV infection by age group and sex in Canada, CNDSS, 2017
- Table 1. Number of reported cases and rates per 100,000 population of acute HBV infection by province/territory and sex in Canada, CNDSS, 2017
- Figure 3. Number of reported cases and rates of chronic HBV infection by sex in Canada, CNDSS, 2008-2017
- Table 2. Number of reported cases and rates per 100,000 population of chronic HBV infection by province/territory and sex in Canada, CNDSS, 2017
- Figure 4. Geographical distribution of chronic HBV infection rates across provinces and territories in Canada, CNDSS, 2017
- Figure 5. Number of reported cases and rates of HCV infection by sex in Canada, CNDSS, 2008-2017
- Figure 6. Rates of reported cases of HCV infection by age group in Canada, CNDSS, 2008-2017
- Figure 7. Rates of reported cases of HCV infection by age group and sex in Canada, CNDSS, 2017
- Table 3. Reported rates per 100,000 population and proportion of cases of HCV infection by age group and province/territory in Canada, CNDSS, 2017
- Table 4. Number of reported cases and rates per 100,000 population of HCV infection by province/territory and sex in Canada, CNDSS, 2017
- Figure 8. Geographical distribution of HCV infection rates across provinces and territories in Canada, CNDSS, 2017
Executive Summary
This report summarizes surveillance data on reported cases and rates of hepatitis B virus (HBV) infection and hepatitis C virus (HCV) infection in Canada, from 2008 to 2017. Cases of HBV and HCV are reported to the Canadian Notifiable Disease Surveillance System (CNDSS) by provincial and territorial health authorities. Information about acute HBV infection trends offers valuable insight into current transmission trends and patterns, while cases of chronic HBV infection and HCV infection represent the potential burden of disease in Canada. These rates represent diagnosis rates for a given year and should not be interpreted as prevalence or incidence rates.
Hepatitis B
In 2017, a total of 4,905 cases of HBV infection were reported in Canada: 192 cases of acute infection (corresponding to a rate of 0.5 per 100,000 population), 4,086 cases of chronic infection (corresponding to a rate of 11.4 per 100,000 population), and 627 cases of unspecified status. The total number of cases for 2017 (4,905) is similar to total number of cases reported in 2016 (4,985).
Acute infections
The rate of reported acute HBV infection cases decreased overall from 0.7 to 0.5 per 100,000 between 2008 and 2017. However, rates have been stabilizing in the past 5 years. Males had higher rates of acute infections than females between 2008 and 2017. Rates were highest among males 30-39 years of age and among females 25-29 years of age. In 2017, rates above the acute HBV infection national average rate of 0.5 per 100,000 were reported in Manitoba (1.6 per 100,000), New Brunswick (1.0 per 100,000), Ontario (0.8 per 100,000), and Nova Scotia (0.6 per 100,000).
Chronic infections
Overall, the rate of reported cases of chronic HBV infection has slightly decreased since 2011, from 13.9 to 11.4 per 100,000 population in 2017. It has declined in both males and females. Between 2008 and 2017, chronic HBV infection rates were consistently higher among males than among females. In 2017, rates above the chronic HBV infection national average rate of 11.4 per 100,000 were reported in British Columbia (21.7 per 100,000), Alberta (12.6 per 100,000), Yukon (12.6 per 100,000), and Ontario (12.5 per 100,000).
It is worth noting that the national HBV infection rates are influenced by variations in temporal and geographical reporting practices and should therefore be interpreted with caution. Provinces and territories differ in their capacity to distinguish HBV infections by status (acute vs. chronic) and therefore, HBV infection reporting is not uniform across the country.
Various potential factors may explain the trends described in this report. For example, Canada’s universal immunization program targeted at newborns and/or school-age children and, in some jurisdictions, at high-risk populations, has likely contributed to declining rates of acute HBV infection. Other public health and infection control interventions aimed at preventing the transmission of sexually transmitted and blood-borne infections may have also affected observed trends. However, some behaviors such as sharing contaminated injection drug use equipment or personal hygiene items can put one at risk of HBV infection. Some populations are also at risk of HBV because they did not have access to immunization programs due to a lack of access to the health system. This is the case for more isolated and vulnerable populations such as youth living on the street. High rates among migrants from endemic countries may also contribute to the chronic HBV burden.
Hepatitis C
Most provinces and territories do not report HCV infection differentiated into acute and chronic status. Therefore, for the purpose of this report, such differentiation is not highlighted, and all cases are reported as unspecified HCV infection and include acute, chronic, and resolved cases. Chronic HCV infections are likely to make up most of the HCV cases reported to the CNDSS as acute infection is usually asymptomatic and less likely to be diagnosed.
In 2017, a total of 11,592 cases of HCV infection were reported in Canada which corresponds to a rate of 31.7 per 100,000 population. Overall, the rate of reported cases of HCV infection declined by 11.1% over 2008-2017. The HCV rates decreased steadily from 2008 to 2012 and appear to be rising slightly since 2013. Over 2008-2017, reported HCV infection rates were consistently higher among males than females.
In 2017, the highest rates of HCV infection were reported in the 25-29 year age group for both sexes (66.3 per 100,000 for males and 56.7 per 100,000 for females), similar to the situation observed in 2015 and 2016. The highest relative increases in rates over 2008-2017 were observed in females between 20 to 29 years old and in males 60 and over as well as among the 25-29 year olds. The age profile for HCV cases differed across provinces and territories with half of them (6/13) having the majority of their cases and highest rates among those aged 20 to 39 years.
Provinces and territories with the highest overall rates of HCV infection were Saskatchewan (61.7 per 100,000), British Columbia (46.5 per 100,000), Manitoba (46.1 per 100,000) and the Yukon (45.4 per 100,000 population).
Advances in blood donation screening, infection control practices in health care settings and medical interventions have likely contributed to the overall observed reductions in rates of reported HCV infections in Canada in the past decades. It is also possible that public health interventions that seek to prevent transmission of infection among people who inject drugs have had an impact on these trends. However, the current opioid crisis in Canada as well as increased screening and testing might have contributed to the recent increase in HCV diagnosis observed in our surveillance data.
The numbers presented in this report represent trends in diagnosis of hepatitis C for a given year. The difficulties in ascertaining acute or chronic HCV infection status make it difficult to draw inferences about trends in either acute HCV infection or the burden of chronic infection. Acute status data would help assess the magnitude of incident infections in Canada. Likewise, the lack of risk factor data on reported HCV infections limits the interpretation of the findings presented in this report.
Conclusion
National statistics and trends of HBV and HCV infections are used to inform public health programs, guidelines, and recommendations. Based on available data, the observed HBV and HCV infection rates and trends from 2008 to 2017 substantiate the need for continued prevention and control efforts in Canada.
1.0 Introduction
The Hepatitis B virus (HBV) and the hepatitis C virus (HCV) are the causal agents of hepatitis B and hepatitis C respectively. Both viruses, although from two different virus families, mainly infect liver cells. Symptoms of HBV and HCV infection include jaundice, fatigue, and abdominal pain. Hepatitis B and hepatitis C can be acute or chronic, although HCV is more likely than HBV to cause a chronic infectionFootnote 1. About 25% of HCV infections will clear spontaneously Footnote 2. HBV infections acquired through vertical transmission from mother to child are more likely to progress to chronic infections than infections acquired in adulthood. Chronic infections may result in liver cirrhosis, hepatocellular carcinoma, decompensated liver disease and premature death Footnote 3. Chronic HCV infection is the main cause for liver transplants in Canada Footnote 4.
HBV is mainly transmitted through bodily fluids, during intercourse or other close contact with an infected person. Other modes of transmission for HBV include the use of contaminated drug injection equipment and mother-to-child transmission, for which the likelihood of transmission is high Footnote 3.
HCV transmission is essentially blood-borne (Footnote 5,Footnote 6). HCV can be transmitted sexually on rare occurrences, especially during traumatic sexual activities where bleeding can occur.
Sharing contaminated drug-use equipment, having lived in an endemic country or received medical treatment in a country with suboptimal prevention and control of infections in healthcare settings can put one at risk for hepatitis C; also, engaging in condomless sex acts that can cause tears and exposure to contaminated blood can increase one’s risk of HCV infection Footnote 7.
HBV vaccines have been available since the 1980s and all provinces and territories (P/Ts) in Canada have a universal newborn and/or childhood HBV vaccination program since the early 1990s. Treatment – although not a cure – is also available for hepatitis B to control virus replication.
Although there is no vaccine to prevent hepatitis C, new direct-acting antivirals (DAA) treatments have been approved by Health Canada since 2014 and constitute a major advance in the field. These highly effective drugs can cure HCV and are associated with fewer side effects (Footnote 8,Footnote 9). The treatment is taken orally for 8 to 12 weeks. The DAAs represent an opportunity to prevent HCV-related complications and to progress towards the elimination of this infection.
Given the potential for prevention interventions such as needle exchange and other harm reduction programs, and the availability of treatment of viral hepatitis and in order to alleviate the burden it causes globally, the World Health Organization (WHO) has issued in 2016 a Global Health Sector Strategy on Viral Hepatitis 2016-2021 Footnote 5. The overall goal is to achieve viral hepatitis elimination as a major public health threat by 2030 with a target of 90% decrease in incidence of HBV and HCV infections and 65% decrease in their associated mortality.
The global strategy was endorsed by Canada. In addition, the Public Health Agency of Canada released in 2018 its own Pan-Canadian STBBI Framework for Action that has been approved by federal, provincial and territorial ministers of health Footnote 10. The framework provides a vision and strategic goals to support cohesive action to address STBBIs in Canada across all sectors.
Following the release of the in-depth Report on hepatitis B and C: 2016 in March 2019 Footnote 7, this update on hepatitis B and C surveillance aims to provide the latest data for these two infections in Canada. Acute and chronic HBV rates and number of cases as well as overall HCV rates and number of cases are described by sex, age and province/territory.
2.0 Methods
2.1 Data sources
Provincial and territorial health authorities provide non-nominal data on laboratory-confirmed cases to PHAC through the Canadian Notifiable Disease Surveillance System (CNDSS). HBV infection has been notifiable in Canada since 1969 and the current national case definition defines acute, chronic, and unspecified infection status Footnote 11. HCV infection has been nationally notifiable since 1991 and new case definitions of acute and unspecified (including chronic, resolved and indeterminate) were published in 2011 Footnote 12.
Variables submitted along with the diagnosis include age at time of diagnosis, sex, year of diagnosis and P/T of diagnosis. The received data are validated in collaboration with the corresponding P/T. Data from January 1, 2008 to December 31, 2017 were extracted from the CNDSS in April 2019.
2.2 Data analysis
For HBV, reporting on disease status was phased in over time by P/Ts. Only P/Ts that reported acute or chronic HBV cases for a given year were included in annual acute and chronic rates computations for that year, respectively. Population estimates from jurisdictions not included in a particular analysis (acute or chronic) were removed from the overall denominator used to calculate corresponding national rates. Appendix A provides information on the years in which the P/Ts reported cases differentiated into acute and chronic HBV infection.
For HCV, most P/Ts confirm cases using antibody testing, which does not distinguish acute from chronic HCV infection, or current from resolved infection. Such cases are reported as unspecified HCV infection. Only four P/Ts report cases differentiated into acute and chronic HCV infection. Therefore, HCV data in this report are presented as unspecified infections, and include acute, chronic, resolved, and indeterminate HCV infections.
Descriptive analysis was performed using Microsoft Excel. National annual rates of reported cases of acute hepatitis B, chronic hepatitis B and unspecified hepatitis C were computed using the number of cases from the CNDSS as numerators, and Statistics Canada July 2018 yearly population estimates as denominators. Age group, sex and P/T-specific rates were also calculated. For all years, rates were given per 100,000 population. Rates, percentages, and percent change in rates were calculated using unrounded numbers. Thus, numbers presented may differ from calculations based on rounded numbers. No statistical procedures were used for comparative analyses.
Rates of overall hepatitis B and hepatitis C (both not stratified by status) by age group and sex over time can be retrieved from the Notifiable Disease Online website.
2.3 Data limitations
Small numbers are more susceptible to change therefore corresponding rates should be interpreted with caution. Previous reports may present different rates for some years due to reporting delays, to changes in reporting practices or in data updates from P/Ts or to improvements in data cleaning and validation. Unlike the reporting of acute HBV which was more consistent over the 2009-2016 timeframe, reporting of chronic HBV across jurisdictions was more heterogeneous over this same period. In addition, Prince Edward Island, Newfoundland and Labrador and Nunavut did not specify infection status for the HBV cases reported to CNDSS and have always reported hepatitis B cases as unspecified.
Once the data used for this report have been submitted by P/Ts, adjustments made to provincial/territorial data post-validation may not be reflected in that year’s national data, but will be updated in subsequent reports. Therefore, small discrepancies between the PHAC and P/T numbers are expected as a result of comparing dynamic databases. For any discrepancy between our report and the P/T reports, the P/T report should be seen as the most accurate. Larger discrepancies may be noted where P/Ts employ an analytic strategy that is different from what is used in this report. For instance, some jurisdictions choose to report chronic and unspecified HBV infections together as one category, while unspecified infections are excluded from analysis at the national level.
Finally, HBV and HCV surveillance data would be improved with the inclusion of more variables, (e.g. risk factor) as such information would provide additional insight and explanation into the observed trends. The HBV and HCV rates presented in this report are likely an underestimation of the true burden of infection in Canada as some infections will remain unscreened, undiagnosed and unreported. The rates presented constitute the current picture of the diagnosis of hepatitis B and C in Canada for a given year and should not be interpreted as prevalence or incidence rates.
3.0 Hepatitis B
In 2017, a total of 4,905 cases of Hepatitis B were reported in Canada: 192 cases of acute infection (corresponding to a rate of 0.5 per 100,000 population), 4,086 cases of chronic infection (corresponding to a rate of 11.4 per 100,000 population), and 627 cases of unspecified Hepatitis B infection. The total number of cases for 2017 (4,905 cases) is similar to total number of cases reported in 2016 (4,985).
3.1 Acute hepatitis B
3.1.1 Trends over time
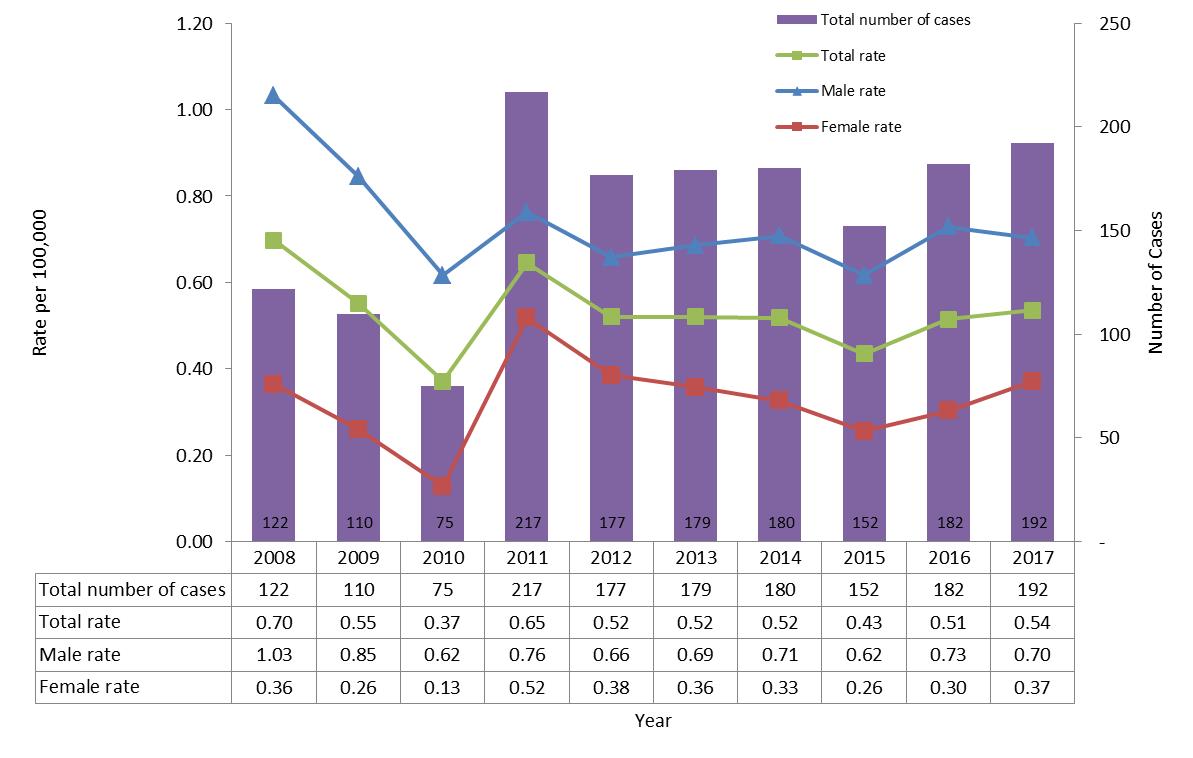
The number of reported cases of acute hepatitis B has remained relatively stable since 2012 (Figure 1). In 2011, an increase in rates and number of cases was observed, as a result of Ontario starting to report on acute cases. In 2017, the overall rate of acute infection was 0.54 per 100,000 while this rate was 0.51 per 100,000 in 2016. While the rate of acute hepatitis B among males decreased slightly between 2016 and 2017 (from 0.73 to 0.70 per 100,000, a 4% decrease), the rate of acute hepatitis B infection among females increased for a second consecutive year in 2017, from 0.30 in 2016 to 0.37 per 100,000 population in 2017 (23% increase). Overall national rates of acute HBV and rates by sex are presented in Appendix B.
Figure 1. Number of reported cases and rates of acute HBV infection by sex in CanadaFigure 1 Footnote 1 CNDSS, 2008-2017
- Figure 1 Footnote 1
-
Includes: For AB, BC, NB, QC, SK, YT: Data from 2008 to 2017; For MB, NT, NS: Data from 2009 to 2017; For ON: Data from 2011 to 2017.
Text Description
This graph displays the overall number of reported cases as well as the overall and sex-specific rates of reported acute hepatitis B cases, between 2008 and 2017 in Canada. The horizontal axis shows the calendar years from 2008 to 2017. The vertical axis shows the rate of reported acute hepatitis B cases per 100,000 population for male, female, and overall, as well as the overall number of reported cases of acute hepatitis B.
| Year | Overall Number of Cases | Rate per 100,000 people | ||
|---|---|---|---|---|
| Male | Female | Overall | ||
| 2008 | 122 | 1.03 | 0.36 | 0.70 |
| 2009 | 110 | 0.85 | 0.26 | 0.55 |
| 2010 | 75 | 0.62 | 0.13 | 0.37 |
| 2011 | 217 | 0.76 | 0.52 | 0.65 |
| 2012 | 177 | 0.66 | 0.38 | 0.52 |
| 2013 | 179 | 0.69 | 0.36 | 0.52 |
| 2014 | 180 | 0.71 | 0.33 | 0.52 |
| 2015 | 152 | 0.62 | 0.26 | 0.43 |
| 2016 | 182 | 0.73 | 0.30 | 0.51 |
| 2017 | 192 | 0.70 | 0.37 | 0.54 |
3.1.2 Rates of acute HBV infection by age group and sex in 2017
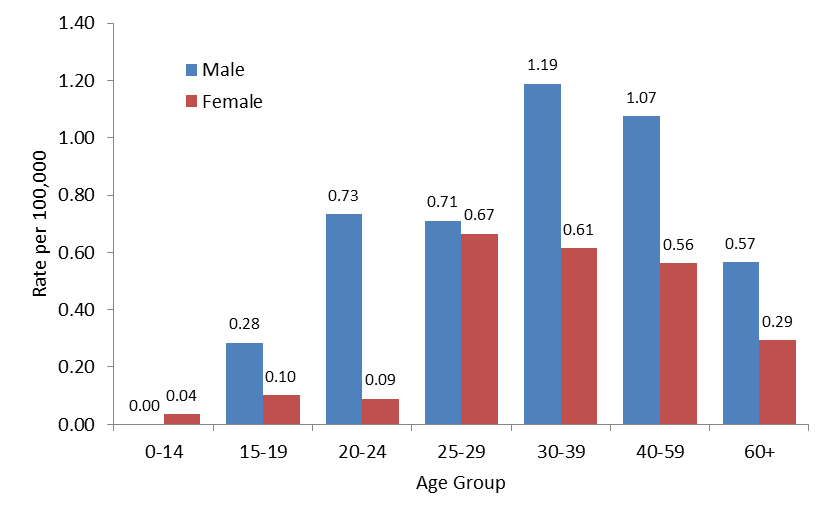
In 2017, acute Hepatitis B rates were highest in the 30-39 years of age group for males (rate of 1.19 per 100,000) and in the 25-29 years of age group for females (rate of 0.67 per 100,000). Male rates remained consistently higher than female rates for all age groups except for ages below 15 (Figure 2).
Figure 2. Rates of reported cases of acute HBV infection by age group and sex in CanadaFigure 2 Footnote 1 by age group and sex, CNDSS, 2016
- Figure 2 Footnote 1
-
Includes data from AB, BC, MB, NB, NS, NT, ON, QC, SK and YT.
Text Description
This graph displays the rate of reported acute hepatitis B cases by sex and age group, in 2017 in Canada. The horizontal axis shows the age groups from 0-14 years of age to over 60 years of age. The vertical axis shows the rate of reported acute hepatitis B cases per 100,000 population for males and females.
| Age Group | Rate per 100,000 people | |
|---|---|---|
| Male | Female | |
| 0-14 years | 0.00 | 0.04 |
| 15-19 years | 0.28 | 0.10 |
| 20-24 years | 0.73 | 0.09 |
| 25-29 years | 0.71 | 0.67 |
| 30-39 years | 1.19 | 0.61 |
| 40-59 years | 1.07 | 0.56 |
| 60+ years | 0.57 | 0.29 |
3.1.3 Rates of acute HBV by province and territory in 2017
Table 1 presents the number of reported cases and rates of acute hepatitis B infection by P/T and by sex. Rates above the acute hepatitis B national average rate of 0.5 per 100,000 were reported in Manitoba (1.6 per 100,000), New Brunswick (1.0 per 100,000), Ontario (0.8 per 100,000), and Nova Scotia (0.6 per 100,000).
Rates of acute hepatitis B by P/T from 2008 to 2017 are presented in Appendix A.
| Jurisdiction | Male | Female | TotalFootnote a | |||
|---|---|---|---|---|---|---|
| Number | Rate | Number | Rate | Number | Rate | |
| Canada | 125 | 0.7 | 67 | 0.4 | 192 | 0.5 |
| BC | 6 | 0.2 | 4 | 0.2 | 10 | 0.2 |
| AB | 16 | 0.7 | 5 | 0.2 | 21 | 0.5 |
| SK | 1 | 0.2 | 1 | 0.2 | 2 | 0.2 |
| MB | 15 | 2.2 | 6 | 0.9 | 21 | 1.6 |
| ON | 66 | 1.0 | 49 | 0.7 | 115 | 0.8 |
| QC | 8 | 0.2 | 1 | 0.0 | 9 | 0.1 |
| NB | 8 | 2.1 | 0 | 0.0 | 8 | 1.0 |
| NS | 5 | 1.1 | 1 | 0.2 | 6 | 0.6 |
| PE | NR | NR | NR | NR | NR | NR |
| NL | NR | NR | NR | NR | NR | NR |
| YT | 0 | 0.0 | 0 | 0.0 | 0 | 0.0 |
| NT | 0 | 0.0 | 0 | 0.0 | 0 | 0.0 |
| NU | NR | NR | NR | NR | NR | NR |
NR: Not reported that year
|
||||||
3.2 Chronic hepatitis B
Provinces and territories started reporting chronic cases of HBV infection in different years (Appendix A). Chronic HBV infection statistics presented in this report were adjusted to account for differences related to the variation in the year when each jurisdiction started the reporting. As a consequence, cautious interpretation of these statistics is recommended.
3.2.1 Trends over time
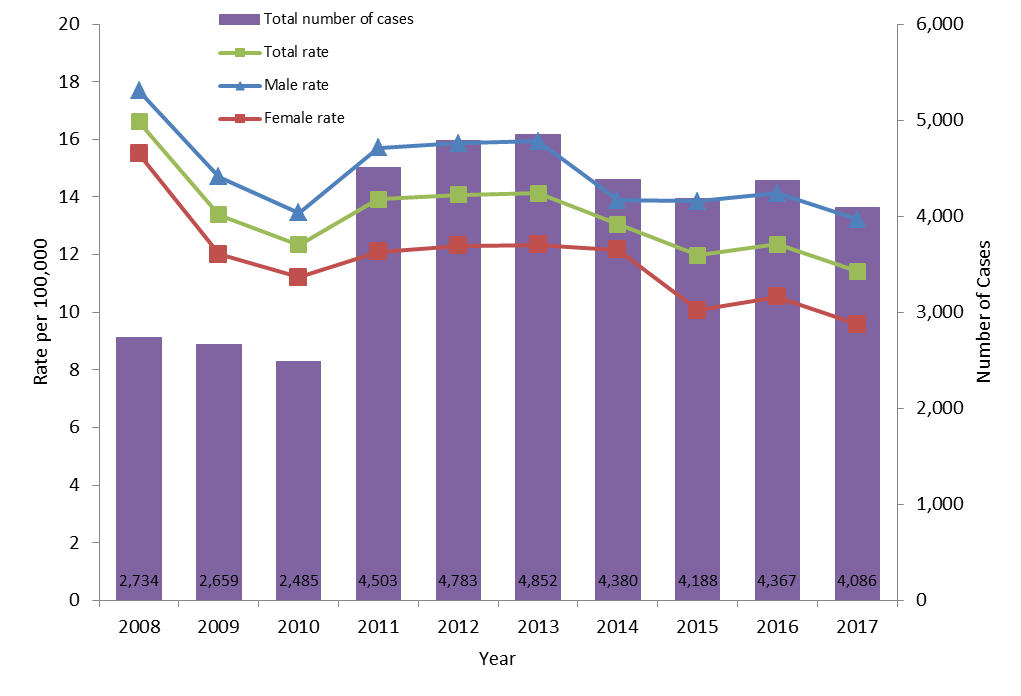
The rate of reported cases of chronic HBV infection fluctuated between 2008 and 2017 (Figure 3). As mentioned previously, this may be related to P/Ts with different rates joining the surveillance system in different years. For example, the number of cases of chronic HBV infection increased significantly in 2011 because Ontario began reporting on chronic HBV status that year. However, over the time period of 2008-2017, the overall chronic HBV infection rate has decreased from 16.6 to 11.4 per 100,000 population. It declined from 12.3 per 100,000 population in 2016 to 11.4 per 100,000 in 2017. The decrease was observed in both males and females (from 14.1 to 13.2 per 100,000 for males and from 10.5 to 9.6 per 100,000 for females). Males consistently had higher rates than females between 2008 and 2017.
The national rates of chronic HBV overall and by sex from 2008 to 2017 are presented in Appendix B.
Figure 3. Number of reported cases and rates of chronic HBV infection by sex in CanadaFigure 3 Footnote 1 CNDSS, 2008-2017
- Figure 3 Footnote 1
-
Includes: For AB, BC, NB, QC: Data from 2008 to 2017; For NS: Data from 2009 to 2017; For MB: Data from 2009 to 2010 and from 2012 to 2017; For SK: Data from 2009 to 2013 and from 2015 to 2017; For YT: Data from 2010 to 2017; For ON: Data from 2011 to 2017.
Text Description
This graph displays the overall number of reported cases as well as the overall and sex-specific rates of reported chronic hepatitis B cases, between 2008 and 2017 in Canada. The horizontal axis shows the calendar years from 2008 to 2017. The vertical axis shows the rate of reported chronic hepatitis B cases per 100,000 population for male, female, and overall, as well as the overall number of reported cases of chronic hepatitis B.
| Year | Overall Number of Cases | Rate per 100,000 people | ||
|---|---|---|---|---|
| Male | Female | Overall | ||
| 2008 | 2,734 | 17.70 | 15.50 | 16.62 |
| 2009 | 2,659 | 14.71 | 12.02 | 13.39 |
| 2010 | 2,485 | 13.45 | 11.21 | 12.35 |
| 2011 | 4,503 | 15.70 | 12.10 | 13.92 |
| 2012 | 4,783 | 15.87 | 12.30 | 14.08 |
| 2013 | 4,852 | 15.94 | 12.34 | 14.13 |
| 2014 | 4,380 | 13.89 | 12.17 | 13.05 |
| 2015 | 4,188 | 13.85 | 10.07 | 11.98 |
| 2016 | 4,367 | 14.13 | 10.54 | 12.35 |
| 2017 | 4,086 | 13.22 | 9.59 | 11.42 |
N/A: Not available
3.2.2 Rates of chronic HBV by province and territory in 2017
Table 2 presents the number of reported cases and rates of chronic hepatitis B infection by P/T and sex.
Rates of chronic hepatitis B by P/T from 2008 to 2017 are presented in Appendix A.
| Jurisdiction | Male | Female | TotalFootnote a | |||
|---|---|---|---|---|---|---|
| Number | Rate | Number | Rate | Number | Rate | |
| Canada | 2,348 | 13.2 | 1,728 | 9.6 | 4,086 | 11.4 |
| BC | 568 | 23.3 | 502 | 20.2 | 1,070 | 21.7 |
| AB | 334 | 15.6 | 200 | 9.5 | 534 | 12.6 |
| SK | 58 | 10.0 | 44 | 7.7 | 102 | 8.9 |
| MB | 84 | 12.6 | 45 | 6.7 | 129 | 9.7 |
| ON | 998 | 14.4 | 756 | 10.6 | 1,763 | 12.5 |
| QC | 269 | 6.5 | 151 | 3.6 | 421 | 5.1 |
| NB | 28 | 7.4 | 16 | 4.1 | 44 | 5.7 |
| NS | 7 | 1.5 | 11 | 2.3 | 18 | 1.9 |
| PE | NR | NR | NR | NR | NR | NR |
| NL | NR | NR | NR | NR | NR | NR |
| YT | 2 | 9.9 | 3 | 15.4 | 5 | 12.6 |
| NT | NR | NR | NR | NR | NR | NR |
| NU | NR | NR | NR | NR | NR | NR |
NR: Not reported that year
|
||||||
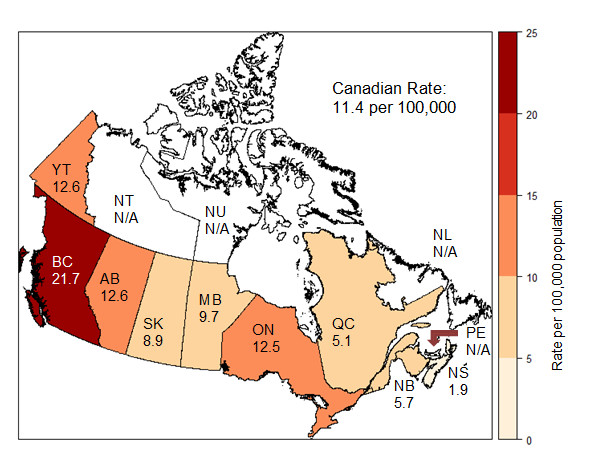
Rates of chronic Hepatitis B above the national average 11.4 per 100,000 were reported in British Columbia (21.7 per 100,000), Alberta (12.6 per 100,000), Yukon (12.6 per 100,000), and Ontario (12.5 per 100,000) (Figure 4).
N/A: Not available
Text Description
This map displays the rate of reported chronic hepatitis B cases per 100,000 population by province and territory, in 2017 in Canada.
| Jurisdiction | Rate per 100,000 population |
|---|---|
| Canada | 11.4 |
| BC | 21.7 |
| AB | 12.6 |
| SK | 8.9 |
| MB | 9.7 |
| ON | 12.5 |
| QC | 5.1 |
| NB | 5.7 |
| NS | 1.9 |
| PE | N/A |
| NL | N/A |
| YT | 12.6 |
| NT | N/A |
| NU | N/A |
N/A: Not available
4.0 Hepatitis C
4.1 Trends over time
In 2017, a total of 11,592 cases of Hepatitis C were reported in Canada which corresponds to a rate of 31.7 per 100,000 population. This represents an increase of 301 cases compared to 2016 when 11,291 cases were reported with a corresponding rate of 31.3 per 100,000 population. In 2017, most cases were reported among males (7,086, 61%) while 4,451 cases were reported among females.
Overall, the rate of reported cases of HCV infection declined by 11.1% over 2008-2017. However, the HCV rates have been increasing slightly since 2013 (Figure 5).
The number of cases and rates of HCV infection, overall and by sex, are presented in Appendix C.
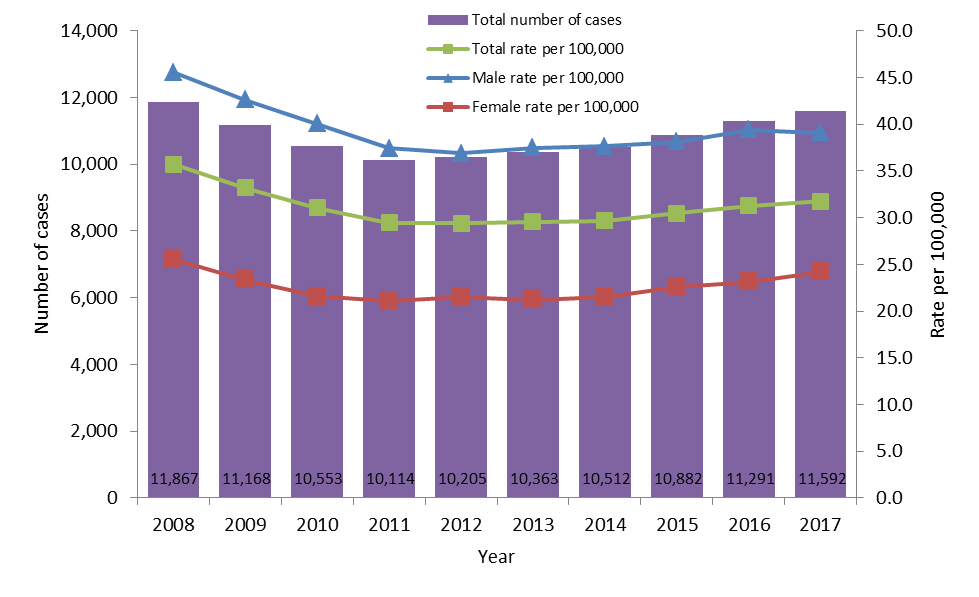
Text Description
This graph displays the overall number of reported cases as well as the overall and sex-specific rates of reported hepatitis C cases, between 2008 and 2017 in Canada. The horizontal axis shows the calendar years from 2008 to 2017. The vertical axis shows the rate of reported hepatitis C cases per 100,000 people for male, female, and overall, as well as the overall reported number of cases of hepatitis C.
| Year | Overall Number of Cases | Rate per 100,000 people | ||
|---|---|---|---|---|
| Male | Female | Overall | ||
| 2008 | 11,867 | 45.53 | 25.52 | 35.69 |
| 2009 | 11,168 | 42.63 | 23.33 | 33.21 |
| 2010 | 10,553 | 40.05 | 21.59 | 31.03 |
| 2011 | 10,114 | 37.42 | 21.11 | 29.45 |
| 2012 | 10,205 | 36.87 | 21.52 | 29.40 |
| 2013 | 10,363 | 37.50 | 21.21 | 29.54 |
| 2014 | 10,512 | 37.61 | 21.47 | 29.66 |
| 2015 | 10,882 | 38.14 | 22.57 | 30.48 |
| 2016 | 11,291 | 39.42 | 23.12 | 31.27 |
| 2017 | 11,592 | 39.08 | 24.18 | 31.72 |
4.2 Rates of HCV infection by age group and sex
From 2008 to 2017, some age groups experienced an increase in rates while a decrease was observed in other age groups. The two age groups which experienced a decrease in HCV rates were the 40-59 age group (39% decrease) and the 0-14 age group (37% decrease) (Figure 6).
The 60+ age group had the highest increase in HCV rates (47% increase), followed by the 25-29 age group (38% increase), and by the 20-24 age group (17% increase). The 30-39 age group and the 15-19 experienced a moderate increase in rates (4% and 1% respectively).
Figure 6. Rates of reported cases of HCV infection by age group in Canada, CNDSS, 2008-2017
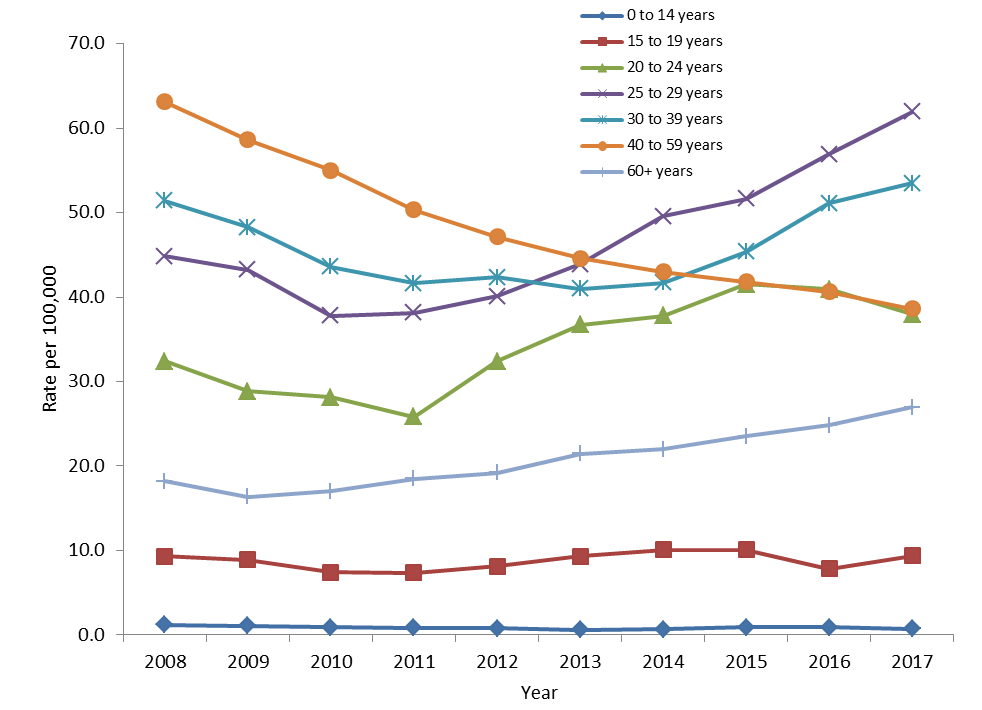
Text Description
This graph displays the rate of reported hepatitis C cases by age group and year, from 2008 to 2017 in Canada. The horizontal axis shows the calendar years from 2008 to 2017. The vertical axis shows the age groups from under 15 years of age to over 60 years of age and the rate of reported hepatitis C cases per 100,000.
| Rate per 100,000 population | |||||||
|---|---|---|---|---|---|---|---|
| Year | 0-14 years | 15-19 years | 20-24 years | 25-29 years | 30-39 years | 40-59 years | 60+ years |
| 2008 | 1.2 | 9.3 | 32.4 | 44.8 | 51.4 | 63.1 | 18. |
| 2009 | 1.1 | 8.9 | 28.9 | 43.2 | 48.3 | 58.6 | 16.4 |
| 2010 | 0.9 | 7.4 | 28.2 | 37.8 | 43.6 | 55.0 | 17.0 |
| 2011 | 0.8 | 7.3 | 25.8 | 38.2 | 41.6 | 50.3 | 18.5 |
| 2012 | 0.8 | 8.1 | 32.4 | 40.1 | 42.4 | 47.1 | 19.2 |
| 2013 | 0.6 | 9.3 | 36.7 | 43.9 | 41.0 | 44.6 | 21.5 |
| 2014 | 0.7 | 10.1 | 37.8 | 49.6 | 41.7 | 43.0 | 22.0 |
| 2015 | 0.9 | 10.1 | 41.5 | 51.7 | 45.4 | 41.8 | 23.5 |
| 2016 | 0.9 | 7.8 | 40.9 | 56.9 | 51.1 | 40.6 | 24.8 |
| 2017 | 0.7 | 9.4 | 38.0 | 62.0 | 53.5 | 38.6 | 26.9 |
Among males, the age groups with the highest increase in rates between 2008 and 2017 were the 60+ years old (70% increase) and the 25-29 year olds (30% increase). A decrease in rates was observed among males 14 and younger (46% decrease) and among males 40-59 (42% decrease).
Among females, the age groups with the highest increase in rates between 2008 and 2017 were the 25-29 years old (50% increase) and the 20-24 year olds (22% increase). A decrease in rates was observed among females 14 and younger (27% decrease) and among females age 40-59 (30% decrease).
In 2017, the highest rates of HCV infection were reported in the 25-29 years of age group for both sexes (66.3 per 100,000 for males and 56.7 per 100,000 for females) (Figure 7). Males consistently had higher rates of HCV compared to females in all age groups except those younger than 25 years of age.
Figure 7. Rates of reported cases of HCV infection by age group and sex in Canada, CNDSS, 2017
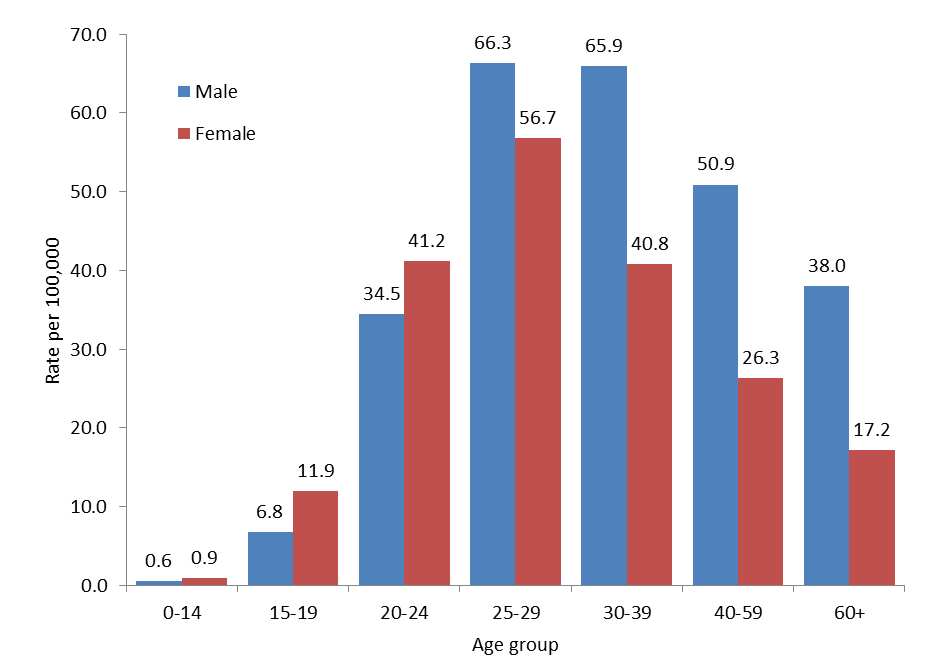
Text Description
This graph displays the rate of reported hepatitis C cases by sex and age group, in 2017 in Canada. The horizontal axis shows the age groups from under 15 years of age to over 60 years of age. The vertical axis shows the rate of reported hepatitis C cases per 100,000 for males and females.
| Age Group | Rate per 100,000 population | |
|---|---|---|
| Male | Female | |
| 0-14 years | 0.6 | 0.9 |
| 15-19 years | 6.8 | 11.9 |
| 20-24 years | 34.5 | 41.2 |
| 25-29 years | 66.3 | 56.7 |
| 30-39 years | 65.9 | 40.8 |
| 40-59 years | 50.9 | 26.3 |
| 60+ years | 38.0 | 17.2 |
In 2017, the highest proportion of HCV cases in Canada was reported in the 20-39 years of age group with 44.3% of total cases, which corresponds to a rate of 51.9 per 100,000 for this age group. The 20-39 years of age group only represents 27% of the total population in Canada in 2017. Therefore, there was an over-representation of this age group among hepatitis C cases.
4.3 Rates of HCV infection by province and territory
When looking at proportion of cases by age group and rates by age group in each P/T, it appears that the HCV epidemics age profile varies greatly across P/Ts (Table 3). All Atlantic Provinces and the Prairies provinces (NB, NS, PE, NL, MB and SK) had the majority of their cases (>50%) and the highest HCV rates in the 20-39 age group. AB, BC and ON also had the highest proportion of cases in the 20-39 age group (although lower than 50%) and a high proportion of cases among those age 40-59 as well. QC and NT had their highest proportion of cases and highest rates among those aged 40 to 59. YT had the highest number of cases among those aged 40-59 but the highest rates were found among those 60+.
| Jurisdiction | 0-19 | 20-39 | 40-59 | 60+ | ||||
|---|---|---|---|---|---|---|---|---|
| Proportion of Total Cases | Rate | Proportion of Total Cases | Rate | Proportion of Total Cases | Rate | Proportion of Total Cases | Rate | |
| Canada | 2.1% | 3.0 | 44.3% | 51.9 | 33.8% | 38.6 | 19.8% | 26.9 |
| BC | 1.3% | 3.0 | 40.8% | 70.0 | 32.6% | 53.9 | 25.4% | 47.7 |
| AB | 2.0% | 2.9 | 39.2% | 44.8 | 37.3% | 48.5 | 21.5% | 41.6 |
| SK | 3.1% | 7.5 | 60.1% | 131.9 | 30.3% | 74.8 | 6.5% | 18.8 |
| MB | 2.8% | 5.0 | 59.3% | 98.0 | 28.6% | 51.5 | 9.4% | 20.6 |
| ON | 2.2% | 3.3 | 44.1% | 54.4 | 33.3% | 39.7 | 20.4% | 29.7 |
| QC | 1.4% | 0.8 | 29.0% | 13.5 | 44.3% | 19.3 | 25.3% | 12.0 |
| NB | 1.6% | 2.6 | 56.3% | 79.4 | 32.8% | 36.0 | 9.3% | 10.7 |
| NS | 3.1% | 4.8 | 58.5% | 74.6 | 27.2% | 29.4 | 11.2% | 12.6 |
| PE | 2.7% | 3.1 | 59.5% | 61.3 | 18.9% | 16.6 | 18.9% | 17.5 |
| NL | 6.2% | 10.8 | 68.9% | 101.0 | 19.8% | 22.0 | 5.1% | 6.1 |
| YT | 0.0% | 0.0 | 16.7% | 25.9 | 44.4% | 66.9 | 38.9% | 95.7 |
| NT | 0.0% | 0.0 | 16.7% | 7.0 | 66.7% | 30.9 | 16.7% | 17.6 |
| NU | NR | NR | NR | NR | NR | NR | NR | NR |
NR: Not reported that year
In 2017, the sex profile of hepatitis C cases was more similar across P/Ts. In fact, in all P/Ts (except for NT that reported only 6 cases for 2017), the number of cases among males and rates among males were higher than rates among females (Table 4).
Rates of reported HCV infections by P/T from 2008 to 2017 are presented in Appendix D.
| Jurisdiction | Male | Female | TotalTable 4 Footnote 1 | |||
|---|---|---|---|---|---|---|
| Number of cases | Rate per 100,000 | Number of cases | Rate per 100,000 | Number of cases | Rate per 100,000 | |
| Canada | 7,086 | 39.1 | 4,451 | 24.2 | 11,592 | 31.7 |
| BC | 1,467 | 60.2 | 822 | 33.1 | 2,291 | 46.5 |
| AB | 916 | 42.8 | 561 | 26.6 | 1,478 | 34.8 |
| SK | 421 | 72.6 | 289 | 50.6 | 710 | 61.7 |
| MB | 341 | 51.1 | 269 | 40.2 | 616 | 46.1 |
| ON | 2,803 | 40.4 | 1,867 | 26.2 | 4,697 | 33.4 |
| QC | 659 | 15.9 | 343 | 8.2 | 1,021 | 12.3 |
| NB | 157 | 41.4 | 90 | 23.2 | 247 | 32.2 |
| NS | 180 | 38.7 | 114 | 23.5 | 294 | 30.9 |
| PE | 21 | 28.5 | 16 | 20.8 | 37 | 24.6 |
| NL | 106 | 40.5 | 71 | 26.6 | 177 | 33.5 |
| YT | 12 | 59.5 | 6 | 30.8 | 18 | 45.4 |
| NT | 3 | 13.0 | 3 | 13.7 | 6 | 13.4 |
| NU | NR | NR | NR | NR | NR | NR |
NR: Not reported that year
|
||||||
P/Ts with the highest overall HCV rates were Saskatchewan (61.7 per 100,000), British Columbia (46.5 per 100,000), Manitoba (46.1 per 100,000) and Yukon (45.4 per 100,000 population) (Figure 8).
Figure 8. Geographical distribution of HCV infection rates across provinces and territories in Canada, CNDSS, 2017
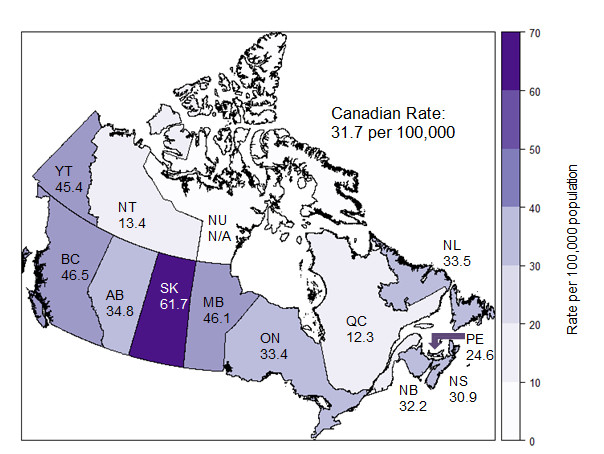
N/A: Not available
Text Description
This map displays the rate of reported hepatitis C cases by province and territory, in 2017 in Canada.
| Jurisdiction | Rate per 100,000 population |
|---|---|
| Canada | 31.7 |
| BC | 46.5 |
| AB | 34.8 |
| SK | 61.7 |
| MB | 46.1 |
| ON | 33.4 |
| QC | 12.3 |
| NB | 32.2 |
| NS | 30.9 |
| PE | 24.6 |
| NL | 33.5 |
| YT | 45.4 |
| NT | 13.4 |
| NU | N/A |
N/A: Not available
5.0 Discussion
Hepatitis B and hepatitis C are major causes of liver disease, illness and death; surveillance activities are important to monitor trends of those infections, to contribute to the development of evidence-based public policies and recommendations on testing and access to treatment, and to the evaluation of public health interventions such as vaccination for hepatitis B.
Acute HBV cases offer valuable insight into current transmission trends and patterns, as cases diagnosed and reported as acute infection approximate incident cases (i.e., those that have been recently acquired). The decreasing rates of acute HBV infection in Canada that were observed in the 1990s and the 2000s may be attributable to the implementation of routine immunization programs in all P/Ts, starting in the early 1990s and to improved blood screening and infection prevention and control practices in health care settings Footnote 7.
However, since 2011, rates of acute HBV cases have been stable. A similar trend is observed in the United States, with stable or increasing acute HBV infection rates, possibly due to increasing injection drug use Footnote 13. In Canada, although rates of acute HBV cases were consistently higher among males compared to females over 2008-2017, a higher increase in those rates was observed among females in 2017 for a second consecutive year. In 2017, rates of acute HBV were highest among males between 30 and 59 years of age and among females between 25 and 39 years of age. Unvaccinated, isolated or vulnerable populations along with migration from endemic countries may also contribute to the HBV burden in Canada (Footnote 14,Footnote 15).
Understanding the magnitude of chronic HBV infection in Canada is important as it represents the burden of disease in Canada and the potential for transmission as the period of communicability of chronic infections is longer than the one of acute infections. The rate of chronic reported HBV infections seems to have decreased slightly in Canada since 2011.
Comparably, from 2008 to 2017, there was an overall decline of 11.1% in HCV rates of reported cases. However, rates are slightly increasing since 2013 after having declined for a number of years. Again, a similar situation was observed in the United States (US). The US Centers for Disease Control and Prevention (CDC) reported an increase in acute cases of hepatitis C since 2010 in both men and women with an overall 3.5-fold increase from 2010 through 2016 after a decline of 48.2% between 2001 and 2010 Footnote 16. Among those with known risk factors, injection drug use was the most frequently reported risk exposure. Reasons for rising rates were said to be related to an increase in injection drug use and to a lesser extent, to improved case detection. The current public health crisis of opioid overdoses may add another burden in populations such as people who inject drugs who are concurrently affected by the opioid epidemic and by hepatitis C. A comprehensive and integrated approach to STBBIs is needed, especially in key populations who experience syndemics, as highlighted by the Pan-Canadian STBBI Framework for Action Footnote 10.
In Canada, male HCV rates of reported cases were higher than female rates throughout 2008-2017. In 2017, the highest rates of reported HCV infections were reported among the 25-29 year olds among both males and females. Although this has been the case for females since 2009, the fact that highest rates are found in males aged 25-29 years is a more recent trend, as older male populations had higher rates in the past. This highlights the need for increased prevention and treatment in that age group.
New highly effective direct-acting antiviral (DAA) treatments are making a difference in the HCV epidemic; they provide an opportunity for broad treatment scale-up, as they might now be more acceptable to high risk populations such as people who inject drugs, given their shorter treatment duration and better tolerability (Footnote 17,Footnote 18). One challenge raised by hepatitis C treatment is the possibility of a higher risk of reinfection if risk behaviours are continued (Footnote 19,Footnote 20,Footnote 21). Concurrent strategies for prevention, testing, initiation of care and treatment and ongoing care and support are needed to reduce the risk of reinfection Footnote 10.
In addition to local, provincial and territorial initiatives to tackle the HCV epidemics in Canada, the federal government has released a Pan-Canadian STBBI Framework for Action in July 2018 Footnote 10. The framework provides a vision and strategic goals to support cohesive action to address STBBIs in Canada. The strategic goals of the framework include decreasing the incidence of STBBIs in Canada, improving access to testing, treatment, and ongoing care and support and reducing stigma and discrimination that create vulnerabilities to STBBIs. Additionally, the Government of Canada Action Plan on STBBIs will be released this summer. It will highlight actions that federal departments and agencies will undertake over the next 5 years to contribute to achieving the goals of the Framework for Action.
Conclusion
The rates of reported acute HBV infections are stable while the rate of HCV infections appears to be slightly increasing in Canada. Given the potential for these infections to progress to more serious conditions and the consequent potential burden on Canada’s health care system, continued monitoring is essential.
To improve the ability of surveillance data to help monitor Canada’s progress towards prevention and control of HCV infection, additional efforts are being made to harmonize the reporting of hepatitis C cases by stage of infection in routine surveillance. Surveillance, supported by research that examines factors affecting observed trends, can contribute to the development of tailored interventions to address HCV infections in Canada.
References
- Reference 1
-
Rehermann B, Nascimbeni M. Immunology of hepatitis B virus and hepatitis C virus infection. Nat Rev Immunol 2005 Mar;5(3):215-229.
- Reference 2
-
Grebely J, Prins M, Hellard M, Cox AL, Osburn WO, Lauer G, et al. Hepatitis C virus clearance, reinfection, and persistence, with insights from studies of injecting drug users: towards a vaccine. Lancet Infect Dis 2012 May;12(5):408-414.
- Reference 3
-
Heymann D editor. Control of communicable diseases manual. 19th ed. United States of America: American Public Health Association 2008.
- Reference 4
-
Canadian Liver Foundation. Liver disease in Canada: A Crisis In The Making. 2013;2018 (March 26).
- Reference 5
-
World Health Organization. Global Health Sector Strategy on Viral Hepatitis 2016-2021. 2016;2018(March 26).
- Reference 6
-
World Health Organization. Hepatitis B. 2017; Available at: http://www.who.int/mediacentre/factsheets/fs204/en/. Accessed July 5, 2019.
- Reference 7
-
Public Health Agency of Canada. Report on Hepatitis B and C in Canada: 2016. 2019. Available at: https://www.canada.ca/en/services/health/publications/diseases-conditions/report-hepatitis-b-c-canada-2016.html.
- Reference 8
-
Pawlotsky JM. New hepatitis C therapies: the toolbox, strategies, and challenges. Gastroenterology 2014 May;146(5):1176-1192.
- Reference 9
-
Falade-Nwulia O, Suarez-Cuervo C, Nelson DR, Fried MW, Segal JB, Sulkowski MS. Oral Direct-Acting Agent Therapy for Hepatitis C Virus Infection: A Systematic Review. Ann Intern Med 2017 May 2;166(9):637-648.
- Reference 10
-
Public Health Agency of Canada. Reducing the Health Impact of Sexually Transmitted and Blood Borne Infections in Canada by 2030: A Pan-Canadian Framework for Action. June 2018. Available at: https://www.canada.ca/en/public-health/services/infectious-diseases/sexual-health-sexually-transmitted-infections/reports-publications/sexually-transmitted-blood-borne-infections-action-framework.html
- Reference 11
-
Public Health Agency of Canada. Case Definitions for Communicable Diseases under National Surveillance - 2009. 2009; Available at: https://www.canada.ca/en/public-health/services/reports-publications/canada-communicable-disease-report-ccdr/monthly-issue/2009-35/definitions-communicable-diseases-national-surveillance.html. Accessed July 20, 2017.
- Reference 12
-
Public Health Agency of Canada. National Case Definition: Hepatitis C. 2011; Available at: https://www.canada.ca/en/public-health/services/diseases/hepatitis-c/health-professionals-hepatitis-c/national-case-definition.html.
- Reference 13
-
Harris AM, Iqbal K, Schillie S, Britton J, Kainer MA, Tressler S, et al. Increases in Acute Hepatitis B Virus Infections - Kentucky, Tennessee, and West Virginia, 2006-2013. MMWR Morb Mortal Wkly Rep 2016 Jan 29;65(3):47-50.
- Reference 14
-
Greenaway C, Narasiah L, Plourde P, Ueffing E, Pottie K, Deschenes M, et al. Appendix 5: Hepatitis B: evidence review for newly arriving immigrants and refugees. Canadian Medical Association Journal, CMAJ 2011;183(12).
- Reference 15
-
World Health Organization. Hepatitis B vaccines. Weekly Epidemiological Record 2009;84(40):405-420.
- Reference 16
-
Centers for Disease Control and Prevention. Viral Hepatitis Surveillance –United States, 2016.
- Reference 17
-
Roy E, Nonn E, Haley N, Cox J. Hepatitis C meanings and preventive strategies among street-involved young injection drug users in Montreal. Int J Drug Policy 2007 Oct;18(5):397-405.
- Reference 18
-
Harris M, Rhodes T. Hepatitis C treatment access and uptake for people who inject drugs: a review mapping the role of social factors. Harm Reduct J 2013 May 7;10:7-7517-10-7.
- Reference 19
-
Simmons B, Saleem J, Hill A, Riley RD, Cooke GS. Risk of Late Relapse or Reinfection With Hepatitis C Virus After Achieving a Sustained Virological Response: A Systematic Review and Meta-analysis. Clin Infect Dis 2016 Mar 15;62(6):683-694.
- Reference 20
-
Ingiliz P, Martin TC, Rodger A, Stellbrink HJ, Mauss S, Boesecke C, et al. HCV reinfection incidence and spontaneous clearance rates in HIV-positive men who have sex with men in Western Europe. J Hepatol 2017 Feb;66(2):282-287.
- Reference 21
-
Hajarizadeh B, Grebely J, Martinello M, Matthews GV, Lloyd AR, Dore GJ. Hepatitis C treatment as prevention: evidence, feasibility, and challenges. Lancet Gastroenterol Hepatol 2016 Dec;1(4):317-327.
Appendix A. Reporting rates of acute and chronic HBV infections in Canada by province and territory, CNDSS, 2008-2017
| P/T | 2008 | 2009 | 2010 | 2011 | 2012 | 2013 | 2014 | 2015 | 2016 | 2017 |
|---|---|---|---|---|---|---|---|---|---|---|
| Canada | 0.7 | 0.6 | 0.4 | 0.6 | 0.5 | 0.5 | 0.5 | 0.4 | 0.5 | 0.5 |
| BC | 0.7 | 0.6 | 0.2 | 0.3 | 0.3 | 0.2 | 0.4 | 0.2 | 0.1 | 0.2 |
| AB | 0.9 | 0.7 | 0.6 | 0.6 | 0.6 | 0.7 | 0.2 | 0.5 | 0.5 | 0.5 |
| SK | 1.4 | 0.8 | 1.0 | 1.2 | 0.8 | 0.6 | 0.8 | 0.9 | 0.3 | 0.2 |
| MB | NR | 0.3 | 0.2 | 0.5 | 0.2 | 0.4 | 0.3 | 0.2 | 1.0 | 1.6 |
| ON | NR | NR | NR | 0.9 | 0.7 | 0.8 | 0.7 | 0.6 | 0.8 | 0.8 |
| QC | 0.6 | 0.4 | 0.3 | 0.3 | 0.4 | 0.2 | 0.2 | 0.1 | 0.1 | 0.1 |
| NB | 0.0 | 1.1 | 0.5 | 1.1 | 0.4 | 0.1 | 1.2 | 0.1 | 1.3 | 1.0 |
| NS | NR | 0.3 | 0.1 | 0.5 | 0.2 | 0.7 | 0.7 | 1.0 | 1.1 | 0.6 |
| PE | NR | NR | NR | NR | NR | NR | NR | NR | NR | NR |
| NL | NR | NR | NR | NR | NR | NR | NR | NR | NR | NR |
| YT | 0.0 | 0.0 | 2.9 | 0.0 | 0.0 | 0.0 | 0.0 | 2.7 | 0.0 | 0.0 |
| NT | NR | 2.3 | 0.0 | 0.0 | 0.0 | 2.3 | 2.3 | 0.0 | 0.0 | 0.0 |
| NU | NR | NR | NR | NR | NR | NR | NR | NR | NR | NR |
| P/T | 2008 | 2009 | 2010 | 2011 | 2012 | 2013 | 2014 | 2015 | 2016 | 2017 |
|---|---|---|---|---|---|---|---|---|---|---|
| Canada | 16.6 | 13.4 | 12.3 | 13.9 | 14.1 | 14.1 | 13.0 | 12.0 | 12.4 | 11.4 |
| BC | 30.1 | 26.9 | 26.2 | 23.3 | 22.2 | 24.5 | 21.9 | 21.7 | 23.2 | 21.7 |
| AB | 19.8 | 16.6 | 15.4 | 12.9 | 17.1 | 15.3 | 13.5 | 12.8 | 13.7 | 12.6 |
| SK | NR | 7.8 | 8.2 | 6.8 | 12.5 | 9.2 | NR | 9.3 | 11.4 | 8.9 |
| MB | NR | 8.4 | 10.7 | NR | 4.2 | 4.7 | 5.4 | 9.4 | 10.3 | 9.7 |
| ON | NR | NR | NR | 18.8 | 17.9 | 17.4 | 15.7 | 13.7 | 13.3 | 12.5 |
| QC | 9.0 | 8.1 | 6.1 | 4.7 | 5.9 | 6.7 | 6.6 | 5.6 | 5.6 | 5.1 |
| NB | 1.7 | 4.5 | 4.4 | 3.2 | 5.1 | 5.7 | 4.0 | 5.7 | 9.0 | 5.7 |
| NS | NR | 0.5 | 0.6 | 0.4 | 0.8 | 0.5 | 1.8 | 1.0 | 1.5 | 1.9 |
| PE | NR | NR | NR | NR | NR | NR | NR | NR | NR | NR |
| NL | NR | NR | NR | NR | NR | NR | NR | NR | NR | NR |
| YT | NR | NR | 11.6 | 14.1 | 8.3 | 16.4 | 16.2 | 13.3 | 20.8 | 12.6 |
| NT | NR | NR | NR | NR | NR | NR | NR | NR | NR | NR |
| NU | NR | NR | NR | NR | NR | NR | NR | NR | NR | NR |
NR: The HBV disease status of interest was not reported that year by this P/T |
||||||||||
Appendix B. Rates of reported acute and chronic HBV infections in Canada overall and by sex, CNDSS, 2008-2017
| Year | Acute rates per 100,000 | Chronic rates per 100,000 | ||||
|---|---|---|---|---|---|---|
| Male | Female | OverallFootnote 1 | Male | Female | OverallFootnote 1 | |
| 2008 | 1.03 | 0.36 | 0.70 | 17.70 | 15.50 | 16.62 |
| 2009 | 0.85 | 0.26 | 0.55 | 14.71 | 12.02 | 13.39 |
| 2010 | 0.62 | 0.13 | 0.37 | 13.45 | 11.21 | 12.35 |
| 2011 | 0.76 | 0.52 | 0.65 | 15.70 | 12.10 | 13.92 |
| 2012 | 0.66 | 0.38 | 0.52 | 15.87 | 12.30 | 14.08 |
| 2013 | 0.69 | 0.36 | 0.52 | 15.94 | 12.34 | 14.13 |
| 2014 | 0.71 | 0.33 | 0.52 | 13.89 | 12.17 | 13.05 |
| 2015 | 0.62 | 0.26 | 0.43 | 13.85 | 10.07 | 11.98 |
| 2016 | 0.73 | 0.30 | 0.51 | 14.13 | 10.54 | 12.35 |
| 2017 | 0.70 | 0.37 | 0.54 | 13.22 | 9.59 | 11.42 |
|
||||||
Appendix C: Rates of reported HCV infections in Canada by sex, CNDSS, 2008-2017
| Year | Male | Female | OverallFootnote 1 | |||
|---|---|---|---|---|---|---|
| Number of cases | Rates | Number of cases | Rates | Number of cases | Rates | |
| 2008 | 7,500 | 45.5 | 4,280 | 25.5 | 11,867 | 35.7 |
| 2009 | 7,103 | 42.6 | 3,958 | 23.3 | 11,168 | 33.2 |
| 2010 | 6,747 | 40.0 | 3,704 | 21.6 | 10,553 | 31.0 |
| 2011 | 6,366 | 37.4 | 3,658 | 21.1 | 10,114 | 29.5 |
| 2012 | 6,346 | 36.9 | 3,767 | 21.5 | 10,205 | 29.4 |
| 2013 | 6,525 | 37.5 | 3,750 | 21.2 | 10,363 | 29.5 |
| 2014 | 6,613 | 37.6 | 3,833 | 21.5 | 10,512 | 29.7 |
| 2015 | 6,755 | 38.1 | 4,061 | 22.6 | 10,882 | 30.5 |
| 2016 | 7,063 | 39.4 | 4,207 | 23.1 | 11,291 | 31.3 |
| 2017 | 7,086 | 39.1 | 4,451 | 24.2 | 11,592 | 31.7 |
|
||||||
Appendix D. Rates of reported HCV infections in Canada by province and territory, CNDSS, 2008-2017
| P/T | 2008 | 2009 | 2010 | 2011 | 2012 | 2013 | 2014 | 2015 | 2016 | 2017 |
|---|---|---|---|---|---|---|---|---|---|---|
| Canada | 35.7 | 33.2 | 31.0 | 29.5 | 29.4 | 29.5 | 29.7 | 30.5 | 31.3 | 31.7 |
| BC | 56.9 | 55.6 | 49.3 | 43.4 | 40.9 | 44.4 | 42.5 | 46.1 | 47.6 | 46.5 |
| AB | 33.6 | 26.8 | 24.0 | 31.4 | 31.6 | 31.8 | 34.8 | 36.0 | 39.7 | 34.8 |
| SK | 69.2 | 61.1 | 54.0 | 58.3 | 63.1 | 57.3 | 55.0 | 64.2 | 63.5 | 61.7 |
| MB | 29.4 | 29.1 | 26.0 | 25.1 | 28.0 | 24.4 | 27.5 | 30.3 | 35.0 | 46.1 |
| ON | 36.7 | 33.8 | 34.3 | 31.6 | 31.3 | 31.1 | 31.3 | 31.3 | 31.5 | 33.4 |
| QC | 23.8 | 21.7 | 17.9 | 16.7 | 16.0 | 15.1 | 13.7 | 12.6 | 12.7 | 12.3 |
| NB | 11.6 | 27.2 | 24.8 | 21.2 | 23.3 | 26.0 | 23.7 | 23.5 | 23.7 | 32.2 |
| NS | 30.0 | 29.3 | 31.9 | 21.9 | 26.5 | 29.9 | 34.1 | 36.7 | 32.5 | 30.9 |
| PE | 31.0 | 25.0 | 39.5 | 34.0 | 38.7 | 40.3 | 50.6 | 27.0 | 21.8 | 24.6 |
| NL | 19.4 | 16.4 | 11.9 | 11.8 | 12.7 | 20.1 | 24.2 | 29.5 | 31.2 | 33.5 |
| YT | 81.6 | 94.9 | 60.7 | 62.1 | 60.7 | 43.8 | 53.9 | 37.1 | 46.7 | 45.4 |
| NT | 34.6 | 27.8 | 27.7 | 16.1 | 36.7 | 34.2 | 41.0 | 27.1 | 29.1 | 13.4 |
| NU | 9.4 | 15.3 | 24.0 | 29.2 | 14.4 | 5.7 | 16.7 | 13.7 | NR | NR |
NR: The P/T did not report on hepatitis C cases that year |
||||||||||