
Reducing urban heat islands to protect health in Canada
An introduction for public health professionals
Download the alternative format
(PDF format, 4.1 MB, 53 pages)
Organization: Health Canada
Type: [Publication Type]
Published: 2020-04-29
More Information
Summary
"Urban heat islands" (UHIs) refer to warmer temperatures in urban areas than in surrounding rural areas. These warmer temperatures can magnify health impacts during heat waves. Public health professionals can play an important role in protecting health by spearheading or contributing to action to reduce UHIs. In fact, public health professionals (including staff at public health authorities, university researchers, and officials in provincial and federal ministries of health) in Canada have contributed to various UHI reduction initiatives. For example, local health authorities were a key driver behind Quebec City's measures to reduce UHIs in vulnerable neighbourhoods. However, there is a lack of guidance specifically to provide advice to public health professionals about how they can collaborate with local governments to advance action to reduce UHIs. The purpose of this Health Canada report is to fill this gap in knowledge and provide tips, strategies, and case studies that can help public health professionals as they support local governments and organizations with reducing UHIs. The report includes nine practical case studies highlighting how public health professionals across Canada have helped to advance actions to reduce UHIs in their communities. This report focuses on advice for reducing outdoor temperatures; while actions to reduce indoor temperatures are important, they are beyond the scope of this report.
Target audience
The target audience for this report is public health officials at the local, provincial, and national levels interested in helping communities reduce the health impacts from extreme heat events. The report will also be of interest to urban planners and other municipal staff to better understand how they can collaborate with public health authorities in the Canadian context to advance action.
Forewords
In 2017, I chose Designing for Healthy Living as the focus and title of my first report as Canada's Chief Public Health Officer because of the tremendous potential that the built environment has to help all Canadians live healthier lives. The built environment - the places and spaces in which we live, work, learn and play - has a key role in population health and health equity.
In addition to its significant environmental benefits, addressing urban heat islands (UHI) through interventions in the built environment, can positively impact the physical and mental health of Canadians and reduce the factors that contribute to chronic diseases. For example, increasing urban green space reduces outdoor temperatures, while also providing opportunities for social connection, active transportation and physical activity. Increasing vegetation may also specifically benefit some marginalized and lower-income groups living in areas with low tree canopy and high percentages of built surfaces, two of the main contributors to UHIs.
Reducing urban heat islands to protect health in Canada: an introduction for public health professionals shares important case studies and approaches for how public health professionals can collaborate with local governments to reduce the intensity of urban heat islands in summer. Consistent with my 2017 report and its call to action, I encourage public health professionals to share this report with partners in other sectors and work together to address UHIs and create healthy communities for all Canadians.
Dr. Theresa Tam
Chief Public Health Officer of Canada

With climate change, the number of very hot days in many parts of Canada is expected to more than double by the middle of the 21st century.
Many urban areas in Canada, with their high proportion of dark roof and road surfaces, absorb the sun's rays and radiate it out, heating up both air and surface temperatures. These warmer temperatures in urban areas can magnify health risks during heat waves.
The Safe Environments Directorate at Health Canada is mandated with reducing the risks of common environmental issues (including climate change) that affect human health. This Health Canada report- "Reducing urban heat islands to protect health in Canada: an introduction for public health professionals"- reveals the important role that health professionals have in helping implement community actions to cool communities and protect public health during heat waves. The report provides tips, approaches and case studies about how public health professionals can collaborate with local governments to reduce urban temperatures in the summer.
This report demonstrates that by working together health professionals and community officials can implement bold preventive actions to protect the health of Canadians from environmental issues like extreme heat.
David Morin
Director General of the Safe Environments Directorate, Health Canada

Acknowledgements
Health Canada gratefully acknowledges the contributions of the following people to the development of this document:
- Gregory R.A. Richardson
Health Canada - Diamir de Scally
University of Waterloo - Louise Aubin
Peel Public Health - Mélanie Beaudoin
Institut national de santé publique du Québec - Kevin Behan
Clean Air Partnership - Peter Berry
Health Canada - Carolyn Brown
Science Communication - Louis Coningsby
Clean Air Partnership - Marisa Creatore
Canadian Institutes of Health Research - Margaret de Groh
Public Health Agency of Canada - Marla Desat
Standards Council of Canada - Shawn Donaldson
Health Canada - Dick Ebersohn
City of Calgary - Patti Edwards
Environment and Climate Change Canada - Paddy Enright
University of Waterloo - Jim Frehs
Indigenous Services Canada - Charito Gailling
British Columbia Centre for Disease Control - Andrew Gonzalez
McGill University - Adam Griffiths
Health Canada - Katherine Isaac
City of Vancouver - Kiera Keown
Canadian Institutes of Health Research - Sharon Lam
Ontario Climate Consortium Secretariat - Eric Lavigne
Health Canada - Melissa Le Geyt
University of Waterloo - Georgeanne MacGregor-Fox
Regional Municipality of Waterloo - Ahalya Mahendra
Public Health Agency of Canada - Maria Malik
University of Waterloo - Patricia Manuel
Dalhousie University - Tamsin Mills
City of Vancouver - Safoura Moazami
Toronto Public Health - Zainab Moghal
Environment and Climate Change Canada - Peter Murphy
Québec City - Ting Pan
Vancouver Island Health Authority - Karina Richters
City of Windsor - Emmanuel Rondia
Conseil régional de l'environnement de Montréal - Alexandra Rutledge
Health Canada - Rebekka Schnitter
Health Canada - Bill Stephen
City of Vancouver - Shayna Stott
City of Toronto - Rebecca Stranberg
Health Canada - Benita Tam
Environment and Climate Change Canada - Carolyn Tateishi
Health Canada - Julie Tellier
City of Montréal - James Voogt
University of Western Ontario - Amber Walker
Nova Scotia Health Authority - Angie Woo
Fraser Health
Contents
- Acknowledgements
- 1. An overview of urban heat islands and health
- 2. The health risks of urban heat islands to Canadians
- 2.1 Extreme heat is a health risk to Canadians
- 2.2 What is the urban heat island effect?
- 2.3 How do urban heat islands magnify health risks in summer?
- 2.4 What changes can communities make to the built environment to reduce urban heat islands?
- 2.5 Maximizing the co-benefits of urban heat island-reduction actions
- 3. Case studies
- Rapid health impact assessment of Halifax's draft Centre Plan Framework
- Québec City pilot project to green Anna Street
- Montréal's ILEAU initiative
- Toronto Shade Policy and Guidelines
- A Healthy Development Assessment Tool in Peel Region, Ontario
- Improving thermal comfort in parks in Windsor, Ontario
- imagineCALGARY community visioning exercise and long-range sustainability plan
- BC Healthy Built Environment Linkages Toolkit
- Vancouver's Street Tree Cooling Networks
- 4. How public health professionals can help reduce urban heat islands
- 5. Lessons learned and conclusions
- References
1. An overview of urban heat islands and health
Extreme heat is a significant health issue in Canada. The health impacts from higher temperatures are already being felt across the country. For example, during prolonged extreme heat events (commonly known as "heat waves") in July 2009 in British Columbia and July 2010 in Quebec, public health officials estimated that there were 156 and 280 excess deaths, respectively, from heat-related causes (Bustinza et al., 2013; Kosatsky, 2010). In Montreal, 66 people died due to a heat wave in July 2018 when temperatures spiked as high as 35.3°C (Lamothe et al. 2019). Although heat-related deaths and illnesses are largely preventable (Health Canada, 2011; Luber & McGeehin, 2008), extreme heat is a leading cause of weather-related morbidity and mortality globally (Hondula & Barnett, 2014; Petkova et al., 2014). In the United States, extreme heat is the primary cause of weather-related mortality (Luber & McGeehin, 2008; National Weather Service, 2018). In Canada, high temperatures have been found to be a major health risk, with high temperatures in summer associated with excess mortality in many Canadian cities (Casati et al., 2013).
Increases in the duration, frequency, and intensity of extreme heat events are expected to be a key consequence of climate change in Canada (Berry et al., 2014; Pengelly et al., 2007). Canada warmed by an average of 1.6°C between 1948 and 2012, roughly double the global average rate of warming (ECCC, 2016). By the mid-21st century, many parts of the country are projected to experience a doubling in the annual number of very hot days (i.e., days when the temperature reaches 30°C or higher) (Casati et al., 2013). The increased duration, frequency, and intensity of very hot days in Canada could considerably increase heat-related illnesses and deaths. Higher temperatures could also impact Canadians' quality of life and livelihoods, for example, by limiting time that outdoor workers can comfortably work or children can safely play outdoors (Semenzato et al., 2011; Zacharias et al., 2001). The World Health Organization recommends that governments at all levels implement measures to protect populations from extreme heat, including heat alert and response systems (McGregor et al., 2015).
Both community and individual risk factors can influence a person's vulnerability to heat-related illness (Health Canada, 2011). Populations particularly susceptible to illness and death from exposure to extreme heat include those who are elderly, children, or socioeconomically marginalized (especially homeless or marginally housed), chronically ill or physically impaired, or physically active, as well as Indigenous people, newcomers to Canada, and outdoor workers (Health Canada, 2011). The health risks from extreme heat may be further magnified in Canada by several factors, including climate change (Berry et al., 2014), rapid population growth in urban areas, and an aging population in many parts of the country.
The urban heat island (UHI) effect is another factor known to magnify health impacts during extreme heat events. UHIs are defined as urban areas that are hotter than surrounding rural areas (US EPA, 2008). The average air temperature of medium to large cities in North America is generally 1°C to 3°C warmer than the surrounding countryside, and up to 12°C warmer in some places (Oke, 1997; Oke et al., 2017). Built surfaces such as roofs, paved roads, and parking lots can absorb large quantities of radiant heat from the sun, resulting in increases in both surface and air temperatures. The higher air temperatures in cities, particularly at night, can limit the body's ability to cool down during extreme heat events (Laaidi et al., 2012), magnifying the risks of adverse health impacts during such events.
Communities can advance various actions to reduce the health risks of extreme heat through changes to the built environment that lower indoor and outdoor temperatures. For example, indoor temperatures can be reduced through passive design changes to buildings (e.g., insulating roof cavities and walls, and installing awnings or large roof overhangs). Outdoor temperatures can be reduced through expanding urban vegetation (e.g., planting trees and climbing plants, and installing green roofs), implementing climate-sensitive urban design and planning (e.g., installing reflective roofs), and reducing waste heat released into the urban environment (e.g., using active transportation such as walking and cycling). A growing number of municipalities in Canada are implementing UHI-reduction measures to reduce outdoor air temperatures in summer. These measures range from the Montréal borough of Rosemont-La Petite-Patrie's zoning bylaw that mandates cool roofs when installing new or replacement roofs (Guilbault et al., 2016) to the City of Vancouver's Street Tree Cooling Networks that prioritize tree planting in areas characterized by high exposure and population vulnerability to the UHI effect (City of Vancouver, 2015).
Various reports and guides produced in Canada and internationally describe how municipal governments can take action to implement UHI-reduction measures (INSPQ, 2009; US EPA, 2008). Since many such measures are taken by built-environment professionals, such as urban planners, engineers, environmental planners, and landscape architects, it is not surprising that existing guides are tailored almost exclusively to these audiences. However, public health professionals, including staff at public health units, provincial and federal ministries of health, and university researchers, can also play an important role in helping communities reduce UHIs and minimize heat-related illnesses and deaths. Public health professionals have already contributed to various UHI-reduction initiatives in Canada, from the greening of streets in vulnerable neighbourhoods in Québec City to the implementation of heat-health vulnerability maps in Vancouver, Toronto, and Windsor. Despite the important role public health professionals can have in reducing UHIs, there is a lack of guidance available to provide them with advice on how they can collaborate with local governments to advance action on UHI reduction. The purpose of this Health Canada report is therefore to share strategies and case studies that can help public health professionals as they collaborate with local governments to reduce the intensity of UHIs in summer.
This introductory report:
- outlines the health risks of extreme heat to Canadians,
- describes the UHI effect and its health risks,
- provides several case studies of how public health officials professionals have successfully supported communities in reducing UHIs, and
- outlines tips and strategies for how public health professionals can assist local governments with action to reduce UHIs.
2. The health risks of urban heat islands to Canadians
Canada is a vast country with large differences in regional climate conditions. Many southern parts of Canada routinely experience high temperatures during the summer months. For example, the average annual number of very hot days between 1976 and 2005 was 25 in Kamloops, British Columbia; 10.9 in Saskatoon, Saskatchewan; 11 in Winnipeg, Manitoba; 12.2 in Toronto, Ontario; and 8.2 in Montréal, Quebec (Prairie Climate Centre, 2018). Communities across Canada also periodically experience extreme heat conditions. For example, in July 2014, 15 heat records were broken in a single day during a heat event in British Columbia, with temperatures in the Village of Lytton reaching a high of 40.3°C (Canadian Press, 2014). The following summer, there were 41 days when daily maximum temperatures exceeded 30°C in Toronto.
2.1 Extreme heat is a health risk to Canadians
Extreme heat is a significant public health issue in Canada. Prolonged exposure to extreme heat without significant cooling intervals can pose a critical risk to human health. General physiological stresses from extreme and/or prolonged exposure to heat include dehydration, fatigue, and an inability to perspire or cool the body (Smoyer-Tomic & Rainham, 2001). Overexposure to heat can cause a spectrum of heat-related illnesses, such as heat rashes, cramps, and even heat stroke. Extreme heat may also worsen existing conditions, such as cardiovascular and respiratory diseases, lead to stroke, and increase susceptibility to infectious diseases (Smoyer-Tomic & Rainham, 2001). Certain populations, including young children, people with chronic illnesses, occupational groups such as construction workers, physically active people, Indigenous Canadians, the marginally housed or homeless, and socially isolated seniors, are particularly at risk (see Introduction; Health Canada, 2011).
The health impacts from high temperatures are already being felt across Canada. Deadly extreme heat events in Canada include those in British Columbia in July 2009 (156 excess deaths), Quebec in July 2010 (280 excess deaths), and Quebec in July 2018 (86 excess deaths) (Kosatsky, 2010; Bustinza et al., 2013; Lebel et al., 2019). Not only does extreme heat increase the risk of heat-related illnesses and deaths, but it can also disrupt people's daily activities and enjoyment of outdoor spaces. For example, a study in Montréal showed that outdoor temperature was the single greatest variable affecting activity levels in open spaces (Zacharias et al., 2001). Some communities in Canada have, in extreme cases, cancelled events to reduce heat-health risks to the public. For example, the City of Montréal cancelled the Canada Day parade on July 1, 2018 in the Montréal borough of Pierrefonds-Roxboro due to extremely hot temperatures that peaked at 34.6°C (CTV Montréal, 2018). In Prince Edward Island, a football game at the Atlantic Bowl football tournament on July 24, 2018, was postponed after a player experienced heat stroke (CBC News, 2018).
Box 1. Scenarios and climate models
To project what will happen to the climate in the future, scientists develop "scenarios" representing possible future levels of greenhouse gas emissions. The consequences for weather variables, including temperature, are estimated for each scenario using sophisticated computer simulations (models). The Government of Canada website has more information about scenarios and climate models.
By 2050, many parts of Canada are projected to experience a doubling in the annual number of very hot days because of climate change (Casati et al., 2013). Figure 1 shows the annual number of very hot days in the largest population centre in each province in Canada, both in the past and based on projections for the future, according to climate models (see Box 1). Projections are based on two of four greenhouse gas emission scenarios adopted by the Intergovernmental Panel on Climate Change: representative concentration pathway (RCP) 4.5 is a low global emission scenario that assumes global greenhouse gas emissions peak in 2040 and then decline, while RCP 8.5 is a high global emission scenario in which emissions are assumed to rise throughout the 21st century. The projected increases in temperatures in Canada under the various emission scenarios are expected to have major impacts on communities, health systems, and individuals (Berry et al., 2014).
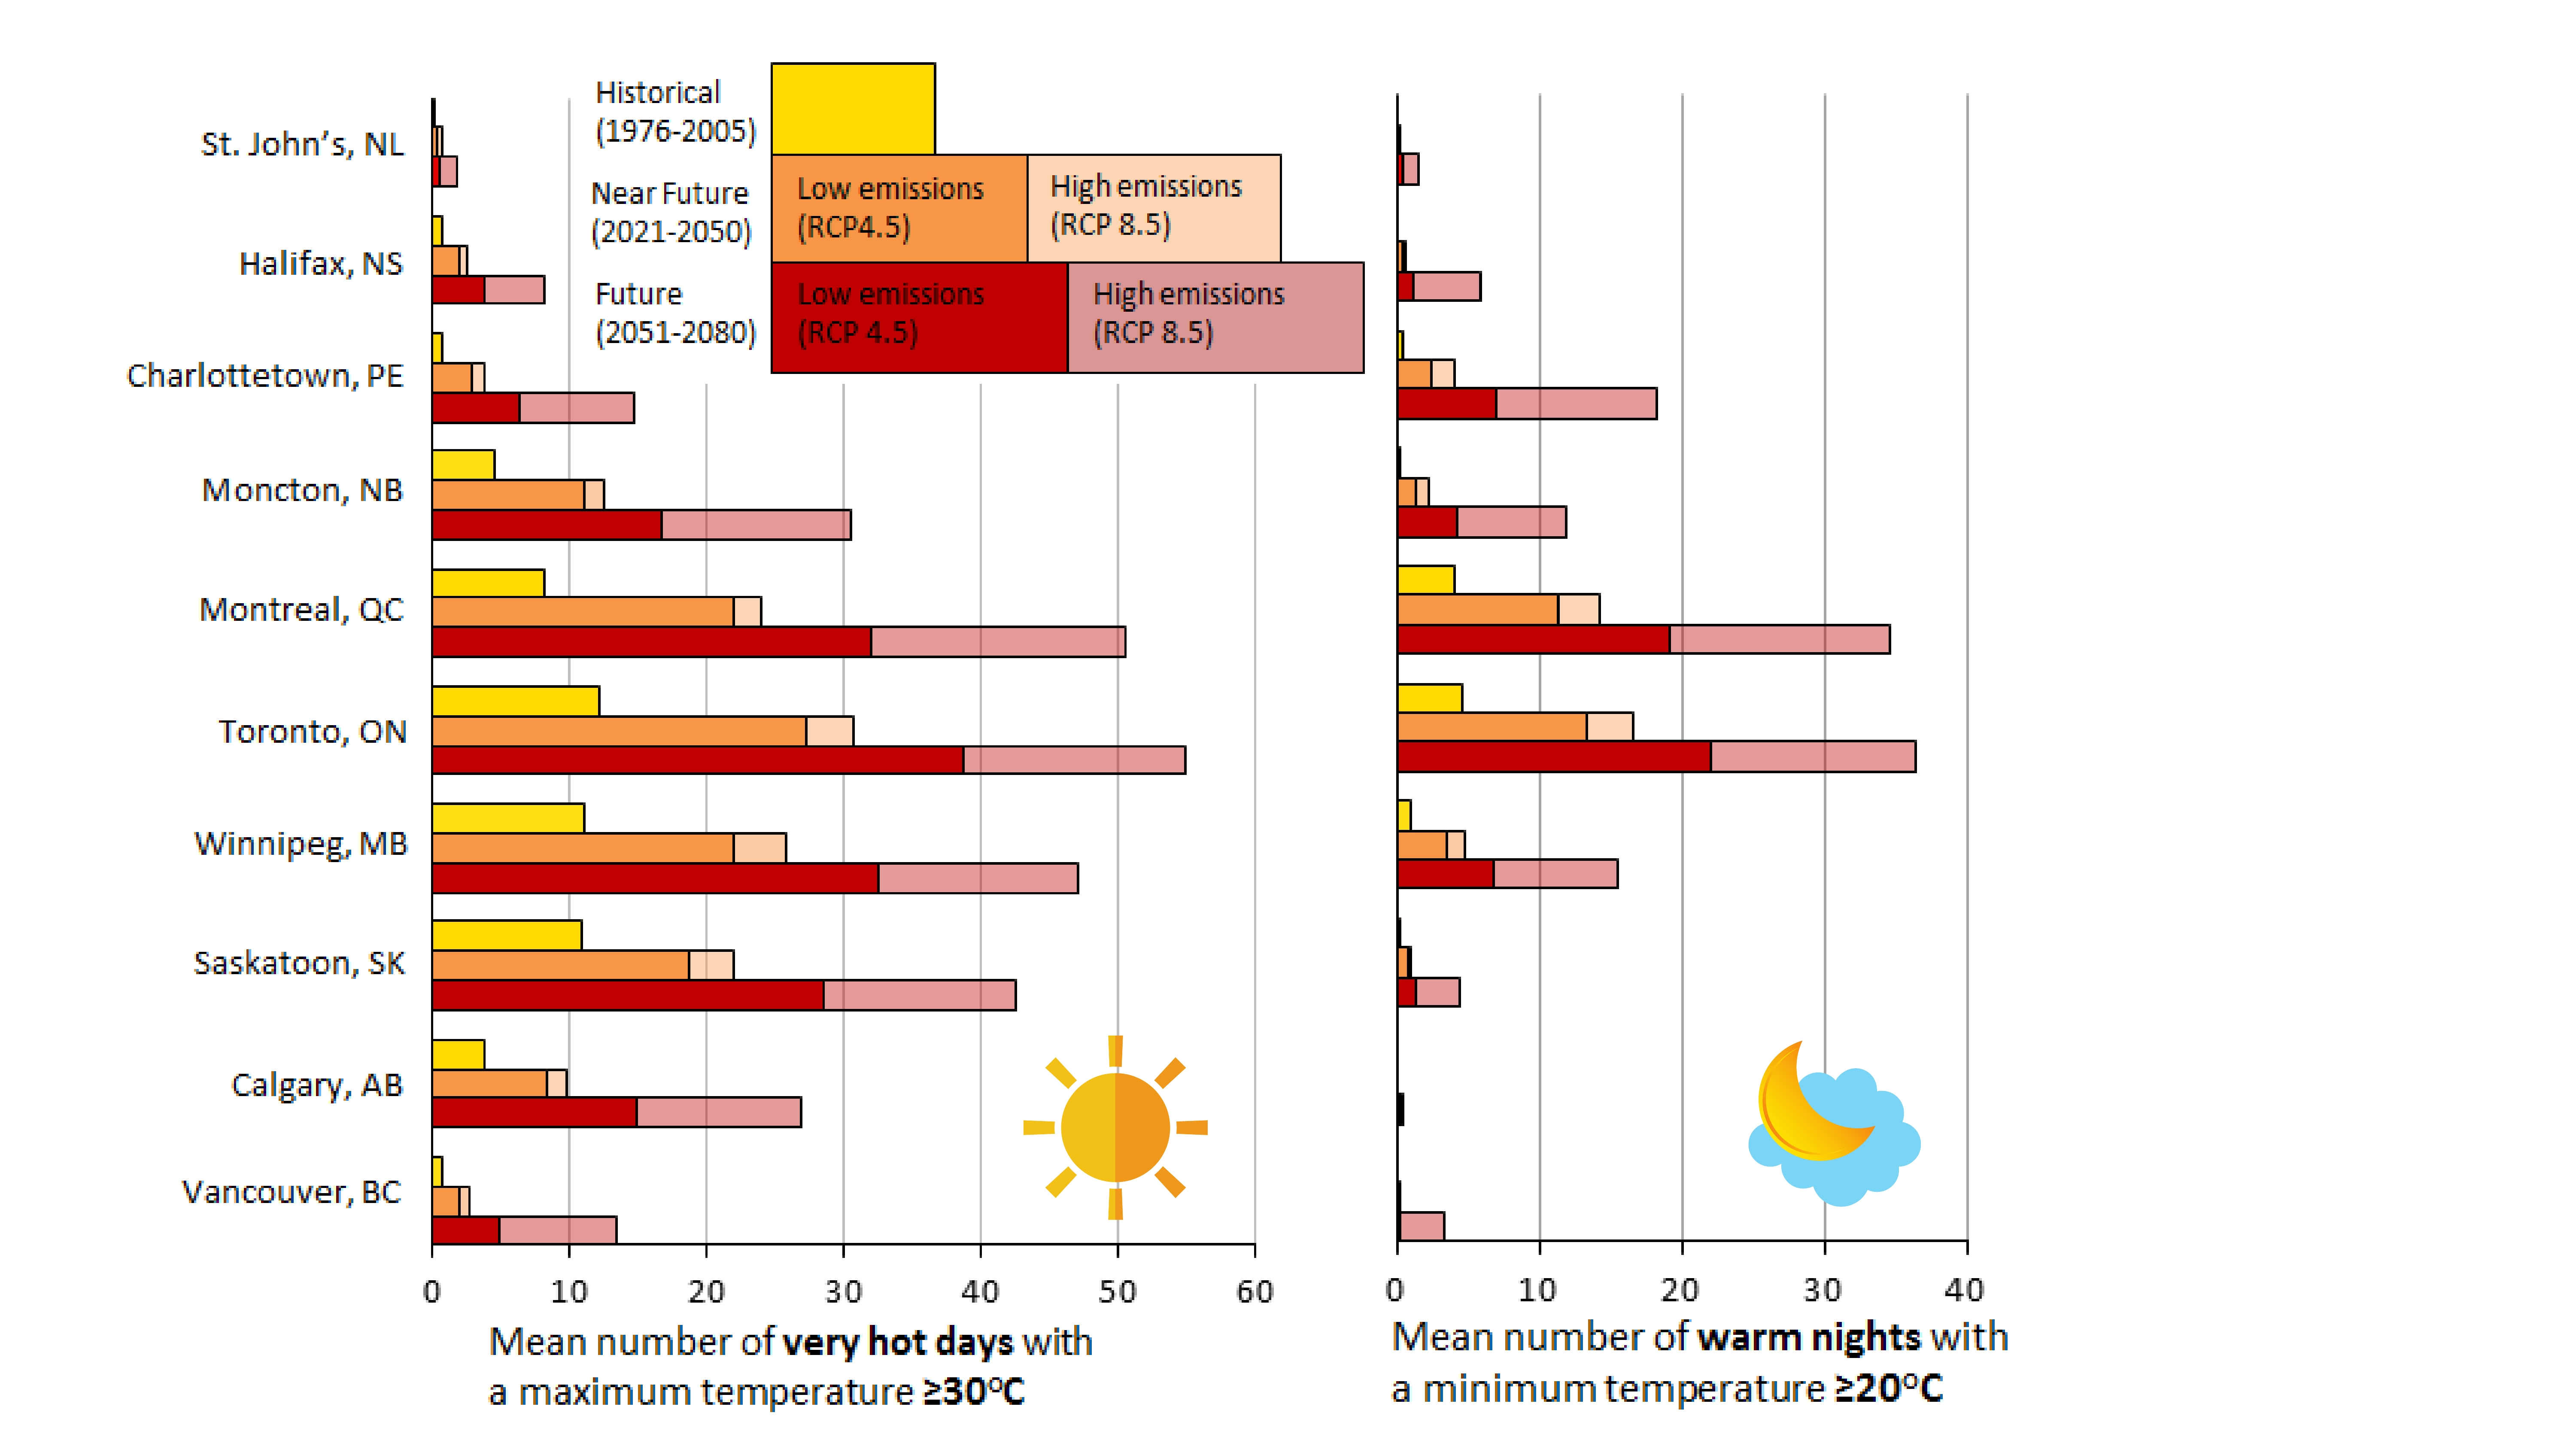
Figure 1 - Text Equivalent
| City | Historical | Near Future (low emission) | Near Future (high emissions) | Future (low emissions) | Future (high emissions) |
|---|---|---|---|---|---|
| St John's, NL | 0.1 | 0.3 | 0.6 | 0.5 | 1.7 |
| Halifax, NS | 0.6 | 2 | 2.5 | 3.7 | 8.1 |
| Charlottetown, PE | 0.6 | 2.9 | 3.7 | 6.4 | 14.7 |
| Moncton, NB | 4.5 | 11.1 | 12.5 | 16.6 | 30.5 |
| Montreal, QC | 8.2 | 21.9 | 23.9 | 31.9 | 50.4 |
| Toronto, ON | 12.2 | 27.3 | 30.7 | 38.6 | 54.9 |
| Winnipeg MB | 11 | 22 | 25.7 | 32.4 | 47.1 |
| Saskatoon, SK | 10.9 | 18.9 | 21.9 | 28.5 | 42.5 |
| Calgary, AB | 3.7 | 8.4 | 9.7 | 14.8 | 26.9 |
| Vancouver, BC | 0.6 | 2 | 2.6 | 4.9 | 13.4 |
| City | Historical | Near Future (low emission) | Near Future (high emissions) | Future (low emissions) | Future (high emissions) |
|---|---|---|---|---|---|
| St John's, NL | 0 | 0.1 | 0.1 | 0.3 | 1.4 |
| Halifax, NS | 0 | 0.3 | 0.4 | 1 | 5.7 |
| Charlottetown, PE | 0.4 | 2.4 | 4 | 6.8 | 18.1 |
| Moncton, NB | 0.2 | 1.3 | 2.2 | 4.2 | 11.8 |
| Montreal, QC | 4 | 11.3 | 14.1 | 19 | 34.5 |
| Toronto, ON | 4.5 | 13.3 | 16.5 | 21.9 | 36.3 |
| Winnipeg MB | 0.9 | 3.4 | 4.6 | 6.7 | 15.5 |
| Saskatoon, SK | 0.1 | 0.6 | 0.8 | 1.2 | 4.4 |
| Calgary, AB | 0 | 0 | 0 | 0.1 | 0.3 |
| Vancouver, BC | 0 | 0 | 0.1 | 0.1 | 3.3 |
Past and projected future annual mean number of very hot days (days when the temperature reaches 30°C or higher) and warm nights (nights when the temperature never falls below 20°C) in the largest population centre of each of the 10 Canadian provinces under high (RCP 8.5) and low (RCP 4.5) greenhouse gas emission scenarios. Source: Produced by Maria Malik, Health Canada, based on data from the Climate Atlas (https://climateatlas.ca).
Without additional health-protective measures (e.g., heat alert and response systems), the increased frequency and intensity of very hot days resulting from climate change could increase heat-related illnesses and deaths in Canada. Several researchers have modelled health impacts of extreme heat under different climate change scenarios in Canada and internationally (Guo et al., 2018; Jenkins et al., 2014). For example, one study estimated that deaths related to extreme heat events will increase by 45% in Canada for the period 2031-2080, compared with the deaths for the period 1971-2020 (Guo et al., 2018) (See Appendix A). This assumes low greenhouse gas emissions, low population growth, and implementation of adaptation measures. In the worst-case scenario, in which greenhouse gases continue to increase at the current rate, population growth is high, and no adaptation measures are implemented, heat-related deaths are estimated to increase by 455% (Guo et al., 2018).
Box 2: Heat alert and response systems
Many international and Canadian communities have developed heat alert and response systems (HARS) to adapt to extreme heat and protect human health. A HARS aims to reduce heat-related illnesses and deaths by alerting the public when temperatures are a risk to human health and activating community responses to help vulnerable populations, including providing individuals with information to help them take protective measures before and during the heat event (Bernard & McGeehin, 2004; Ebi et al., 2004; Health Canada, 2011). There are five elements to a HARS, including (1) community mobilization and engagement, (2) an alert protocol, (3) a community response plan, (4) a communication plan, and (5) an evaluation plan (Health Canada, 2011). HARS involve effective and coordinated responses among regional and local governments, private sector participants, and community groups (Health Canada, 2011). For example, during heat alerts in Ottawa, city officials, public health professionals, and community organizations work together to offer water and transportation to shelters for homeless people, check in on heat-vulnerable populations, and extend leisure swimming hours at local pools, among other measures (Health Canada, 2011).
Municipal governments and health authorities can advance actions to protect residents from heat. A key public health adaptation is to develop and implement a heat alert and response system (HARS) (Box 2). A HARS reduces heat-related illnesses and deaths by alerting the public and public health professionals about extreme heat events and activating established measures to help protect vulnerable populations (Bernard & McGeehin, 2004; Ebi et al., 2004; Health Canada, 2011). All levels of government can also implement policies and regulations to advance changes to the built environment that lower indoor and outdoor temperatures. While not the focus of this report, indoor temperatures can be reduced through mechanical cooling (e.g., air conditioning) and passive design changes to buildings (e.g., insulating roof cavities and walls, installing awnings or large roof overhangs) (see Box 3). Optimally, actions to reduce indoor temperatures should be designed to maximize other benefits, including improving energy efficiency and reducing greenhouse gas emissions (Wilkinson et al., 2009). Outdoor temperatures can be reduced through UHI-reduction actions such as planting trees and installing white roofs (see section 2.4).
Box 3: Improving indoor thermal comfort
North Americans spend over 80% of their time indoors (US EPA, 1989). Buildings with poorly adapted designs can absorb and trap heat indoors, raising indoor temperatures to levels dangerous to the health of residents (Ormandy & Ezratty, 2012; White-Newsome et al., 2012). While not the focus of this report, measures to reduce indoor temperatures include increasing thermal insulation in the building envelope, maximizing natural ventilation, using reflective roofing materials, installing blinds and shutters, planting trees and vegetation such as climbing plants to shade the building, and using energy-efficient appliances. Measures to reduce indoor temperatures and UHIs can be complementary. For example, the installation of cool roofs can significantly reduce both indoor and outdoor temperatures. (Adapted from Berry & Richardson, 2016.)
2.2 What is the urban heat island effect?
Various factors can magnify the health impacts of extreme heat events, including poorly designed buildings that heat up in summer, high numbers of people vulnerable to heat, and neighbourhoods with low tree canopy and high percentages of built surfaces. The UHI effect (the focus of this report) refers to warmer temperatures in urban areas compared to surrounding rural areas (Voogt & Oke, 2003). UHIs occur in areas where humans have altered the land surface through the development of buildings, parking lots, roads, and other infrastructure. Various characteristics of the urban land surface contribute to the UHI effect, including loss of vegetation, impermeable surfaces, and heat released from human activities (US EPA, 2008). These factors, combined with the physical parameters of an urban area, such as the climate, city size, urban geometry, building typology and population density (Filho et al., 2017), can contribute to significant increases in urban temperatures (Figure 2, Table 1).
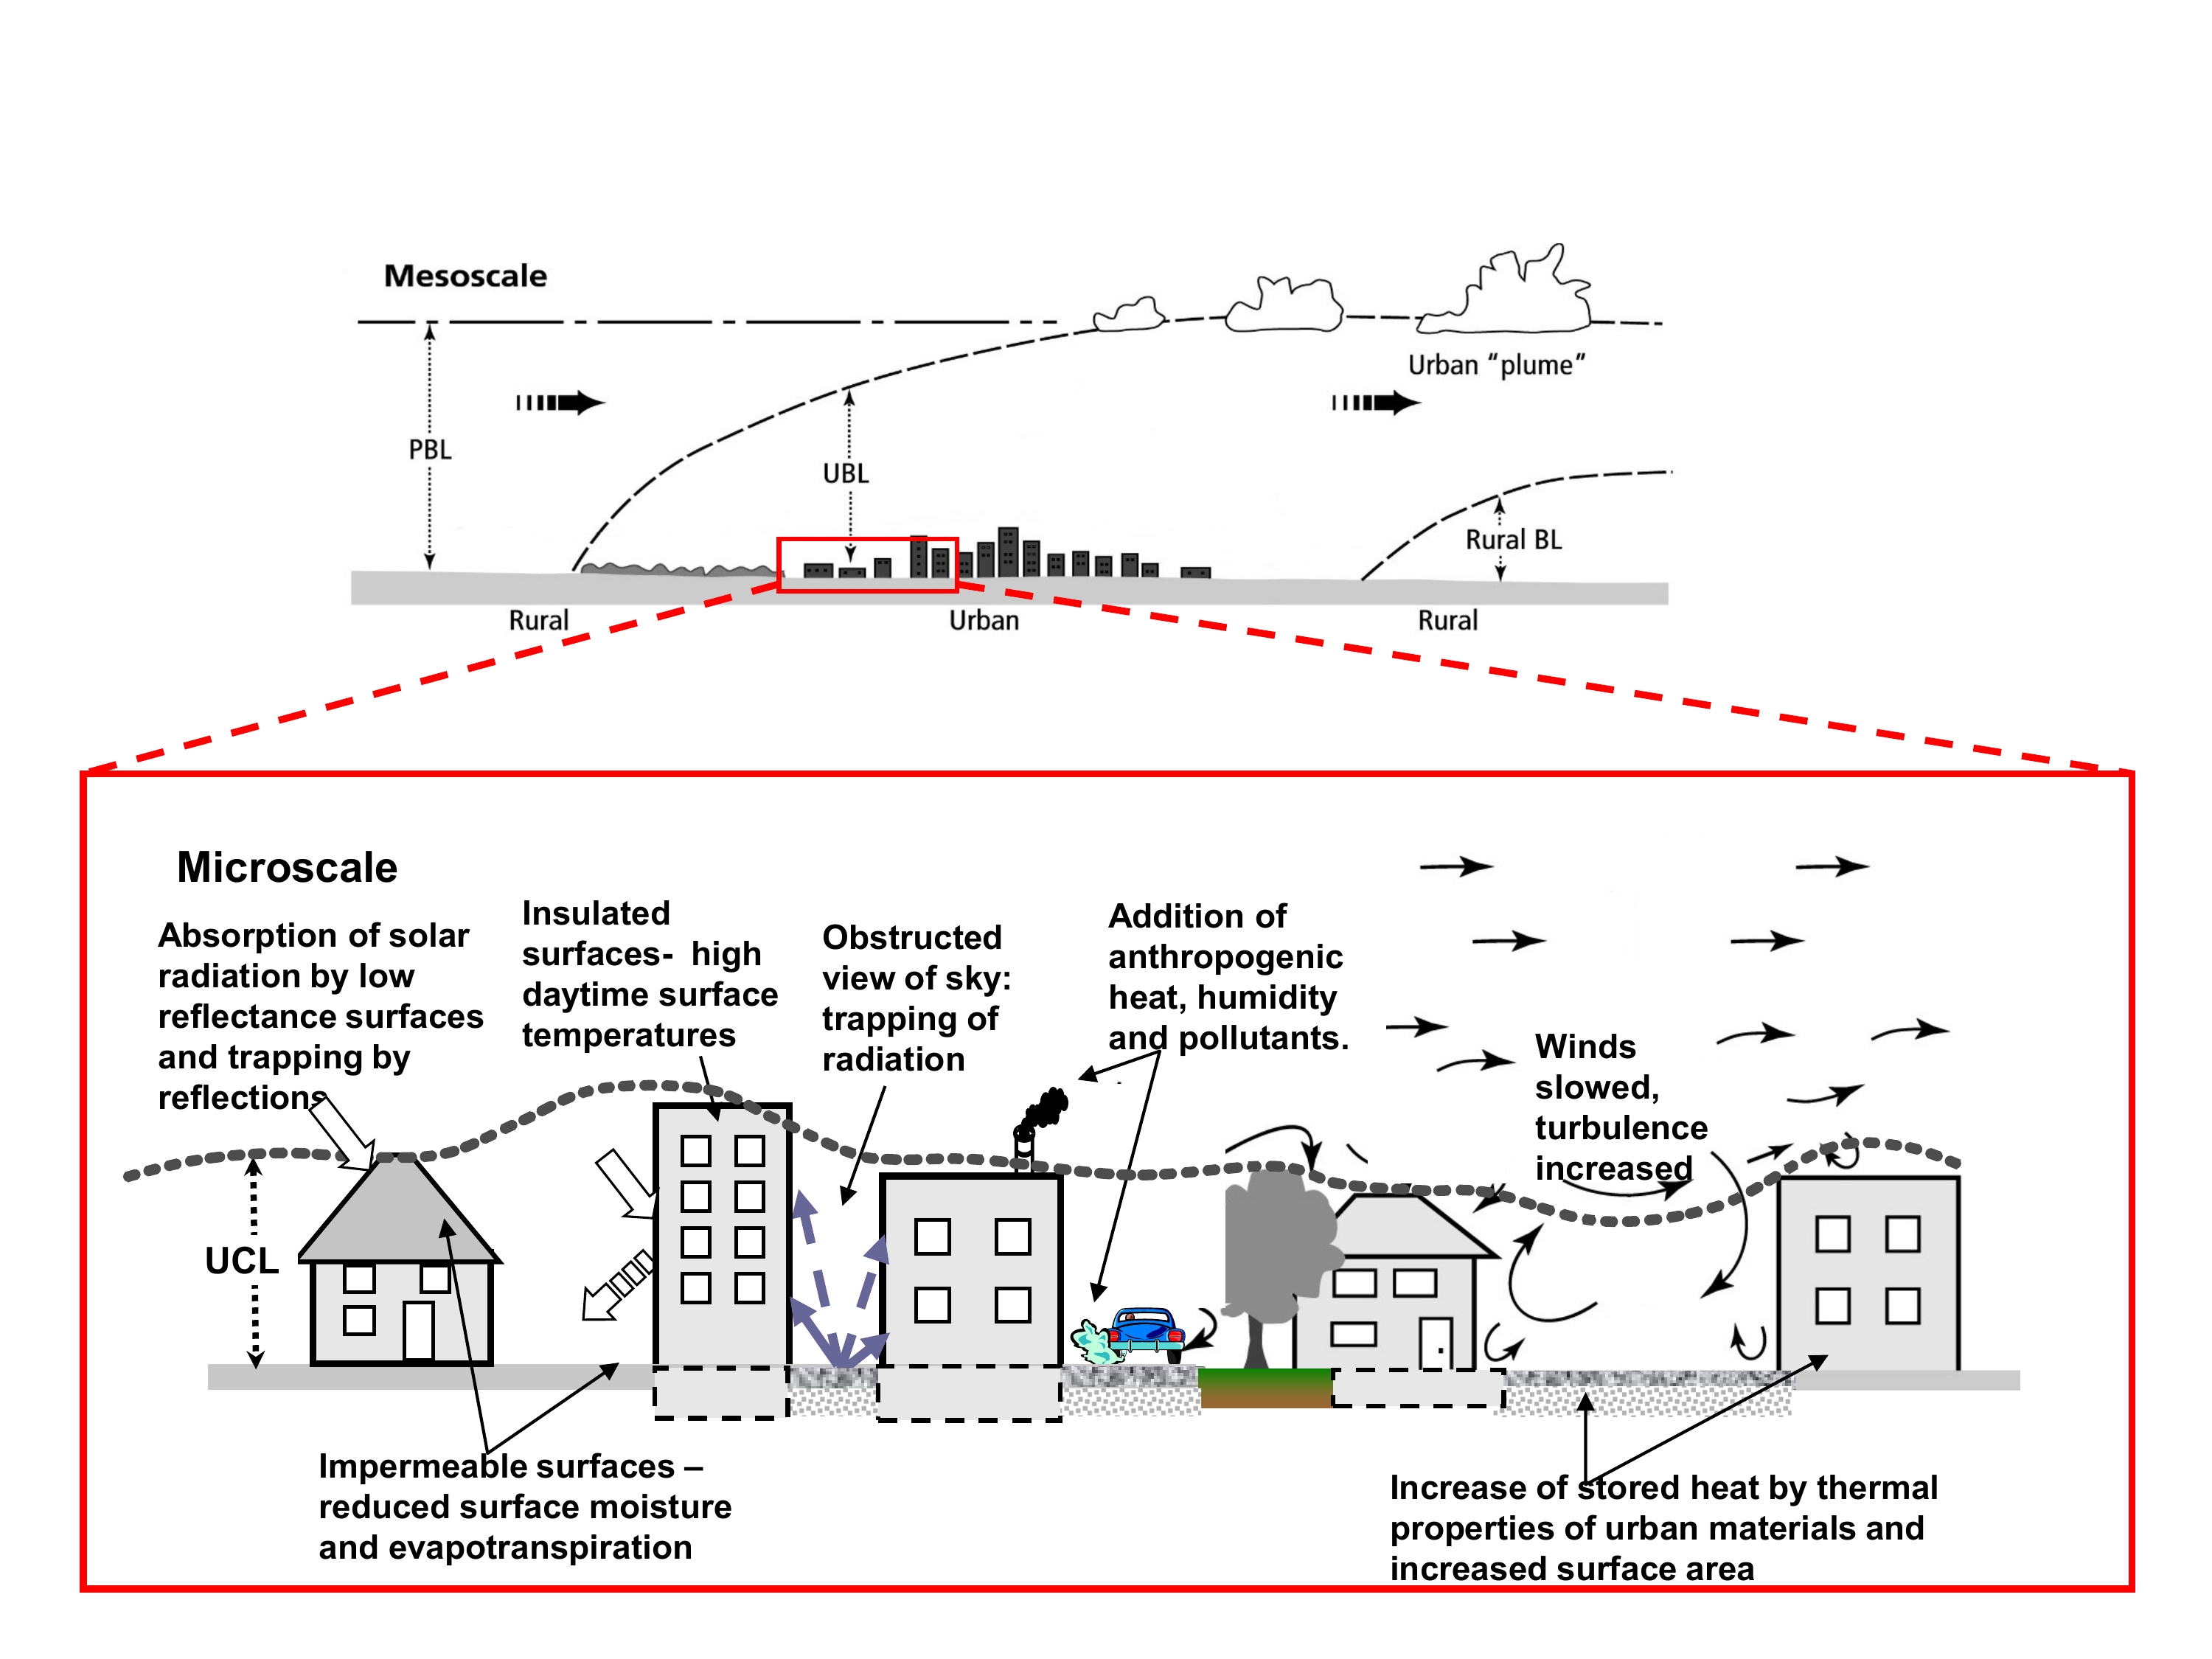
Figure 2 - Text Equivalent
This figure, which has two main components, shows the processes contributing to urban heat islands at the regional and microscales.
The top component of the figure depicts the urban heat island effect at the regional, or "mesoscale". The urban boundary layer (UBL) extends through the depth of the planetary boundary layer (PBL) and moves downwind as a plume of air moves above a newly developing rural boundary layer (rural BL).
In the bottom component of the figure, a section of the urban skyline depicted in the top diagram is expanded to show details of the urban heat island effect at the microscale. A series of arrows point to characteristics of the "urban land surface" which contribute to urban heat islands. The bottom part of the figure describes that:
- Surfaces such as roofs often have low reflectance, absorbing and trapping solar radiation;
- Impermeable surfaces like roads reduce surface moisture and evapotranspiration;
- Insulated surfaces may result in high daytime surface temperatures;
- Buildings placed close together can result in an obstructed view of the sky, trapping radiation, slowing wind, and increasing wind turbulence;
- The thermal properties of urban materials such as roads and buildings, and their increased surface area, can increase stored heat; and
- Buildings and cars add anthropogenic heat, humidity and pollutants to the air.
Scales of urban climate showing the urban boundary layer (UBL) and urban canopy layer (UCL) as well as some of the processes and effects of urban climate. At regional scales (mesoscales), the UBL extends through the depth of the planetary boundary layer (PBL) and moves downwind as a plume of air above a newly developing rural boundary layer (rural BL). Source: Voogt, 2010; figure reprinted with permission from Dr. James Voogt.
There are two main types of UHIs:
Surface UHIs refer to temperatures at the surface of a material (e.g., road, parking lot, building façade, roof material). The temperature of building and infrastructure materials can differ considerably from one surface to another, depending on the physical properties of the material (solar reflectivity, moisture content, thermal properties) and its exposure to sun and sky (US EPA, 2008). On sunny days in summer, dark and dry surfaces such as asphalt can absorb radiation emitted from the sun and reach temperatures that are up to 10°C to 15°C above the surrounding air temperature (US EPA, 2008; Voogt & Oke, 2003).
Air temperature UHIs are formed when heat stored in urban surfaces and/or emitted from human activities is released into the air (US EPA, 2008). Air temperature UHIs are influenced by various factors, including surface characteristics (solar reflectivity, moisture content, thermal properties), the climate (patterns of temperature, cloud cover, wind speed), and exposure to sun and sky (urban geometry, building typology; see Table 1 for definitions) (Voogt & Oke, 2003). Air temperature UHIs often differ from neighbourhood to neighbourhood and are most pronounced at night, when heat stored in urban surfaces during the day is released into the air (US EPA, 2008). Air temperatures over North American cities are on average 1°C to 3°C warmer than those in the surrounding countryside on an annual basis, with temperatures in dense, highly urbanized areas reaching up to 12°C warmer when specific weather conditions are met, such as calm winds and clear skies (Oke, 1997). Together, these types of UHIs can result in significant changes to urban temperatures (Figure 3).
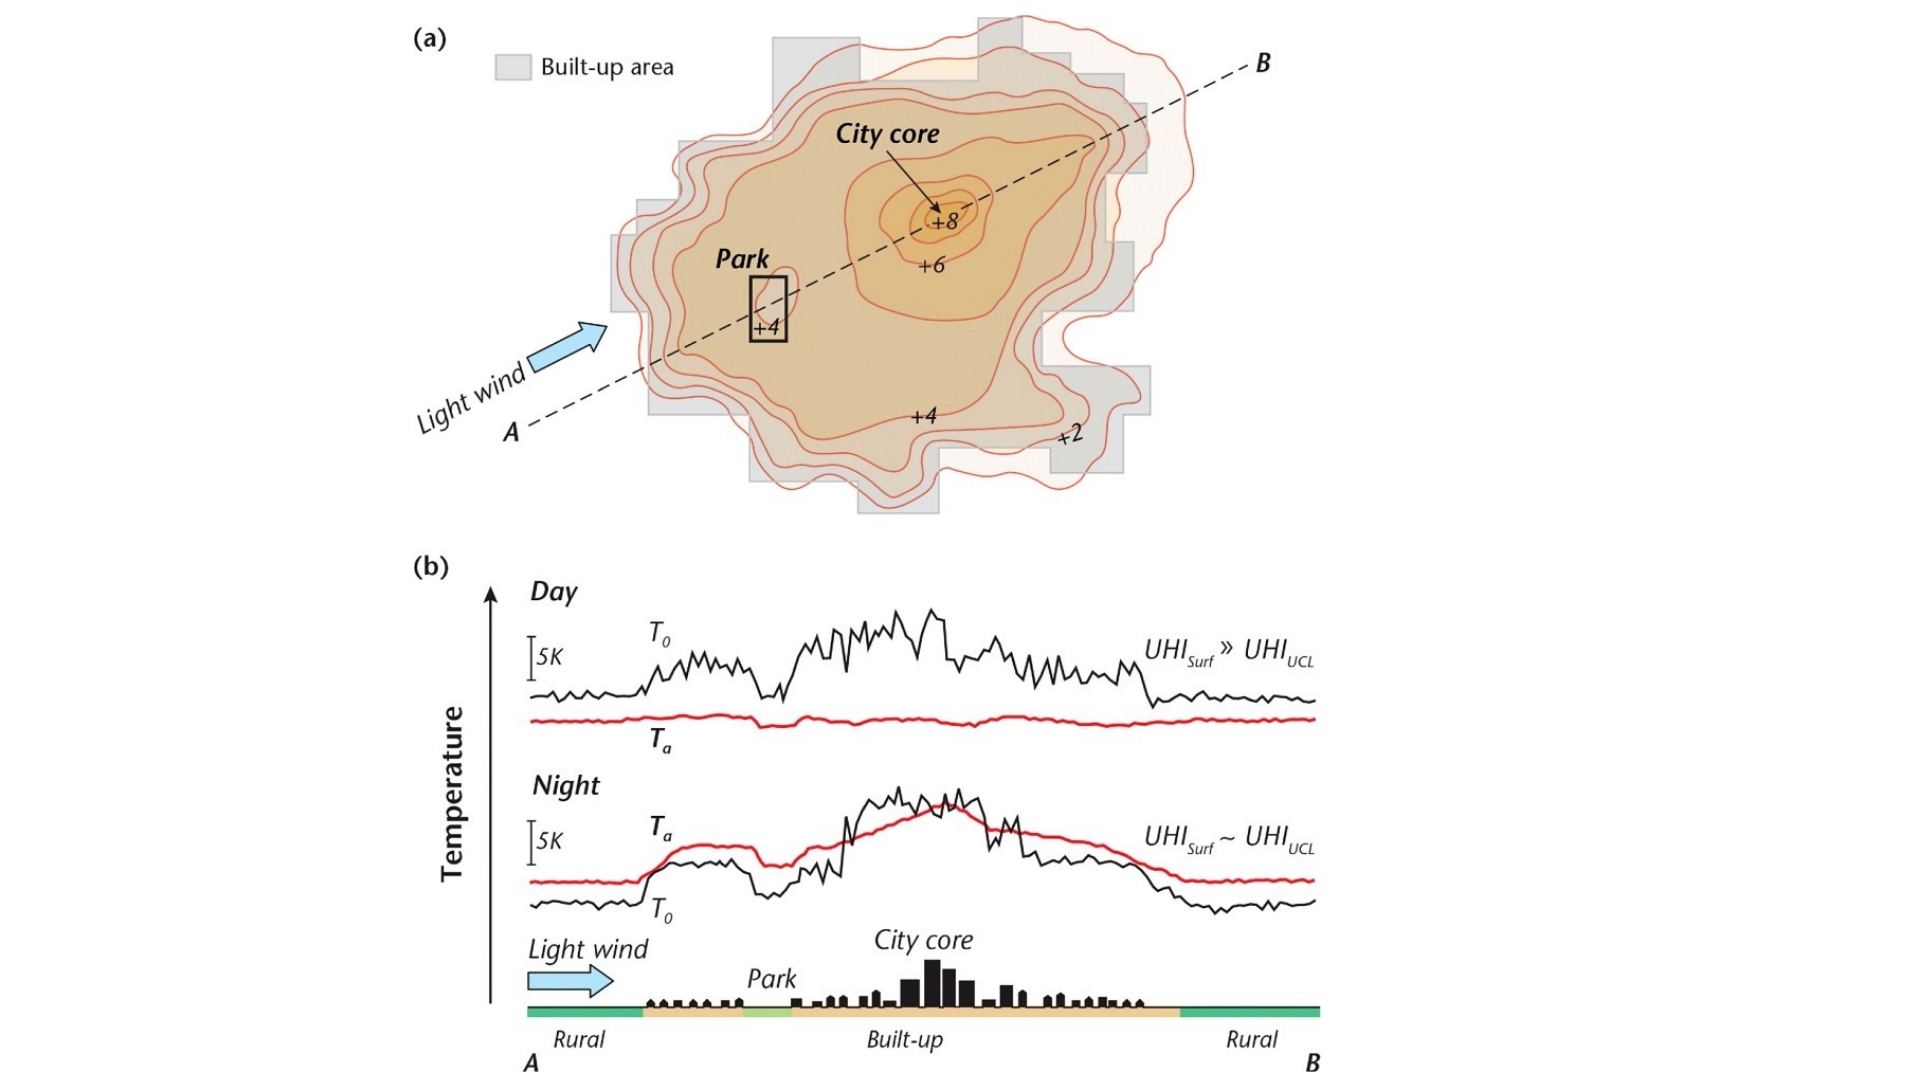
Figure 3 - Text Equivalent
This figure, which has two main components, shows a typical UHI urban canopy layer (UHIUCL) at night in calm and clear conditions in a city on relatively level terrain.
The top component of the figure is an isotherm map illustrating typical features of urban heat islands and their relationship with the degree of urban development. Contour-style lines show the change in temperature across a typical urban area. On the periphery of the urban area, air temperatures are shown to increase by 2°C. In moderately built-up environments, air temperatures are shown to increase by 4°C. Close to the city core, air temperatures are shown to be 6°C warmer, reaching up to 8°C warmer in the core. By contrast, the figure depicts air temperature within a park close to the city core being cooler than the surrounding neighbourhood by 4°C.
The lower component of the figure is a 2D cross-section of a typical urban area showing both day-time and night-time surface temperature (T0) and air temperature (Ta). The bottom of the figure includes a cross-section of the city showing the following (from left to right): a rural area, low-rise buildings, a park, built-up area with a high-rise city core, and finally another rural area. Above this silhouette of the city, lines show the changes in surface temperature and air temperature as they correspond with the built form. The surface temperature during the day and night generally increases in line with the extent of the buildup. For air temperature, during the day the air temperature shows little increase, but at night it too increases in correspondence with the extent of the buildup. The park shows a dip in both air and surface temperatures as compared to the surrounding built areas.
Schematic depiction of a typical UHI urban canopy layer (UHIUCL) at night in calm and clear conditions in a city on relatively level terrain. (a) Isotherm map illustrating typical features of the UHI and their correspondence with the degree of urban development. (b) 2D cross-section of both surface temperature (T0) and air temperature (Ta) in a traverse along the line A-B shown in (a). Source: Oke et al. 2017, reproduced with permission.
| Loss of vegetation | The loss of vegetation and increase in impermeable surfaces in cities from urbanization reduces cooling from evapotranspiration (i.e., evaporation of water from surfaces and transpiration by plants) (Akbari, 2002). |
|---|---|
| Type of material | The type of material and its properties (e.g., solar reflectivity and thermal properties) can impact the intensity of both surface and air temperature UHIs (Rizwan et al., 2008). For example, large areas of dark, dry urban surfaces - such as asphalt, tar roofs, and dark building facades - can absorb the sun's radiation, heating both surface and air temperatures. |
| Building typology and urban geometry | The building typology and urban geometry (i.e., building size, height, form, and arrangement) can alter air flows and help trap heat in urban areas (Bärring et al., 1985; Oke, 1982). |
| Heat release | The heat released into the air from human activities - such as building heating and cooling systems, electronic equipment, and vehicles - can also exacerbate UHIs (US EPA, 2008). |
In addition, climate change has an impact on heat in urban areas. Warmer summer temperatures are expected to contribute to increased surface and air temperatures in many cities in Canada and around the world (Wilby, 2008; Masson et al., 2013). These higher local temperatures, in turn, could magnify the health risk to populations vulnerable to heat (Heaviside et al., 2016; Berry et al., 2014; Zhao et al., 2018). In addition to temperature rises, climate change could affect other climatic factors, altering the micro-climate in urban areas. For example, wind speed or direction, as well as precipitation levels, could change under some climate scenarios. Obtaining climate projections at the regional scale for a particular community (i.e., temperature, wind speed and direction, and precipitation frequency and intensity) could help public health professionals and municipal officials to better plan for future changes in climate at a local scale.
Box 4. Microclimate changes in rural areas
While average air and surface temperatures are generally lower in rural areas than in urban areas, development in rural areas also modifies the local surface energy balance and results in changes to the local microclimate (Oke et al., 2017). Microclimate changes in rural areas are similar to those experienced in cities; it is just that the magnitude and scale are smaller. For example, a senior's residence in a small town with a dark tar roof, minimal wall insulation, south-facing windows without awnings, no trees, and a large adjacent asphalt parking lot could experience higher indoor and outdoor temperatures than average local conditions during the summer. It is therefore important for public health officials and urban and rural planners to integrate thermally comfortable designs in both urban and rural environments.
2.3 How do urban heat islands magnify health risks in summer?
UHIs can magnify the health risks in urban areas during extreme heat events (section 2.1; Heaviside et al., 2017; Li & Bou-Zeid, 2013). The higher air temperatures in areas characterized by UHIs, particularly at night, can limit the body's ability to cool down during extreme heat events (Luber & McGeehin, 2008). In Canada, a modelling study found that a 2°C to 3°C increase in air temperatures can translate to a 4% to 7% increase in the mortality rate attributable to heat (Wang et al., 2016).
Several international studies have made connections between heat-related health impacts and UHIs. The UHI effect was cited as one factor during the 1995 extreme heat events that killed over 700 people in the US Midwest (Semenza et al., 1996). Similarly, the UHI effect is estimated to have contributed to over half of the heat-related deaths during the 2003 extreme heat event in the West Midlands, UK (Heaviside et al., 2015). In Paris, France, during the 2003 heat wave, the high extended nighttime temperatures associated with the UHI effect increased the probability of death in elderly individuals (Vandentorren et al., 2006; Laaidi et al., 2012). In a study of the effect of summer nighttime temperatures on mortality in London, UK, heat-associated mortality impacts were greatest when warm nights were followed by a hot day, especially for stroke-related mortality (Murage et al., 2017). Both community and individual characteristics can impact a person's vulnerability to heat-related illness (Health Canada, 2011) (Figure 4). UHIs are an important community-scale risk factor. They disproportionately impact marginalized populations and residents of lower-income neighbourhoods, since, in many North American cities, such neighbourhoods often lack vegetation (e.g., fewer street trees and less green space) and have a higher proportion of hard and heat-absorbing surfaces, such as pavement, which are two of the main contributors to the UHI effect (Mohajerani et al., 2017). A study in Japan found, for example, that the daytime temperature of normal asphalt can be up to 20°C hotter than grass (Takebayashi & Moriyama, 2012).
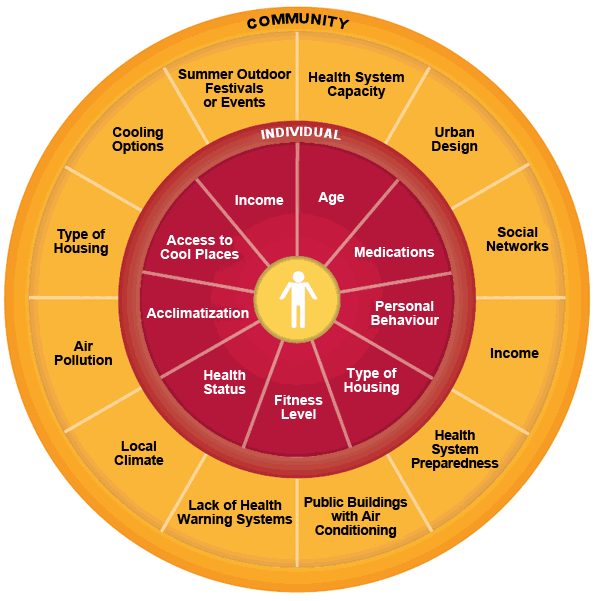
Figure 4 - Text Equivalent
The figure shows the range of factors that determine an individual's vulnerability to heat, at both the community and individual scales. The outer circle layer shows the community scale vulnerability risk factors, while the inner circle layer depicts the individual scale risk factors.
The following factors may help determine population vulnerability to heat at the community scale:
- Summer outdoor festivals or events
- Health system capacity
- Urban design
- Social networks
- Income
- Health system preparedness
- Public buildings with air conditioning
- Lack of health warning systems
- Local climate
- Air pollution
- Type of housing
- Cooling options
- The following factors may help determine population vulnerability at the individual scale:
- Income
- Age
- Medications
- Personal behaviour
- Type of housing
- Fitness level
- Health status
- Acclimatization
- Access to cool places
An individual's vulnerability to heat is determined by a wide range of factors, including those specific to the individual, such as an individual's health status, and those in the community and built environment, including UHIs. Source: Health Canada, 2011.
Not only do lower-income urban neighbourhoods generally have higher temperatures, they also generally have a higher percentage of residents vulnerable to extreme heat. Residents may have higher rates of poverty, poorer housing quality, and less access to social and material resources, such as air conditioning or public cooling centres (Harlan et al., 2006; Harlan et al., 2015; Rosenthal et al., 2015; Voelkel et al., 2018). The higher temperatures in areas characterized by UHIs may also have mental health impacts. Exposure to hot days in California has been associated with more mental health-related emergency department visits and higher rates of suicide (Mullins & White, 2018). Extreme heat can also result in increased aggression and violence, which, in turn, could pose an increased health and safety risk (Anderson, 2001; Trombley et al., 2017). Coupled with the projected increase in extreme heat events due to a changing climate, as well as an aging population in many parts of Canada, increased urban heat can pose a substantial health threat to individuals in neighbourhoods with high numbers of marginalized populations (Graham et al., 2017).
2.4 What changes can communities make to the built environment to reduce urban heat islands?
Communities can implement a suite of measures to reduce UHIs and related heat-health impacts. Key UHI-reduction measures include:
- Expanding vegetation cover by planting and maintaining trees, shrubs, and climbing plants; by creating new open spaces; and by installing green roofs (see Box 5).
- Implementing climate-sensitive urban design and planning for buildings, roads, sidewalks, parking lots, and driveways. This includes increasing surface reflectivity of building and paving materials, for example, by installing reflective roofs.
- Integrating natural ventilation and water features into urban designs to control microclimates at both the local and regional scales. At the local scale, cities may, for example, install fountains in parks or restore previously covered streams and rivers. At larger scales, cities bordering large bodies of water could, for example, ensure their urban design lets cool lake and ocean breezes into the city in summer, while cities in a valley could modify urban designs to make use of valley ventilation effects at night.
- Reducing waste heat production through performing energy retrofits to buildings, installing energy-efficient appliances, and promoting active transportation.
Box 5: Nature-based solutions
Many of the challenges currently facing urban areas, including those introduced or exacerbated by climate change, can be alleviated through naturally inspired design choices. Projects that harness the potential of natural systems are often described as nature-based solutions. These solutions may involve actions or designs that mimic, enhance, or support the functions of a natural system. Examples include building a wetland to help regulate floods and improve water quality, or planting street trees to provide cooling. Beyond the intended objective of many nature-based solutions, there are often additional benefits for human and environmental health. For example, although a green space may be designed to assist with storm water retention, it could also help combat the UHI effect, protect urban biodiversity, and promote better mental health and well-being by reducing stress among local residents. Some green infrastructure, especially trees, can take 10 to 30 years to mature and maximize their positive effects. The climate is projected to change over that time frame, so communities should consider design choices for green infrastructure, such as selecting tree species to plant, that are resilient to future climatic conditions.
Municipalities can use a suite of planning tools and instruments to implement these built-environment actions. These tools include key municipal plans and regulations, such as master plans, climate change adaptation plans, greenhouse gas reduction plans, zoning bylaws, design guidelines, and green building standards. Maps of UHIs and population vulnerability to heat can help decision-makers prioritize interventions to help catalyze change. Public health officials and health authorities have played an important role in advancing many UHI initiatives, from participating on expert steering committees to conducting health impact assessments of proposed plans and policies (see section 3).
2.5 Maximizing the co-benefits of urban heat island-reduction actions
Co-benefits refer to the additional environmental, social, and economic benefits that may stem from a particular action (Cheng & Berry, 2013; Jack & Kinney, 2010). Many of the actions communities can take to reduce UHIs (e.g., planting trees, installing cool roofs, and designing climate sensitive buildings and outdoor spaces) can not only reduce heat-related illnesses and deaths, but also help facilitate active living, reduce greenhouse gas emissions (see Box 6), and reduce storm water run-off. Because reducing UHIs is rarely the top priority for a given municipality, actions that effectively address more than one issue may be of particular interest to local decision-makers. For example, reducing UHIs was one of four key drivers for the City of Markham's Trees for Tomorrow (2014) strategy to plant 75,000 trees across the city.
Box 6: Complementary actions: reducing UHIs and greenhouse gas emissions
Actions to reduce UHIs can dramatically reduce the energy needed for air conditioning and, in turn, lower associated greenhouse gas emissions. For example, Akbari and Konopacki (2005) found that implementing UHI-reduction strategies across the United States could reduce overall electricity consumption by 25%. In another US study, implementing UHI-reduction actions (cool roofs, cool pavements, and tree shading) could lower indoor air temperatures and reduce energy usage for air conditioning in an average Los Angeles home by up to half (Rosenfeld et al., 1998). In China, a study calculated that the existing green spaces in urbanized Beijing could contribute to reducing cooling-related energy usage in Beijing by up to 60% through the absorption of heat through evapotranspiration (Zhang et al., 2014). This research highlights the potential for UHI-reduction actions, such as cool roofs and trees, to reduce greenhouse gas emissions as well.
Public health professionals can help share the environmental, economic, and health co-benefits of various built-environment decisions, including actions to reduce UHIs, with city officials and the public. Emphasizing these co-benefits can provide public health professionals with a greater opportunity to influence municipal decisions related to important determinants of health. For example, in promoting a municipal cool-roof bylaw, public health professionals can advocate for actions that not only protect local populations during extreme heat events but also help tackle the wider issue of climate change mitigation. Climate change is an important determinant of health that is expected to have negative impacts on Canadians (Berry et al., 2014).
3. Case studies
This section features nine case studies that showcase Canadian examples of how public health professionals have worked with urban planners and other key stakeholders to reduce UHIs in their communities (Table 2). For each case study, this section presents the trigger for action, the process through which the initiative was planned and implemented, and the outcome in relation to UHI reduction. The case studies also provide lessons learned and practical insights into how public health professionals can further advance UHI-reduction actions within their communities.
| Case study name | Snapshots |
|---|---|
| Rapid health impact assessment of Halifax's draft Centre Plan Framework |
|
| Québec City pilot project to green Anna Street |
|
| Montréal's ILEAU initiative |
|
| Toronto Shade Policy and Guidelines |
|
| A Health Development Assessment Tool in Peel Region, Ontario |
|
| Improving thermal comfort in parks in Windsor, Ontario |
|
| imagineCALGARY community visioning exercise and long-range sustainability plan |
|
| BC Healthy Built Environment Linkages Toolkit |
|
| Vancouver's Street Tree Cooling Networks |
|
Rapid health impact assessment of Halifax's draft Centre Plan Framework
Snapshot
- Health officials can conduct health impact assessments to evaluate the potential of municipal policies and plans to promote positive health outcomes and reduce UHIs.
Trigger
Health impact assessments (HIAs) are innovative tools that public health professionals can use to promote healthy built environments and UHI-reduction actions. In 2016, Halifax Regional Municipality started working on a Centre Plan, whose guiding objective is to ensure that growth and development in the Dartmouth and Halifax urban cores are sustainable and reflect their symbolic, historic, and functional roles. Developing the Centre Plan, which was still underway at the time of publication in 2019, has involved stakeholder outreach, workshops, open houses, and public consultations. In October 2016, a draft Centre Plan Framework (consisting of a draft vision and guiding principles) was presented to the public for their feedback. Recognizing that the Centre Plan presented a great opportunity to promote health, the Nova Scotia Health Authority (NSHA) conducted a rapid HIA of the draft Framework to evaluate its potential in promoting positive health outcomes and recommend areas for improvement.
Process
In October 2016, staff at the NSHA met with the project manager of the Centre Plan to discuss how best to contribute health input. They decided that it would be timely and valuable to conduct a HIA - a systematic assessment of the health impact of a policy, program, or project. Staff met to review the HIA process, define its scope, choose key topic areas, and form the project team. To ensure that the HIA was feasible and that feedback could be provided by December 2016, four focus areas were chosen: housing, mobility, food systems, and sustainability. UHI mitigation was one of the assessment criteria for sustainability. Because of the short time frame, NSHA staff decided to complete a rapid HIA, which relies on the knowledge of the participants' involved rather than on gathering new evidence.
The HIA was carried out over five weeks and was led by a three-person project team consisting of a public health nurse, a nutritionist, and an urban planner. For each of the four topic areas, the project team systematically reviewed the draft Centre Plan Framework to identify health impacts, equity considerations, and any missed opportunities. Comments were summarized in a spreadsheet and sent, along with a draft report, to a team of expert reviewers for their feedback. Reviewers included representatives from NSHA Mental Health and Addictions, the Nova Scotia Department of Energy, the School of Community Health and Epidemiology at Dalhousie University, and the Applied Research Collaborations for Health group at Dalhousie University. The Medical Officer of Health for the Central Zone of the NSHA provided guidance throughout and reviewed and approved the final report. The HIA report highlighted some of the positive health impacts of the draft Centre Plan framework on residents and included recommendations on components to improve.
Outcome
The HIA provided an opportunity for public health officials to assess the health effects of Halifax's draft Centre Plan Framework and contributed to an emerging conversation on the links among land use, community design, and public health. The project team found that the draft Centre Plan Framework contained several policy statements that supported reducing the UHI effect, including statements about green roofs, urban forest canopy, parks, and open spaces. For example, the draft Framework states that new developments should integrate vegetation and green infrastructure (such as trees, green spaces, green roofs, gardens, green walls, and vegetated storm water management systems) into their design and that the City should continue tree retention, planting, and maintenance programs to achieve targets for the tree canopy. The HIA recommended that the Centre Plan develop criteria to prioritize investments in parks, playgrounds, and other green spaces to reduce the UHI effect, and that a health-equity analysis inform those investments.
Following the HIA, NSHA has continued to be involved in developing the Centre Plan. In 2018, NSHA provided feedback on the first of two planned regulatory packages for the adoption and implementation of the Centre Plan. Included in the first package was a draft Design Manual, a decision-support tool that will be used to guide the site plan approval process for development applications in higher-density neighbourhoods and corridors. UHI considerations have been integrated into the Design Manual. Specifically, the manual has a section on sustainable landscape practices that recommends actions such as using light-coloured and permeable paving materials.
Health Impact Assessment of Transportation and Land Use Planning Activities - A Guidebook
The region of Metro Vancouver has produced a guidebook to health impact assessments. The guidebook includes a step-by-step planning process, common issues and challenges, and lessons learned from the field (Metro Vancouver, 2014).
Lessons learned
Health Impact Assessments can raise the profile of public health - HIAs are useful decision-support tools that can be used to review the health implications of municipal plans and policies. They give public health professionals the opportunity to provide feedback to urban planning and policy-making processes. In Halifax, the rapid HIA played an important role in raising the profile of public health in designing healthy communities and reducing UHIs. HIAs are flexible tools that can be adapted to a number of uses at different scales, from rapid desktop scans that can take a few weeks to comprehensive assessments that can take several months.
Québec City pilot project to green Anna Street
Snapshot
- Public consultations on municipal plans and policies can provide health authorities with an opportunity to advocate for UHI-reduction actions.
Trigger
La Cité-Limoilou (population 107,885) is a centrally located borough of Québec City characterized by early 1900s-era walk-up apartments, sparse vegetation, and air quality issues caused by the nearby port. In 2012, the La Cité-Limoilou borough administration was preparing its Plan d'affaire, a strategic planning document that guides borough activities over a three-year period. To inform the development of the Plan d'affaire, the borough organized a public meeting that brought together over 30 local stakeholders, including public health authorities, neighbourhood associations, and social and environmental organizations. Many of the stakeholders - including senior public health officials at the regional and provincial levels - called for actions to green the borough and reduce the UHI effect. Following consultations with staff in the departments of public works, environmental services, and engineering and forestry serving the central area of Québec City, the borough council decided to implement a pilot project to increase vegetation and reduce the UHI along a street in a neighbourhood with a population vulnerable to extreme heat.
Process
Between 2013 and 2015, the borough of La Cité-Limoilou, with funding from Québec City's Planning and Development Services Department, completed a $2 million pilot project to revitalize and green Anna Street. Borough staff worked with a local college (le Centre d'enseignement et de recherche en foresterie de Sainte-Foy) to develop maps of land-surface temperatures and heat-health vulnerability for the borough. The resulting maps were used to help prioritize the location of the pilot street greening project in an area of greatest vulnerability to health risks from UHIs. Anna Street was ultimately chosen for the pilot project because it lacked vegetation, was located in a socioeconomically disadvantaged neighbourhood, and was slated for a major infrastructure upgrade in 2015 (sewer and road surface replacement). Undertaking street greening projects concurrently with infrastructure upgrades (e.g., sewer replacement) avoids having two separate construction projects, substantially reducing construction-related costs as well as disruptions for local residents.
The design phase of the Anna Street project involved an extensive public consultation process. The municipality contracted a firm that specialized in facilitating public consultations for construction projects to host the public consultation session, develop an online platform to share information about the project, and develop a site-specific redevelopment plan based on feedback from various stakeholders. Harnessing the expertise of outside facilitators ensured that the public engagement activities were neutral and that local residents could feel empowered to drive the redesign of their street. Sixty-six participants - including 20 community-based organizations, property owners, residents, the neighbourhood council, and public health professionals from the Regional Directorate for Public Health - contributed ideas to green Anna Street and reduce UHIs.
Outcome
During the revitalization of Anna Street, 17 of 107 on-street parking spaces were removed, 19 new trees were planted, and 17 new planting bays were installed. Anna Street saw a 6% net reduction in asphalted surfaces reserved for cars (i.e., sidewalks were widened and small patches of open space were created to plant trees and shrubs) and an increase in the tree canopy from 3% to 12%.
Following the completion of the Anna Street pilot project, in 2016, the City began developing a Complete Streets Plan (Rues conviviales) (Ville de Québec, 2018). The plan aims to improve the quality of life and well-being for Québec City residents by integrating physical activity and greening considerations into the design of streets. A key element of this plan is to prioritize "eco-responsible" UHI-reduction measures, such as planting trees. In 2017, the City used public engagement strategies to help design 19 street redevelopment projects across Québec City. The chemin de la Canardière Complete Streets Project, for example, was completed in 2018 and increased the amount of pedestrian and cycling space along the street from 26% to 49%, with extensive tree planting and the construction of planting strips on widened sidewalks to decrease surface temperatures and improve air quality.
Québec City is expecting to publish its Complete Streets Plan in 2019. City staff plan to work with a range of partners (including academics, businesses, non-profits, and health authorities) to collect data and assess the effectiveness of the plan in reducing UHIs and improving public health outcomes for local residents. The lessons learned from the evaluation will be used to help improve future design and construction for street revitalization projects.
Lessons learned
Public consultations are an effective way for health authorities to advocate for UHI-reduction projects - Public health authorities made the case for UHI-reduction actions during public consultations that Québec City hosted in 2013 and 2015. This case study highlights how public health professionals can seize opportunities to participate in public consultations to support UHI-reduction actions.
Pilot projects are a useful tool to gain momentum on UHI-reduction measures ahead of more comprehensive borough- or city-wide actions - Health professionals provided input at several stages of the Anna Street pilot project. By participating in a small-scale pilot project, public health professionals were able to contribute to feasible and favourable redevelopment designs that reduce UHIs. The Anna Street pilot project not only served as a catalyst for the 19 additional street redevelopment projects that help reduce UHIs, but also provided a template to guide their design and implementation.
Montréal's ILEAU initiative
Snapshot
- Health authorities can provide targeted funding to implement practical UHI-reduction actions.
Trigger
The Government of Quebec's 2013-2020 Climate Change Adaptation Strategy committed to "implementing financial incentive measures" to reduce UHIs, to help protect the health of the most vulnerable populations (Government of Quebec, 2012). Quebec's provincial public health agency (Institut national de santé publique du Québec [INSPQ]) implements the health components of the Adaptation Strategy and of the Green Fund, a fund which supports initiatives that help communities in Quebec reduce greenhouse gas emissions and adapt to climate change. In 2015, the INSPQ awarded $1.5 million from the Green Fund to the Conseil régional de l'environnement de Montréal (CRE-Montréal, a non-profit environmental organization). The funding helped CRE-Montréal support community-based greening projects across several boroughs in Montréal's East End, where there is a high concentration of populations vulnerable to extreme heat.
Process
Consequently, CRE-Montréal launched ILEAU - Interventions locales en environnement et aménagement urbain - in 2015, to improve the lives of residents of Montréal's eastern boroughs by helping them reduce UHIs and prepare for climate change. CRE-Montréal has partnered with a range of public, private, and non-profit organizations to implement practical UHI-reduction projects across five boroughs, selected because they have a high proportion of low-income residents, a shorter-than-average life expectancy, and a lack of green space (Radio Canada, 2016).
The overarching goal of the ILEAU initiative is to create an active green corridor in eastern Montréal by implementing actions to support active transportation and improve access to green space. ILEAU has been strategic about selecting where to intervene. The project team established four main criteria for selecting which projects to support (see ILEAU project criteria). The staff at CRE-Montréal that lead ILEAU also collaborated with researchers at local universities to develop conceptual maps that help determine where to prioritize built-environment interventions. For example, ILEAU has collaborated with conservation biologists at McGill University on evidence-based maps that show where to prioritize greening projects in order to establish a connected network of green spaces that maximizes cooling benefits and biodiversity.
ILEAU project criteria
For ILEAU to support a project, the project must:
- Reduce UHIs
- Support the most vulnerable populations (e.g., children and seniors living alone)
- Increase biodiversity
- Have a firm commitment from an organization or business to implement and maintain the project.
CRE-Montréal collaborates closely with partners to implement the ILEAU initiative. Staff at CRE-Montréal arrange meetings with various organizations - including seniors' homes, schools, businesses, borough councils, hospitals, and others - to explore opportunities to advance greening projects. Staff at CRE-Montréal then help interested project proponents to develop a fully costed business plan. Projects that meet ILEAU's four key criteria (see ILEAU project criteria) and are approved by the ILEAU project team receive technical and financial support from CRE-Montréal throughout their implementation. For many projects, ILEAU hires landscape architects, who work closely with property owners and users of the site to draw up site plans (see Design process). CRE-Montréal staff provide technical advice throughout the projects by, for example, helping landscape architects select a range of tree species to maximize tree diversity, or sharing lessons learned about a design element that worked well in another, similar project. Once the landscape architects have completed the site designs, a contractor, residents, or a local non-profit organization (depending on the scope of the project) implements the landscaping measures (e.g., removing asphalt, planting trees and shrubs, and installing landscaping elements such as benches).
Design process
For many of ILEAU's 100 projects, landscape architects:
- Host a needs assessment meeting with property owners and users.
- Develop a draft site plan. Some plans are co-designed with end users.
- Validate the design by engaging extensively with key stakeholders, including CRE-Montréal.
- Finalize the design plan.
Outcome
Since its launch in 2015, ILEAU has supported more than 100 greening projects to reduce UHIs in the five eastern boroughs of Montréal. For example, ILEAU supported the planting of more than 140 trees and shrubs on the grounds of Corporation d'Urgences-santé in Saint-Léonard (an office building), to reduce UHIs and improve the working environment for employees. ILEAU also collaborated with Synergie Santé Environnement (a non-profit organization) in 2016 to plant more than 1,700 perennials, shrubs, and trees at a seniors' home in Montréal's East End. For each project, CRE-Montréal staff have conducted follow-up site visits to meet with borough residents, business owners, and site managers. These site visits provide CRE-Montréal with an opportunity to evaluate the project and take photographs of the redesigned outdoor spaces for use in future campaigns to raise awareness. In 2018, the Government of Quebec extended funding for the ILEAU initiative until 2020, to expand the greening projects to additional boroughs in Montréal's East End.
Lessons learned
Health authorities can provide funds for UHI-reduction projects - The INSPQ, with support from the Quebec government's Green Fund, has been able to fund innovative projects to reduce UHIs in the eastern boroughs of Montréal. By collaborating with local and regional organizations, CRE-Montréal has been able to implement tangible measures to reduce UHIs, such as the greening of surface parking lots, school grounds, hospitals, and office buildings.
Partnerships can take time to nurture - From its launch in 2015, ILEAU has prioritized engagement with a wide range of stakeholders, including the general public as well as private, public, and non-profit organizations. However, building relationships and communicating effectively with stakeholders takes time. CRE-Montréal found that most of the first year of the project was spent meeting with stakeholders and developing communication tools such as ILEAU's website. While partnerships are critical to accomplishing project goals, public health professionals should include consideration for the time it takes to build relationships when preparing plans and timelines.
Toronto Shade Policy and Guidelines
Snapshot
- Shade in summer not only protects Canadians from skin cancer and heat-related illnesses, but can also help communities reduce UHIs.
Trigger
Design guidelines and policies are important tools to shape the design and development of communities. Public health officials in Toronto collaborated with municipal officials, landscape architects, and others to develop design policies and guidelines to increase shade across the City of Toronto, especially in areas where children play. In 2000, the Ultraviolet Radiation Working Group of the Toronto Cancer Prevention Coalition authored a report entitled A Survey of Recommendations of Current Sun Safe Policies and Programs, which highlighted the need for a comprehensive approach to reduce exposure to ultraviolet radiation by increasing shade in Toronto. In 2002, Toronto City Council endorsed the Toronto Cancer Prevention Coalition's Action Plan for Cancer Prevention for the City of Toronto, which included a commitment to develop a comprehensive shade policy and guidelines. While Toronto's 2007 Shade Policy was developed mainly in response to concerns over skin cancer from ultraviolet radiation exposure, reducing UHIs was highlighted as an important co-benefit of shade trees.
Process
In 2002, Toronto City Council directed Toronto Public Health to collaborate with the Toronto Cancer Prevention Coalition to establish a dedicated Shade Policy Committee "to produce a comprehensive policy and related guidelines aimed at providing and maintaining adequate shade (in both built and natural form)" in Toronto. The Shade Policy Committee included members from various organizations, including the Ryerson University Department of Architectural Science, the Toronto District School Board, Environment Canada (now Environment and Climate Change Canada), Evergreen, Ontario Sun Safety Workgroup, and dermatologists from Women's College Hospital and Toronto Western Hospital.
Between 2003 and 2007, the Shade Policy Committee helped develop the foundations for the shade policy in Toronto. In 2004, the Ryerson University Department of Architectural Science, in collaboration with the Shade Policy Committee, hosted a seminar called "Designing for Shade," which was attended by stakeholders in urban design, planning, parks, forestry and recreation, landscape architecture, academia, and public health, as well as community members. The Shade Policy Committee also conducted several pilot projects to test approaches and inform the shade policy. For example, the Shade Policy Committee initiated a shade sail canopy pilot project at Dovercourt Park in 2003, produced a report entitled How to Conduct a Shade Audit in 2005, and successfully advocated to include an increase in shade in the redesign of Nathan Phillips Square, a Toronto landmark, in 2006. A conference called "Shade for Good Health and a Green City,"held in 2007, provided participants from over 50 organizations with the opportunity to discuss options for increasing shade in Toronto. As a result of the Shade Committee's activities, in 2007, Toronto Public Health led the development of the new Shade Policy with the Shade Policy Committee.
Increasing shade in Nathan Phillips Square
In 2006, the Shade Policy Committee successfully advocated to make the provision of shade a required element of proposals submitted for the redesign of Nathan Phillips Square, the area in front of Toronto City Hall. The Shade Policy Committee attended meetings on the redesign process and made the case for shade considerations to be included in the redesign of the Square. As a result of this advocacy, the amount of shade in the square was increased, with a 30% expansion in tree canopy coverage overall. Planting trees was prioritized in selected areas of the Square, including near the children's playground and around the perimeter.
Outcome
In 2007, the Shade Policy was approved by Toronto's Board of Health. The policy stipulates that providing more shade, through either natural tree canopy or constructed coverings, should be an essential element in the planning and development (or redevelopment) of outdoor facilities, particularly for those facilities used by vulnerable populations such as seniors and children. While the emphasis of the Shade Policy was to reduce exposure to ultraviolet radiation and its associated health risks, such as skin cancer, the role of shade trees in helping reduce UHIs was also formally recognized. The Shade Policy emphasizes that strategically placed vegetation can cool cities and reduce UHIs.
The Shade Policy Committee also produced Shade Guidelines in 2010. These guidelines provided recommendations and principles for how city planners, urban designers, parks and urban forestry planners, landscape architects, and other built-environment decision-makers can increase shade throughout the city, in places such as playgrounds, swimming pools, public squares, parking lots, and pathways. To engage the public, a Partners in Action video (Toronto Public Health, 2013) was created to promote the Shade Policy and Guidelines and the health benefits of increased shade.
Waterloo Region Shade Working Group
Other communities in Canada have also developed shade policies and tools. The Region of Waterloo, Ontario, developed a Shade Audit Information Guide and Tool, a Shade Tree List, a Shade Policy Fact Sheet, and a Shade Matters website and video to raise awareness of the many benefits of shade. In addition, the City of Waterloo has prioritized maximizing shade in both its official plan and landscape plans.
Lessons learned
Multidisciplinary partnerships can advance UHI-reduction actions-The involvement of multidisciplinary partners was central to the successful development of the Shade Policy and Guidelines. Sharing knowledge among partners working in public health, architecture, childcare, education, and other fields increased understanding of the benefits of shade, including reducing UHIs. Toronto's Shade Policy and Guidelines demonstrate that public health professionals can successfully help initiate and participate in multidisciplinary partnerships with built-environment stakeholders to advance UHI-reduction actions.
The reduction of UHIs can be a co-benefit of other healthy built-environment actions- The Shade Policy Committee presented a powerful business case to municipal officials for increasing shade in Toronto by highlighting how more shade reduces human exposure to ultraviolet radiation while maximizing other co-benefits, such as reducing UHIs. Since regulations and policies governing land use planning are typically outside the mandate of most health authorities, achieving these co-benefits would have been beyond the scope of public health officials or any single group alone. This case study highlights how an understanding of the co-benefits of proposed actions, including UHI-reduction actions, can lead to a more robust business case and increased buy-in from municipal decision-makers.
A Healthy Development Assessment Tool in Peel Region, Ontario
Snapshot
- Public health professionals can provide input in municipal planning processes to advocate for healthy built environments and to promote actions to reduce UHIs.
Trigger
Peel Public Health is a health authority in southern Ontario serving a population of 1.4 million people in the municipalities of Mississauga, Brampton, and Caledon. In 2005, Peel Public Health released a State of the Region's Health report (Region of Peel, 2005). The report raised concern about the high rate of obesity in Peel Region and the prevalence of diabetes and heart disease. Environmental factors - such as sprawling low-density development and car-centred lifestyles - were highlighted as significant contributors to these health concerns. Following a presentation of the report findings to the Peel Regional Council in 2005, the Council passed a resolution that directed Peel Public Health to become directly involved in providing advice and feedback on urban development applications and planning policies in the region.
Shortly after the resolution, staff of Peel Public Health began providing comments on planning development applications received by Peel Region. While the comments were well received by urban planning staff, health authority staff identified a need for evidence-based tools to help public health professionals provide credible and consistent health information to the development review process. This led to the development of a Healthy Development Index in 2009 and of a Healthy Development Assessment Tool in 2016. While UHI considerations were not the driver for these tools, actions that reduce UHIs were integrated into both the Index and the Tool. Peel Public Health recognized that designing healthy built environments - including neighbourhoods with features such as trees to reduce the UHI effect and keep residents cool - can play an important role in motivating residents to become less car-dependent and more active.
Process
The Healthy Development Index -Completed in 2009, the Index is a high-level framework to support the assessment of the health impacts of new construction and to provide consistent standards to inform the planning process. The Index was developed in partnership with St. Michael's Hospital in Toronto and McMaster University in Hamilton. First, researchers from St. Michael's Hospital identified measures and standards used in urban design and planning projects that are associated with positive health outcomes, according to the published and grey literature (e.g., documents published by governments and non-profit organizations). Using this information as a starting point, the research team and the Region of Peel worked collaboratively to develop the Index. The research team then organized a series of roundtable discussions and meetings with regional and municipal planners and property developers to receive feedback on the draft Index. In addition, Peel Public Health funded a staff position to support implementation of the index by acting as an intermediary between Peel Region's planning and health departments, ensuring their goals are aligned and their work is coordinated.
The Healthy Development Assessment Tool - When the Index was first released, urban planners and public health officials noted that it would be useful to have a checklist and tools to assess whether development proposals were aligning with the intent of the Index. This led to the development of the Tool, which is a user guide for measuring the health-promoting potential of an existing or proposed development, leading to a score. The tool was developed in-house by Peel Public Health and is currently being used by development proponents, as part of their planning applications, to assess the health-promoting potential of a proposed development.
Outcome
The Healthy Development Assessment Tool, which is evidence-based and quantifiable, aims to promote physical activity and healthy lifestyles. Development proponents can use the tool to review and score their proposals in seven categories of the built environment that are known to be associated with health: density, service proximity, land-use mix, street connectivity, road networks and sidewalk characteristics, parking, and aesthetics and human scale. Development proponents can also consult with regional staff, including staff at Peel Public Health, to receive feedback and input on how to improve the health-promoting potential of a proposed development.
In 2014, the Council made promoting built environments that are healthy and age-friendly (i.e. appropriate for use by all ages) a priority. Peel Public Health staff are required to regularly report to Council on the progress of this priority. In addition, healthy built-environment considerations have been integrated into the Peel Regional Official Plan. In 2018, Peel Public Health also developed a mapping tool to measure the current state of the built environment across Peel's neighbourhoods and monitor health-promoting changes in these neighbourhoods over time. The mapping tool includes evidence-based indicators, including the extent of the local tree canopy.
In 2017, the Peel Regional Official Plan was amended to:
- require health assessments for all applicable planning applications;
- require health assessments for all region- or municipal-owned and -operated public buildings;
- require health assessments for all open-space project applications; and
- ensure results of health assessments are reported to local councils as part of the decision-making process.
Lessons learned
Health authorities can be directly involved in the planning process - The findings from the State of the Region's Health report in 2005 resulted in Peel Regional Council passing a resolution that Peel Public Health become directly involved in the planning process. The health evidence presented in the report created a strong case for the role of public health professionals in the planning and development of the region. In addition, the creation of a public health position within the Planning Department, funded by Peel Public Health, is an innovative approach that has allowed health considerations to be directly included in the urban planning process. The development of the Tool and Index, as well as public health feedback on planning applications, have also led to informal connections among staff working in public health and in various departments across the region. This increased dialogue has ultimately helped ensure that development projects are more robust and that health considerations are well integrated.
Improving thermal comfort in parks in Windsor, Ontario
Snapshot
- Actions to reduce UHIs can be one component of a community's broader response to protecting human health from extreme heat.
Trigger
The City of Windsor (population 217,000), Canada's southernmost city, has summertime temperatures that are among the highest in the country. The prolonged hot and humid temperatures during the summer pose a significant public health risk, particularly for vulnerable populations. In 2009, Health Canada partnered with the City of Windsor and the Windsor-Essex County Health Unit to develop a pilot HARS in Windsor called Stay Cool Windsor-Essex. Windsor was one of four national pilot communities partnering with Health Canada to develop a HARS.
Windsor's HARS issues heat warnings and informs residents of what they can do to protect themselves from extreme heat. Building on the HARS, in 2012, the City published a comprehensive Climate Change Adaptation Plan, which called for "an urban heat island study to identify hot spots and their causes as well as the prioritization of actions to reduce them." In 2012, Health Canada supported the City of Windsor with an assessment of UHIs across the City (De Carolis, 2012). One key finding of the report was the need to improve thermal comfort in Windsor's parks, as they were becoming hot and uncomfortable for residents during the summer. The findings from the UHI study helped spur action to improve thermal comfort in Windsor's parks and playgrounds.
Process
In 2013, the City of Windsor's Parks Department led a study to investigate thermal comfort in six of the city's parks and playgrounds. A student was hired with funding from Health Canada to lead the project. A steering committee - composed of staff from Health Canada and the City's Parks Department and Environment and Climate Change Office - provided expert advice at key steps throughout the project. The project team also consulted with municipal and health officials in other jurisdictions to learn from their activities in improving thermal comfort. The research phase of the study included site visits to assess thermal comfort at six parks in Windsor: two community parks, two neighbourhood parks, and two regional parks. The site assessment involved the student observing the current landscape and design features and how people were using the park, as well as completing thermal comfort and shade audits. The shade audits made recommendations for where to increase shade, based on an analysis of the existing extent of shade and data on how the park was used on sunny days in summer (Blanchard, 2013).
The study to investigate thermal comfort in Windsor's parks found that some features of parks and playgrounds in Windsor would get dangerously hot in summer (Richardson and Storfer, 2017). For example, using an infrared camera, the project team found that the rubber mats under playground equipment reached up to 72°C. The final report recommended Windsor rethink the way it designs parks and playgrounds by including cooling features such as trees, shade structures, water fountains, lighter-coloured rubber mats, and splash pads. The report also encouraged the City to integrate thermal comfort considerations into new plans and policies under development.
Building on the recommendations of the parks assessment report, in 2014 the City developed a draft Shade Policy. The purpose of the policy is "to facilitate the use and enjoyment of city parks for all residents during the summer months by ensuring that all users have reasonable access to shade at city parks and related facilities." In addition, in 2015 the City integrated thermal comfort considerations directly into its new Parks Master Plan, which guides the direction and management of Windsor's parks until 2025. Thermal comfort considerations were highlighted in numerous recommendations, including reviewing splash pad locations to ensure adequate shade coverage and formalizing park management standards to include shade considerations.
Outcome
Between 2013 and 2018, Windsor's Parks and Recreation Department integrated thermal comfort design features in over 12 city parks, including installing new shade structures and water fountains and planting trees to shade play equipment at all new playgrounds. The Parks Department has also integrated thermal comfort into its everyday work. For example, the Manager of Parks Development routinely carries a temperature gun - which calculates the surface temperature of an object it is pointed at - when conducting site visits to parks or playgrounds. Before refurbishing a park or play area, Parks Department staff now regularly conducts site evaluations to evaluate thermal comfort; this includes an assessment of shade and surface temperatures. The City is also integrating thermal comfort and UHI considerations directly into its upcoming Urban Forestry Master Plan, which is expected to be completed in 2020.
Key outcomes in Windsor
- Shade structures in nine parks
- Shaded seating in three parks
- Splash pads for children in three parks
- Two water-bottle fill sites along the Central Riverfront
- Strategic planting of trees at 27 playgrounds across Windsor to keep children cool in summer
Lessons learned
Communities can implement UHI measures incrementally over time - Windsor recognized that extreme heat presents serious health risks to residents, and in 2009 partnered with Health Canada to launch one of four national pilot community HARS. Since then, the City has implemented actions to improve thermal comfort in outdoor spaces, starting with a report to assess thermal comfort in six of Windsor's parks and resulting in cool features, such as trees, water fountains, and shade structures, now routinely being installed when a park or playground is being refurbished. Windsor's experience shows that targeted measures can be implemented incrementally to reduce UHIs and advance community well-being.
Seize opportunities to partner with health authorities - The City of Windsor collaborated with Health Canada to hire several summer students to support this project. Proponents of UHI projects should stay attentive to available funding sources and actively seek and explore innovative partnerships with public health professionals at the local, regional, provincial, and national levels that can advance mutually beneficial goals.
imagineCALGARY community visioning exercise and long-range sustainability plan
Snapshot
- Public health professionals can contribute to long-term sustainability plans that lay the groundwork for future UHI-reduction actions.
Trigger
Over the last 30 years, the City of Calgary has experienced unprecedented levels of population growth, from 692,885 people in 1990 to over 1.3 million people in 2017. In 2004, Calgary joined the Sustainable Cities: PLUS Network - a network of cities from around the world committed to enhancing long-term quality of life. Membership in this network requires the city to prepare a long-range sustainability plan to guide its future development. Staff from the City of Calgary proposed a City-led, community-owned long-range sustainability plan that would involve an extensive community visioning exercise. Between 2005 and 2007, the City of Calgary developed the imagineCALGARY Plan to guide the city's development for the next century. Experts from various sectors, including the Calgary Health Region, helped develop the plan, which focuses on five key aspects of sustainability: built environment and infrastructure, the economic system, the governance system, natural environment, and the social system. Mitigating the UHI effect was included as one strategy to support a sustainable natural environment.
Process
Development of the imagineCALGARY Plan started in 2005, with an extensive community visioning exercise, and involved 150 core participants from multidisciplinary backgrounds. The project team was composed of City of Calgary staff with backgrounds in environmental studies, planning, economics, social work, and communications. The project team received expert advice throughout the development of the plan from the Mayor's Panel on Urban Sustainability as well as several working groups. The Panel was a multidisciplinary group of city leaders, including a representative from the Calgary Health Region. Working groups, which also included members from the Calgary Health Region, helped develop the more technical aspects of the plan, including providing input about the impacts of UHIs on humans, the environment, and the economy.
For the community visioning exercise, the project team used creative engagement strategies to gather opinions from Calgary residents, including setting up booths at festivals, shopping malls, and schools; hosting visioning sessions with diverse groups across the City; and having theatre groups travel on public transportation, where they started conversations with residents. Health considerations were raised during these public consultations. The plan was developed iteratively, with public and stakeholder feedback being integrated into each draft version of the guide. Over 18,000 Calgary residents participated in the imagineCALGARY Plan, making it one of the largest community visioning process of its kind anywhere in the world.
Outcome
Calgary City Council endorsed the completed imagineCALGARY Plan in 2006. The plan includes a long-range vision for the future of Calgary, as well as specific goals and targets for each of the five key areas. The plan included several health-related targets, such as access to a safe and clean natural environment and good mental health. These targets are meant to guide organizations and individuals in Calgary in taking action to reach the goals of the Plan. The plan has one reference to UHIs: the installation of "green roofs to reduce the UHI" effect was included as a strategy to address air quality and emissions under the "natural environment" section. In addition, the plan indirectly supports UHI-reduction actions, with many of the suggested actions for built environment and infrastructure and the social system helping to reduce urban temperatures. For example, in the section on active transportation, the plan calls for built-environment strategies to increase parkland and natural vegetation within the city, both of which can reduce UHIs.
Since it was endorsed by Council in 2007, the imagineCALGARY Plan has laid the foundation for integrating healthy built-environment and UHI-reduction actions in many of the City's plans and policies. For example, Calgary's transportation plan, published in 2009, now includes the use of native vegetation and a layered tree canopy in transportation corridors to reduce the UHI effect. In 2016, the City of Calgary celebrated the 10-year anniversary of imagineCALGARY. The City and community partners published 10 case studies to highlight the initiatives that have been inspired by the imagineCALGARY Plan, including the Council-approved 2011 Cycling Strategy and the City's investment in cycling infrastructure. This success story highlighted the Cycling Strategy's role in reducing greenhouse gas emissions, promoting health and well-being, and encouraging active lifestyles.
Lessons learned
Public health professionals can contribute to municipal plans and policies - The imagineCALGARY Plan has laid the groundwork for the implementation of healthy built environment actions and UHI-reduction measures in Calgary. Through their work on the Mayor's Panel and the working groups, public health professionals were able to advocate for strategies to improve health outcomes. This case study highlights the important role public health professionals can play in helping guide the goals and outcomes of community plans and policies.
Community visioning exercises can increase support for a healthy built environment - Having Calgary residents provide input to the imagineCALGARY Plan ensured that there was public support for the goals and strategies that were developed. When developing community plans, policies, and initiatives, community visioning exercises and public consultations can increase buy-in and awareness of actions to create a healthy built environment. Public health professionals can advocate for UHI-reduction actions through such exercises and consultations.
BC Healthy Built Environment Linkages Toolkit
Snapshot
- Public health professionals can collaborate with municipal officials and urban designers to develop practical guidance on how to reduce UHIs.
Trigger
In 2008, the British Columbia Provincial Health Services Authority supported the creation of the Healthy Built Environment Alliance, a voluntary group of organizations that promotes healthier, more liveable communities. Members of the Alliance include all five of British Columbia's regional health authorities, the Provincial Health Services Authority, the First Nations Health Authority, the BC Ministry of Health, academic institutions, and non-governmental organizations.
Through conversations with stakeholders, the Alliance discovered that health practitioners were increasingly recognizing links between the built environment and health, but were finding it challenging to identify practical actions to promote healthier built environments. This, combined with the release of a summary paper Foundations for a Healthier Built Environment by the Provincial Health Services Authority in 2009, highlighted the need for a clear and easy-to-navigate resource providing evidence of the relationship between built environment and health and recommended design interventions. With leadership and funding from the Provincial Health Services Authority, the Alliance guided the development of the Healthy Built Environment Linkages Toolkit (BCCDC, 2018). Although reducing UHIs is not the main focus of the Toolkit, it is included as one element.
Process
The Alliance was responsible for leading the development of the Toolkit, managing the project, facilitating specialized advisory bodies, and serving as a hub for communication among various stakeholders. Throughout the development of the Toolkit, the project team emphasized the important role of local health authorities in addressing built environment and health issues.
Advisory bodies were developed to provide technical expertise and advice to the authors of the Toolkit in five core components:
- healthy neighbourhood design,
- healthy housing,
- healthy food systems,
- healthy natural environments, and
- healthy transportation networks.
Invitations to be part of these advisory groups were extended to municipal government departments, academics, and other stakeholders. The advisory groups worked closely with content experts from around the province to ensure the Toolkit was evidence-based. Graduate students, consultants, and the Provincial Health Services Authority collaborated to author the Toolkit.
Outcome
The original Toolkit was completed in 2014. Its goal was to assist users, particularly public health professionals, in applying health evidence to the decision-making process for built environments, and to direct users to further information on healthy built environments. The Toolkit had several key elements: an overarching vision, a series of planning principles, evidence-based explanations of the health impacts of each of the five built-environment areas, and case studies. Reducing UHIs is included as a guiding principle under the healthy natural environments component. The Toolkit also defines the UHI effect and provides some evidence-based planning solutions to reduce UHIs.
Health authorities across British Columbia are using the Toolkit to integrate health considerations into local urban-planning processes. For example, in 2017, the toolkit was used to inform an update to New Westminster's Official Community Plan.
In 2015, the Provincial Health Services Authority surveyed 79 public health practitioners, urban planners, researchers, consultants, as well as municipal, regional, and provincial government staff to produce an evaluation report of the Toolkit. The evaluation found that nearly 80% of survey respondents felt the toolkit made it easier to apply health evidence in healthy built environment decision-making processes, and 85% found that it increased their understanding of the links between health and the built environment. Participants in the evaluation also highlighted 15 practical ways that the Toolkit had been applied in practice to shape urban planning policies and processes at the municipal level.
The Alliance updated the Toolkit in 2018, adding information based on the latest research (BCCDC, 2018). There is new material on social well-being, the economic advantages of designing healthy built environments, and considerations for small and medium-sized community contexts.
Lessons learned
Understanding the scientific evidence is critical to starting conversations about healthy built environments - The Toolkit has helped public health professionals, urban planners, and others to use health evidence to inform land use planning decisions. This case study also demonstrates how public health professionals can lead or collaborate on guidance materials that help urban designers with advancing actions that reduce UHIs and promote healthy built environments.
Guidance materials and other healthy built environment tools should address the unique needs of different stakeholders - In this case, public health professionals and municipal planners had different needs for evidence in implementing healthy built environment strategies and UHI-reduction actions. For example, health professionals were keen to see detailed references to original studies included in the Toolkit, while municipal planners were interested in learning about how to move from the evidence to action. Reviewing and updating the Toolkit every few years allows user feedback to be taken into consideration to ensure the Toolkit remains relevant to a diversity of stakeholders.
Vancouver's Street Tree Cooling Networks
Snapshot
- Health authorities can develop heat-health vulnerability maps that help municipalities identify where to prioritize actions to reduce UHIs.
Trigger
An extensive urban tree canopy can help cool cities and reduce heat-related illnesses and deaths. During the development of Vancouver's Urban Forest Strategy in 2014, the Parks Board overlaid maps showing UHIs and population vulnerability with high-resolution maps of Vancouver's tree canopy. This electronic overlay of the three maps led to an "ah ha moment" for the Parks Board staff. On the map, areas of the city that had high surface temperatures and high percentages of vulnerable populations corresponded with areas characterized by low tree canopy cover. In response, the City developed Vancouver's Street Tree Cooling Networks, an initiative to "cool our streets and shade our paths" by planting trees in these three priority zones (see Figure 5).
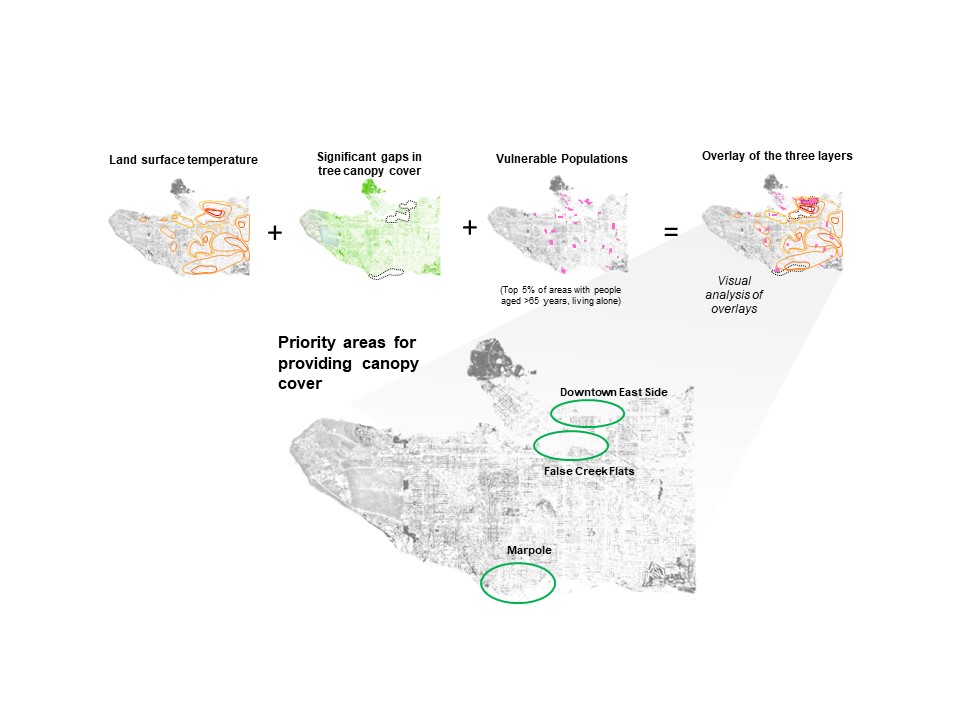
Figure 5 - Text Equivalent
Figure 5 is composed of the following 4 small maps (Maps 1 to 4) and 1 larger map (Map 5) of the City of Vancouver:
- Map 1: Land surface temperature, using isotherm lines to identify warmer areas in the City.
- Map 2: Significant gaps in tree canopy cover, showing tree canopy cover.
- Map 3: Vulnerable populations, showing the top 5% of areas with people aged over 65 of age or older and living alone.
- Map 4: An overlay of the first 3 maps.
- Map 5: A large map showing priority areas for providing tree canopy, identified with ovals. They are the Downtown East Side, False Creek Flats, and Marpole.
The figure shows that Maps 1, 2 and 3 have been overlaid to produce Map 4. City of Vancouver staff then conducted a visual analysis of Map 4 to determine where the urban heat islands, low tree canopy cover and high population vulnerability intersect. The result is Map 5, which shows the three priority areas for planting trees in Vancouver to maximize cooling benefits to residents.
Process
In 2012, the City adopted a Climate Change Adaptation Strategy. Under Objective 4.2 of this strategy ("Minimize morbidity and mortality during heat waves"), the City committed to develop "urban heat island effect mapping (and) coordinate with parks on targeting green space and trees in hot areas." To reach this objective, in 2014 a research team at SFU, with support from the City's Sustainability Department and Health Canada, developed maps to visualize heat-health vulnerability characteristics across Vancouver. The goal of this mapping project was to identify areas with a high number of people from populations vulnerable to heat, where priority interventions to reduce UHIs (e.g., planting trees and locating drinking fountains) were needed most.
While developing the maps, the researchers at SFU consulted various stakeholders, including technical experts at Health Canada and the BC Centre for Disease Control as well as members of Vancouver's Extreme Heat Planning Committee. The project resulted in a series of digital data layers: maps of surface and air temperatures, identification of seniors living alone, and the location of cooling centres and homeless shelters.
The resulting maps were shared with various offices in the City government, including the Parks Board. Parks Board staff then overlaid the heat-health vulnerability maps with tree canopy data. This allowed them to identify three zones in the city where tree planting was needed most to help keep vulnerable residents cool. Each of the three zones share similar characteristics: a high proportion of impervious surfaces, a sparse tree canopy, and a large number of people vulnerable to heat living in the area (e.g., seniors living alone, lower-income residents, and homeless residents).
Outcome
Vancouver's Greenest City Action Plan (2012) included the City's commitment to plant 150,000 trees across Vancouver between 2010 and 2020. Identifying Street Tree Cooling Networks has helped City staff prioritize where to focus planting efforts to maximize health and environmental benefits to the community. The City has advanced various actions related to the Street Tree Cooling Networks. The City has integrated considerations for green infrastructure, including tree planting, into the development review process for large building and infrastructure projects. The Parks Board reviews all proposals for large private-sector developments and works with the proponents to ensure that trees and other green infrastructure are integrated into designs. For example, the Parks Board worked with the developers of the Oakridge Mall (which falls just outside one of the Street Tree Cooling Networks) to design a 10-acre woodlot on the roof of the building. The Board also works with major public-sector infrastructure and development proponents (e.g. hospitals, major transportation infrastructure projects, and schools) toward the same goals.
Lessons learned
Maps are powerful visualization tools that can help support municipalities with advancing UHI actions and protecting vulnerable populations during heat waves - The maps of heat-health vulnerability characteristics developed in Vancouver helped spur the development of the City's Street Tree Cooling Networks. The three zones selected are highly urbanized areas where it is difficult to plant and maintain trees, requiring more City resources. Had it not been for these maps, these priority zones might not have been chosen as locations to increase tree density.
Public health professionals can play an important role in developing maps and other decision-support tools - Vancouver's Sustainability Department collaborated with Health Canada to develop the heat-health vulnerability maps for Vancouver. Health agencies (i.e., the BC Centre for Disease Control) and emergency managers were also engaged during the development of the maps, providing data layers (e.g., indices of vulnerability to heat) and validating the maps. The resulting data and maps can, in turn, be used to prioritize action to protect public health.
4. How public health professionals can help reduce urban heat islands
Public health professionals can play an important role in advancing UHI-reduction actions. While the power to regulate land uses and the built environment typically rests with municipal planning departments, public health professionals (e.g., professionals working in health authorities, provincial governments, universities, and non-profit organizations) can be proactive and seek to influence change to the built environment.
An analysis of the case studies in section 3 identified three main ways in which public health professionals in Canada can support municipalities and other partners in advancing UHI-reduction actions. They can:
- build understanding and capacity among urban design professionals (see section 4.1);
- provide input in the municipal planning and development process (see section 4.2); and/or
- implement physical measures to reduce UHIs, either directly, in the construction of buildings used for delivering health services, or indirectly, by administering grants that provide funds to other sectors to reduce UHIs in their buildings and operations (see section 4.3).
The contents of this section are based on the case studies (see section 3) as well as best practices from the literature on the built environment and health published in Canada and internationally (reviewed for this report). Inspiration for this section comes, in particular, from the province of Québec, where the provincial health authority (Institut national de santé publique du Québec) has implemented ambitious measures to help reduce UHIs, including funding for projects to retrofit public spaces and buildings to reduce UHIs in vulnerable neighbourhoods.
Box 7. Tools and resources on Health Canada's web site
To augment this introductory guide, Health Canada has published on its web site various tools and resources to help public health professionals advance UHI reduction actions.
Decisions about which tools and mechanisms to use in a particular community depend on various considerations, including local priorities and values, as well as the legislative context for each public health authority and municipal government. Understanding the rules and regulations for land-use planning in the province or territory is important in determining which UHI-reduction action(s) to implement in a particular community.
4.1 Building capacity
Public health officials can help build understanding and capacity among urban design professionals, architects, engineers, municipal staff, and the public about the risks that UHIs pose to human health and the multiple co-benefits of UHI-reduction actions.
| HOW? | EXAMPLES |
|---|---|
|
imagineCALGARY Plan imagineCALGARY is a strategic 100-year sustainability plan for the City of Calgary that was based on extensive public consultations with over 18,000 public, private, and non-profit sector stakeholders. Health professionals from Calgary Health Region partnered with City leaders and staff to guide the development of the plan and provide technical expertise while it was being prepared. The resulting plan, published in 2007, included one action specifically to reduce UHIs (see imagineCALGARY case study in section 3). |
|
Canadian Public Health Association Discussion Paper on the Ecological Determinants of Health The Canadian Public Health Association (CPHA), a national non-profit organization, periodically produces policy and position statements to inform public debate on public health topics in Canada. For example, in 2015 the CPHA published a Discussion Paper on the Ecological Determinants of Health (CPHA, 2015). The paper includes a series of recommendations for public health professionals and organizations, including one to "protect people and communities from the adverse impacts of ecological change [by identifying] the vulnerability of individuals and communities to increasing frequency and severity of floods, fires, storms, urban heat events and other climate-related events." |
|
Climate Change and Public Health Vulnerability Assessment in Peel Region, Ontario Climate change and health vulnerability assessments provide evidence and understanding of the links between climate and health by identifying vulnerable populations, highlighting system weaknesses, and suggesting interventions to respond (WHO, 2013). Peel Public Health conducted a health vulnerability assessment to support the region's Climate Change Strategy in 2011. The assessment found that the UHI effect posed considerable health risks in the Region. As a result of the assessment, a digital mapping tool was developed to help municipalities prioritize tree planting to maximize social, environmental, and economic benefits to residents. The assessment tool includes criteria that prioritize tree planting in areas impacted by the UHI effect (see Peel Region case study in section 3). |
|
ICLEI Livable Cities Forum Each year ICLEI Canada hosts a Livable Cities Forum to explore how to build healthy communities that are resilient to climate change. At the 2014 Livable Cities Forum in Vancouver, BC - attended by participants from various fields, including urban planners, academics, and public health officials - a Health Canada official delivered a presentation on how the department is helping communities in Canada reduce the health impacts from UHIs (ICLEI Canada, 2018). |
|
Ontario Climate Change and Health Toolkit The Ontario Ministry of Health and Long-term Care, with support from Health Canada, developed a toolkit that provides practical guidance to public health units in Ontario for assessing climate change and health vulnerabilities in their communities and developing effective adaptation strategies to reduce risks (Ebi et al., 2016). The toolkit adopts a participatory approach to investigating climate change impacts on health and promotes engagement of a wide range of stakeholders and partners in acquiring data, analyzing vulnerability, and communicating findings. It includes information on how UHIs can magnify health risks for residents and ideas for practical UHI-reduction actions. |
4.2 Providing input in municipal planning and development processes
Public health authorities can provide input through municipal planning and development processes to help shape the design of communities, buildings, and infrastructure to reduce adverse health impacts and improve health outcomes.
| HOW? | EXAMPLES |
|---|---|
| Provide input through public consultation processes - Many municipalities are required by law to consult the public during the development of major plans and policies or before approving large construction projects. Public consultations can be conducted in-person or online; in many cases, the outcomes of the consultations are included in a summary report. Health authorities can formally provide oral or written submissions as part of these consultations, which, in turn, can help shape municipal policies and development outcomes. Health authorities in Canada have provided input to a range of public consultation exercises - from those for official plans, zoning bylaws, site-specific plans, and design guidelines to environmental assessments. | Recommendations submitted by Santé Montréal to a public consultation process In 2014, the City of Montréal facilitated a public consultation process for the development of the urban agglomeration of Montréal land-use and development plan (Schéma d'aménagement et de développement de l'agglomération de Montréal), the City's Master Plan. Montréal's public health authority, Santé Montréal (Direction de la santé publique), submitted its recommendations as part of the consultation process for the new plan. Among other suggestions, Santé Montréal recommended the City prioritize tree planting in the neighbourhoods with populations most vulnerable to the health impacts of UHIs. |
| Conduct a health impact assessment to feed recommendations into planning and development processes - Public health professionals can undertake HIA or other types of assessments, and subsequently share their outcomes through the formal engagement process to develop municipal plans and policies. An HIA is a tool that local governments and health authorities can use to evaluate the potential impacts of a plan, policy, or development project on the health of residents. The intensity of the UHI effect, and its health impacts on local residents, can be assessed as one component of various assessment tools. Other assessment tools include, environmental assessments, which are tools that governments at all levels (local, regional, provincial, and national) currently use to assess the socioeconomic and environmental impacts of a development on a community or region. Vulnerability assessments are a structured process to identify the vulnerability of human and natural systems to climate change. | Health Impact Assessment in Halifax Regional Municipality, Nova Scotia In 2016, a draft of Halifax Regional Municipality's Centre Plan was presented to the public for feedback. The Nova Scotia Health Authority conducted a rapid HIA of the draft plan to assess its potential health impacts. The HIA assessed how the plan addressed UHI reductions and made further recommendations for action. |
| Provide UHI and heat-health vulnerability maps to municipalities - Maps are powerful visualization tools that can help translate scientific concepts into images that have clear and practical meaning for municipal officials and the public. Maps can illustrate the extent and intensity of surface and air UHIs, the location of populations vulnerable to heat, and prioritize where to implement land-use planning actions and public health interventions. Heat-health vulnerability maps can be readily incorporated into municipal plans, policies, and actions. Public health professionals can play an important role in developing maps and other decision-support tools. | Heat-health vulnerability maps in Vancouver, BC The City of Vancouver partnered with Health Canada and Simon Fraser University to produce a series of UHI and heat-health vulnerability maps for use by city planners and public health officials. Public health professionals (i.e., at the BC Centre for Disease Control and Health Canada) and emergency management officials were consulted during the development of the maps. The resulting maps have been integrated into the City of Vancouver's Urban Forest Strategy to help prioritize tree planting in those neighbourhoods that have the highest surface temperatures (see Vancouver's Street Tree Cooling Networks case study in section 3). |
4.3 Implementing physical measures to reduce urban heat islands
Local and regional public health authorities are well placed to physically implement actions to reduce UHIs through their own initiative or in partnership with others.
| HOW? | EXAMPLES |
|---|---|
| Grant and incentive programs - Public health authorities can administer grant and incentive programs that fund physical measures and demonstration projects to reduce UHIs. These grant and incentive programs can support the development of a particular urban feature, such as green alleyways, or can have a broader mandate encompassing building retrofits, new construction, and outdoor urban features, such as streetscapes, parks, playgrounds, and vacant lots. While many grant programs have traditionally been implemented by municipal and provincial governments, health authorities at the local and regional level can also develop their own grant programs or collaborate with other partners to jointly issue grants that advance mutually beneficial goals. The resulting grants for UHI-reduction projects can range in scale from several dollars (e.g., free tree saplings) to multi-million-dollar grants for the retrofit of public buildings or infrastructure. In Canada, UHI-focused grant programs have supported a range of pilot projects, including the greening of hospitals, parking lots, and school grounds, as well as the installation of cool roofs and green alleyways. | Government of Quebec "cool island" grant program From 2009 to 2012, the Government of Quebec administered a $14 million grant program to support pilot projects to reduce UHIs. The grants were open to municipalities; publicly funded services such as schools, daycares, and affordable housing; and non-profit groups such as environmental groups and housing cooperatives. In total, the 37 projects were selected and obtained funds (INSPQ, 2018). In Montréal, for example, the Pointe-de-l'Île School Board retrofitted a paved school ground with cool design features, including trees, shrubs, and green space. |
| Lead by example - Public health authorities can lead by example by integrating measures to reduce UHIs into the design and construction of public health facilities or clinics. Where public health authorities and municipalities share an administrative structure (e.g., various public health authorities in Ontario share administrative boundaries with a city or regional government), there may also be an opportunity for the public health authority to advocate for the adoption of UHI-reduction measures for publicly owned municipal buildings, to help reduce UHIs and meet other objectives for healthy communities. | Green building construction by Vancouver Island Health Authority Vancouver Island Health Authority in BC, which serves over 767,000 people, requires that all new health facilities be certified green buildings (i.e., LEED gold standard). The Patient Care Centre at the Royal Jubilee Hospital in Victoria and the Emergency Department at the Nanaimo Regional General Hospital in Nanaimo are both certified LEED Gold. Both buildings include features intended to reduce UHIs - the Patient Care Centre has green roofs, while the Nanaimo General has light-coloured reflective roof materials. |
4.4 How can public health professionals decide on which measure, tool, or strategy to use?
Public health interventions to advance UHI projects can range in scale from simple to comprehensive. In many cases, actions to reduce UHIs evolve over time, with smaller projects building momentum progressively toward a larger or more comprehensive initiative. For example, in Toronto, the Shade Policy Committee started by implementing two pilot projects before moving forward with developing a broader shade policy and design guidelines.
How can health professionals decide which measure, tool, or strategy to use? Table 3 provides a series of questions that health professionals can use to help set priorities and build the case to support specific UHI-reduction strategies and/or tools. The questions are intended to serve as a useful starting point to enable application by a wide range of health authorities that may be at varying stages in advancing UHI-reduction action or may be guided by different priorities.
Box 8. THE SCALE OF ACTION
SIMPLE MEASURE
UHI measures that can be implemented with minimal time and resources and have immediate benefits (e.g., distributing tree saplings at an Earth Day event).
TO ↓
COMPREHENSIVE MEASURE
A detailed, comprehensive multi-year UHI plan, policy, or measure (e.g., municipal cool roof bylaw).
Before selecting criteria, a common first step is to evaluate existing plans, initiatives, partnerships, and capacities, to identify gaps and opportunities for action. This could involve a cursory desktop assessment of health policies and programs to identify existing initiatives related to UHI reduction, or a detailed inventory of UHI reduction-related activities led by the health authority or other stakeholders (e.g., municipal staff) through a stakeholder engagement exercise. Understanding the current context also helps identify opportunities to better integrate UHI-reduction considerations in ongoing initiatives. There are various tools available to help professionals conduct inventories of existing and planned actions by municipal or public health authorities, including ICLEI Canada's "Change Climate, Changing Communities" adaptation planning guide (ICLEI Canada, 2010) and the Ontario Climate Change and Health Toolkit (Ebi et al., 2016). A list of tools and resources that could help public health authorities advance UHI-reduction actions is available on the Government of Canada's web site. An evaluation may also be useful in answering some of the questions in Table 3.
| THEMES | QUESTIONS |
|---|---|
| Strategic fit |
|
| Health outcomes |
|
| Values and partnerships |
|
| Parts of this table were adapted from North West Local Health Integration Network, 2009. | |
5. Lessons learned and conclusions
The nine case studies presented in section 3 demonstrate that public health professionals in Canada are taking action now to support municipalities with their efforts to reduce UHIs. The case studies revealed several key lessons learned that other public health authorities can consider before moving forward with UHI-reduction actions:
- Canadian public health professionals have successfully advanced UHI-reduction actions in a variety of different geographic and political contexts. This guide includes at least one case study from each major southern region of Canada (i.e., British Columbia, the Prairies, Ontario, Quebec, and Atlantic Canada). While municipal decision-makers and urban designers may be best placed to design and implement UHI-reduction projects, the case studies included in this guide showcase the important role that health officials play. Actions public health officials can take include, for example, supporting the development of decision-support tools, supporting research, providing information through presentations, and producing reports (see section 4).
- Public health officials have focused their efforts on ensuring those most vulnerable to extreme heat are prioritized when implementing UHI-reduction actions. In Vancouver, for example, the Parks Board overlaid maps of the UHI effect with maps of tree canopy coverage and populations vulnerable to extreme heat to determine zones of the city in which to prioritize tree planting. The Health Impact Assessment in Halifax provided public health officials with the opportunity to review proposals with a health-equity lens, which included considerations to help reduce health risks among populations vulnerable to extreme heat. The focus by public health authorities on helping those populations that are at the greatest risk is consistent with recommendations in the literature. Richardson et al. (2009), for example, recommended that "UHI adaptation efforts and resources should be targeted primarily to those areas in a city or region where the most exposed and most vulnerable populations reside."
- UHI reduction is often pursued as a co-benefit of creating healthy built environments. Many of the actions communities can implement to reduce UHIs (e.g., planting trees, installing cool roofs, and designing climate-sensitive buildings and spaces) can not only lower heat-related illnesses and deaths but also help facilitate active living, reduce greenhouse gas emissions, and reduce storm water run-off. At the municipal level, the trigger for actions that help reduce urban temperatures is frequently an issue other than UHIs. For example, the BC Healthy Built Environment Linkages Toolkit was developed to advance healthy built environments across British Columbia. While UHI considerations were not the main focus of the Toolkit, reducing UHIs was included as one element of the Toolkit's healthy built environments framework. Given that reducing UHIs is rarely the top priority for a given municipality, actions that effectively address more than one issue may be of particular interest to local decision-makers.
- Public health professionals and organizations across Canada have supported research that raises awareness of the need to reduce UHIs. For example, the INSPQ in Quebec has supported various research projects, including the generation of data that has been integrated into Quebec's Climate Atlas. In Windsor, the City partnered with public health professionals to develop UHI and heat-health vulnerability maps. These maps, in turn, helped spur the project to integrate thermal comfort into Windsor's parks and playgrounds. These examples demonstrate that, by sharing the results of relevant research, public health professionals can help build capacity and advance UHI initiatives.
- Evaluating the effectiveness of UHI-reduction actions to public health is important and remains an area for further work. In Quebec, the INSPQ conducted lifecycle assessment evaluations of 10 UHI-reduction actions to assess their environmental impacts (INSPQ, 2011). In addition, in 2014, the INSPQ evaluated six UHI-reduction projects in the City of Montréal to assess their effectiveness at reducing urban temperatures (INSPQ, 2014). However, evaluating the success of projects can be complicated, due partly to the long timescales involved in recognizing the benefits of changes to the built environment. For example, it can take many years for trees to mature sufficiently to provide substantial shade for cooling. Continued efforts by public health professionals to conduct evaluations of UHI initiatives using health-relevant performance indicators can further increase their knowledge base to advance and tailor action in other jurisdictions.
- Many communities started by implementing smaller-scale actions (e.g., pilot research or projects) that act as a catalyst to build competencies, increase awareness, and secure the resources needed for more ambitious UHI-reduction initiatives. For example, the lessons learned from a single pilot project in Québec City (i.e., the pilot project to redesign the streetscape and green Anna Street) were integrated into a city-wide Complete Streets Plan. As part of this plan, in 2017 Québec City implemented 19 street-redevelopment projects across the city. Public health authorities can seek to incrementally implement built environment and health actions at ever-increasing scales as opportunities arise and as recognition of the UHI effect grows.
- Implementation time frames for UHI-reduction actions can range from several years to two or three decades. The case studies in this report demonstrate that initiatives can be implemented over various timeframes. Practical initiatives can be developed within a year or less, while planning documents that embed UHI consideration can help mainstream their implementation over a span of decades. In Halifax, for example, the HIA was conducted over a time span of several months, whereas in Calgary the imagineCALGARY long-range visioning exercise was developed over three years, and has been helping guide Calgary's development for more than a decade, since 2007.
The case studies in this report demonstrate that public health officials across Canada have been actively supporting municipal partners to advance actions to reduce UHIs and protect Canadians from extreme heat. The lessons learned in this report are intended to provide useful ideas and help spur other jurisdictions across Canada and around the world to implement practical actions to reduce UHIs. While this report focuses on reducing UHIs, public health professionals should also consider other actions to protect residents from health impacts during extreme heat events, such as HARS and building retrofits to reduce indoor temperatures, which are not covered in this guide. Collaboration between public health professionals and other partners and organizations is critical to achieving UHI-reduction actions. When implemented together with HARS and other health-protective actions, efforts to reduce UHIs will effectively reduce population risk of heat-related illnesses and deaths.
References
Akbari, H. (2002). Shade trees reduce building energy use and CO2 emissions from power plants. Environmental Pollution, 116(Suppl 1), S119-S126. doi:10.1016/S0269-7491(01)00264-0.
Anderson, C. A. (2001). Heat and violence. Current Directions in Psychological Science, 10(1), 33-38. doi:10.1111/1467-8721.00109
Bärring, L., Mattsson, J. O., & Lindqvist, S. (1985). Canyon geometry, street temperatures and urban heat island in Malmö, Sweden. International Journal of Climatology, 5(4), 433-444.
BC Centre for Disease Control. (2018). Healthy Built Environment Linkages Toolkit: Making the Links Between Design, Planning and Health, Version 2.0. Vancouver, BC: Provincial Health Services Authority. Retrieved from http://www.bccdc.ca/pop-public-health/Documents/HBE_linkages_toolkit_2018.pdf
Bernard, S. M., & McGeehin, M. A. (2004). Municipal heat wave response plans. American Journal of Public Health, 94(9), 1520-1522.
Berry, P., Clarke, K., Fleury, M.D. & Parker, S. (2014). Human Health. In F.J. Warren and D.S. Lemmen (Eds.),Canada in a Changing Climate: Sector Perspectives on Impacts and Adaptation (pp. 191-232).Ottawa, ON: Government of Canada.
Blanchard, S. (2013). Improving Thermal Comfort in Windsor, ON: Assessing Urban Parks and Playgrounds. Windsor, ON: City of Windsor. Retrieved from http://www.citywindsor.ca/residents/environment/Environmental-Master-Plan/Documents/Improving%20Thermal%20Comfort%20in%20Parks_no%20appendices.pdf
Bustinza, R., Germain L., Gosselin, P., Bélanger, D., & Chebana, F. (2013). Health impacts of the July 2010 heat wave in Québec, Canada. BMC Public Health, 13(56). doi:10.1186/1471-2458-13-56.
Canadian Press. (2014). Heat wave shatters temperatures records across BC. Retrieved from https://www.cbc.ca/news/canada/british-columbia/heat-wave-shatters-temperature-records-across-b-c-1.1318743.
Canadian Public Health Association (CPHA). (2015). Global Change and Public Health: Addressing the Ecological Determinants of Health. Canadian Public Health Association: Ottawa, ON. Retrieved from https://www.cpha.ca/sites/default/files/assets/policy/edh-discussion_e.pdf
Casati, B., Yagouti, A., & Chaumont, D. (2013). Regional climate projections of extreme heat events in nine pilot Canadian communities for public health planning. Journal of Applied Meteorology and Climatology, 52(12), 2669-2698.
CBC News. (2018). Heat takes toll on PEI businesses, people. Retrieved from http://www.cbc.ca/news/canada/prince-edward-island/pei-heat-warning-business-closure-people-1.4759962
Cheng, J. J., & Berry, P. (2013). Development of key indicators to quantify the health impacts of climate change on Canadians. International Journal of Public Health, 58(5), 765-775. doi:10.1007/s00038-013-0499-5
City of Vancouver. (2015). Vancouver's Urban Forest Strategy. Vancouver, BC: Vancouver Board of Parks and Recreation. Retrieved from https://parkboardmeetings.vancouver.ca/2015/20151214/PRESENTATION-UrbanForestStrategy-20151214.pdf
CTV Montréal. (2018). Some Canada Day festivities cancelled due to extreme heat. Retrieved from https://Montréal.ctvnews.ca/some-canada-day-festivities-cancelled-due-to-intense-heat-1.3994163
De Carolis, L. (2012). The Urban Heat Island Effect in Windsor, ON: An Assessment of Vulnerability and Mitigation Strategies. Windsor, ON: City of Windsor. Retrieved from http://www.citywindsor.ca/residents/environment/environmental-master-plan/documents/urban%20heat%20island%20report%20%282012%29.pdf
Ebi, K. L., Teisberg, T. J., Kalkstein, L. S., Robinson, L., & Weiher, R. F. (2004). Heat watch/warning systems save lives: estimated costs and benefits for Philadelphia 1995-98. Bulletin of the American Meteorological Society, 85(8), 1067-1074.
Environment and Climate Change Canada (ECCC). (2016). Canadian Environmental Sustainability Indicators: Temperature Change in Canada. Retrieved from: www.ec.gc.ca/indicateurs-indicators/default.asp?lang=en&n=64C9E931-1
Filho, W.L., Echevarria Icaza, L., Emanche, V. O., & Quasem Al-Amin, A. (2017). An evidence-based review of impacts, strategies and tools to mitigate urban heat islands. International Journal of Environmental Research and Public Health, 14(12), 1600.
Government of Quebec. (2012). 2013-2020 Climate Change Action Plan. Quebec City, QC: Government of Quebec.
Graham, D. A., Vanos, J. K., Kenny, N. A., & Brown, R. D. (2017). Modeling the effects of urban design on emergency medical response calls during extreme heat events in Toronto, Canada. International Journal of Environmental Research and Public Health, 14(7), 778.
Guilbault, S., Kovacs, P., Berry, P., & Richardson, G. (2016). Cities Adapt to Extreme Heat: Celebrating Local Leadership. Toronto and London, ON: Institute for Catastrophic Loss Reduction. Retrieved from https://www.iclr.org/wp-content/uploads/PDFS/cities-adapt-to-extreme-heat.pdf
Guo Y, Gasparrini A, Li S, Sera, F., Vicedo-Cabrera, A. M., de Sousa Zanotti Stagliorio Coelho, M., … Tong, S. (2018). Quantifying excess deaths related to heatwaves under climate change scenarios: A multicountry time series modelling study. PLoS Medicine, 15(7), e1002629. doi:10.1371/journal.pmed.1002629
Harlan, S. L., Brazel, A. J., Prashad, L., Stefanov, W. L., & Larsen, L. (2006). Neighborhood microclimates and vulnerability to heat stress. Social Science & Medicine, 63(11), 2847-2863.
Harlan, S. L., Brazel, A. J., Darrel Jenerette, G., Jones, N. S., Larsen, L., Prashad, L., & Stefanov, W. L. (2015). In the shade of affluence: the inequitable distribution of the urban heat island. In Equity and the Environment (pp. 173-202). Emerald Group Publishing Limited.
Health Canada. (2011a). Communicating the Health Risks of Extreme Heat Events. Ottawa, ON: Water, Air, and Climate Change Bureau, Healthy Environments and Consumer Safety Branch, Health Canada.
Health Canada. (2011b). Extreme Heat Events Guidelines: User Guide for Health Care Workers and Health Administrators. Ottawa, ON: Water, Air, and Climate Change Bureau, Healthy Environments and Consumer Safety Branch, Health Canada.
Health Canada. (2018). Sex- and Gender-based Analysis in Action at Health Canada. Ottawa, ON: Government of Canada. Retrieved from https://www.canada.ca/en/health-canada/corporate/transparency/corporate-management-reporting/sex-gender-based-analysis-action.html
Heaviside, C., Macintyre, H., & Vardoulakis, S. (2017). The urban heat island: implications for health in a changing environment. Current Environmental Health Reports, 4(3), 296-305.
Heaviside, C., Vardoulakis, S., & Cai, X. (2016). Attribution of mortality to the urban heat island during heatwaves in the West Midlands, UK. Environmental Health, 15(S1), 27. doi:10.1186/s12940-016-0100-9
Hondula, D. M., & Barnett, A. G. (2014). Heat-related morbidity in Brisbane, Australia: spatial variation and area-level predictors. Environmental Health Perspectives, 122(8), 831.
ICLEI Canada. (2018). Livable Cities Forum 2014: RECAP North American adaptation practitioners gather to discuss building resilient communities. Retrieved from http://www.icleicanada.org/resources/item/124-lcf2014-recap
Institut national de santé publique du Québec (INSPQ). (2009). Literature Review of Urban Heat Island Mitigation Strategies. Montréal, QC: INSPQ.
Institut national de santé publique du Québec (INSPQ). (2011). Lifecycle Assessment of the Environmental Impacts Resulting from the Implementation of Urban Heat Island Mitigation Measures. Montréal, QC: INSPQ.
Institut national de santé publique du Québec (INSPQ). (2014). Étude de performance de projets de lutte aux îlots de chaleur urbains dans la région de Montréal. Montréal, QC : INSPQ.
Institut national de santé publique du Québec (INSPQ). (2018). Projets de lutte aux îlots de chaleur urbains. Institut national de santé publique du Québec. Retrieved from http://www.monclimatmasante.qc.ca/carte-des-projets-contre-les-ilots-de-chaleur.aspx
Jack, D. W., & Kinney, P. L. (2010). Health co-benefits of climate mitigation in urban areas. Current Opinion in Environmental Sustainability, 2(3), 172-177. doi:10.1016/j.cosust.2010.06.007
Jenkins K, Hall J, Glenis V, Kilsby, C., McCarthy, M., Goodess, C., … Birkin, M. (2014). Probabilistic spatial risk assessment of heat impacts and adaptations for London. Climatic Change, 124(1), 105-117. doi:10.1007/s10584-014-1105-4
Kosatsky, T., Henderson, S. B., & Pollock, S. L. (2012). Shifts in mortality during a hot weather event in Vancouver, British Columbia: Rapid assessment with case-only analysis. American Journal of Public Health, 102(12), 2367-2371. doi:10.2105/AJPH.2012.300670
Ville de Québec. (2018). Rues conviviales. Retrieved from https://www.ville.quebec.qc.ca/apropos/planification-orientations/amenagement_urbain/rues-conviviales/
Laaidi, K., Zeghnoun, A., Dousset, B., Bretin, P., Vandentorren, S., Giraudet, E., & Beaudeau, P. (2012). The impact of heat islands on mortality in Paris during the August 2003 heat wave. Environmental Health Perspectives, 120(2), 254.
Lamothe, F., Roy, M., & Racine-Hamel, S.-É. (2019). Enquête épidémiologique -Vague de chaleur à l'été 2018 à Montréal. Direction régionale de santé publique du CIUSSS du Centre-Sud-de-l'Île-de-Montréal. Retrieved from https://santemontreal.qc.ca/fileadmin/user_upload/Uploads/tx_asssmpublications/pdf/publications/Enquete_epidemiologique_-_Vague_de_chaleur_a_l_ete_2018_a_Montreal_version15mai_EUSHV_finale.pdf
Li, D., & Bou-Zeid, E. (2013). Synergistic interactions between urban heat islands and heat waves: The impact in cities is larger than the sum of its parts. Journal of Applied Meteorology and Climatology, 52(9), 2051-2064.
Luber, G., & McGeehin, M. (2008). Climate change and extreme heat events. American Journal of Preventive Medicine, 35(5), 429-435.
McGregor, G. R., Bessemoulin, P., Ebi, K. L., Menne, B., World Meteorological Organization, & World Health Organization. (2015). Heatwaves and Health: Guidance on Warning-System Development. Geneva, Switzerland: World Meteorological Organization.
Metro Vancouver. (2014). Health Impact Assessment of Transportation and Land Use Planning Activities: Guidebook. Vancouver, BC: Metro Vancouver. Retrieved from http://www.metrovancouver.org/services/regional-planning/PlanningPublications/HIA-Guidebook.pdf
Mohajerani, A., Bakaric, J., & Jeffrey-Bailey, T. (2017). The urban heat island effect, its causes, and mitigation, with reference to the thermal properties of asphalt concrete. Journal of Environmental Management, 197, 522-538. doi:10.1016/j.jenvman.2017.03.095
Mullins, J., & White, C. (2018). Temperature, Climate Change, and Mental Health: Evidence from the Spectrum of Mental Health Outcomes (Working Papers No. 1801). San Luis Obispo, CA: California Polytechnic State University, Department of Economics. Retrieved from https://ideas.repec.org/p/cpl/wpaper/1801.html
Murage, P., Hajat, S., & Kovats, R. S. (2017). Effect of night-time temperatures on cause and age-specific mortality in London. Environmental Epidemiology, 1(2), e005. doi:10.1097/EE9.0000000000000005
National Weather Service. (2018). Natural hazard statistics - weather fatalities 2017. Retrieved from http://www.nws.noaa.gov/om/hazstats.shtml
Natural Sciences and Engineering Research Council of Canada. (2018). New funding to advance climate change research in Canada. Retrieved from http://www.nserc-crsng.gc.ca/Media-Media/ProgramNewsDetails-NouvellesDesProgrammesDetails_eng.asp?ID=1020
North West Local Health Integration Network. (2009). Priority Setting in the LHINs: A Practical Guide to Decision-Making. Thunder Bay, ON: North West Local Health Integration Network.
Oke, T. R. (1982). The energetic basis of the urban heat island. Quarterly Journal of the Royal Meteorological Society, 108(455), 1-24. doi:10.1002/qj.49710845502
Oke T.R. (1997). Urban climates and global environmental change. In R.D. Thompson and A. Perry (Eds.), Applied Climatology (pp. 273-287). London, UK: Routledge.
Oke, T., Mills, G., Christen, A., & Voogt, J. (2017). Urban Climates. Cambridge, UK: Cambridge University Press. doi:10.1017/9781139016476
Ormandy, D., & Ezratty, V. (2012). Health and thermal comfort: from WHO guidance to housing strategies. Energy Policy, 49, 116-121. doi:10.1016/j.enpol.2011.09.003
Pengelly, L. D., Campbell, M. E., Cheng, C. S., Fu, C., Gingrich, S. E., & Macfarlane, R. (2007). Anatomy of heat waves and mortality in Toronto: Lessons for public health protection. Canadian Journal of Public Health = Revue canadienne de santé publique, 98(5), 364-368.
Petkova, E. P., Morita, H., & Kinney, P. L. (2014). Health impacts of heat in a changing climate: how can emerging science inform urban adaptation planning? Current Epidemiology Reports, 1(2), 67-74.
Prairie Climate Centre. (2018). Climate Atlas of Canada. Retrieved from https://climateatlas.ca/.
Region of Peel. (2005). State of the Region's Health 2005 - Focus on Overweight, Obesity, and Related Health Consequences in Adults. Region of Peel, Public Health. Retrieved from https://www.peelregion.ca/health/health-status-report/region-2005/
Richardson, G. R. A., & Otero, J. (2012). Land Use Planning Tools for Local Adaptation to Climate Change. Ottawa, ON: Government of Canada. Retrieved from http://publications.gc.ca/collections/collection_2013/rncan-nrcan/M4-106-2012-eng.pdf
Richardson, G. R. A., Otero, J., Lebedeva, J., & Chan, C. F. (2009). Developing climate change adaptation strategies: a risk assessment and planning tool for urban heat islands in Montreal. Canadian Journal of Urban Research, 18(Suppl 1), 74-93.
Rizwan, A. M., Dennis, L. Y., & Chunho, L. I. U. (2008). A review on the generation, determination and mitigation of urban heat island. Journal of Environmental Sciences, 20(1), 120-128.
Rosenfeld, A. H., Akbari, H., Romm, J. J., & Pomerantz, M. (1998). Cool communities: strategies for heat island mitigation and smog reduction. Energy and Buildings, 28(1), 51-62. doi:10.1016/S0378-7788(97)00063-7
Rosenthal, J. K., Kinney, P. L., & Metzger, K. B. (2015). Intra-urban vulnerability to heat-related mortality in New York City, 1997-2006. Health & Place, 30, 45-60.
Semenza, J. C., Rubin, C. H., Falter, K. H., Selanikio, J. D., Flanders, W. D., Howe, H. L., & Wilhelm, J. L. (1996). Heat-related deaths during the July 1995 heat wave in Chicago. New England Journal of Medicine, 335(2), 84-90.
Semenzato, P., Sievänen, T., de Oliveira, E. S., Soares, A. L., & Spaeth, R. (2011). Natural elements and physical activity in urban green space planning and design. In Forests, Trees and Human Health (pp. 245-282). Dordrecht, Netherlands: Springer.
Smoyer-Tomic, K. and Rainham, D. (2001). Beating the heat: development and evaluation of a Canadian hot weather health-response plan. Environmental Health Perspectives, 109, 1241-1248.
Takebayashi, H., & Moriyama, M. (2012). Study on Surface Heat Budget of Various Pavements for Urban Heat Island Mitigation. Advances in Materials Science and Engineering, 2012. doi:10.1155/2012/523051
Toronto Public Health. (2013). Partners in Action - Shade Policy for the City of Toronto. Retrieved from https://www.youtube.com/watch?v=Jg1jD6E43Z4
Trombley, J., Chalupka, S., & Anderko, L. (2017). Climate change and mental health. American Journal of Nursing, 117(4), 44-52. doi:10.1097/01.NAJ.0000515232.51795.fa
US Environmental Protection Agency (US EPA). (1989). Report to Congress on Indoor Air Quality: Volume 2. Assessment and Control of Indoor Air Pollution. Washington, DC: US Environmental Protection Agency.
US Environmental Protection Agency (US EPA). (2008). Reducing Urban Heat Islands: Compendium of Strategies Urban Heat Island Basics. Washington, DC: US Environmental Protection Agency.
Vandentorren, S., Bretin, P., Zeghnoun, A., Mandereau-Bruno, L., Croisier, A., Cochet, C.,... & Ledrans, M. (2006). August 2003 heat wave in France: risk factors for death of elderly people living at home. European Journal of Public Health, 16(6), 583-591.
Ville de Québec. (2018). Rues conviviales. Retrieved from https://www.ville.quebec.qc.ca/apropos/planification-orientations/amenagement_urbain/rues-conviviales/
Voelkel, J., Hellman, D., Sakuma, R., & Shandas, V. (2018). Assessing vulnerability to urban heat: a study of disproportionate heat exposure and access to refuge by socio-demographic status in Portland, Oregon. International Journal of Environmental Research and Public Health, 15(4), 640.
Voogt, J. A., & Oke, T. R. (2003). Thermal remote sensing of urban climates. Remote Sensing of Environment, 86(3), 370-384. doi:10.1016/S0034-4257(03)00079-8.
Voogt, J.A. 2010: Urban climate. In R. Hutchison (Ed.) Encyclopedia of Urban Studies (pp. 848-853). Thousand Oaks, CA: SAGE Publications.
Wang, Y., Berardi, U., & Akbari, H. (2016). Comparing the effects of urban heat island mitigation strategies for Toronto, Canada. Energy and Buildings, 114, 2-19.
White-Newsome, J. L., Sánchez, B. N., Jolliet, O., Zhang, Z., Parker, E. A., Timothy Dvonch, J., & O'Neill, M. S. (2012). Climate change and health: Indoor heat exposure in vulnerable populations. Environmental Research, 112, 20-27. doi:10.1016/j.envres.2011.10.008
Wilby, R. L. (2008). Constructing climate change scenarios of urban heat island intensity and air quality. Environment and Planning B: Planning and Design, 35(5), 902-919. doi:10.1068/b33066t
Wilkinson, P., Smith, K. R., Davies, M., Adair, H., Armstrong, B. G., Barrett, M., …. Chalabi, Z.. (2009). Public health benefits of strategies to reduce greenhouse-gas emissions: Household energy. Lancet, 374(9705), 1917-1929. doi:10.1016/S0140-6736(09)61713-X
World Health Organization. (2013). Protecting health from climate change: Vulnerability and adaptation assessment. Geneva, Switzerland: World Health Organization.
Zacharias, J., Stathopoulos, T., & Wu, H. (2001). Microclimate and downtown open space activity. Environment and Behavior, 33(2), 296-315.
Zhang, B., Xie, G., Gao, J., & Yang, Y. (2014). The cooling effect of urban green spaces as a contribution to energy-saving and emission-reduction: A case study in Beijing, China. Building and Environment, 76, 37-43. doi:10.1016/j.buildenv.2014.03.003
Zhao, L., Oppenheimer, M., Zhu, Q., Baldwin, J., Ebi, K., Bou-Zeid, E., …. Liu, X. (2018). Interactions between urban heat islands and heat waves. Environmental Research Letters, 13(3), 34003. doi:10.1088/1748-9326/aa9f73
Annex A: Projected heat-associated mortality in Canada
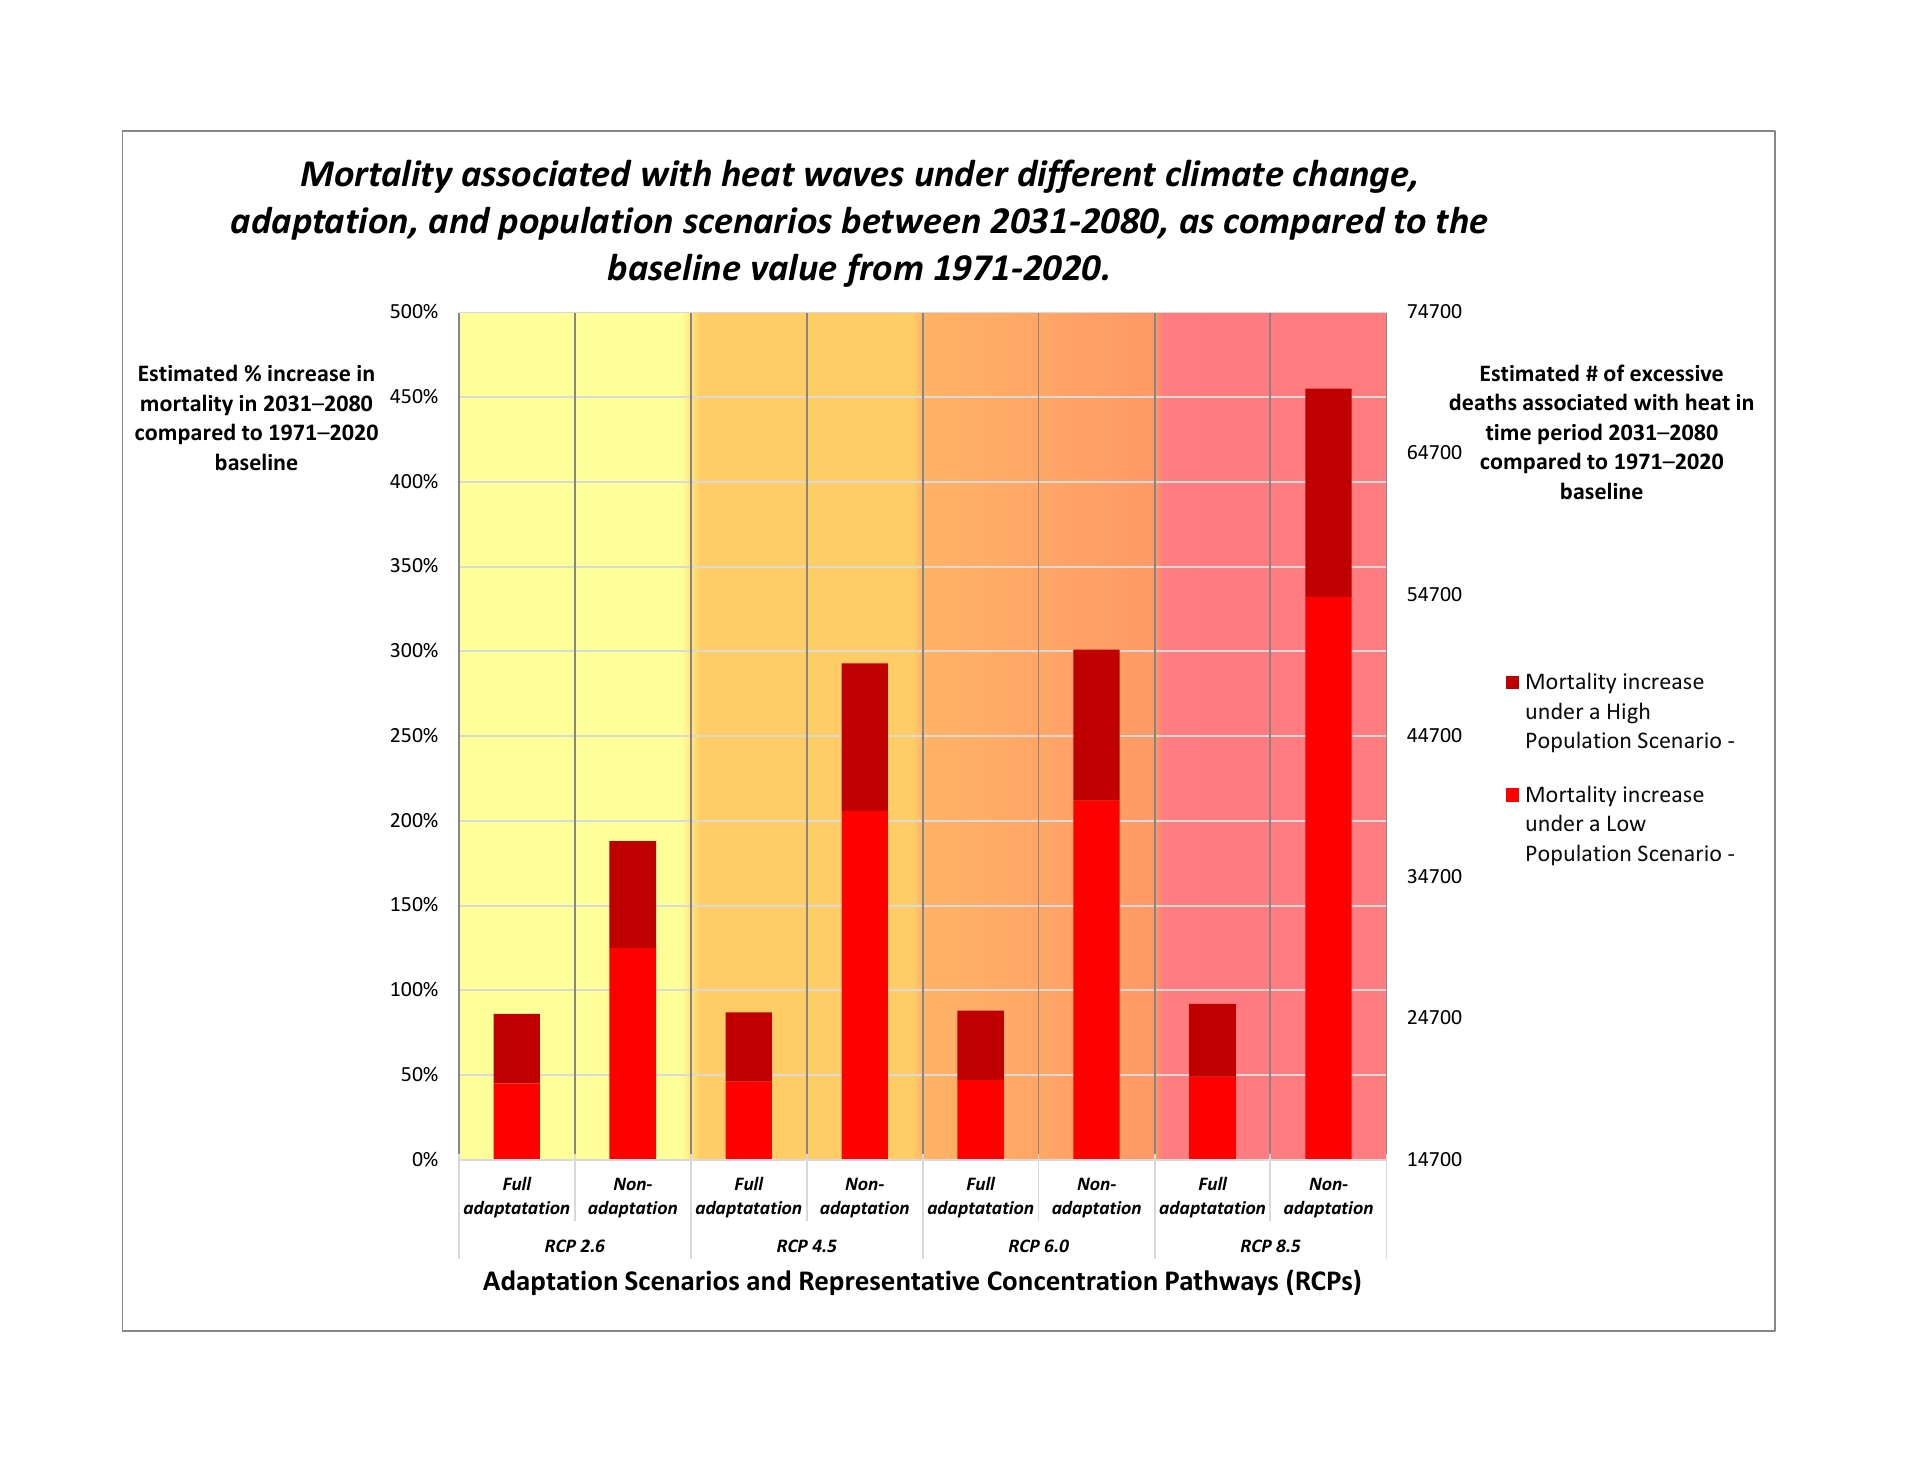
Figure A1 - Text Equivalent
| Representative Concentration Pathway | Adaptation Scenario | |
|---|---|---|
| Full adaptation | Non-adaptation | |
| RCP 2.6 | 24762 (41% increase) | 36696 (63% increase) |
| RCP 4.5 | 24879 (41% increase) | 48981 (87% increase) |
| RCP 6.0 | 24996 (41% increase) | 49917 (89% increase) |
| RCP 8.5 | 25464 (43% increase) | 67935 (123% increase) |
| Representative Concentration Pathway | Adaptation Scenario | |
|---|---|---|
| Full adaptation | Non-adaptation | |
| RCP 2.6 | 19965 (45% increase) | 29325 (125% increase) |
| RCP 4.5 | 20082 (46% increase) | 38802 (206% increase) |
| RCP 6.0 | 20199 (47% increase) | 39504 (212% increase) |
| RCP 8.5 | 20433 (49% increase) | 53544 (332% increase) |
The graph shows how mortality associated with heat waves is expected to increase in Canada under various climate change, adaptation, and population scenarios for 2031-2080, as compared with a baseline value for 1971-2020. Source: Guo et al., 2018.
Figure A1 was developed by pooling existing data collected by Guo et al. (2018) for 26 population centres in Canada. Projected excess deaths are shown for four greenhouse gas emission scenarios developed by the Intergovernmental Panel on Climate Change: Representative Concentration Pathways (RCPs) 2.6, 4.5, 6.0, 8.5, varying from a low-emission scenario in which the Paris Agreement is adhered to, to a high-emission "business as usual" scenario. For each of these emission scenarios, an estimate of the total number of excess deaths associated with heat is shown for both low and high population change and for full adaptation or non-adaptation scenarios.
- Full adaptation assumes that adaptation measures (e.g., local populations acclimatize to increased heat and other external adaptation measures) could sufficiently offset the increased relative risk of excess mortality associated with increasing temperatures.
- No adaptation assumes no additional adaptation measures are implemented beyond those taken during the baseline time period (i.e., no population acclimatization and no external adaptation measures).
The baseline value (1971 to 2020) of 14,700 excess deaths in Canada is the sum of the projected annual average of 300 deaths a year over a 49-year time period. The estimates of mortality are aggregated for the period 1971 to 2020, rather than displayed annually, to produce a statistically robust estimate accounting for effect sizes and population sizes as well as natural variability in weather from one year to the next.