
Flood relief efforts

“11cm above 2017 levels. Water levels are expected to rise…”
Ontario and Quebec residents impacted by floods needed that critical information on a daily basis to stay safe. SSC supercomputers processed weather-related data to help with flood relief efforts in these regions. That’s one of the ways our work directly impacts Canadians.
Helping HAND
When Natural Resources Canada (NRCan) came knocking, we answered. They needed our help to produce Height Above Nearest Drainage (HAND) models—a predictive water elevation model—following a request from the Government Operations Centre at Public Safety Canada.
We dedicated a section of our General Purpose Science Cluster (GPSC) within our high performance computing environment to help NRCan run their models. This ensured NRCan could work without impacting the workloads of other departments sharing the cluster.
Did you know?
- GPSC refers to hardware, software, networks and facilities supporting high performance computing for science-based departments and agencies as well as other departments requiring Extreme Computing capabilities.
- The departments that presently share the GPSC are:
- Agriculture and Agri-Food Canada
- Canadian Food Inspection Agency
- Employment and Social Development Canada
- Environment and Climate Change Canada
- Fisheries and Oceans Canada
- Health Canada
- National Research Council Canada
- Natural Resources Canada
- Public Health Agency of Canada
Emergency response
NRCan used the resulting models to produce flood maps. As the federal coordinator for emergency events, Public Safety Canada shared the maps with federal operations centres and provincial partners. By understanding the impacts of increased water levels in different areas, authorities were in a better position to manage and coordinate emergency responses accordingly.
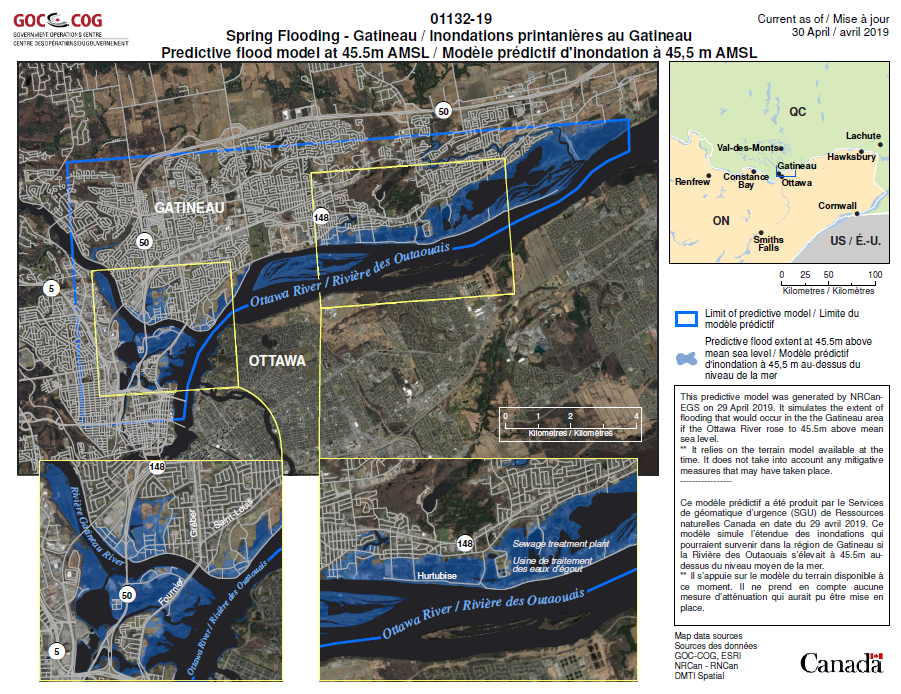
Long description
Image of a flood map simulating the extent of flooding that would occur in the Gatineau area if the Ottawa River rose to 45.5 meters above mean sea level. The main section of the map is surrounded by a blue border to indicate the limit of the predictive model. Two sections within this blue border are surrounded by a yellow square. Each yellow square points to a zoomed-in area of the flood map outside of the blue border.