
Demographic Snapshot of Canada’s Federal Public Service, 2016
Preface
This snapshot provides key demographics for Canada’s federal public service.Footnote 1 It compares the current workforce with that from the baseline year of 1990.Footnote 2
Canada’s federal public service consists of two population segments:
- the core public administration
- separate agencies
The term “core public administration” refers to approximately 70 departments and agencies for which the Treasury Board is the employer. These organizations are listed in Schedules I and IV of the Financial Administration Act.
The term “separate agencies” refers to agencies listed in Schedule V of the act. Separate agencies conduct their own negotiations or set their own classification system and compensation levels for their employees.
The demographic information in this snapshot supplements the Clerk of the Privy Council’s Twenty-Fourth Annual Report to the Prime Minister on the Public Service of Canada.
The data in this snapshot is current as of March 31, 2016, unless indicated otherwise.
Table of Contents
- Preface
- Introduction
- Part 1: demographic profile of Canada’s federal public service
- Context: relative size and spending
- Federal public service diversity
- Age profile of the federal public service
- Hiring into the federal public service
- Retirements in the federal public service
- Years of experience in the federal public service
- A knowledge-intensive workforce in the core public administration
- Part 2: demographic profile of executives
Introduction
This document presents key demographics for Canada’s federal public service. Part 1 covers the entire federal public service, and Part 2 focuses on executives.
Demographic profile of the federal public service of Canada, March 31, 2016
- 258,979 active employees (250,625 in 1990)
- The federal public service represents 0.72% of the Canadian population (0.91% in 1990)
- 58.5% of employees are in the regions; 41.5% are in the National Capital Region
- 84.4% are indeterminate employees, 9.8% are term employees, and 5.8% are casuals and students
- 55.1% of employees are women (45.6% in 1990)
- 46.5% of executives are women (14.7% in 1990)
- 71.5% of employees indicated English as their first official language; 28.5% indicated French as their first official language (in 1990, 71.2% indicated English and 28.8% indicated French)
- Average age of employees: 45.0 years (40.4 in 1990)
- Average age of executives: 50.3 years (48.0 in 1990)
Part 1: demographic profile of Canada’s federal public service
Context: relative size and spending
Between 1990 and 2016, the population of Canada grew from approximately 27.6 million to 36.1 million (an increase of 31.1%),Footnote 3 while the number of federal public servants increased from 250,625 to 258,979 (3.3%). The federal public service currently comprises 0.72% of the Canadian population. This is well below the ratios in the 1980s and early 1990s, which were very close to 1%.
Between 1990 and 2016, Canada’s real gross domestic product increased by 77.1% and real federal program spending increased by 54.5% (in constant dollars). However, over the 2015 to 2016 fiscal year, there has been an increase of 0.9% in real gross domestic product and an increase of 5.5% in federal program spending, as shown in Figure 1.
Government priorities have significantly influenced the size of the federal public service workforce over the years. The focus in recent years has been on streamlining activities, outsourcing services and reducing costs. As a result, the federal public service workforce has decreased between 2010 and 2015, with a slight increase since 2015.
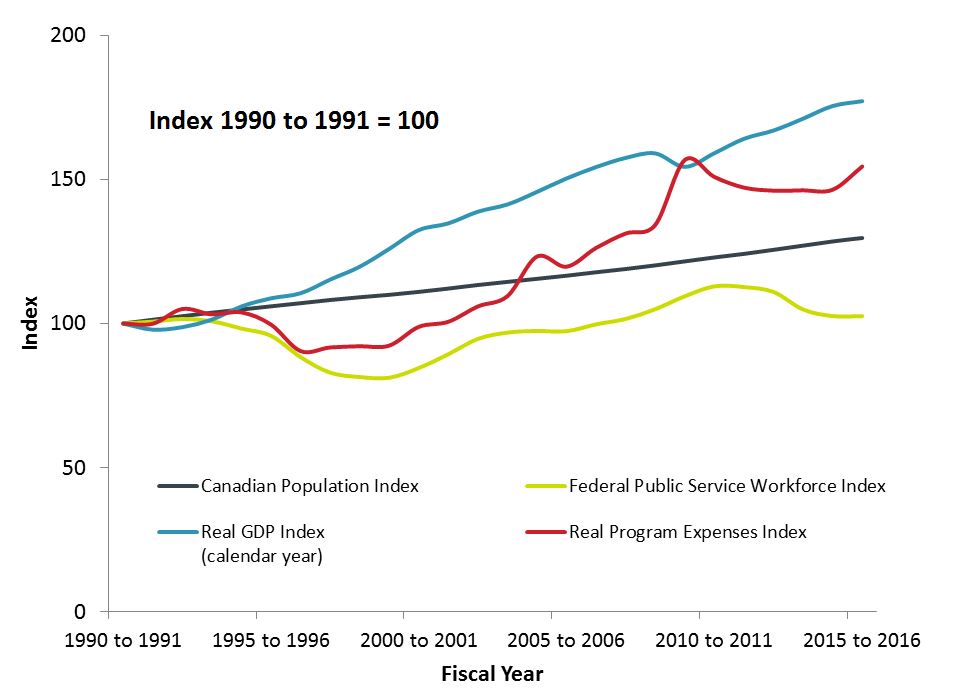
Figure 1 - Text version
| Fiscal year | Canadian Population Index | Federal Public Service Workforce Index | Real GDP Index (in constant dollars, 2007) | Real Program Expenses Index (in constant dollars, 2002) |
|---|---|---|---|---|
| 1990 to 1991 | 100 | 100 | 100 | 100 |
| 1991 to 1992 | 101 | 101 | 98 | 100 |
| 1992 to 1993 | 103 | 102 | 99 | 105 |
| 1993 to 1994 | 104 | 101 | 101 | 103 |
| 1994 to 1995 | 105 | 98 | 106 | 104 |
| 1995 to 1996 | 106 | 96 | 109 | 100 |
| 1996 to 1997 | 107 | 88 | 111 | 90 |
| 1997 to 1998 | 108 | 83 | 115 | 92 |
| 1998 to 1999 | 109 | 81 | 120 | 92 |
| 1999 to 2000 | 110 | 81 | 126 | 92 |
| 2000 to 2001 | 111 | 85 | 132 | 99 |
| 2001 to 2002 | 112 | 89 | 135 | 101 |
| 2002 to 2003 | 113 | 95 | 139 | 106 |
| 2003 to 2004 | 114 | 97 | 141 | 110 |
| 2004 to 2005 | 116 | 97 | 146 | 123 |
| 2005 to 2006 | 117 | 97 | 150 | 120 |
| 2006 to 2007 | 118 | 100 | 154 | 126 |
| 2007 to 2008 | 119 | 102 | 157 | 131 |
| 2008 to 2009 | 120 | 105 | 159 | 134 |
| 2009 to 2010 | 122 | 109 | 154 | 157 |
| 2010 to 2011 | 123 | 113 | 159 | 151 |
| 2011 to 2012 | 124 | 113 | 164 | 147 |
| 2012 to 2013 | 126 | 111 | 167 | 146 |
| 2013 to 2014 | 127 | 105 | 171 | 146 |
| 2014 to 2015 | 128 | 103 | 175 | 146 |
| 2015 to 2016 | 130 | 103 | 177 | 155 |
Sources: Office of the Chief Human Resources Officer, Treasury Board of Canada Secretariat; Statistics Canada; Department of Finance Canada (Fiscal Reference Tables).
Notes
The Canadian Population Index is based on data as of April 1 for each year. The Federal Public Service Workforce Index is based on active employees only and is based on data as of March 31 for each year.
The Real Program Expenses Index is based on fiscal year data, and the Real GDP Index is based on calendar year data.
Program expenses include transfers and were deflated using the Consumer Price Index.
Federal public service diversity
Gender
In 2016, women comprised 55.1% of the federal public service, a considerable increase from 1990 when women accounted for 45.6% of the workforce.

Figure 2 - Text version
| 1990 | 1995 | 2000 | 2005 | 2010 | 2015 | 2016 | |
|---|---|---|---|---|---|---|---|
| Men | 54.4% | 52.5% | 48.0% | 46.2% | 44.8% | 45.0% | 44.9% |
| Women | 45.6% | 47.5% | 52.0% | 53.8% | 55.2% | 55.0% | 55.1% |
Source: Office of the Chief Human Resources Officer, Treasury Board of Canada Secretariat.
Note: Figure 2 includes all employment tenures and active employees only (employees on leave without pay are excluded). The information provided is based on data as of March 31.
Employment equity designated groups
Representation
Figure 3 shows that there have been modest increases in the representation levels of three of the four employment equity designated groups in the federal public service since the 2010 to 2011 fiscal year. The representation rates for women and Aboriginal peoples were the same or higher than the previous year. As well, representation rates for members of a visible minority showed an increase for the sixth year in a row. However, the representation of persons with disabilities in the federal public service decreased slightly from 5.7% in the 2014 to 2015 fiscal year to 5.6% in the 2015 to 2016 fiscal year. Representation of all four employment equity groups continues to exceed their respective workforce availability.Footnote 4

Figure 3 - Text version
| Employment equity designated group | 2010 to 2011 | 2011 to 2012 | 2012 to 2013 | 2013 to 2014 | 2014 to 2015 | 2015 to 2016 | Workforce availability |
|---|---|---|---|---|---|---|---|
| Women | 55.3% | 55.3% | 55.0% | 54.9% | 55.0% | 55.1% | 52.3% |
| Aboriginal peoples | 4.3% | 4.5% | 4.6% | 4.6% | 4.6% | 4.7% | 3.3% |
| Persons with disabilities | 5.6% | 5.7% | 5.8% | 5.8% | 5.7% | 5.6% | 4.5% |
| Members of a visible minority group | 12.6% | 13.3% | 14.0% | 14.6% | 15.4% | 16.2% | 14.2% |
Source: Office of the Chief Human Resources Officer, Treasury Board of Canada Secretariat.
Population: Indeterminate employees and term employees of three months or more, excluding employees on leave without pay, in the core public administration and in separate agencies. Some small separate agencies were not included because of missing information.
Notes
Workforce availability estimates for the federal public service are based on the 2011 National Household Survey and the 2012 Canadian Survey on Disability.
The source of the representation data is the Treasury Board of Canada Secretariat Employment Equity Data Bank, which is populated with self-identification information provided by employees, plus data from separate agencies’ reports to Parliament.
Hiring
Figure 4 shows that the proportion of new hires for indeterminate and term positions of three months or more remains above the current workforce availability of all employment equity designated groups except for persons with disabilities, which remains below the group’s current workforce availability.
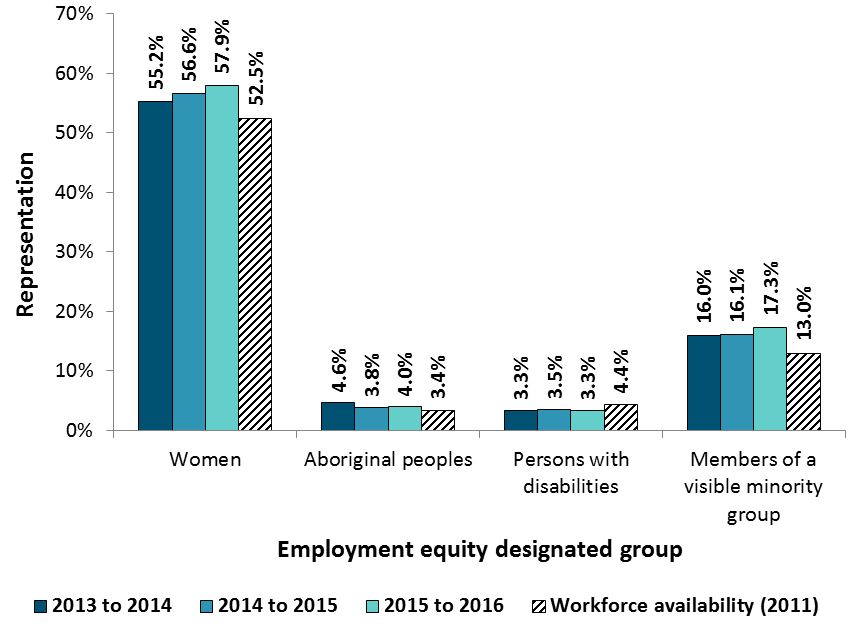
Figure 4 - Text version
| Employment equity designated group | 2013 to 2014 | 2014 to 2015 | 2015 to 2016 | Workforce availability |
|---|---|---|---|---|
| Women | 55.2% | 56.6% | 57.9% | 52.5% |
| Aboriginal peoples | 4.6% | 3.8% | 4.0% | 3.4% |
| Persons with disabilities | 3.3% | 3.5% | 3.3% | 4.4% |
| Members of a visible minority group | 16.0% | 16.1% | 17.3% | 13.0% |
Sources: Treasury Board of Canada Secretariat Employment Equity Data Bank, the Public Service Commission of Canada’s files on hiring and staffing activities, and the Public Service Resourcing System.
Population: Indeterminate employees and term employees of three months or more in the public service. In the Public Service Commission of Canada’s context, “the public service” refers to organizations named in the Public Service Employment Act and is approximately comparable to the core public administration. All appointment figures exclude specified term appointments of less than three months and appointments to separate agencies.
Notes
Appointments refer to employees who were added to the payroll of the public service of Canada between April 1 and March 31 of each given fiscal year.
Data on hiring of Aboriginal peoples, persons with disabilities and members of a visible minority group are extracted from the Employment Equity Data Bank where a match was found in the Public Service Commission of Canada’s hiring and staffing activities file covering each fiscal year. These activities include appointments for external advertised processes and non‑advertised processes.
The source of the representation data is the Treasury Board of Canada Secretariat Employment Equity Data Bank, which is populated with self-identification information provided by employees.
Data on women are extracted from the Public Service Commission of Canada’s files on hiring and staffing activities. These activities include appointments as a result of both advertised and non‑advertised processes.
Workforce availability estimates for the federal public service are based on the 2011 National Household Survey and the 2012 Canadian Survey on Disability.
First official language
As shown in Figure 5, the proportion of federal public servants who indicate either English or French as their first official language has remained relatively stable since 1990. In 2016, French was indicated as the first official language by 28.5% of federal public servants, and English was indicated by 71.5%.
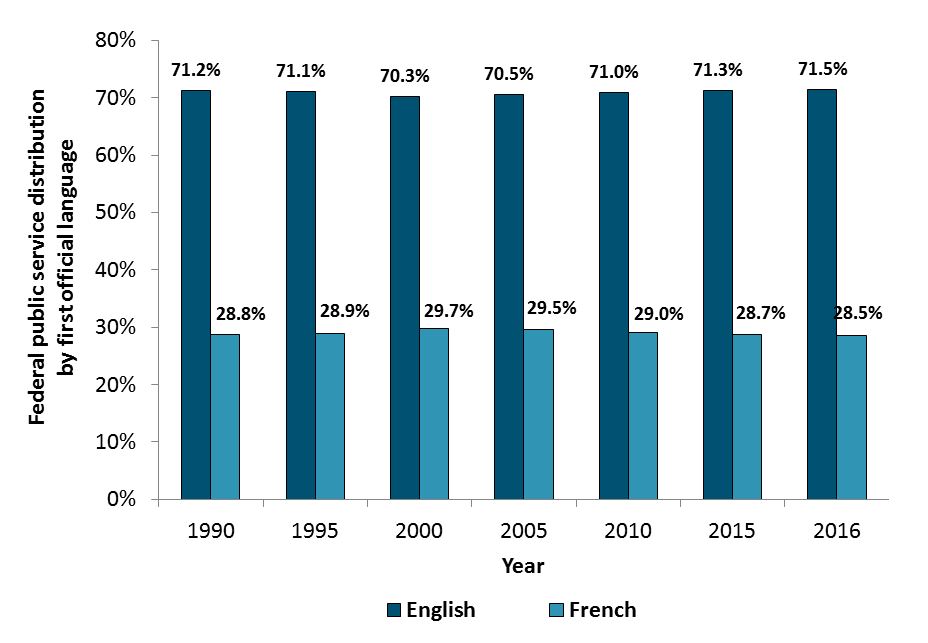
Figure 5 - Text version
| 1990 | 1995 | 2000 | 2005 | 2010 | 2015 | 2016 | |
|---|---|---|---|---|---|---|---|
| English | 71.2% | 71.1% | 70.3% | 70.5% | 71.0% | 71.3% | 71.5% |
| French | 28.8% | 28.9% | 29.7% | 29.5% | 29.0% | 28.7% | 28.5% |
Source: Office of the Chief Human Resources Officer, Treasury Board of Canada Secretariat.
Note: Figure 5 includes all employment tenures and active employees only (employees on leave without pay are excluded). The information provided is based on data as of March 31.
Age profile of the federal public service
Figure 6 compares the age distribution of federal public servants in 2010 and 2016. Over this period, the age distribution of federal public servants has changed slightly, with a decrease occurring in the proportion of employees in the 25 to 29 age group. This was a large factor in the decline in the proportion of employees under 35 years of age from 2010 to 2016. Increases are seen in the proportion of employees in both the 35 to 39 and 40 to 44 age bands between 2010 and 2015. This trend continued in 2016.
Overall, employees under 40 account for approximately 34% of the entire federal public service workforce.
The average age of federal public servants increased slightly from 43.9 years in 2010 to 45.0 years in 2016 but has remained the same since 2015.
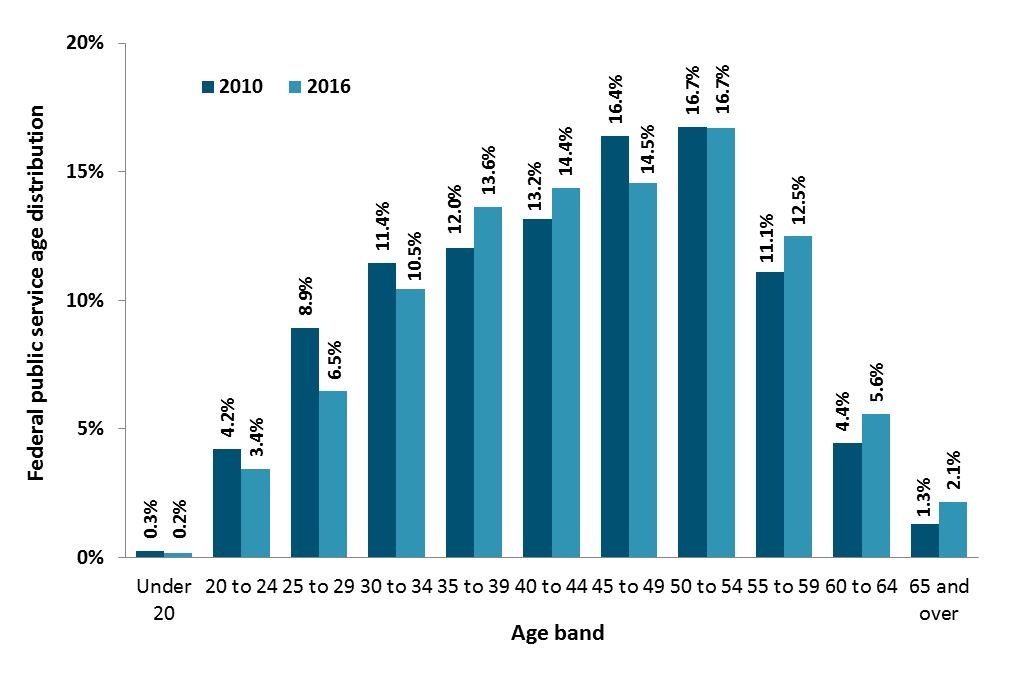
Figure 6 - Text version
| Age band | 2010 | 2016 |
|---|---|---|
| Under 20 | 0.3% | 0.2% |
| 20 to 24 | 4.2% | 3.4% |
| 25 to 29 | 8.9% | 6.5% |
| 30 to 34 | 11.4% | 10.5% |
| 35 to 39 | 12.0% | 13.6% |
| 40 to 44 | 13.2% | 14.4% |
| 45 to 49 | 16.4% | 14.5% |
| 50 to 54 | 16.7% | 16.7% |
| 55 to 59 | 11.1% | 12.5% |
| 60 to 64 | 4.4% | 5.6% |
| 65 and over | 1.3% | 2.1% |
Source: Office of the Chief Human Resources Officer, Treasury Board of Canada Secretariat.
Note: Figure 6 includes all employment tenures and active employees only (employees on leave without pay are excluded). The information provided excludes employees with an unknown age and is based on data as of March 31.
Figure 7 shows the distribution of federal public servants by age for selected years between 1990 and 2016. The baby boomer generation (bars marked by diagonal lines) can be seen moving through the age bands. The baby boomer generation previously comprised the highest proportion of the federal public service population. However, employees of this group now fall within the upper three age categories (45 to 54, 55 to 64, 65 and over) and are being replaced by the Generation X cohort and by millennials.
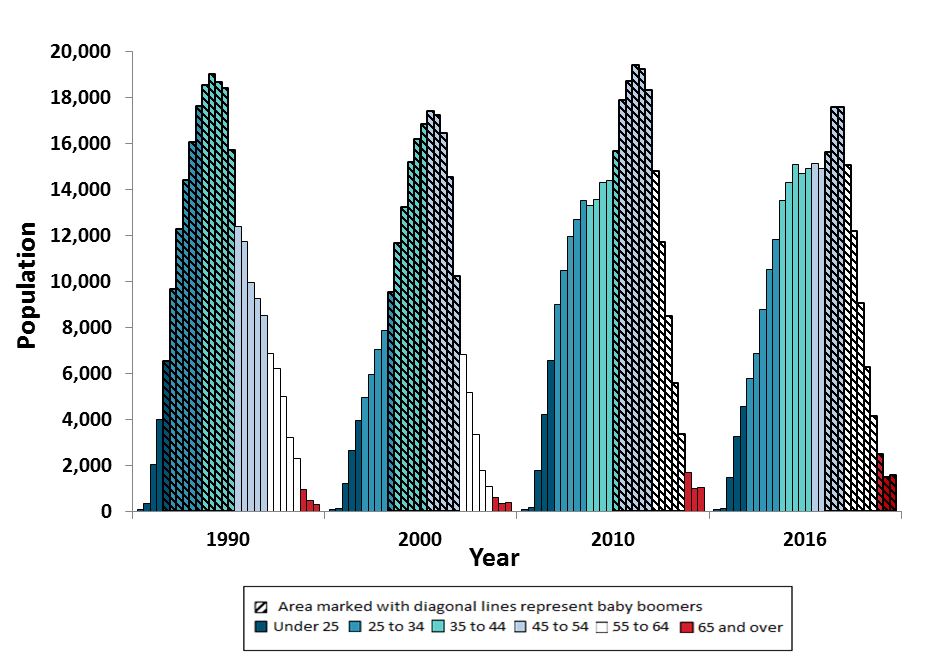
Figure 7 - Text version
| Age band | Age | 1990 | 2000 | 2010 | 2016 |
|---|---|---|---|---|---|
| Under 25 | Under 17 | 18 | 7 | 14 | 4 |
| 17 to 18 | 324 | 137 | 155 | 111 | |
| 19 to 20 | 2,023 | 1,207 | 1,783 | 1,466 | |
| 21 to 22 | 4,013 | 2,663 | 4,194 | 3,242 | |
| 23 to 24 | 6,543 | 3,927 | 6,571 | 4,565 | |
| 25 to 34 | 25 to 26 | 9,691 | 4,950 | 8,977 | 5,794 |
| 27 to 28 | 12,304 | 5,950 | 10,472 | 6,870 | |
| 29 to 30 | 14,404 | 7,035 | 11,970 | 8,770 | |
| 31 to 32 | 16,066 | 7,877 | 12,687 | 10,528 | |
| 33 to 34 | 17,663 | 9,538 | 13,518 | 11,848 | |
| 35 to 44 | 35 to 36 | 18,547 | 11,689 | 13,327 | 13,503 |
| 37 to 38 | 19,031 | 13,263 | 13,585 | 14,325 | |
| 39 to 40 | 18,690 | 15,219 | 14,318 | 15,079 | |
| 41 to 42 | 18,452 | 16,223 | 14,393 | 14,697 | |
| 43 to 44 | 15,713 | 16,858 | 15,676 | 14,915 | |
| 45 to 54 | 45 to 46 | 12,393 | 17,432 | 17,912 | 15,155 |
| 47 to 48 | 11,760 | 17,250 | 18,729 | 14,902 | |
| 49 to 50 | 9,965 | 16,480 | 19,439 | 15,655 | |
| 51 to 52 | 9,242 | 14,526 | 19,270 | 17,608 | |
| 53 to 54 | 8,500 | 10,254 | 18,352 | 17,584 | |
| 55 to 64 | 55 to 56 | 6,866 | 6,802 | 14,792 | 15,091 |
| 57 to 58 | 6,213 | 5,150 | 11,731 | 12,211 | |
| 59 to 60 | 4,981 | 3,320 | 8,497 | 9,060 | |
| 61 to 62 | 3,204 | 1,768 | 5,577 | 6,290 | |
| 63 to 64 | 2,277 | 1,083 | 3,359 | 4,141 | |
| 65 and over | 65 to 66 | 944 | 575 | 1,665 | 2,508 |
| 67 to 68 | 454 | 342 | 967 | 1,495 | |
| 69 and over | 310 | 398 | 1,048 | 1,560 |
Source: Office of the Chief Human Resources Officer, Treasury Board of Canada Secretariat.
Notes
Figure 7 includes all employment tenures and active employees only (employees on leave without pay are excluded). The information provided is based on data as of March 31.
Each vertical bar represents two years of age, with the exception of the first and last bar. The first bar includes all individuals under 17 years of age, and the last bar includes all individuals over 68 years of age. Employees whose age is unknown have been removed from the graph.
Traditionalists were born in 1945 or earlier. Baby boomers were born between 1946 and 1966. Generation X was born between 1967 and 1979. Millennials were born after 1979.
Hiring into the federal public service
Figure 8 shows that recruitment has historically responded directly to federal financial stimulus and restraint. Specifically, indeterminate hiring has been on the upswing since the 2012 to 2013 fiscal year. Such hiring increased by 26.3%, from 6,093 in the 2014 to 2015 fiscal year to 7,698 in the 2015 to 2016 fiscal year.
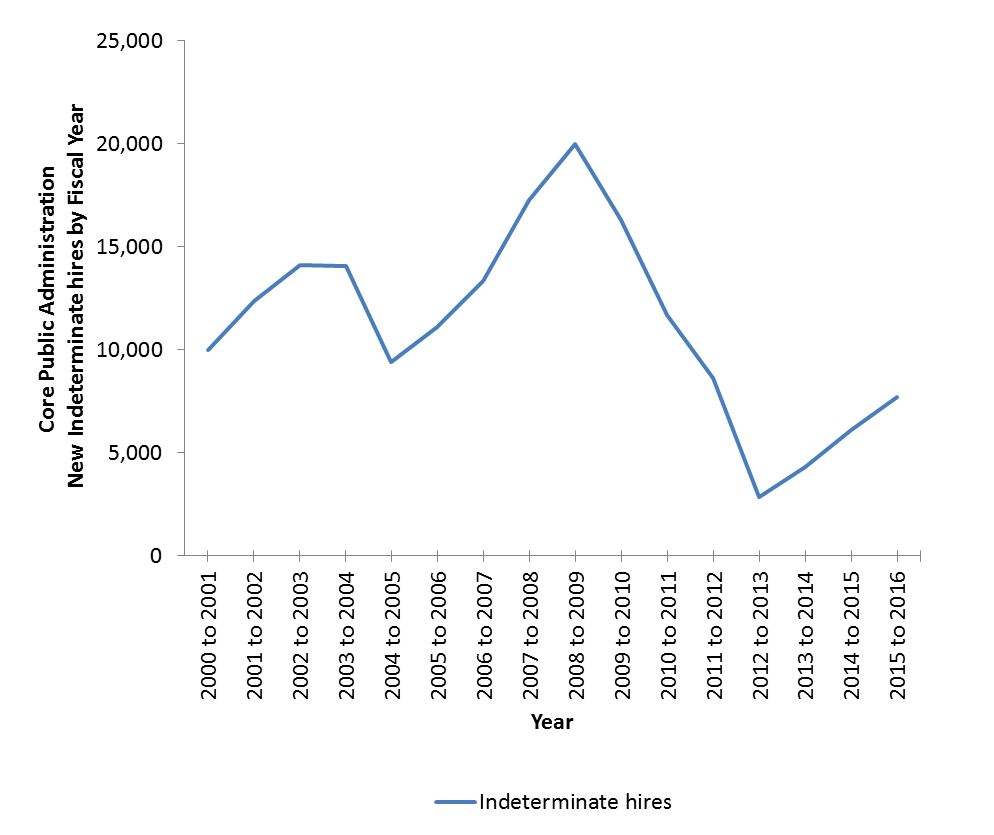
Figure 8 - Text version
| Fiscal year | Number of indeterminate hires |
|---|---|
| 2000 to 2001 | 9,986 |
| 2001 to 2002 | 12,365 |
| 2003 to 2004 | 14,084 |
| 2004 to 2005 | 9,395 |
| 2005 to 2006 | 11,092 |
| 2006 to 2007 | 13,342 |
| 2007 to 2008 | 17,258 |
| 2008 to 2009 | 19,968 |
| 2009 to 2010 | 16,304 |
| 2010 to 2011 | 11,677 |
| 2011 to 2012 | 8,642 |
| 2012 to 2013 | 2,865 |
| 2013 to 2014 | 4,315 |
| 2014 to 2015 | 6,093 |
| 2015 to 2016 | 7,698 |
Source: Office of the Chief Human Resources Officer, Treasury Board of Canada Secretariat.
Population: Indeterminate employees in the core public administration (departments and agencies for which the Treasury Board is the employer), excluding employees on leave without pay.
Between the 2012 to 2013 fiscal year and the 2015 to 2016 fiscal year, indeterminate appointments increased by 169% (from 2,865 to 7,698). Millennials have accounted for the largest group of indeterminate employees hired during this period, growing from 45% of all new indeterminate hires in the 2012 to 2013 fiscal year to 54% in the 2015 to 2016 fiscal year. During this same period, the hiring of new indeterminate employees from the Baby boomer generation has decreased from 21% to 16% and from Generation X from 34% to 29%.
Figure 9 demonstrates that slightly more than half of new indeterminate hires in the 2015 to 2016 fiscal year were born after 1979 (54%). As a result, the average age of new indeterminate hires to the core public administration was 36 years old.
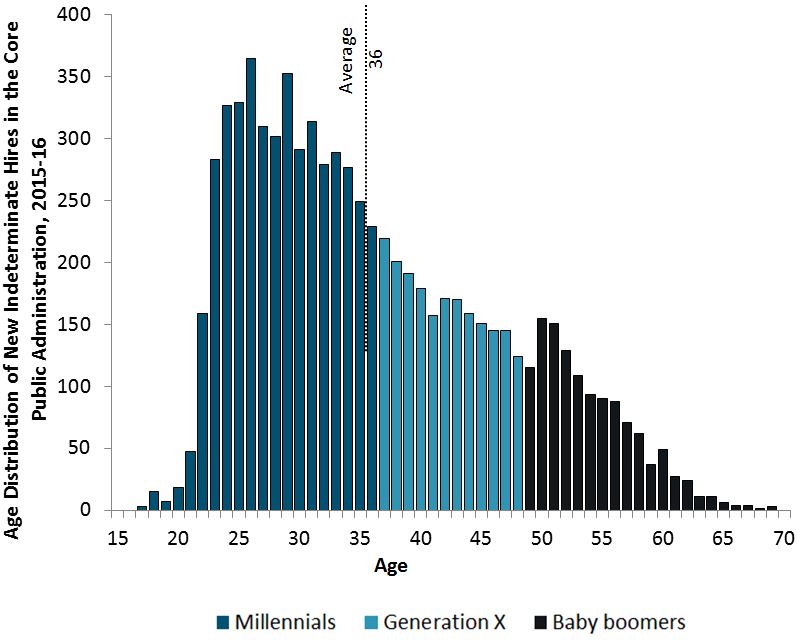
Figure 9 - Text version
| Generation | Age | Number of indeterminate employees hired |
|---|---|---|
| Millennials | 17 | 3 |
| 18 | 15 | |
| 19 | 7 | |
| 20 | 18 | |
| 21 | 47 | |
| 22 | 159 | |
| 23 | 283 | |
| 24 | 327 | |
| 25 | 329 | |
| 26 | 365 | |
| 27 | 310 | |
| 28 | 302 | |
| 29 | 353 | |
| 30 | 291 | |
| 31 | 314 | |
| 32 | 279 | |
| 33 | 289 | |
| 34 | 277 | |
| 35 | 249 | |
| Generation X | 36 | 229 |
| 37 | 219 | |
| 38 | 201 | |
| 39 | 191 | |
| 40 | 179 | |
| 41 | 157 | |
| 42 | 171 | |
| 43 | 170 | |
| 44 | 159 | |
| 45 | 151 | |
| 46 | 145 | |
| 47 | 145 | |
| 48 | 124 | |
| Baby boomers | 49 | 115 |
| 50 | 155 | |
| 51 | 151 | |
| 52 | 129 | |
| 53 | 109 | |
| 54 | 93 | |
| 55 | 90 | |
| 56 | 88 | |
| 57 | 71 | |
| 58 | 62 | |
| 59 | 37 | |
| 60 | 49 | |
| 61 | 27 | |
| 62 | 24 | |
| 63 | 11 | |
| 64 | 11 | |
| 65 | 6 | |
| 66 | 4 | |
| 67 | 4 | |
| 68 | 1 | |
| 69 | 3 | |
| Total | 7,698 | |
Source: Office of the Chief Human Resources Officer, Treasury Board of Canada Secretariat.
Population: Indeterminate employees in the core public administration (departments and agencies for which the Treasury Board is the employer), excluding employees on leave without pay.
Note: The distribution of hires in this figure is based on rounded ages and may not match other figures in this report.
Retirements in the federal public service
As shown in Figure 10, the retirement rate decreased slightly between the 2011 to 2012 fiscal year and 2012 to 2013 fiscal year (from 3.2% to 2.9%), followed by a gradual increase to 3.6% in the 2015 to 2016 fiscal year. There were approximately 8,460 retirements in the federal public service in the 2015 to 2016 fiscal year.
As a result of Budget 2012 decisions, many employees who planned to retire during the 2012 to 2013 and 2013 to 2014 fiscal years left the federal public service by accepting one of the government’s Work Force Adjustment or Career Transition (for executives) measures.
The percentage of indeterminate federal public servants eligible to retire as of March 31, 2016, was 10.6%, up from 10.2% as of March 31, 2015. Current retirees were recruited at a young age and had a long career in the federal public service. In the 2015 to 2016 fiscal year, 51.9% of retired employees had 30 or more pensionable years of service, compared with only 33.0% in the 1984 to 1985 fiscal year.
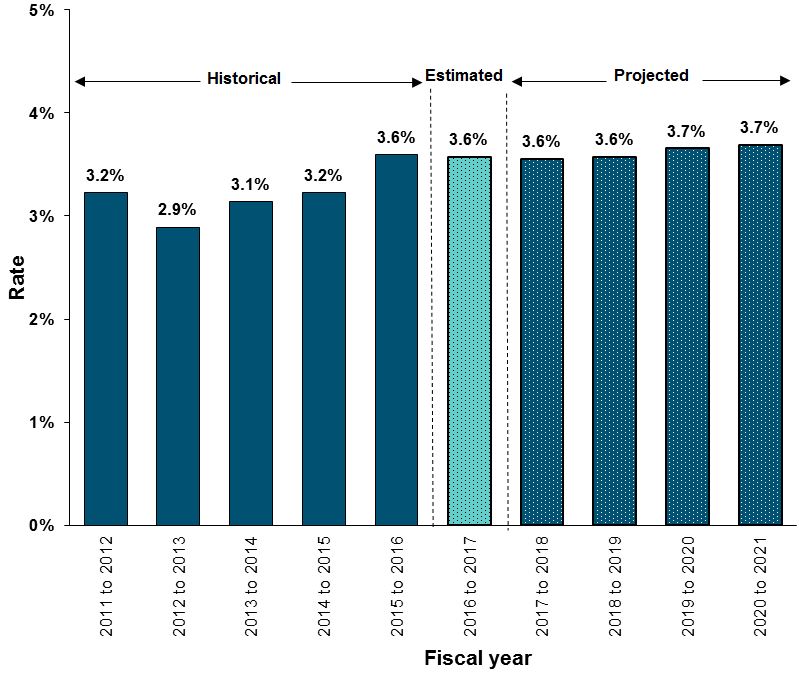
Figure 10 - Text version
| Fiscal year | Retirements | |
|---|---|---|
| Historical | 2011 to 2012 | 3.2% |
| 2012 to 2013 | 2.9% | |
| 2013 to 2014 | 3.1% | |
| 2014 to 2015 | 3.2% | |
| 2015 to 2016 | 3.6% | |
| Estimated | 2016 to 2017 | 3.6% |
| Projected | 2017 to 2018 | 3.6% |
| 2018 to 2019 | 3.6% | |
| 2019 to 2020 | 3.7% | |
| 2020 to 2021 | 3.7% |
Source: Office of the Chief Human Resources Officer, Treasury Board of Canada Secretariat.
Population: Indeterminate federal public servants, including employees who retire while on leave without pay.
Note: Projected retirement rates assume a stable population for the projected period. If the overall population increases or decreases in the future, the rate will be affected.
Retirement eligibility: Employees are eligible to retire once they have reached the appropriate combination of pensionable years of service and age.
Years of experience in the federal public service
Figure 11 shows the distribution of indeterminate federal public servants by experience level. Between 2015 and 2016, employees with 15 to 24 years of experience represented the largest increase (from 22.9% to 24.6%), while employees with 5 to 14 years of experience represented the largest decrease (from 49.4% to 48.2%).
From 2016 to 2017, the proportions of employees with 5 to 14 years and 25 years or more of pensionable years of service are projected to decrease to 45.0% and 16.4%, respectively. The proportion of employees with 0 to 4 years of experience is projected to increase to 11.3%, and those with 15 to 24 pensionable years of service are expected to increase to 27.3%.
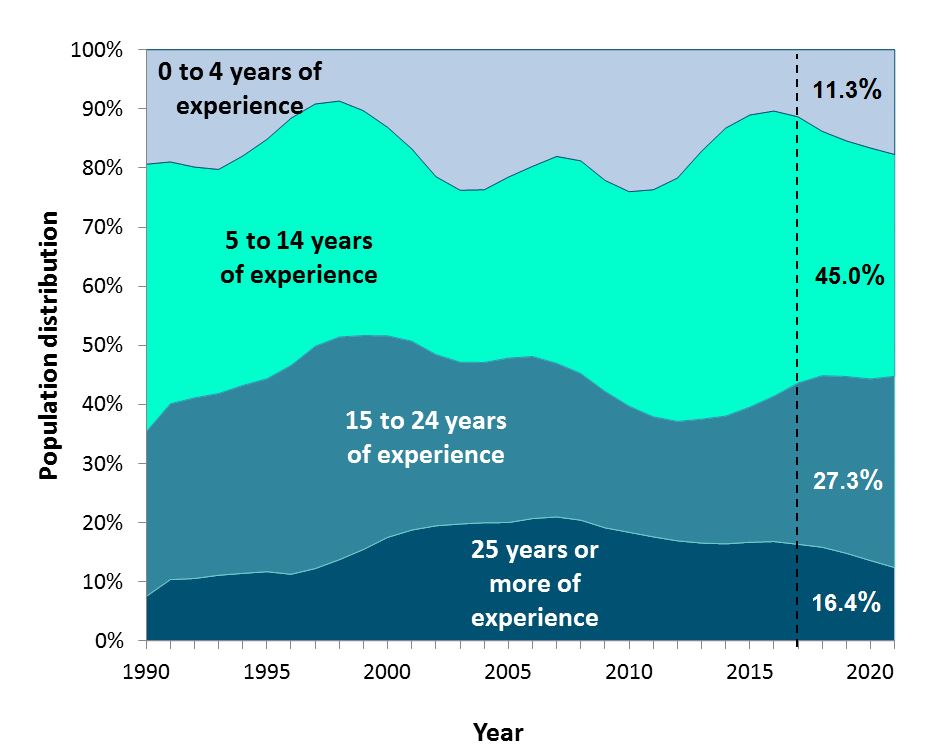
Figure 11 - Text version
| Year | 0 to 4 years of experience | 5 to 14 years of experience | 15 to 24 years of experience | 25 years or more of experience | |
|---|---|---|---|---|---|
| Historical | 1990 | 19.4% | 45.2% | 27.8% | 7.6% |
| 1991 | 19.0% | 40.9% | 29.7% | 10.4% | |
| 1992 | 19.8% | 39.0% | 30.5% | 10.6% | |
| 1993 | 20.2% | 37.9% | 30.7% | 11.1% | |
| 1994 | 18.0% | 38.8% | 31.8% | 11.5% | |
| 1995 | 15.2% | 40.5% | 32.6% | 11.7% | |
| 1996 | 11.6% | 41.8% | 35.3% | 11.3% | |
| 1997 | 9.2% | 41.0% | 37.6% | 12.3% | |
| 1998 | 8.7% | 39.9% | 37.7% | 13.8% | |
| 1999 | 10.3% | 38.0% | 36.2% | 15.5% | |
| 2000 | 13.1% | 35.3% | 34.1% | 17.5% | |
| 2001 | 16.8% | 32.5% | 31.9% | 18.8% | |
| 2002 | 21.4% | 30.1% | 29.0% | 19.5% | |
| 2003 | 23.8% | 29.1% | 27.4% | 19.8% | |
| 2004 | 23.7% | 29.2% | 27.1% | 20.0% | |
| 2005 | 21.5% | 30.6% | 27.8% | 20.0% | |
| 2006 | 19.7% | 32.1% | 27.4% | 20.7% | |
| 2007 | 18.0% | 35.0% | 26.0% | 21.0% | |
| 2008 | 18.8% | 36.0% | 24.8% | 20.4% | |
| 2009 | 22.1% | 35.7% | 23.1% | 19.2% | |
| 2010 | 24.0% | 36.3% | 21.3% | 18.4% | |
| 2011 | 23.7% | 38.4% | 20.3% | 17.6% | |
| 2012 | 21.7% | 41.2% | 20.2% | 17.0% | |
| 2013 | 17.2% | 45.3% | 21.0% | 16.6% | |
| 2014 | 13.2% | 48.7% | 21.6% | 16.4% | |
| 2015 | 11.0% | 49.4% | 22.9% | 16.7% | |
| 2016 | 10.4% | 48.2% | 24.6% | 16.8% | |
| Estimated | 2017 | 11.3% | 45.0% | 27.3% | 16.4% |
| Projected | 2018 | 13.8% | 41.3% | 29.0% | 15.9% |
| 2019 | 15.4% | 39.8% | 29.9% | 14.8% | |
| 2020 | 16.6% | 39.0% | 30.7% | 13.6% | |
| 2021 | 17.7% | 37.5% | 32.4% | 12.4% |
Source: Office of the Chief Human Resources Officer, Treasury Board of Canada Secretariat.
Population: Indeterminate federal public servants, including employees on leave without pay.
Note: The forecasted distribution is based on the assumption of a stable population over the projected period. If the overall population increases or decreases in the future, the rate will be affected.
A knowledge-intensive workforce in the core public administration
In 1990, the workforce was composed mainly of clerical and operational workers. Since then, employees undertaking more knowledge-intensive work comprise an ever-increasing share of employees in the core public administration. The cadre of knowledge workers is highly skilled, with significant expertise gained through a combination of education, training and experience. The transformation in work has been in response to an increasingly demanding environment, new challenges and technological advances since 1990.
As shown in Figure 12, the five largest knowledge-intensive occupational groups in the core public administration increased since 1990. These groups are Administrative Services (AS), Program Administration (PM), Computer Systems (CS), Economics and Social Science Services (EC) and Executive (EX). In 2016, these occupational groups represented 41.6% of the core public administration workforce; they represented only 22.6% in 1990.
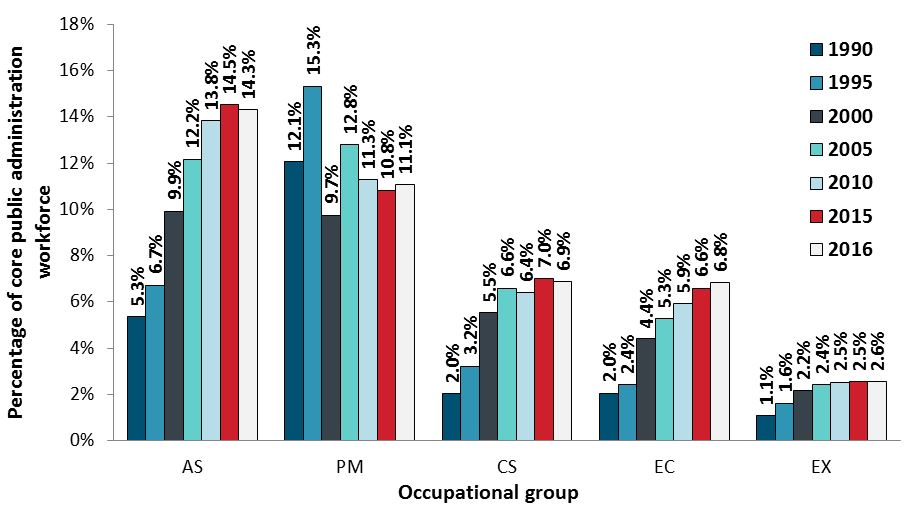
Figure 12 - Text version
| Occupational group | 1990 | 1995 | 2000 | 2005 | 2010 | 2015 | 2016 |
|---|---|---|---|---|---|---|---|
| AS | 5.3% | 6.7% | 9.9% | 12.2% | 13.8% | 14.5% | 14.3% |
| PM | 12.1% | 15.3% | 9.7% | 12.8% | 11.3% | 10.8% | 11.1% |
| CS | 2.0% | 3.2% | 5.5% | 6.6% | 6.4% | 7.0% | 6.9% |
| EC | 2.0% | 2.4% | 4.4% | 5.3% | 5.9% | 6.6% | 6.8% |
| EX | 1.1% | 1.6% | 2.2% | 2.4% | 2.5% | 2.5% | 2.6% |
Source: Office of the Chief Human Resources Officer, Treasury Board of Canada Secretariat.
Notes
The information provided is for the core public administration only. Figure 12 includes all employment tenures and active employees only (employees on leave without pay are excluded), based on effective employment classification (acting appointments are included). The information provided is based on data as of March 31.
To provide an accurate picture of the growth and share of occupations historically, the analysis excludes the Canada Revenue Agency (all 15 of its predecessors) and the Canada Border Services Agency. The Canada Revenue Agency was a part of the core public administration until 1999, after which it became a separate agency. The Canada Border Services Agency was created in 2003 as part of the core public administration; a majority of its employees were transferred from the Canada Revenue Agency.
On June 22, 2009, the Economics, Sociology and Statistics (ES) and the Social Science Support (SI) occupational groups were combined to form the Economics and Social Science Services (EC) occupational group. For consistency, all ES, SI and EC numbers have been combined each year to create the EC occupational group.
Part 2: demographic profile of executives
This section provides demographic information about the federal public service Executive Group.
Typically, assistant deputy ministers (classified as EX 04 and EX 05) fulfill senior leadership functions, providing strategic direction and oversight, while directors, executive directors and directors general (classified from EX 01 to EX 03) fulfill executive functions and are responsible for managing employees.
Population size of the Executive Group
As of March 31, 2016, there were 6,414 executives in the federal public service. Approximately one half (51.2%) of executives were EX 01s, and only 6.3% were EX 04s and EX 05s.
Between 1990 and 2016, the federal public service executive workforce grew by 54.6% due to an increase in knowledge-based occupational groups, an increase in director-level positions being classified as EX positions, and deputy heads having control of the size of the Executive Group. During the same period, the overall federal public service grew by 3.3%. Compared with 2015, there was a 0.8% increase in both the number of executives and the overall federal public service. Executives accounted for 2.5% of the entire federal public service population in 2016, up from 2.3% in 2006.
Executive diversity
Employment equity designated groups among core public administration executives
Figure 13 illustrates the levels of executive representation in the core public administration for all four employment equity groups in 2006 and in 2016.

Figure 13 - Text version
| Employment equity designated group | March 2006 | March 2016 | Workforce availability |
|---|---|---|---|
| Women | 38.8% | 47.3% | 47.8% |
| Aboriginal peoples | 3.4% | 3.7% | 5.2% |
| Persons with disabilities | 5.5% | 5.1% | 2.3% |
| Members of a visible minority group | 5.5% | 9.4% | 9.6% |
Source: Office of the Chief Human Resources Officer, Treasury Board of Canada Secretariat.
Population: Indeterminate employees and term employees of three months or more in the core public administration (departments and agencies for which the Treasury Board is the employer), excluding employees on leave without pay.
Notes
Workforce availability estimates for the core public administration are based on the 2011 National Household Survey and the 2012 Canadian Survey on Disability.
The source of the representation data is the core public administration Employment Equity Data Bank, which is populated with self-identification information provided by employees.
Representation and Workforce Availability numbers for March 2016 include EX, GX (General Executive) and LC (Law Management) classifications, whereas representation for March 2006 excludes LCs; therefore, the two years cannot be directly compared.
The workforce availability for core public administration executives for persons with disabilities should be used with caution due to high variability in sampling.
As of March 2016, the core public administration representation levels for all designated groups in the executive category, with the exception of persons with disabilities, did not meet their respective workforce availability, as shown in Figure 13.
Compared with 2015, the representation levels of designated groups at the executive level did not increase or decrease significantly.
First official language of executives
Figure 14 illustrates that between 1990 and 2016, a growing proportion of executives in the federal public service indicated that French is their first official language (increasing from 21.8% to 30.5%). The current ratio in the executive cadre reflects the ratio in the overall federal public service (71.5% indicating English and 28.5% indicating French).
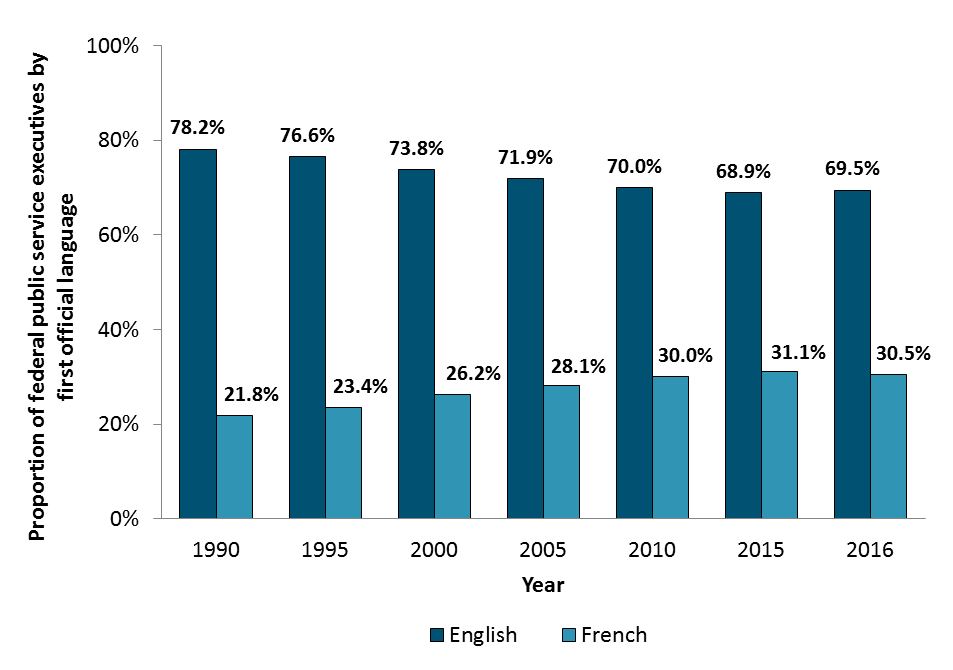
Figure 14 - Text version
| 1990 | 1995 | 2000 | 2005 | 2010 | 2015 | 2016 | |
|---|---|---|---|---|---|---|---|
| English | 78.2% | 76.6% | 73.8% | 71.9% | 70.0% | 68.9% | 69.5% |
| French | 21.8% | 23.4% | 26.2% | 28.1% | 30.0% | 31.1% | 30.5% |
Source: Office of the Chief Human Resources Officer, Treasury Board of Canada Secretariat.
Population: Includes all federal public service executives, specifically, core public administration executives and their equivalents in separate agencies (such as Executive Group (EX) and Management Group (MG) classifications) in all tenures (indeterminate, term and casual). It does not include executives on leave without pay or those whose data on first official language is missing. The information provided is based on data as of March 31.
Age of executives in the federal public service
The age distribution of federal public service executives is shown in Figure 15 for 2010, 2015 and 2016. The proportion of executives under 50 years of age increased slightly from 46.7% in 2010 to 46.8% in 2016; in 2015, the percentage was 46.1%. The proportion of executives over 50 during this period decreased slightly from 53.3% in 2010 to 53.2% in 2016.
The average age of executives in the federal public service increased slightly between 2010 and 2016, from 50.1 years in 2010 to 50.3 years in 2016.

Figure 15 - Text version
| Year | Age band | |||||||||
|---|---|---|---|---|---|---|---|---|---|---|
| 25 to 29 | 30 to 34 | 35 to 39 | 40 to 44 | 45 to 49 | 50 to 54 | 55 to 59 | 60 to 64 | 65 and over | Total | |
| 2010 | 0.0% | 1.4% | 7.4% | 15.6% | 22.4% | 28.0% | 18.4% | 5.8% | 1.0% | 100.0% |
| 2015 | 0.0% | 0.8% | 6.9% | 15.6% | 22.8% | 27.7% | 19.2% | 5.8% | 1.2% | 100.0% |
| 2016 | 0.0% | 0.8% | 7.0% | 15.4% | 23.7% | 26.8% | 19.5% | 5.7% | 1.3% | 100.0% |
Source: Office of the Chief Human Resources Officer, Treasury Board of Canada Secretariat.
Population: Includes all federal public service executives, specifically, core public administration executives and their equivalents in separate agencies (such as Executive Group (EX) and Management Group (MG) classifications) in all tenures (indeterminate, term and casual). It does not include executives on leave without pay. The information provided is based on data as of March 31.
Figure 16 shows that the average age for all executives in the federal public service has increased. However, since 2005, there has been relative stability in the average age of executives at the EX 01 to EX 03 levels and at the EX 04 and EX 05 levels.
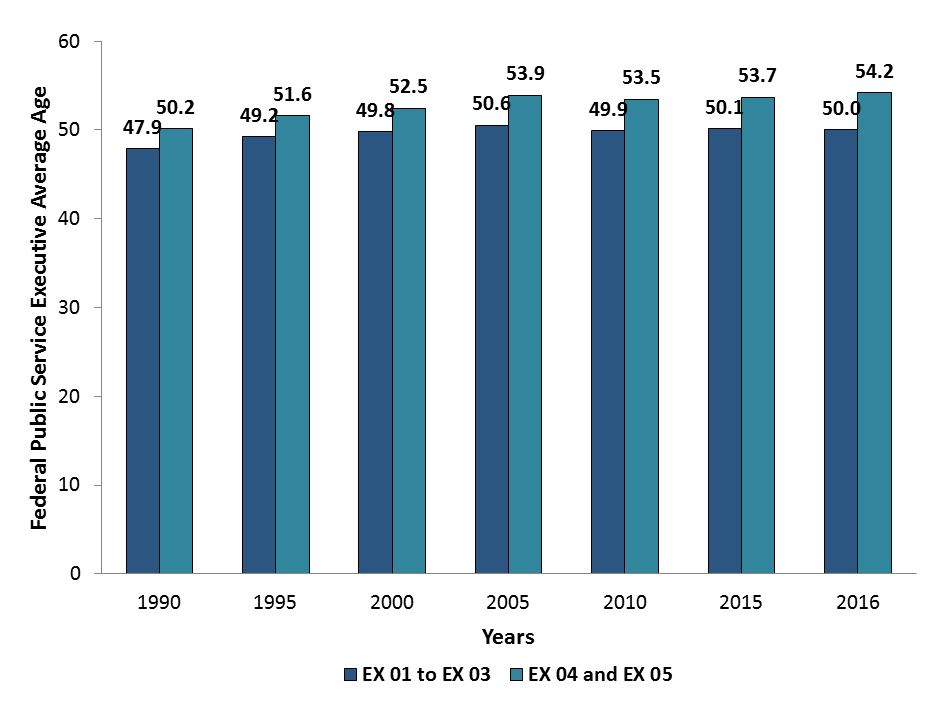
Figure 16 - Text version
| 1990 | 1995 | 2000 | 2005 | 2010 | 2015 | 2016 | |
|---|---|---|---|---|---|---|---|
| EX 01 to EX 03 | 47.9 | 49.2 | 49.8 | 50.6 | 49.9 | 50.1 | 50.0 |
| EX 04 and EX 05 | 50.2 | 51.6 | 52.5 | 53.9 | 53.5 | 53.7 | 54.2 |
Source: Office of the Chief Human Resources Officer, Treasury Board of Canada Secretariat.
Population: Includes all federal public service executives, specifically, core public administration executives and their equivalents in separate agencies (such as Executive Group (EX) and Management Group (MG) classifications) in all tenures (indeterminate, term and casual). The population does not include executives on leave without pay. The information provided is based on data as of March 31.
The average age in 2016 for the various employee segments of the federal public service described in this document are summarized as follows:
- All: 45.0 years
- Executives: 50.3 years
- EX 01 to EX 03: 50.0 years
- EX 04 and EX 05: 54.2 years