
Demographic Snapshot of Canada’s Public Service, 2018
Preamble
This snapshot provides key demographics for Canada’s federal public service and supplements the Clerk of the Privy Council’s Twenty-Sixth Annual Report to the Prime Minister on the Public Service of Canada.
The Office of the Chief Human Resources Officer (OCHRO) works in partnership with departments and agencies to access, analyze, and share federal public service workforce data to identify current workforce trends. In the coming year, the public service will aim to recruit and equip the next generation of federal public servants to carry out the Government of Canada’s priorities.
On this page
Introduction
This snapshot compares the current workforce with that of the baseline year of 2000. The data in this snapshot is current as of , unless indicated otherwise.
Part 1 of this document covers all employees of the entire federal public service (the core public administration), and Part 2 focuses on executives. Part 3 provides highlights from the 2018 Public Service Employee Survey and the 2018 Student Exit Survey.
Canada’s federal public service consists of two population segments:
- the core public administration
- separate agencies
The term “core public administration” refers to approximately 70 departments and agencies for which the Treasury Board is the employer. These organizations are listed in Schedules I and IV of the Financial Administration Act.
The term “separate agencies” refers to agencies listed in Schedule V of the act. Separate agencies conduct their own negotiations and may set their own classification system and compensation levels for their employees.
The principal separate agencies are:
- Canada Revenue Agency
- Parks Canada
- Canadian Food Inspection Agency
- National Research Council Canada
Population counts for the following separate agencies are not included because their employee information is not available in the pay system:
- Canadian Security Intelligence Service
- National Capital Commission
- Canada Investment and Savings
- Canadian Forces Non‑Public Funds
The federal public service does not include:
- ministers’ exempt staff
- employees locally engaged outside Canada
- RCMP regular force members
- RCMP civilian force members
- Canadian Armed Forces members
Highlights from 2018
In this section
1. Number of employees
- 273,571 active employees (211,925 in 2000)
- Represents 0.74% of the Canadian population (0.69% in 2000)
2. Location
- 58.7% of employees are in the regions (64.5% in 2000)
- 41.3% are in the National Capital Region (35.5% in 2000)
3. Employment status
- 83.6% are indeterminate employees (79.8% in 2000)
- 10.6% are term employees (16.8% in 2000)
- 5.8% are casuals and students (3.4% in 2000)
4. Women
- 55.3% of employees are women (52.0% in 2000)
- 48.1% of executives are women (28.0% in 2000)
5. Official languages
- 70.9% indicated English as their first official language (70.3% in 2000)
- 29.1% indicated French as their first official language (29.7% in 2000)
6. Age
- Average age of employees: 44.6 years (43.1 in 2000)
- Average age of executives: 50.2 years (50.0 in 2000)
Part 1: federal public service
In this section
Relative size and spending
Between 2000 and 2018:
- the population of Canada grew from approximately 30.6 million to 36.8 million (an increase of 20.6%)Footnote1
- the number of federal public servants increased from 211,925 to 273,571 (29.1%)Footnote2.
The federal public service comprised 0.74% of the Canadian population in 2018. This is well below the ratios in the 1980s and early 1990s, which were very close to 1% and slightly higher than 0.79% in 2008.
Between 2000 and 2018:
- Canada’s real gross domestic product increased by 46.5%Footnote3
- real federal program spending increased by 86.4% (in constant dollars)Footnote4
Most recently, from the 2016 to 2017 fiscal year to the 2017 to 2018 fiscal year, there was:
- an increase of 3.0% in real gross domestic product
- an increase of 6.5% in real federal program spending
Since the 2010 to 2015 period, where the workforce decreased in response to budget reductions, there has been an increase in the federal public service workforce.
Figure 1 shows trends in the economy, the Canadian population, real federal program spending and the size of the federal public service, from 2000 to 2018.
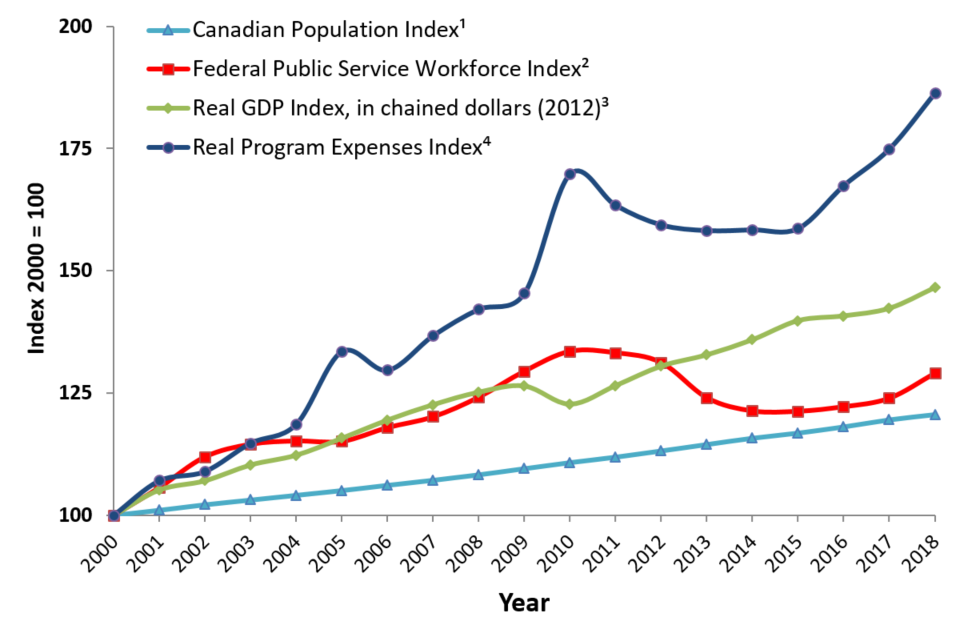
Figure 1 - Text version
| Year | Canadian
Population Indextable 1 note 1 |
Federal Public Service
Workforce Indextable 1 note 2 |
Real GDP Indextable 1 note 3, in
chained dollars (2012) |
Real Program
Expenses Indextable 1 note 4, (in 2002 dollars) |
|---|---|---|---|---|
Table 1 Notes
|
||||
| 2000 | 100 | 100 | 100 | 100 |
| 2001 | 101 | 106 | 105 | 107 |
| 2002 | 102 | 112 | 107 | 109 |
| 2003 | 103 | 115 | 110 | 115 |
| 2004 | 104 | 115 | 112 | 119 |
| 2005 | 105 | 115 | 116 | 133 |
| 2006 | 106 | 118 | 119 | 130 |
| 2007 | 107 | 120 | 123 | 137 |
| 2008 | 108 | 124 | 125 | 142 |
| 2009 | 110 | 129 | 126 | 145 |
| 2010 | 111 | 134 | 123 | 170 |
| 2011 | 112 | 133 | 126 | 163 |
| 2012 | 113 | 131 | 130 | 159 |
| 2013 | 114 | 124 | 133 | 158 |
| 2014 | 116 | 121 | 136 | 158 |
| 2015 | 117 | 121 | 140 | 159 |
| 2016 | 118 | 122 | 141 | 167 |
| 2017 | 120 | 124 | 142 | 175 |
| 2018 | 121 | 129 | 147 | 186 |
Sources: Office of the Chief Human Resources Officer, Treasury Board of Canada Secretariat; Statistics Canada; Department of Finance Canada (Fiscal Reference Tables).
- Based on data as of April 1 for each year.
- Based on active employees only and based on data as of March 31 for each year.
- Based on calendar year data.
- Based on fiscal year data. Program expenses include transfers and were deflated using the Consumer Price Index.
Diversity in the federal public service
Gender
As shown in Figure 2, in 2018, women made up 55.3% of the federal public service, a 3.3 % increase from 2000. It is also a considerable increase (32.2%) from 1990.
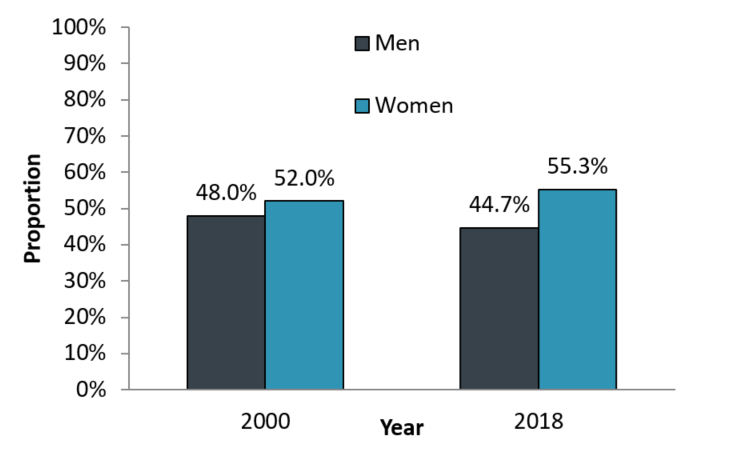
Figure 2 - Text version
| Gender | 2000 | 2018 |
|---|---|---|
| Men | 48.0% | 44.7% |
| Women | 52.0% | 55.3% |
Source: Office of the Chief Human Resources Officer, Treasury Board of Canada Secretariat.
Notes
Population: Includes all employment tenures and does not include employees on leave without pay.
The information provided is based on data as of March 31.
First official language
As shown in Figure 3, the breakdown of federal public servants by first official language in 2018 is almost the same as it was in 2000.
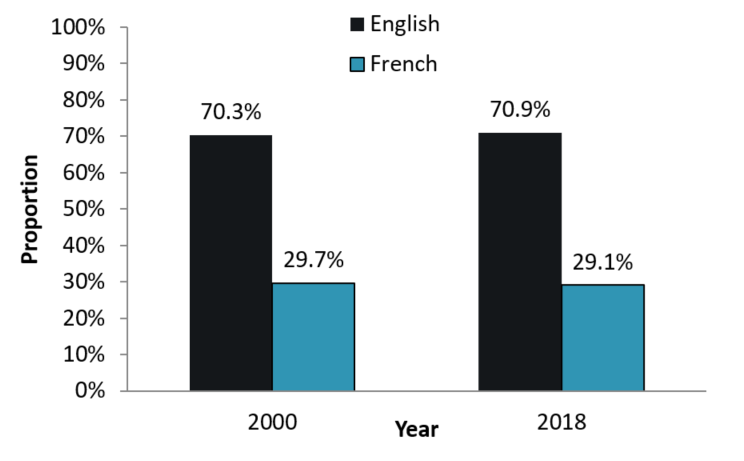
Figure 3 - Text version
| Language | 2000 | 2018 |
|---|---|---|
| English | 70.3% | 70.9% |
| French | 29.7% | 29.1% |
Source: Office of the Chief Human Resources Officer, Treasury Board of Canada Secretariat.
Notes
Population:Includes all employment tenures and active employees only (employees on leave without pay are excluded).
The information provided is based on data as of March 31.
Age of federal public servants
Figure 4 compares the breakdown of federal public servants in 2010, 2015 and 2018 by age. From 2010 to 2018, the age breakdown changed slightly, with:
- decreases in the proportion of employees under 34 and those aged 50 to 54
- increases in the proportion of employees aged 35 to 39 and those aged 40 to 44
The average age of federal public servants increased slightly, from 43.9 years in 2010, to 45.0 years in 2015, to 44.6 years in 2018.
Figure 4: federal public servants by age band, 2010, 2015 and 2018, as a percentage of public service workforce
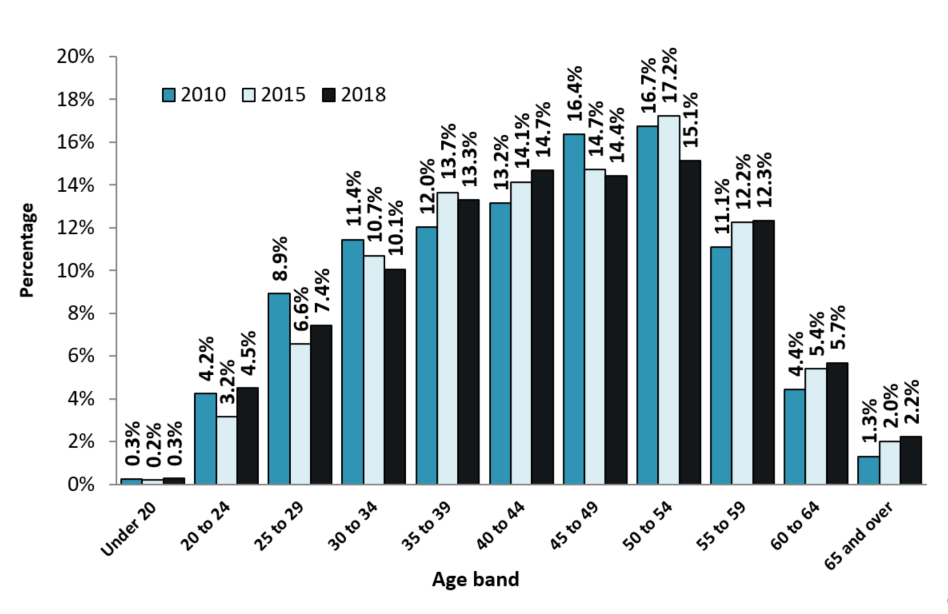
Figure 4 - Text version
| Age band | 2010 | 2015 | 2018 |
|---|---|---|---|
| Under 20 | 0.3% | 0.2% | 0.3% |
| 20 to 24 | 4.2% | 3.2% | 4.5% |
| 25 to 29 | 8.9% | 6.6% | 7.4% |
| 30 to 34 | 11.4% | 10.7% | 10.1% |
| 35 to 39 | 12.0% | 13.7% | 13.3% |
| 40 to 44 | 13.2% | 14.1% | 14.7% |
| 45 to 49 | 16.4% | 14.7% | 14.4% |
| 50 to 54 | 16.7% | 17.2% | 15.1% |
| 55 to 59 | 11.1% | 12.2% | 12.3% |
| 60 to 64 | 4.4% | 5.4% | 5.7% |
| 65 and over | 1.3% | 2.0% | 2.2% |
Source: Office of the Chief Human Resources Officer, Treasury Board of Canada Secretariat.
Notes
Population: Includes all employment tenures and active employees only (employees on leave without pay are excluded).
The information provided excludes employees with an unknown age and is based on data as of March 31.
Figure 5 shows the distribution of federal public servants by age for 2000, 2010 and 2018. Up until 2015, baby boomers (people born between 1946 and 1966) made up the largest group of federal public servants; however, they are being replaced by Generation Xers (people born between 1967 and 1979) and millennials (people born after 1979). Generation Xers now represent the largest group of public servants (40.6%).
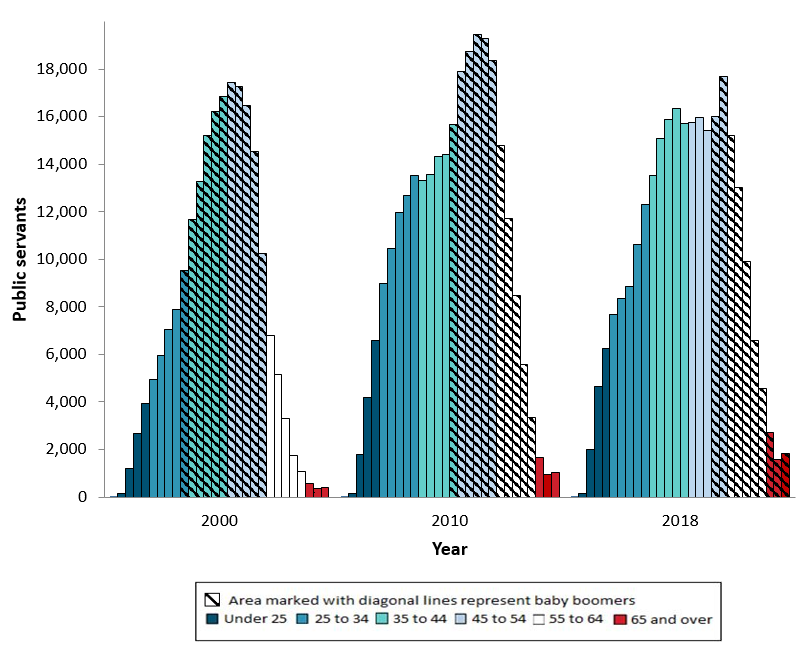
Figure 5 - Text version
| Age band | Age | 2000 | 2010 | 2018 |
|---|---|---|---|---|
| Under 25 | Under 17 | 7 | 14 | 2 |
| 17 to 18 | 137 | 155 | 157 | |
| 19 to 20 | 1,207 | 1,783 | 1,995 | |
| 21 to 22 | 2,663 | 4,194 | 4,652 | |
| 23 to 24 | 3,927 | 6,571 | 6,248 | |
| 25 to 34 | 25 to 26 | 4,950 | 8,977 | 7,668 |
| 27 to 28 | 5,950 | 10,472 | 8,335 | |
| 29 to 30 | 7,035 | 11,970 | 8,861 | |
| 31 to 32 | 7,877 | 12,687 | 10,605 | |
| 33 to 34 | 9,538 | 13,518 | 12,304 | |
| 35 to 44 | 35 to 36 | 11,689 | 13,327 | 13,537 |
| 37 to 38 | 13,263 | 13,585 | 15,069 | |
| 39 to 40 | 15,219 | 14,318 | 15,859 | |
| 41 to 42 | 16,223 | 14,393 | 16,340 | |
| 43 to 44 | 16,858 | 15,676 | 15,722 | |
| 45 to 54 | 45 to 46 | 17,432 | 17,912 | 15,766 |
| 47 to 48 | 17,250 | 18,729 | 15,952 | |
| 49 to 50 | 16,480 | 19,439 | 15,421 | |
| 51 to 52 | 14,526 | 19,270 | 15,995 | |
| 53 to 54 | 10,254 | 18,352 | 17,708 | |
| 55 to 64 | 55 to 56 | 6,802 | 14,792 | 15,210 |
| 57 to 58 | 5,150 | 11,731 | 13,001 | |
| 59 to 60 | 3,320 | 8,497 | 9,910 | |
| 61 to 62 | 1,768 | 5,577 | 6,593 | |
| 63 to 64 | 1,083 | 3,359 | 4,564 | |
| 65 and over | 65 to 66 | 575 | 1,665 | 2,704 |
| 67 to 68 | 342 | 967 | 1,561 | |
| 69 and over | 398 | 1,048 | 1,827 |
Source: Office of the Chief Human Resources Officer, Treasury Board of Canada Secretariat.
Notes
Population: Includes all employment tenures and active employees only (employees on leave without pay are excluded).
The information provided is based on data as of March 31.
Each vertical bar for each year represents two years of age, with the exception of the first and last bar. The first bar for each year includes all individuals under 25 years of age, and the last bar for each year includes all individuals 65 years of age and over. Employees whose age is unknown have been excluded.
Hiring into the core public administration
Figure 6 shows indeterminate hiring in the core public administration over time. Indeterminate hiring has been on the rise since the 2012 to 2013 fiscal year. New indeterminate hiring in the core public administration increased by 33.1%, from 11,085 in the 2016 to 2017 fiscal year to 14,751 in the 2017 to 2018 fiscal year.
Figure 6: new indeterminate hires into core public administration (CPA) from the 2000 to 2001 fiscal year to the 2017 to 2018 fiscal year
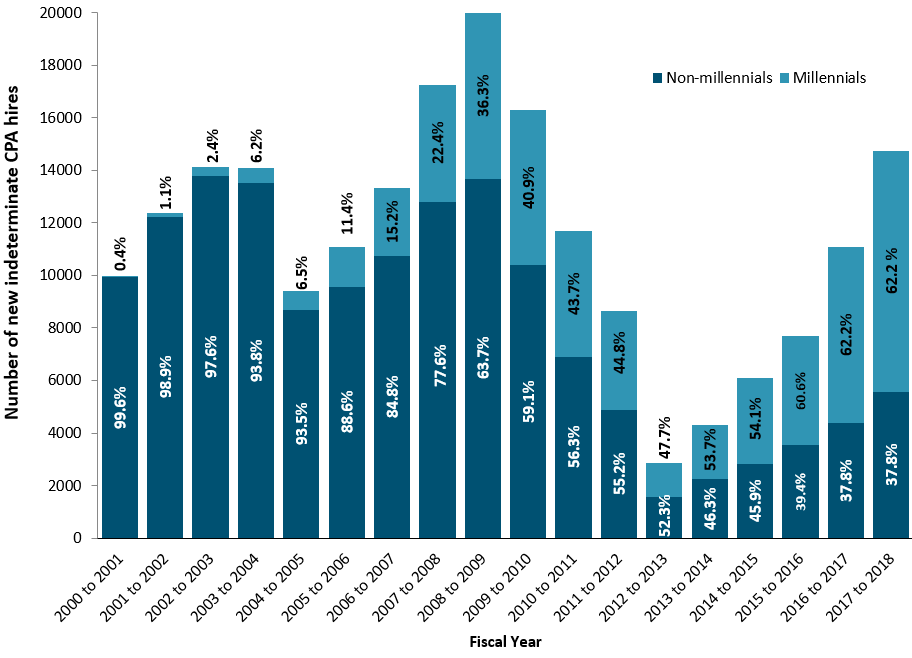
Figure 6 - Text version
| Fiscal year | Number of new indeterminate hires into CPA |
Millennials (%) |
Non-millennials (%) |
|---|---|---|---|
| 2000 to 2001 | 9,986 | 0.4% | 99.6% |
| 2001 to 2002 | 12,365 | 1.1% | 98.9% |
| 2002 to 2003 | 14,130 | 2.4% | 97.6% |
| 2003 to 2004 | 14,084 | 4.2% | 95.8% |
| 2004 to 2005 | 9,395 | 7.7% | 92.3% |
| 2005 to 2006 | 11,092 | 13.7% | 86.3% |
| 2006 to 2007 | 13,342 | 19.6% | 80.4% |
| 2007 to 2008 | 17,258 | 25.9% | 74.1% |
| 2008 to 2009 | 19,968 | 31.5% | 68.5% |
| 2009 to 2010 | 16,304 | 36.3% | 63.7% |
| 2010 to 2011 | 11,677 | 40.9% | 59.1% |
| 2011 to 2012 | 8,642 | 43.7% | 56.3% |
| 2012 to 2013 | 2,865 | 44.8% | 55.2% |
| 2013 to 2014 | 4,315 | 47.7% | 52.3% |
| 2014 to 2015 | 6,093 | 53.7% | 46.3% |
| 2015 to 2016 | 7,698 | 54.1% | 45.9% |
| 2016 to 2017 | 11,085 | 60.6% | 39.4% |
| 2017 to 2018 | 14,751 | 37.8% | 62.2% |
Source: Office of the Chief Human Resources Officer, Treasury Board of Canada Secretariat.
The hiring of new indeterminate employees who are millennials increased by 1.6% (from 60.6% in the 2016 to 2017 fiscal year to 62.2% in the 2017 to 2018 fiscal year). During this same period:
- the hiring of new indeterminate employees from the baby boomer generation decreased from 12.9% to 11.5%
- the hiring of those who are Generation Xers decreased slightly from 26.6% to 26.3%Footnote5
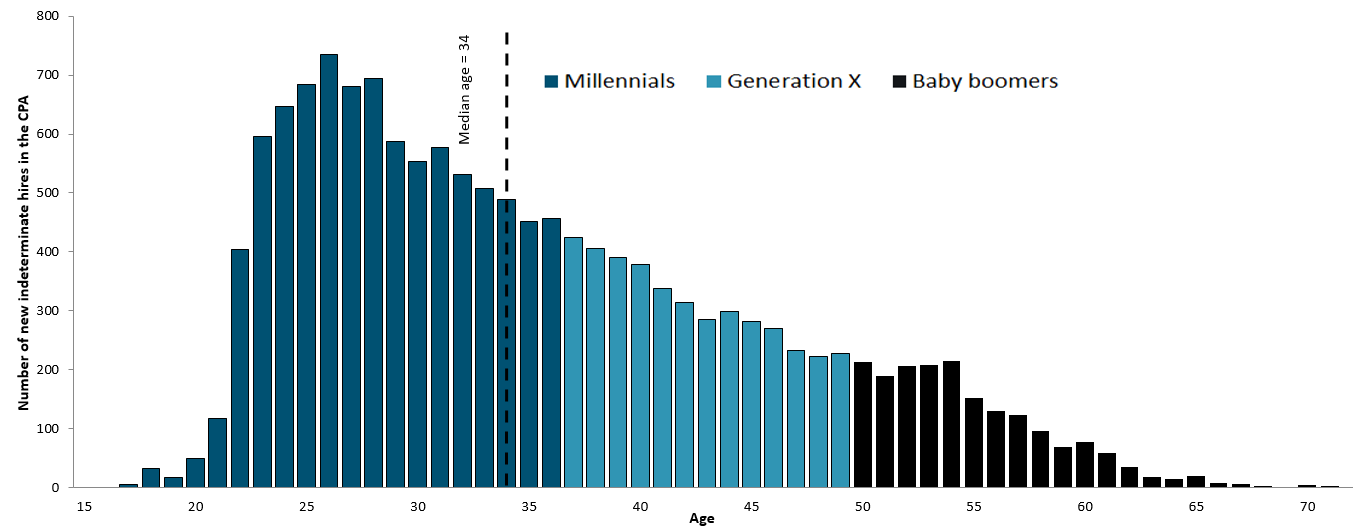
Figure 7 - Text version
| Age | Number of new indeterminate hires in the CPA | ||
|---|---|---|---|
| Baby boomers | Generation X | Millennials | |
| 17 | 5 | ||
| 18 | 33 | ||
| 19 | 17 | ||
| 20 | 50 | ||
| 21 | 118 | ||
| 22 | 404 | ||
| 23 | 595 | ||
| 24 | 646 | ||
| 25 | 684 | ||
| 26 | 735 | ||
| 27 | 680 | ||
| 28 | 695 | ||
| 29 | 588 | ||
| 30 | 553 | ||
| 31 | 578 | ||
| 32 | 531 | ||
| 33 | 508 | ||
| 34 | 489 | ||
| 35 | 452 | ||
| 36 | 457 | ||
| 37 | 92 | 333 | |
| 38 | 386 | 20 | |
| 39 | 390 | ||
| 40 | 379 | ||
| 41 | 338 | ||
| 42 | 314 | ||
| 43 | 285 | ||
| 44 | 299 | ||
| 45 | 282 | ||
| 46 | 270 | ||
| 47 | 233 | ||
| 48 | 222 | ||
| 49 | 228 | ||
| 50 | 51 | 163 | |
| 51 | 187 | 3 | |
| 52 | 206 | ||
| 53 | 209 | ||
| 54 | 215 | ||
| 55 | 152 | ||
| 56 | 130 | ||
| 57 | 124 | ||
| 58 | 97 | ||
| 59 | 69 | ||
| 60 | 78 | ||
| 61 | 59 | ||
| 62 | 36 | ||
| 63 | 18 | ||
| 64 | 15 | ||
| 65 | 20 | ||
| 66 | 9 | ||
| 67 | 6 | ||
| 68 | 3 | ||
| 70 | 4 | ||
| Over 70 | 4 | ||
| Median age | 34 | ||
Source: Office of the Chief Human Resources Officer, Treasury Board of Canada Secretariat.
Figure 7 shows the entire age distribution of new indeterminate hires in the core public administration. The median age was 34.
Retirements from the federal public service
As shown in Figure 8, the retirement rate:
- increased slightly between the 2014 to 2015 fiscal year and the 2015 to 2016 fiscal year (from 3.2% to 3.6%)
- dropped to 3.4% in the 2016 to 2017 fiscal year
The preliminary estimate for the retirement rate for the 2018 to 2019 fiscal year is 3.3%.
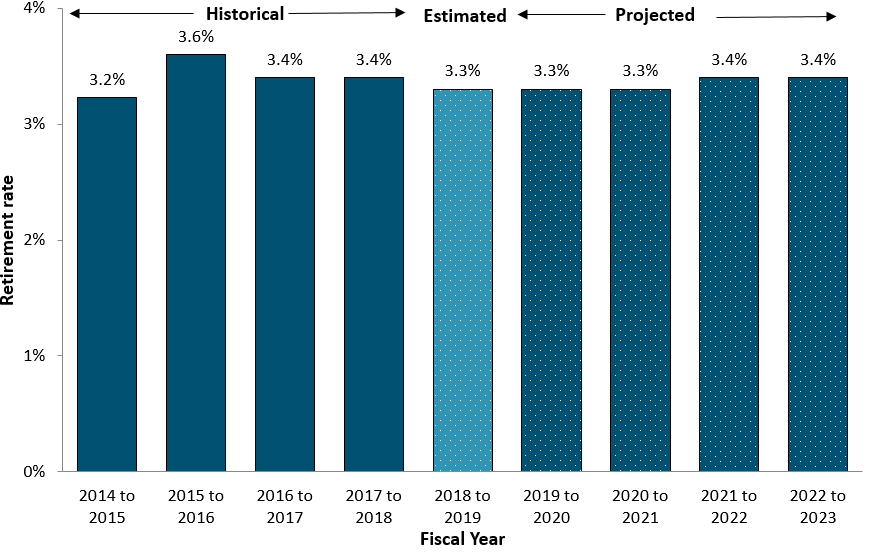
Figure 8 - Text version
| Type of rate | Fiscal year | Retirement rate |
|---|---|---|
| Historical | 2011 to 2012 | 3.2% |
| 2012 to 2013 | 2.9% | |
| 2013 to 2014 | 3.1% | |
| 2014 to 2015 | 3.2% | |
| 2015 to 2016 | 3.6% | |
| 2016 to 2017 | 3.4% | |
| 2017 to 2018 | 3.3% | |
| Estimated | 2018 to 2019 | 3.3% |
| Projected | 2019 to 2020 | 3.3% |
| 2020 to 2021 | 3.3% | |
| 2021 to 2022 | 3.4% | |
| 2022 to 2023 | 3.4% |
Source: Office of the Chief Human Resources Officer, Treasury Board of Canada Secretariat.
Notes
Population: Indeterminate federal public servants, including employees who retire while on leave without pay.
Projected retirement rates assume a stable population for the projected period. If the overall population increases or decreases in the future, the rate will be affected.
Years of experience in the federal public service
Figure 9 shows the distribution of indeterminate federal public servants by years of experience. Between March 2017 and 2018:
- employees with 0 to 4 years of experience represented the largest increase (from 11.9% in March 2017 to 15.4% in March 2018)
- employees with 5 to 14 years of experience represented the largest decrease (from 49.3% in March 2017 to 43.2% in March 2018)
Based on estimations for March 2019, indicated by the dotted line on the graph:
- the proportion of employees with 0 to 4 years of experience will be 18.9%
- the proportion of employees with 5 to 14 years of experience will be 40.1%
- the proportion of employees with 15 to 24 years of experience will be 28.2%
- the proportion of employees with 25 years or more will be 12.8%
Projections up to March 2029 estimate that these proportions will have changed to 17.4%, 37.3%, 29.4% and 16.0%, respectively.
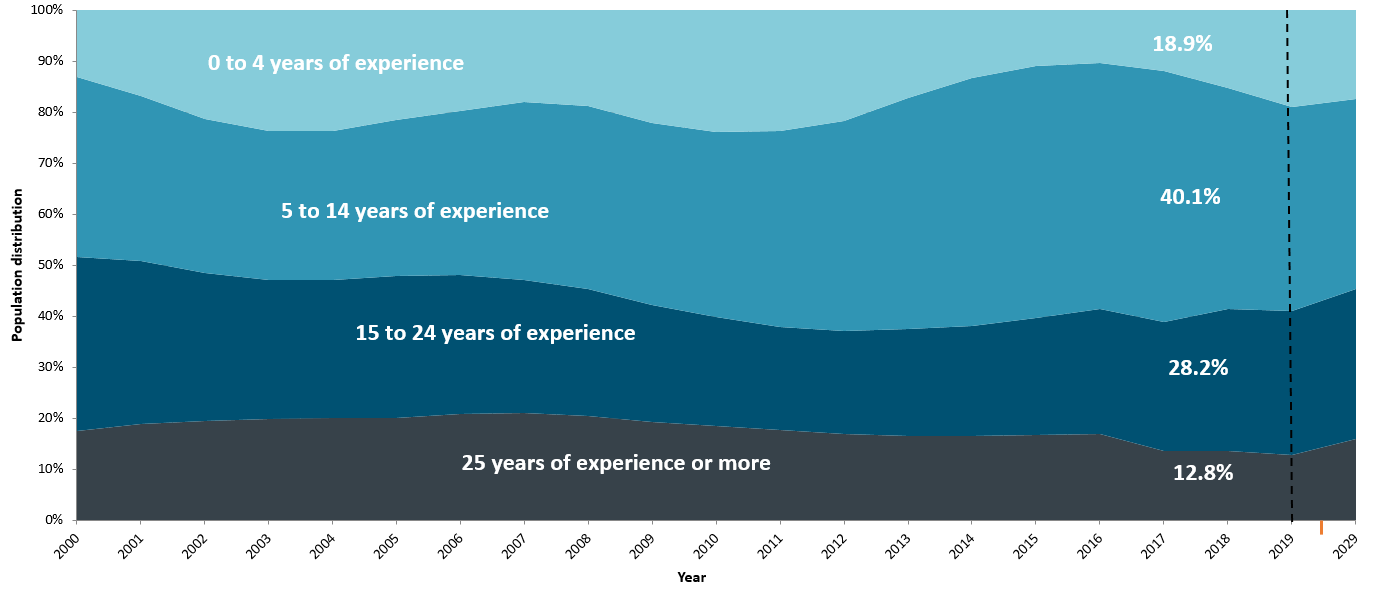
Figure 9 - Text version
| Year | 0 to 4 years | 5 to 14 years | 15 to 24 years | 25 years or more |
|---|---|---|---|---|
| 2000 | 13.1% | 35.3% | 34.1% | 17.5% |
| 2001 | 16.8% | 32.5% | 31.9% | 18.8% |
| 2002 | 21.4% | 30.1% | 29.0% | 19.5% |
| 2003 | 23.8% | 29.1% | 27.4% | 19.8% |
| 2004 | 23.7% | 29.2% | 27.1% | 20.0% |
| 2005 | 21.5% | 30.6% | 27.8% | 20.0% |
| 2006 | 19.7% | 32.1% | 27.4% | 20.7% |
| 2007 | 18.0% | 35.0% | 26.0% | 21.0% |
| 2008 | 18.8% | 36.0% | 24.8% | 20.4% |
| 2009 | 22.1% | 35.7% | 23.1% | 19.2% |
| 2010 | 24.0% | 36.3% | 21.3% | 18.4% |
| 2011 | 23.7% | 38.4% | 20.3% | 17.6% |
| 2012 | 21.7% | 41.2% | 20.2% | 17.0% |
| 2013 | 17.2% | 45.3% | 21.0% | 16.6% |
| 2014 | 13.2% | 48.7% | 21.6% | 16.4% |
| 2015 | 11.0% | 49.4% | 22.9% | 16.7% |
| 2016 | 10.4% | 48.2% | 24.6% | 16.8% |
| 2017 | 11.9% | 49.3% | 25.2% | 13.6% |
| 2018 | 15.4% | 43.2% | 28.0% | 13.5% |
| 2019 | 18.9% | 40.1% | 28.2% | 12.8% |
| 2029 | 17.4% | 37.3% | 29.4% | 16.0% |
| 0 to 4 years | 5 to 14 years | 15 to 24 years | 25 years or more |
|---|---|---|---|
| 11.9% | 49.3% | 25.2% | 13.6% |
Source: Office of the Chief Human Resources Officer, Treasury Board of Canada Secretariat.
Notes
Population: Indeterminate federal public servants, including employees on leave without pay.
The projected distribution is based on the assumption of a stable population over the projected period. If the overall population increases or decreases in the future, the rate will be affected.
Knowledge-intensive workforce in the core public administration
In 1990, the public service workforce was composed mainly of clerical and operational workers. Since then, employees undertaking more knowledge-intensive work comprise an ever-increasing share of employees in the core public administration. The cadre of knowledge workers is highly skilled, with significant expertise gained through a combination of education, training and experience. The transformation in work has been in response to:
- an increasingly demanding environment
- new challenges
- technological advances since 2000
As shown in Figure 10, the five largest knowledge-intensive occupational groups in the core public administration increased since 2000. These groups are:
- Administrative Services (AS)
- Program Administration (PM)
- Computer Systems (CS)
- Economics and Social Science Services (EC)
- Executive (EX)
In 2018, these occupational groups represented 43.4% of the core public administration workforce; in 2000, they represented only 31.8%.
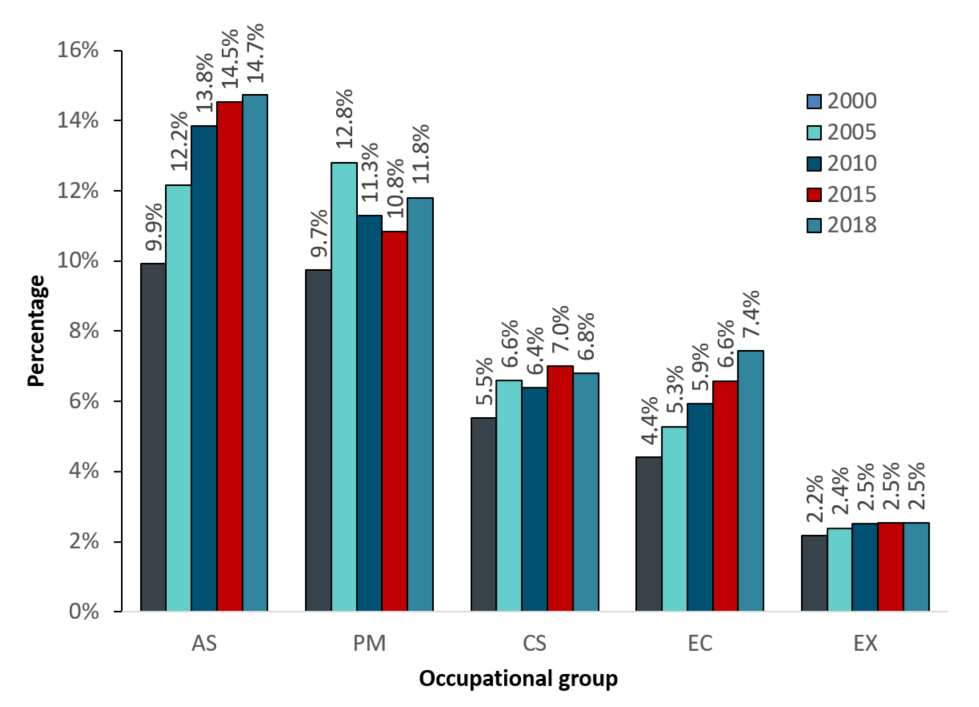
Figure 10 - Text version
| Occupational group | 2000 | 2005 | 2010 | 2015 | 2018 |
|---|---|---|---|---|---|
| AS | 9.9% | 12.2% | 13.8% | 14.5% | 14.7% |
| PM | 9.7% | 12.8% | 11.3% | 10.8% | 11.8% |
| CS | 5.5% | 6.6% | 6.4% | 7.0% | 6.8% |
| EC | 4.4% | 5.3% | 5.9% | 6.6% | 7.4% |
| EX | 2.2% | 2.4% | 2.5% | 2.5% | 2.5% |
Source: Office of the Chief Human Resources Officer, Treasury Board of Canada Secretariat.
Notes
Population: Includes all employment tenures and active employees only (employees on leave without pay are excluded), based on effective employment classification (acting appointments are included).
The information provided is based on data as of March 31.
To provide an accurate picture of the growth and share of occupations historically, the analysis excludes the Canada Revenue Agency (and all 15 of its predecessors) and the Canada Border Services Agency. The Canada Revenue Agency was a part of the core public administration until 1999, when it became a separate agency. The Canada Border Services Agency was created in 2003 and is part of the core public administration; most of its employees were transferred from the Canada Revenue Agency.
On , the Economics, Sociology and Statistics (ES) and the Social Science Support (SI) occupational groups were combined to form the Economics and Social Science Services (EC) occupational group.
Part 2: executives
In this section
This section provides demographic information about the federal public service’s Executive group.
Typically, assistant deputy ministers (classified as EX-04 and EX-05) fulfill senior leadership functions, providing strategic direction and oversight. Directors, executive directors and directors general (classified from EX-01 to EX-03) fulfill executive functions and are responsible for managing employees.
Population size of Executive group
As of , there were 6,678 executives in the federal public service:
- about half of them (50.7%) were EX-01s
- only 6.4% were EX-04s and EX-05s
Between 2000 and 2018, the federal public service executive workforce grew by 60.9% because:
- there was an overall increase in knowledge-based occupational groups
- there was an increase in the number of director-level positions classified as EX positions
- deputy heads had control of the size of the Executive group
During the same period, the overall federal public service grew by 29.1%. From 2017 to 2018, the number of executives increased by 3.1%. In 2018, executives made up 2.4% of the entire federal public service, up from 2.3% in 2008 and 2.0% in 2000.
Executive diversity
First official language of executives
As shown in Figure 11, between 2000 and 2018, the proportion of executives in the federal public service who indicated that French is their first official language increased from 26.2% to 32.3%. However, for the overall federal public service, the comparable figures show a decrease, with 29.7% and 29.1%, respectively.
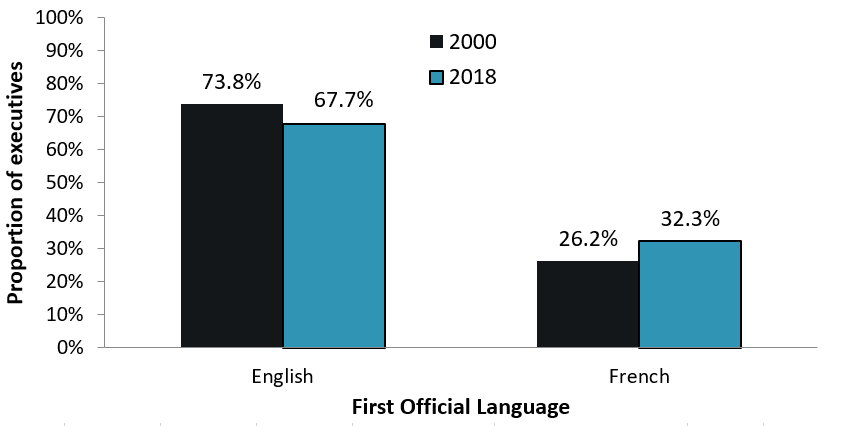
Figure 11 - Text version
| Language | 2000 | 2018 |
|---|---|---|
| English | 73.8% | 67.7% |
| French | 26.2% | 32.3% |
Source: Office of the Chief Human Resources Officer, Treasury Board of Canada Secretariat.
Notes
Population: Includes all federal public service executives, specifically, core public administration executives and their equivalents in separate agencies (such as Executive group (EX) and Management group (MG) classifications) in all tenures (indeterminate, term and casual). It does not include executives on leave without pay or those whose data on first official language is missing.
The information provided is based on data as of March 31.
Age of executives in federal public service
Figure 12 shows the age breakdown of federal public service executives for 2010, 2015 and 2018. The average age of executives in the federal public service remained relatively unchanged between 2010 and 2018, at 50.2 years of age. The proportion of executives under 50 years of age remained relatively constant between 2010 and 2018, at approximately 46.7% and 47.6%, respectively.
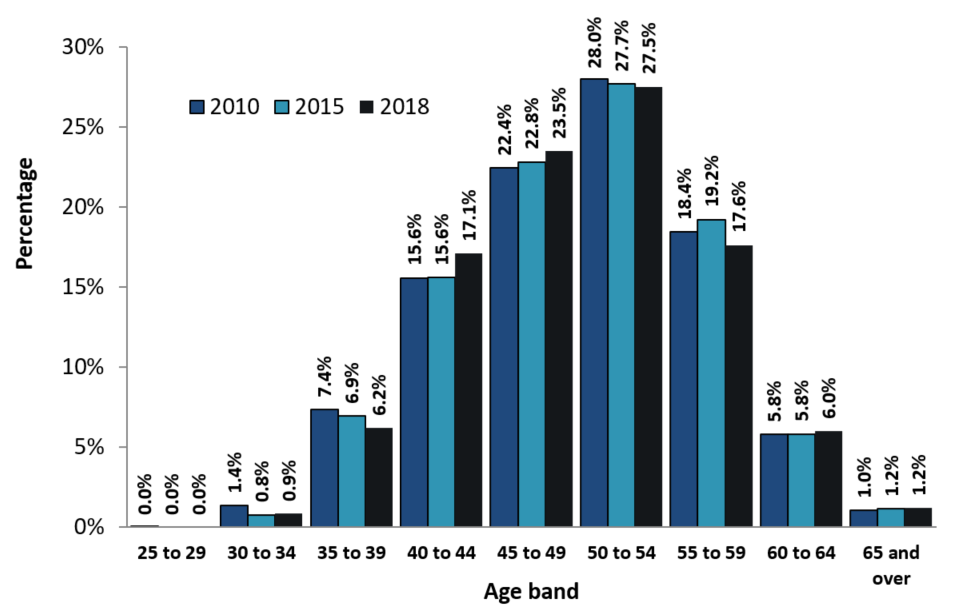
Figure 12 - Text version
| Year | Age band | ||||||||
|---|---|---|---|---|---|---|---|---|---|
| 25 to 29 | 30 to 34 | 35 to 39 | 40 to 44 | 45 to 49 | 50 to 54 | 55 to 59 | 60 to 64 | 65 and over | |
| 2010 | 0.0% | 1.4% | 7.4% | 15.6% | 22.4% | 28.0% | 18.4% | 5.8% | 1.0% |
| 2015 | 0.0% | 0.8% | 6.9% | 15.6% | 22.8% | 27.7% | 19.2% | 5.8% | 1.2% |
| 2018 | 0.0% | 0.9% | 6.2% | 17.1% | 23.5% | 27.5% | 17.6% | 6.0% | 1.2% |
Source: Office of the Chief Human Resources Officer, Treasury Board of Canada Secretariat.
Notes
Population: Includes all federal public service executives, specifically, core public administration executives and their equivalents in separate agencies (such as Executive group (EX) and Management group (MG) classifications) in all tenures (indeterminate, term and casual). It does not include executives on leave without pay.
The information provided is based on data as of March 31.
Figure 13 shows that between 2000 and 2018:
- the average age of junior executives at the EX-01 to EX-03 levels in the federal public service remained stable at approximately 50 years of age
- the average age of senior executives at the EX-04 to EX-05 levels hovered between 53 and 54 years of age
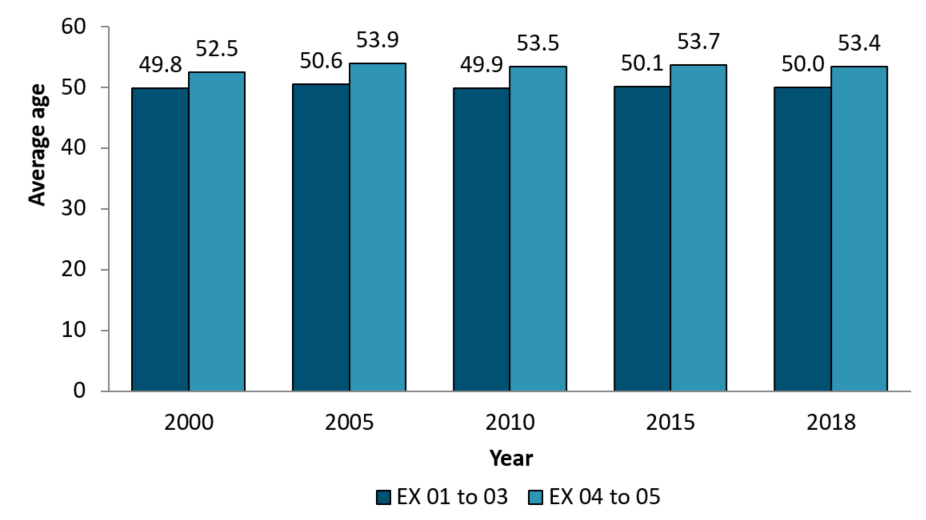
Figure 13 - Text version
| Level | 2000 | 2005 | 2010 | 2015 | 2018 |
|---|---|---|---|---|---|
| EX 01 to EX 03 | 49.8 | 50.6 | 49.9 | 50.1 | 50.0 |
| EX 04 and EX 05 | 52.5 | 53.9 | 53.5 | 53.7 | 53.4 |
Source: Office of the Chief Human Resources Officer, Treasury Board of Canada Secretariat.
Notes
Population: Includes all federal public service executives, specifically, core public administration executives and their equivalents in separate agencies (such as Executive group (EX) and Management group (MG) classifications) in all tenures (indeterminate, term and casual). The population does not include executives on leave without pay.
The information provided is based on data as of March 31.
Part 3: highlights from employee surveys
-
In this section
2018 Public Service Employee Survey
The Public Service Employee Survey (PSES) has been conducted every three years since 1999. The Office of the Chief Human Resources Office (OCHRO) of the Treasury Board of Canada Secretariat (TBS) transitioned from the triennial survey to an annual survey in 2018, which will enable departments and agencies to measure and track progress more frequently. The annual PSES will contain:
- core questions that are repeated every year
- questions that are inserted on a rotational basis
- questions related to current and emerging government priorities
- organization-specific questions
The 2018 PSES was developed by OCHRO and conducted from to .
A total of 163,121 employees in 84 federal departments and agencies responded to the 2018 PSES, for a response rate of 57.7%.
Results show that employees are engaged in their work: 80% of employees indicated that they like their job, which is the same percentage as for the 2017 PSES.
Perceptions of senior management are similar to what was found in the 2017 results. In 2018, 58% of employees indicated they have confidence in senior management (57% in 2017).
Employees feel more positive about training but less positive about support for their career development:
- 70% of employees felt that they get the training needed to do their job, an improvement from 2017 (66%)
- 53% of employees felt that their organization does a good job of supporting employee career development, a decrease from 2017 (57%)
Fifteen percent of employees reported harassment on the job in the past 12 months, and 8% of employees reported discrimination on the job in the past 12 months.
Pay system issues, which have not changed considerably since 2017, remain the top stressor for employees. Seventy percent of employees have been affected by issues with the pay system, and only 36% of those affected are satisfied with the support they receive from their department to resolve these issues.
Most employees believe that their workplace is respectful, and the results relating to respect in the workplace were slightly better than they were in 2017. Seventy-eight percent of employees indicated that their organization implements activities and practices that support a diverse workplace, a slight increase from 2017 (76%).
Results about psychological health in the workplace were more positive than in 2017, with 71% of employees indicating that their organization does a good job of raising awareness of mental health in the workplace, up from 67% in 2017. Also, 59% of employees described their workplace as being psychologically healthy, an improvement from 2017 (56%).
The results on diversity and inclusion have remained relatively stable compared to 2017, as 78% of employees indicated that their organization implements activities and practices that support a diverse workplace, a slight increase from 2017 (76%).
For more information, consult the results of the 2018 Public Service Employee Survey.
2018 Student Exit Survey
The Student Exit Survey was developed to:
- inform recruitment and onboarding strategies
- contribute to improvements to the student application process
- lead to enhancements of student work assignments
The survey was conducted between and , and included questions related to different stages of the student work term, such as:
- the application process
- onboarding
- the workplace
- the quality of work
Sixty-five organizations participated in the survey, yielding over 6,515 completed surveys. More than half of survey respondents (57%) reported that their first student work term was in summer 2018. A similar proportion (54%) indicated that they were hired through FSWEP (the Federal Student Work Experience Program).
Overall, the results of the Student Exit Survey were quite positive and similar to those of 2017:
- nine out of ten students (90%) agreed that, overall, they had a positive work experience
- almost all students reported that they were treated as part of the team (92%) or that they attended regular team meetings (86%)
- three out of four students (76%) indicated that work assigned to them was interesting
- the majority of students (82%) felt that they had gained an understanding of how government works
- three out of four students (76%) indicated that they would seek a career in the federal public service, and 82% would recommend a public service career to other students
However, similar to results in 2017, students were less positive about certain aspects of their work or work conditions:
- almost one in four students (23%) believed that they were given too little work
- more than half of survey respondents (54%) were impacted by pay issues related to Phoenix, and 49% of the impacted students were satisfied with the support they received from their department or agency to help resolve their pay issues
Students were asked to identify the top three most and least important factors in choosing future employment after completing education. The three most important factors were:
- interesting work (47%)
- competitive wages (41%)
- opportunity to work in their field of study (41%)
The three least important factors selected were:
- job location (40%)
- flexible work arrangements (31%)
- flexibility to work in different areas of the organization (35%)
Students were asked the extent to which they agreed with the following statements about the federal public service:
- 9 out of 10 students (88%) agreed that “the federal public service has excellent benefits and pension plan”
- 45% of respondents agreed that “the federal public service has efficient business processes”
© Her Majesty the Queen in Right of Canada, represented by the President of the Treasury Board, 2019,
ISSN: 2561-6838