
Demographic Snapshot of Canada’s Public Service, 2019
Preamble
This snapshot provides key demographics for Canada’s federal public service and supplements the Clerk of the Privy Council’s Twenty-Seventh Annual Report to the Prime Minister on the Public Service of Canada.
The Office of the Chief Human Resources Officer (OCHRO) works in partnership with departments and agencies to access, analyze, and share federal public service workforce data to identify current workforce trends. In the coming year, the public service will aim to recruit and equip the next generation of federal public servants to carry out the Government of Canada’s priorities.
On this page
Introduction
This snapshot compares the current workforce with that of the baseline year of 2010. The data in this snapshot is current as of March 31, 2019, unless indicated otherwise.
Part 1 of this document covers all employees of the entire federal public service (the core public administration and the separate agencies), and Part 2 focuses on executives. Part 3 provides highlights from the 2019 Public Service Employee Survey and the 2019 Student Exit Survey.
Canada’s federal public service consists of two population segments:
- the core public administration and
- separate agencies.
The term “core public administration” refers to approximately 70 departments and agencies for which the Treasury Board is the employer. These organizations are listed in Schedules I and IV of the Financial Administration Act.
The term “separate agencies” refers to agencies listed in Schedule V of the act. Separate agencies conduct their own negotiations and may set their own classification system and compensation levels for their employees.
The principal separate agencies are:
- Canada Revenue Agency;
- Parks Canada;
- Canadian Food Inspection Agency; and
- National Research Council Canada.
Population counts for the following separate agencies are not included because their employee information is not available in the pay system:
- Canadian Security Intelligence Service;
- National Capital Commission;
- Canada Investment and Savings; and
- Canadian Forces Non‑Public Funds.
The federal public service does not include:
- ministers’ exempt staff;
- employees locally engaged outside Canada;
- RCMP regular force members;
- RCMP civilian force members; and
- Canadian Armed Forces members.
Highlights from 2019
In this section
1. Number of employees
- 287,978 active employees (282,980 in 2010)
- Represents 0.76% of the Canadian population (0.83% in 2010)
2. Location
- 57.9% of employees are in the regionsFootnote 1 (59.4% in 2010)
- 42.1% are in the National Capital Region (40.6% in 2010)
3. Employment status
- 83.2% are indeterminate employees (86.1% in 2010)
- 10.8% are term employees (9.1% in 2010)
- 6.0% are casuals and students (4.8% in 2010)
4. Women
- 55.3% of employees are women (55.2% in 2010)
- 49.4% of executives are women (43.7% in 2010)
5. Official languages
- 70.9% of employees indicated English as their first official language (71.0% in 2010)
- 29.1% indicated French as their first official language (29.0% in 2010)
6. Age
- Average age of employees: 44.2 years (43.9 years in 2010)
- Average age of executives: 50.0 years (50.1 years in 2010)
Part 1: federal public service
In this section
Relative size and spending
Between 2010 and 2019:
- the population of Canada grew from approximately 34.1 million to 37.8 million (an increase of 10.7%)Footnote 2; and
- the number of federal public servants increased from 282,980 to 287,978 (an increase of 1.8%).Footnote 3
The federal public service comprised 0.76% of the Canadian population in 2019. This is well below the ratios in the 1980s and early 1990s, which were very close to 1% and slightly higher than 0.83% in 2010.
Between 2010 and 2019:
- Canada’s real gross domestic product increased by 21.7%Footnote 4; and
- real federal program spending increased by 11.5% (in constant dollars).Footnote 5
Most recently, from the 2017 to 2018 fiscal year to the 2018 to 2019 fiscal year, there was:
- an increase of 1.9% in real gross domestic product; and
- an increase of 2.4% in real federal program spending.
Since the 2010 to 2015 period, where the workforce decreased in response to budget reductions, there has been an increase in the federal public service workforce.
Figure 1 shows trends in the economy, the Canadian population, real federal program spending and the size of the federal public service, from 2010 to 2019.
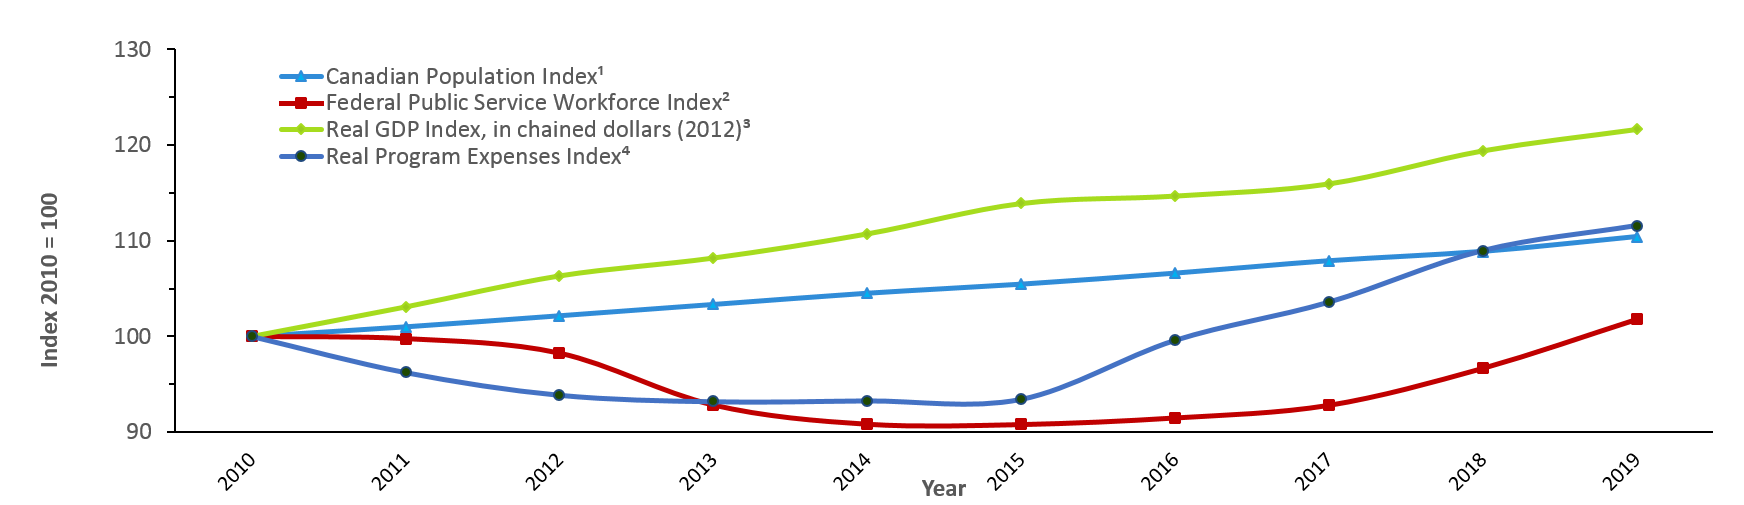
Figure 1 - Text version
| Year | Canadian Population Indextable 1 note 1 | Federal Public Service Workforce Indextable 1 note 2 | Real GDP Indextable 1 note 3, in chained dollars (2012) | Real Program Expenses Indextable 1 note 4, (in 2002 dollars) |
|---|---|---|---|---|
| 2010 | 100 | 100 | 100 | 100 |
| 2011 | 101 | 100 | 103 | 96 |
| 2012 | 102 | 98 | 106 | 94 |
| 2013 | 103 | 93 | 108 | 93 |
| 2014 | 104 | 91 | 111 | 93 |
| 2015 | 105 | 91 | 114 | 93 |
| 2016 | 107 | 92 | 115 | 100 |
| 2017 | 108 | 93 | 116 | 104 |
| 2018 | 109 | 97 | 119 | 109 |
| 2019 | 110 | 102 | 122 | 112 |
Table 1 Notes
|
||||
Sources: Office of the Chief Human Resources Officer, Treasury Board of Canada Secretariat; Statistics Canada; Department of Finance Canada (Fiscal Reference Tables).
- Based on data as of April 1 for each year.
- Based on active employees only and on data as of March 31 for each year.
- Based on calendar year data.
- Based on fiscal year data. Real program expenses include transfers and were deflated using the Consumer Price Index.
Diversity in the federal public service
Gender
As shown in Figure 2, in 2019, women made up 55.3% of the federal public service, a 0.1% increase from 2010. It is also a considerable increase (32.2%) from 1990.
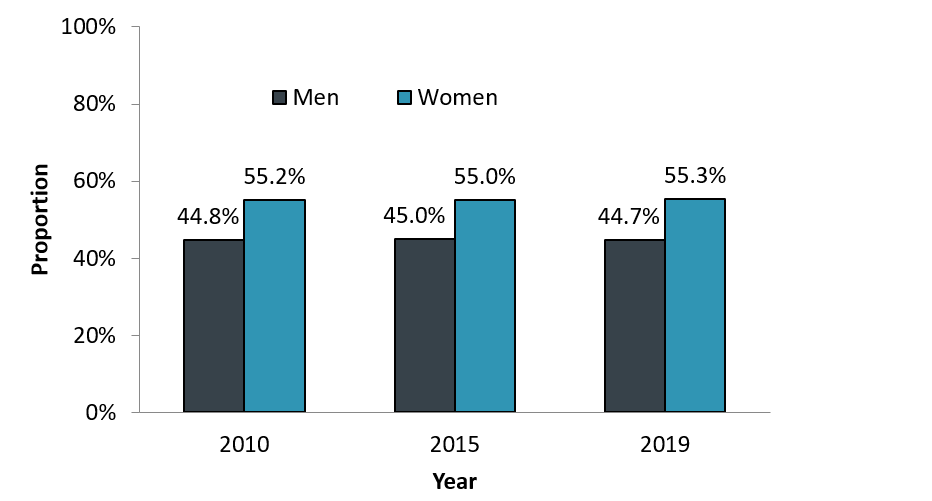
Figure 2 - Text version
| Gender | 2010 | 2015 | 2019 |
|---|---|---|---|
| Women | 55.2% | 55.0% | 55.3% |
| Men | 44.8% | 45.0% | 44.7% |
Source: Office of the Chief Human Resources Officer, Treasury Board of Canada Secretariat.
Notes
Population: Includes all employment tenures and does not include employees on leave without pay.
The information provided excludes employees of unknown gender and is based on data as of March 31.
First official language
As shown in Figure 3, the breakdown of federal public servants by first official language in 2019 is almost the same as it was in 2010 and 2015.
Figure 3 - Text version
| Language | 2010 | 2015 | 2019 |
|---|---|---|---|
| English | 71.0% | 71.3% | 70.9% |
| French | 29.0% | 28.7% | 29.1% |
Source: Office of the Chief Human Resources Officer, Treasury Board of Canada Secretariat.
Notes
Population: Includes all employment tenures and active employees only (employees on leave without pay are excluded).
The information provided excludes employees of unknown first official language and is based on data as of March 31.
Age of federal public servants
Figure 4 compares the breakdown of federal public servants in 2010, 2015 and 2019 by age. From 2010 to 2019, the age breakdown changed slightly, with:
- decreases in the proportion of employees aged 25 to 34 and those aged 45 to 54; and
- increases in the proportion of employees aged 20 to 24, 35 to 44 and those above the age of 55.
The average age of federal public servants increased slightly, from 43.9 years in 2010, to 45.0 years in 2015, to 44.2 years in 2019.
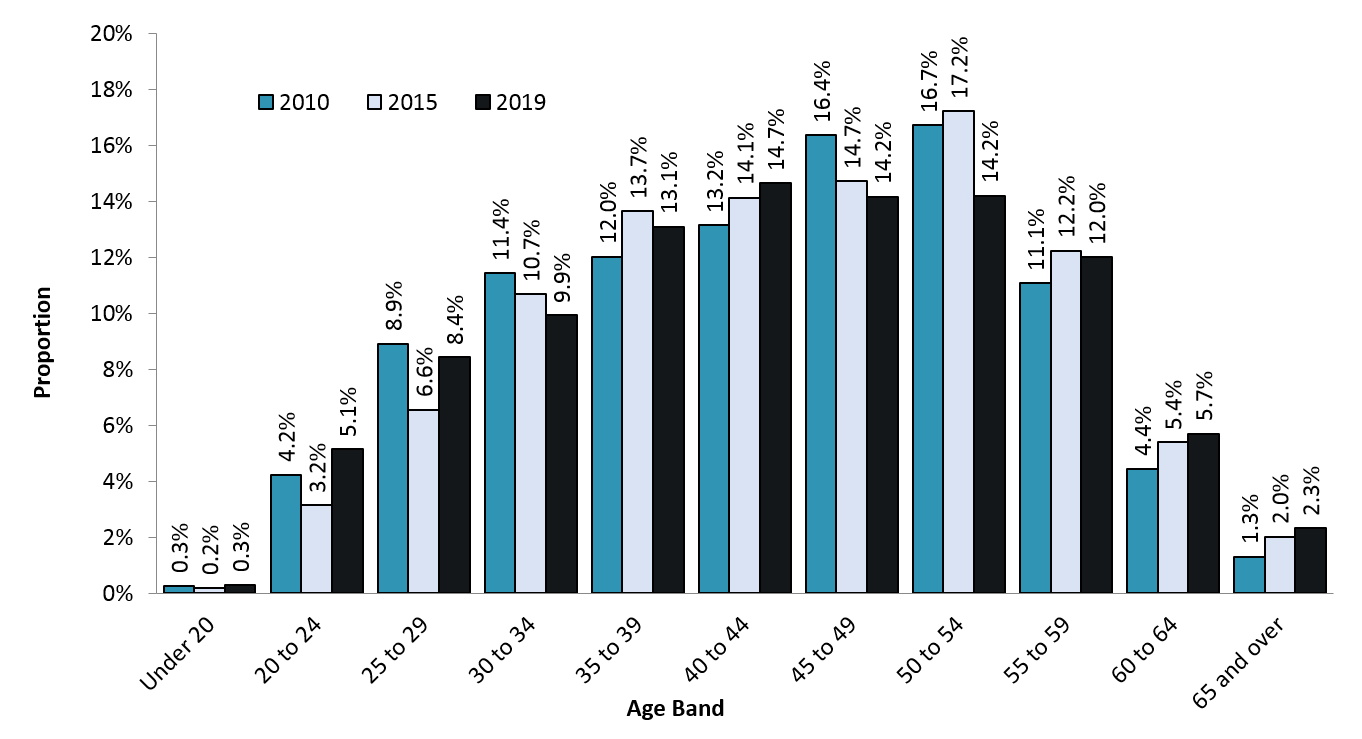
Figure 4 - Text version
| Age band | 2010 | 2015 | 2019 |
|---|---|---|---|
| Under 20 | 0.3% | 0.2% | 0.3% |
| 20 to 24 | 4.2% | 3.2% | 5.1% |
| 25 to 29 | 8.9% | 6.6% | 8.4% |
| 30 to 34 | 11.4% | 10.7% | 9.9% |
| 35 to 39 | 12.0% | 13.7% | 13.1% |
| 40 to 44 | 13.2% | 14.1% | 14.7% |
| 45 to 49 | 16.4% | 14.7% | 14.2% |
| 50 to 54 | 16.7% | 17.2% | 14.2% |
| 55 to 59 | 11.1% | 12.2% | 12.0% |
| 60 to 64 | 4.4% | 5.4% | 5.7% |
| 65 and over | 1.3% | 2.0% | 2.3% |
Source: Office of the Chief Human Resources Officer, Treasury Board of Canada Secretariat.
Notes
Population: Includes all employment tenures and active employees only (employees on leave without pay are excluded).
The information provided excludes employees of unknown age and is based on data as of March 31.
Figure 5 shows the distribution of federal public servants by generation for 2010, 2015 and 2019. Up until 2015, baby boomers (people born between 1946 and 1966) made up the largest group of federal public servants; however, they are being replaced by Generation Xers (people born between 1967 and 1979) and millennials (people born after 1979). Generation Xers now represent the largest group of public servants (37.1%) followed by Millennials (34.7%).
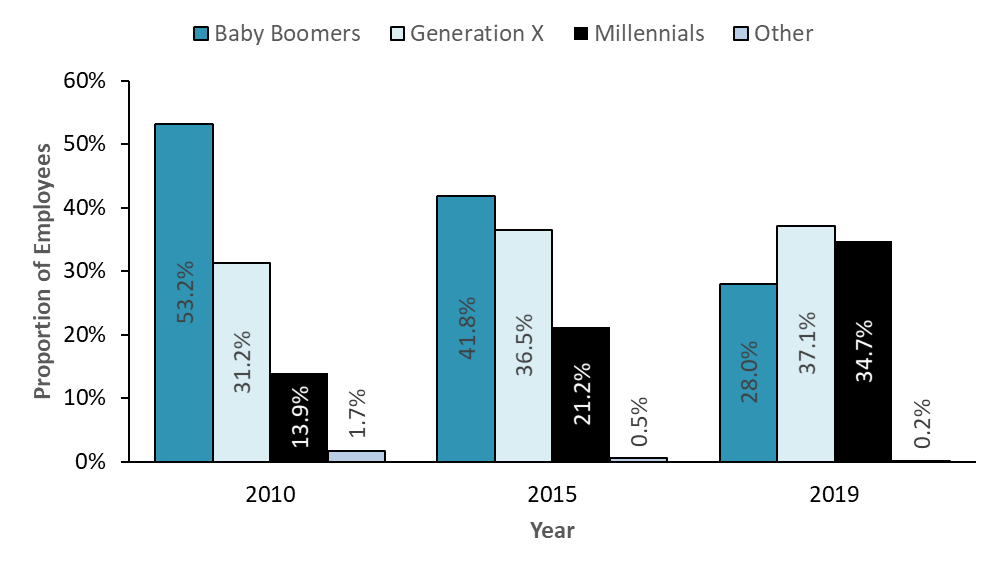
Figure 5 - Text version
| Year | Number of employees | Baby Boomers | Generation X | Millennials | Other |
|---|---|---|---|---|---|
| 2010 | 282,978 | 53.2% | 31.2% | 13.9% | 1.7% |
| 2015 | 257,033 | 41.8% | 36.5% | 21.2% | 0.5% |
| 2019 | 287,977 | 28.0% | 37.1% | 34.7% | 0.2% |
Source: Office of the Chief Human Resources Officer, Treasury Board of Canada Secretariat.
Notes
Population: Includes all employment tenures and active employees only (employees on leave without pay are excluded).
The information provided is based on data as of March 31.
Hiring into the core public administration
Figure 6 shows new indeterminate hiring in the core public administration over time. Indeterminate hiring has been on the rise since the 2012 to 2013 fiscal year. New indeterminate hiring in the core public administration increased by 30.5%, from 14,749 in the 2017 to 2018 fiscal year to 19,245 in the 2018 to 2019 fiscal year.
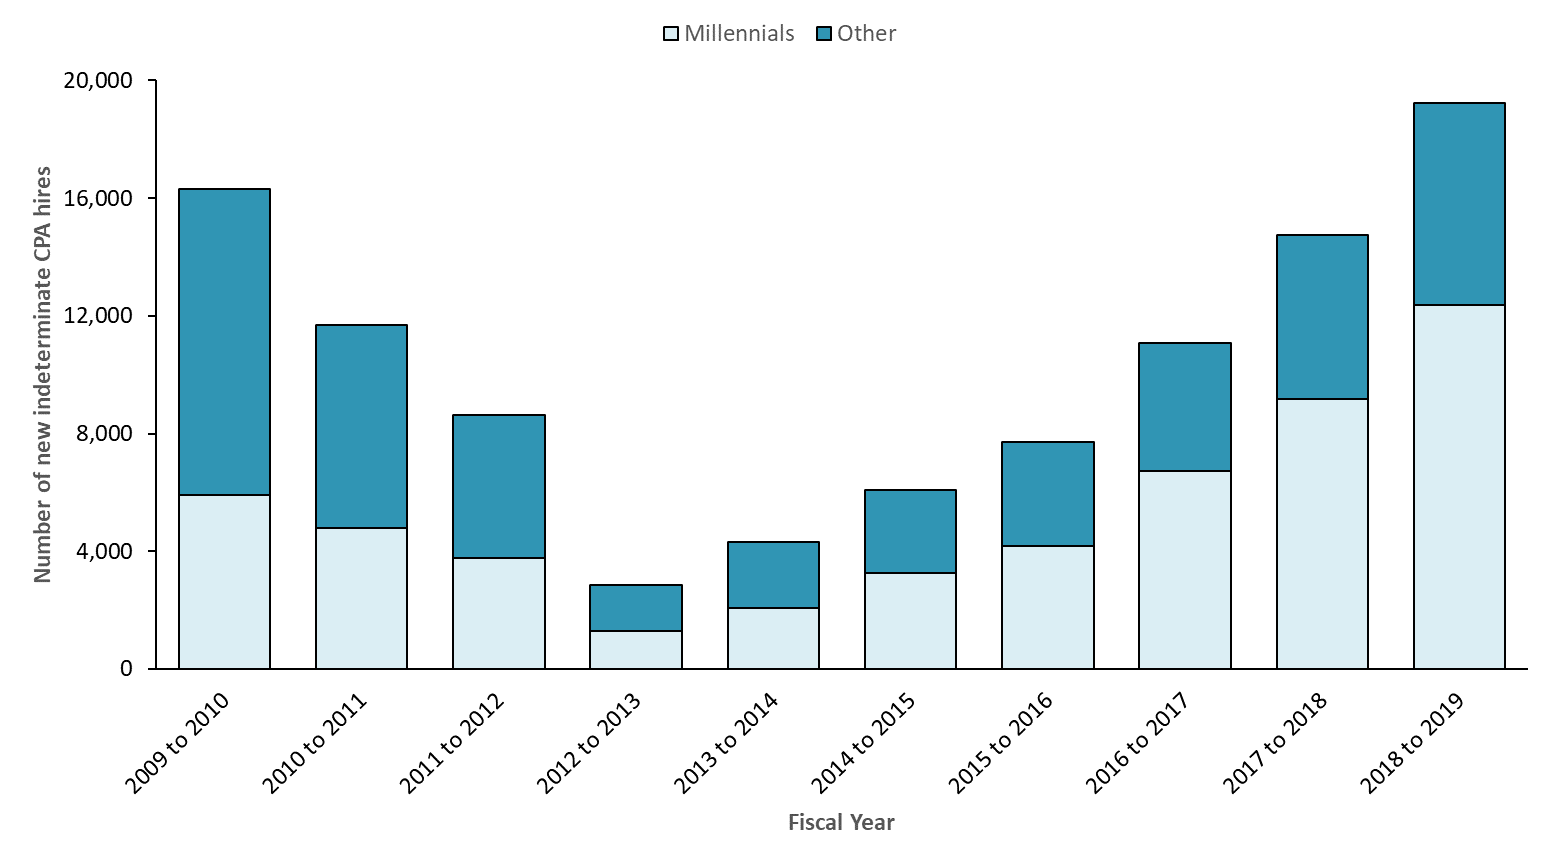
Figure 6 - Text version
| Fiscal Year | Number of new indeterminate CPA hires | Millennials | Other |
|---|---|---|---|
| 2009 to 2010 | 16,304 | 5,921 | 10,383 |
| 2010 to 2011 | 11,677 | 4,775 | 6,902 |
| 2011 to 2012 | 8,642 | 3,775 | 4,867 |
| 2012 to 2013 | 2,865 | 1,284 | 1,581 |
| 2013 to 2014 | 4,315 | 2,060 | 2,255 |
| 2014 to 2015 | 6,093 | 3,274 | 2,819 |
| 2015 to 2016 | 7,698 | 4,168 | 3,530 |
| 2016 to 2017 | 11,085 | 6,712 | 4,373 |
| 2017 to 2018 | 14,749 | 9,169 | 5,580 |
| 2018 to 2019 | 19,245 | 12,381 | 6,864 |
Source: Office of the Chief Human Resources Officer, Treasury Board of Canada Secretariat.
The hiring of new indeterminate employees who are millennials increased by 2.2% (from 62.2% in the 2017 to 2018 fiscal year to 64.3% in the 2018 to 2019 fiscal year). During this same period:
- the hiring of new indeterminate employees from the baby boomer generation decreased from 11.5% to 10.1%; and
- the hiring of those who are Generation Xers decreased slightly from 26.3% to 25.5%.Footnote 6
Figure 7 shows the entire age distribution of new indeterminate hires in the core public administration. The median age was 33.6 years.
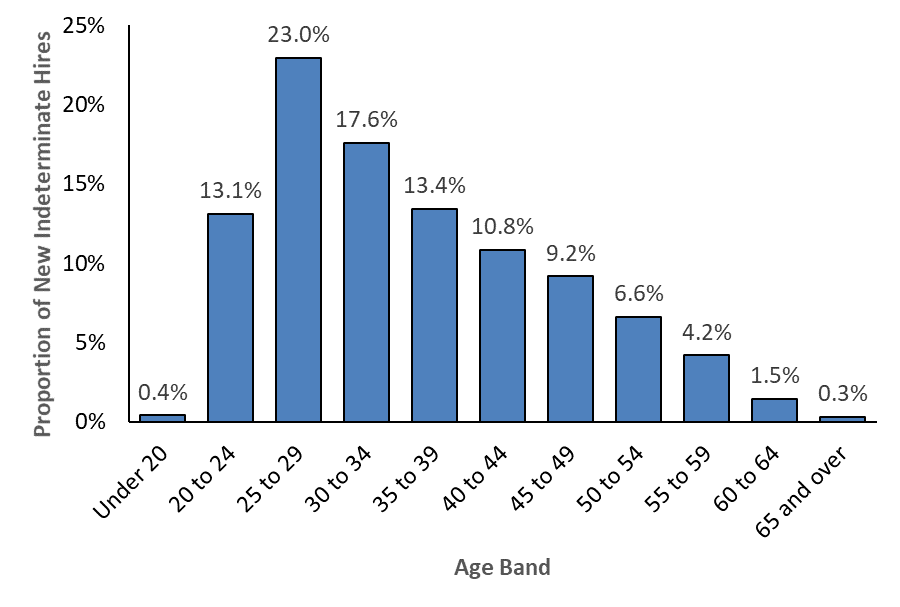
Figure 7 - Text version
| Age band | Percentage of new indeterminate CPA hires |
|---|---|
| Under 20 | 0.4% |
| 20 to 24 | 13.1% |
| 25 to 29 | 23.0% |
| 30 to 34 | 17.6% |
| 35 to 39 | 13.4% |
| 40 to 44 | 10.8% |
| 45 to 49 | 9.2% |
| 50 to 54 | 6.6% |
| 55 to 59 | 4.2% |
| 60 to 64 | 1.5% |
| 65 and over | 0.3% |
Source: Office of the Chief Human Resources Officer, Treasury Board of Canada Secretariat.
Departures from the federal public service
As shown in Figure 8, in the 2018 to 2019 fiscal year, retirements, resignations and all other reasons made up 3.2%, 0.6%, and 0.5% of departures from the federal public service, respectively.
Since the 2012 to 2014 period, where the number of departures from the federal public service increased in response to budget reductions, there has been a steady decrease of such departures from the federal public service workforce.
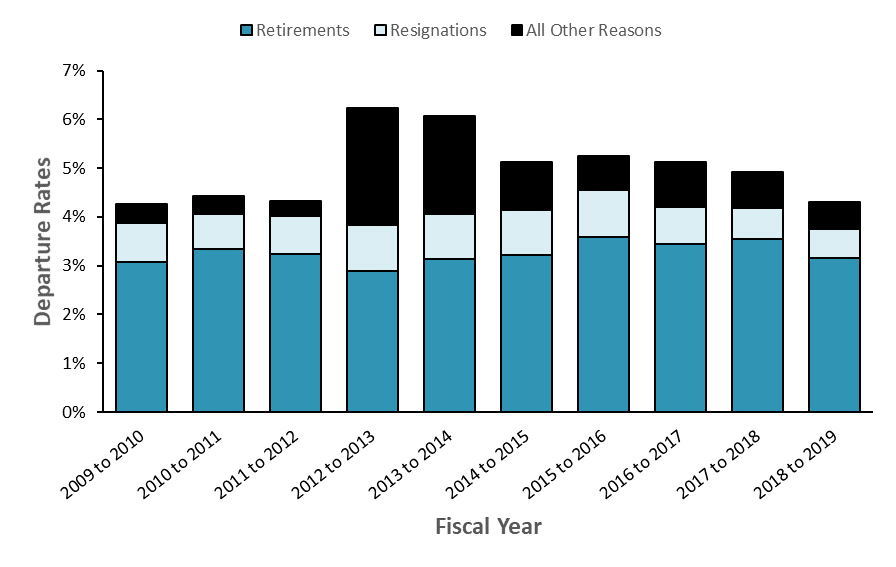
Figure 8 - Text version
| Fiscal Year | Retirements | Resignations | All Other Reasons |
|---|---|---|---|
| 2009 to 2010 | 3.1% | 0.8% | 0.4% |
| 2010 to 2011 | 3.3% | 0.7% | 0.4% |
| 2011 to 2012 | 3.2% | 0.8% | 0.3% |
| 2012 to 2013 | 2.9% | 0.9% | 2.4% |
| 2013 to 2014 | 3.1% | 0.9% | 2.0% |
| 2014 to 2015 | 3.2% | 0.9% | 1.0% |
| 2015 to 2016 | 3.6% | 1.0% | 0.7% |
| 2016 to 2017 | 3.4% | 0.8% | 0.9% |
| 2017 to 2018 | 3.5% | 0.6% | 0.7% |
| 2018 to 2019 | 3.2% | 0.6% | 0.5% |
Source: Office of the Chief Human Resources Officer, Treasury Board of Canada Secretariat.
Notes
Population: Indeterminate federal public servants, including employees who retire while on leave without pay.
Knowledge-intensive workforce in the core public administration
In 1990, the public service workforce was composed mainly of clerical and operational workers. Since then, employees undertaking more knowledge-intensive work comprise an ever-increasing share of employees in the core public administration. The cadre of knowledge workers is highly skilled, with significant expertise gained through a combination of education, training and experience. The transformation in work has been in response to:
- an increasingly demanding environment;
- new challenges; and
- technological advances since 2000.
As shown in Figure 9, the five largest knowledge-intensive occupational groups in the core public administration are:
- Administrative Services (AS);
- Program Administration (PM);
- Computer Systems (CS);
- Economics and Social Science Services (EC); and
- Engineering and Scientific Support (EG).
In 2019, these occupational groups represented 44.8% of the core public administration workforce; in 2010, they represented only 40.7%.
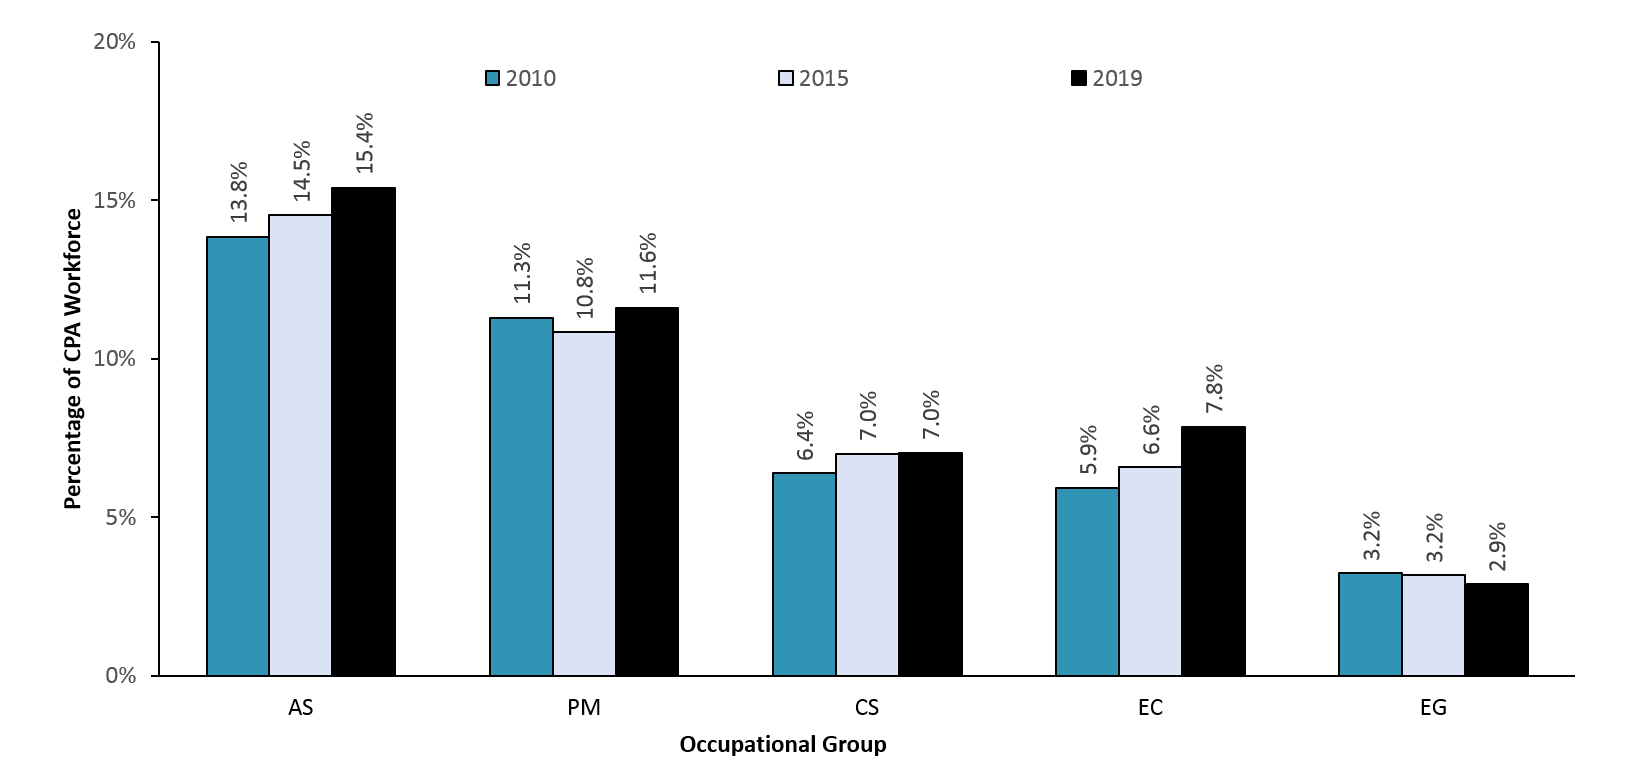
Figure 9 - Text version
| Occupational group | 2010 | 2015 | 2019 |
|---|---|---|---|
| AS | 13.8% | 14.5% | 15.4% |
| PM | 11.3% | 10.8% | 11.6% |
| CS | 6.4% | 7.0% | 7.0% |
| EC | 5.9% | 6.6% | 7.8% |
| EG | 3.2% | 3.2% | 2.9% |
Source: Office of the Chief Human Resources Officer, Treasury Board of Canada Secretariat.
Notes
Population: Includes all employment tenures and active employees only (employees on leave without pay are excluded), based on effective employment classification (acting appointments are included).
The information provided is based on data as of March 31.
On June 22, 2009, the Economics, Sociology and Statistics (ES) and the Social Science Support (SI) occupational groups were combined to form the Economics and Social Science Services (EC) occupational group.
Part 2: executives
In this section
This section provides demographic information about the federal public service’s Executive group.
Typically, assistant deputy ministers (classified as EX-04 and EX-05) fulfill senior leadership functions, providing strategic direction and oversight. Directors, executive directors and directors general (classified from EX-01 to EX-03) fulfill executive functions and are responsible for managing employees.
Population size of Executive group
As of March 31, 2019, there were 7,070 executives in the federal public service:
- about half of them (50.6%) were EX-01s
- only 6.5% were EX-04s and EX-05s
Between 2010 and 2019, the federal public service executive workforce grew by 1.8%, while the executive population grew by 4.4% over this same period.
Executive diversity
First official language of executives
As shown in Figure 10, between 2010 and 2019, the proportion of executives in the federal public service who indicated that French is their first official language increased from 30.1% to 32.7%. Similarly, for the overall federal public service, the comparable figures show a slight increase, with 29.0% and 29.1%, respectively.
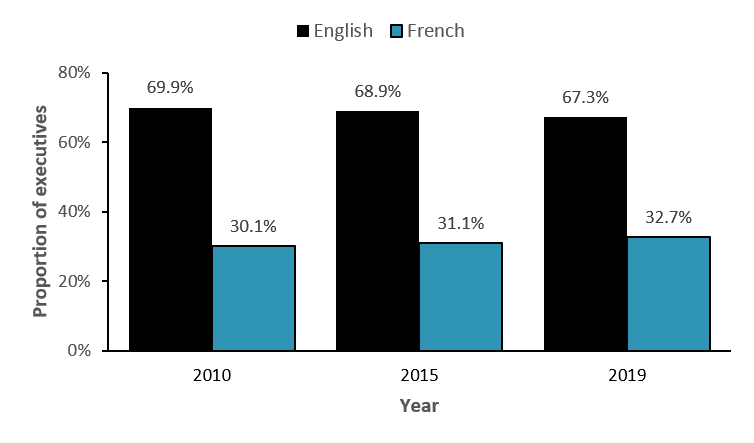
Figure 10 - Text version
| Year | English | French |
|---|---|---|
| 2010 | 69.9% | 30.1% |
| 2015 | 68.9% | 31.1% |
| 2019 | 67.3% | 32.7% |
Source: Office of the Chief Human Resources Officer, Treasury Board of Canada Secretariat.
Notes
Population: Includes all federal public service executives, specifically, core public administration executives and their equivalents in separate agencies (such as Executive group (EX) and Management group (MG) classifications) in all tenures (indeterminate, term and casual). It does not include executives on leave without pay or those whose data on first official language is missing.
The information provided is based on data as of March 31.
Age of executives in federal public service
Figure 11 shows the age breakdown of federal public service executives for 2010, 2015 and 2019. The proportion of executives between 40 and 49 years of age has increased between 2010 and 2019 while the proportion of executives aged 39 and under and between 50 and 64 years of age has decreased.
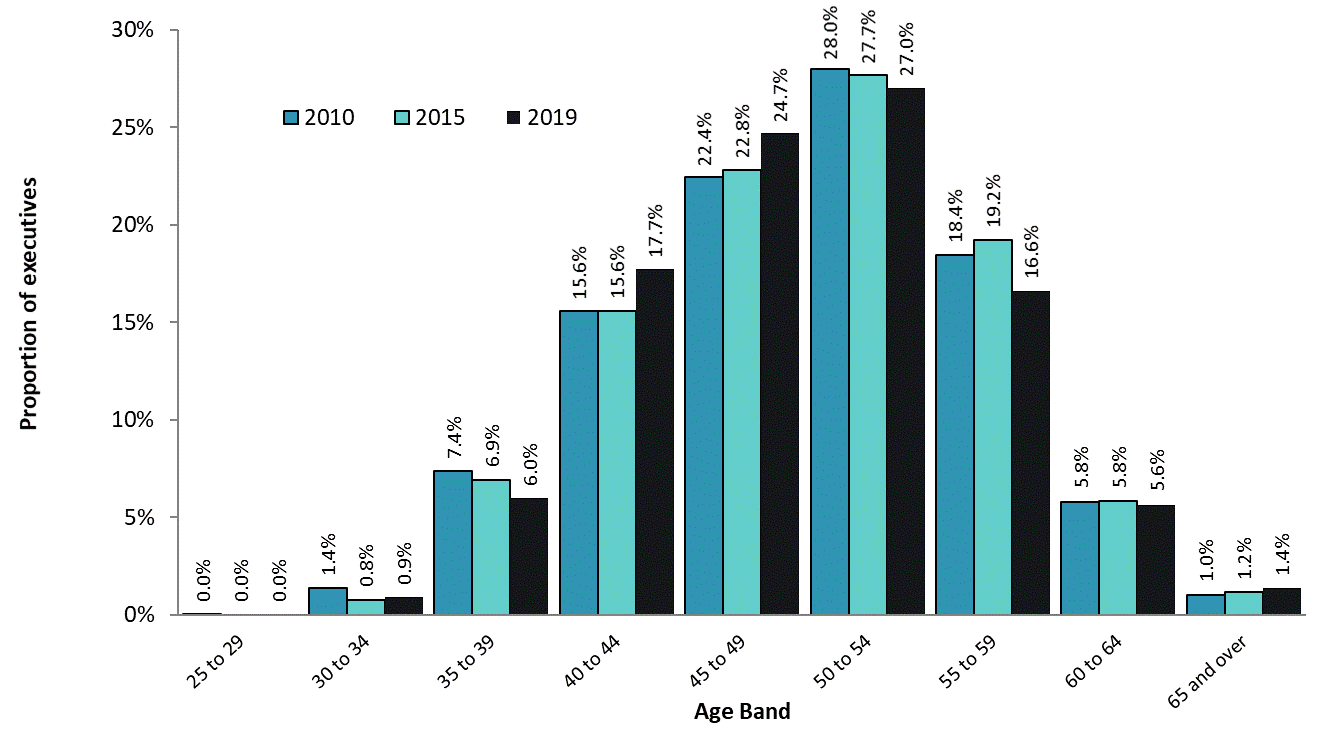
Figure 11 - Text version
| Age Band | 2010 | 2015 | 2019 |
|---|---|---|---|
| 25 to 29 | 0.0% | 0.0% | 0.0% |
| 30 to 34 | 1.4% | 0.8% | 0.9% |
| 35 to 39 | 7.4% | 6.9% | 6.0% |
| 40 to 44 | 15.6% | 15.6% | 17.7% |
| 45 to 49 | 22.4% | 22.8% | 24.7% |
| 50 to 54 | 28.0% | 27.7% | 27.0% |
| 55 to 59 | 18.4% | 19.2% | 16.6% |
| 60 to 64 | 5.8% | 5.8% | 5.6% |
| 65 and over | 1.0% | 1.2% | 1.4% |
Source: Office of the Chief Human Resources Officer, Treasury Board of Canada Secretariat.
Notes
Population: Includes all federal public service executives, specifically, core public administration executives and their equivalents in separate agencies (such as Executive group (EX) and Management group (MG) classifications) in all tenures (indeterminate, term and casual). It does not include executives on leave without pay.
The information provided is based on data as of March 31.
Figure 12 shows that between 2010 and 2019:
- the average age of junior executives at the EX-01 to EX-03 levels in the federal public service remained stable at approximately 50 years of age;
- the average age of senior executives at the EX-04 and EX-05 levels hovered between 53 and 54 years of age; and
- the average age of non-executives hovered between 44 and 45 years of age.
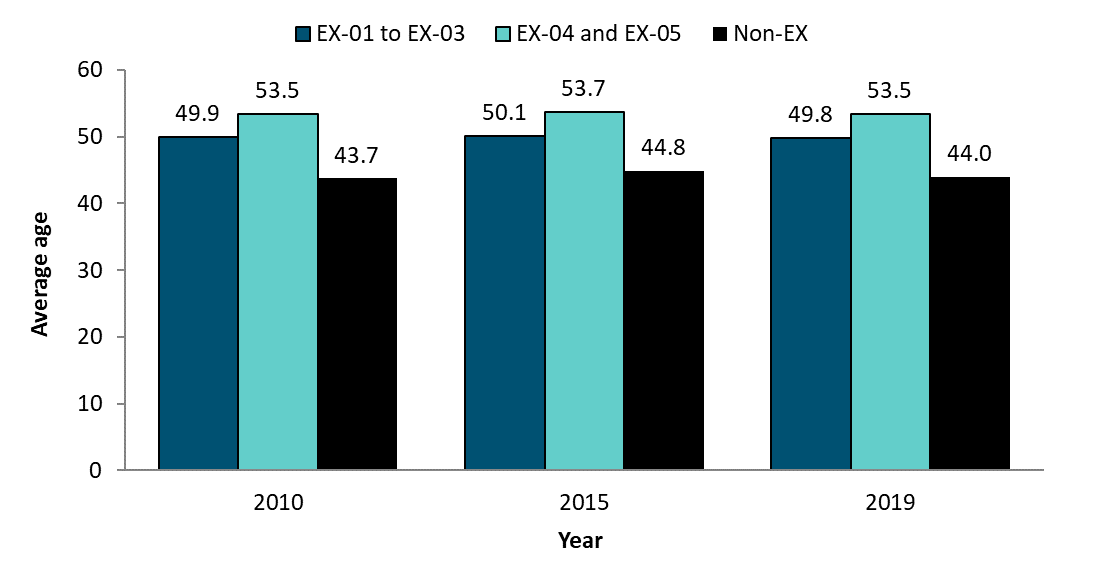
Figure 12 - Text version
| Year | EX‑01 to EX‑03 | EX‑04 and EX‑05 | Non‑EX |
|---|---|---|---|
| 2010 | 49.9 years | 53.5 years | 43.7 years |
| 2015 | 50.1 years | 53.7 years | 44.8 years |
| 2019 | 49.8 years | 53.5 years | 44.0 years |
Source: Office of the Chief Human Resources Officer, Treasury Board of Canada Secretariat.
Notes
Population: Includes all federal public service executives, specifically, core public administration executives and their equivalents in separate agencies (such as Executive group (EX) and Management group (MG) classifications) in all tenures (indeterminate, term and casual). The population does not include executives on leave without pay.
The information provided is based on data as of March 31.
Part 3: highlights from employee surveys
-
In this section
2019 Public Service Employee Survey
Since 1999, the Public Service Employee Survey (PSES) has been conducted every three years. The Office of the Chief Human Resources Office (OCHRO) of the Treasury Board of Canada Secretariat (TBS) transitioned from the triennial survey to an annual survey in 2018 to enable departments and agencies to measure and track progress more frequently. The annual PSES contains:
- core questions that are repeated every year;
- questions that are inserted on a rotational basis;
- questions related to current and emerging government priorities; and
- organization-specific questions.
The 2019 PSES was developed by OCHRO and conducted from July 22 to September 6.
A total of 182,306 employees in 86 federal departments and agencies responded to the 2019 PSES, for a response rate of 62.3%.
Overall, results for the 2019 PSES were more positive than those for the 2018 survey.
Results show that employees are engaged in their work: 81% of employees indicated that they like their job, which is similar to the results for the 2018 PSES.
Perceptions of senior management are more positive than what was found in the 2018 results. In 2019, 62% of employees indicated they have confidence in senior management (58% in 2018).
Employees feel more positive about support for their career development and their opportunities for promotion:
- 57% of employees felt that their organization does a good job of supporting employee career development, an increase from 2018 (53%);
- 52% of employees believe that they have opportunities for promotion within their department or agency, given their education, skills and experience, an increase from 2018 (48%).
Fourteen percent of employees reported harassment on the job in the past 12 months, and 8% of employees reported discrimination on the job in the past 12 months.
Improvements have been observed regarding the resolution of Pay system issues, however, it remains one of the top stressors for employees. Seventy-four percent of employees have been affected by issues with the pay system, which is higher than the result in 2018 (70%) and only 39% of those affected are satisfied with the support they receive from their department to resolve these issues.
Most employees believe that their workplace is respectful, and the results relating to many aspects of respect in the workplace were slightly better than they were in 2018. Eighty-two percent of employees indicated that in their work unit, individuals behave in a respectful manner, slightly higher than 2018 (81%).
Results about psychological health in the workplace were more positive than in 2018, with 73% of employees indicating that their organization does a good job of raising awareness of mental health in the workplace, up from 71% in 2018. Also, 61% of employees described their workplace as being psychologically healthy, an improvement from 2018 (59%).
The results on diversity and inclusion have remained relatively stable compared to 2018, as 78% of employees indicated that their organization implements activities and practices that support a diverse workplace, a result similar to 2018 (78%).
A question regarding change management was included in the 2019 PSES. Fifty percent of respondents indicated that they feel change is managed well in their department or agency. A new question was also added asking respondents about career progress barriers. Twenty percent of respondents indicated that lack of opportunities in their region adversely affected their career progress in the public service over the last 12 months.
For more information, consult the results of the 2019 Public Service Employee Survey.
2019 Student Exit Survey
The Student Exit Survey (SES) is led by the Office of the Chief Human Resources Officer (OCHRO) and has been conducted annually since 2017. The SES was developed to:
- inform recruitment and onboarding strategies;
- contribute to improvements to the student application process; and
- lead to enhancements of student work assignments.
The 2019 SES was conducted from August 6 to September 6, 2019 and included questions related to different stages of the student work term, such as:
- the application process;
- onboarding;
- the workplace;
- the quality of work assignments; and
- future career plans.
Sixty-two organizations participated in the survey, yielding 5,939 completed surveys.
Results of the 2019 SES remain consistent with those of the previous years. Most students remain satisfied with various aspects of their recruitment, onboarding and work experience:
- Nine out of ten students agree that overall they had a positive work experience;
- Nine out of ten students agree that they were treated as part of the team; and
- More than four out of five students agree that they were encouraged to take initiative in their work.
There are some areas of the student experience that have consistently yielded lower levels of satisfaction. Students identified the following factors as areas that could benefit from improvement:
- 50% of students would like more information about their work duties before starting the job;
- 33% would like a work plan with clear goals and tasks; and
- 32% would like more responsibilities.
A notable positive increase in perception of the public service as an employer was observed from 2018 to 2019.
- Students agreed that the federal public service (FPS):
- Has good employee morale (80%, an increase from 74%);
- Encourages innovation (63%, an increase from 58%);
- Is open to change (55%, an increase from 50%); and
- Has competitive wages compared to other sectors (70%, an increase from 65%).
When asked about a career in the federal public service, students maintained similar views over the past three years:
- 77% would seek a career in the FPS; and
- 82% would recommend a career in the FPS.
It is important that students are provided with a meaningful work experience, not only to present the federal public service as an employer of choice, but also to train and recruit strong candidates that will help shape the future of the public service.