
Population of the federal public service: monthly snapshots
On this page
About the data
When reading the table below, the following information applies:
- Source of information: Pay System as of the end of each month.
- The federal public service consists of 2 population segments: the core public administration and separate agencies.
- Departments and agencies in the core public administration are named in schedules I and IV of the Financial Administration Act. The Treasury Board is the employer of this segment of the federal public service.
- Separate agencies are named in Schedule V of the Act. As independent employers, represented separate agencies conduct their own negotiations (subject to the President of the Treasury Board’s approval of their mandates) and set terms and conditions of employment within their organizations. This includes establishing the organizational structure and classification of positions. Unrepresented separate agencies consult with TBS with respect to any new or modified terms and conditions of employment that are not established through the collective bargaining process, to ensure broad alignment with those in the core public administration.
- Included in this information are:
- active employees of all employment tenures (indeterminate, term, casual and student)
- Governor in Council appointees
- deputy ministers
- federal judges
- Excluded from this information are:
- inactive employees (i.e., employees on leave without pay)
- ministers’ exempt staff
- employees locally engaged outside of Canada
- Royal Canadian Mounted Police (RCMP) Regular Force members
- RCMP Civilian members
- Canadian Armed Forces members
- Population counts for the following separate agencies are not included because their employee information is not available in the Pay System:
- Canadian Security Intelligence Service
- National Capital Commission
- Canada Investment and Savings
- Canadian Forces Non-Public Funds
- Security Intelligence Review Committee (before 2010)
Understanding monthly population
Like any large organization, the federal public service is subject to normal workforce fluctuations throughout the year.
There are a variety of reasons why the population increases and decreases at various times in any given year, based on operational context, including the following:
- increased hiring of new graduates and employees returning from leave with income averaging in August and September
- lower student employment at the end of April, August and December, in line with typical post-secondary semester schedules
- increased student employment in the summer, as more students are available to work (reflected in the end of May, June and July monthly snapshots)
- higher population of casual employees in January, February and March and a lower population of casual employees at the end of December, as casuals can only be hired for 90 days within a calendar year
- larger Executive population in the summer and at the end of December, due to an increase in acting appointments, which are included in this data
Given these seasonal fluctuations in the workforce, comparing monthly data year over year is more reflective of total population changes than comparing different months within the same year.
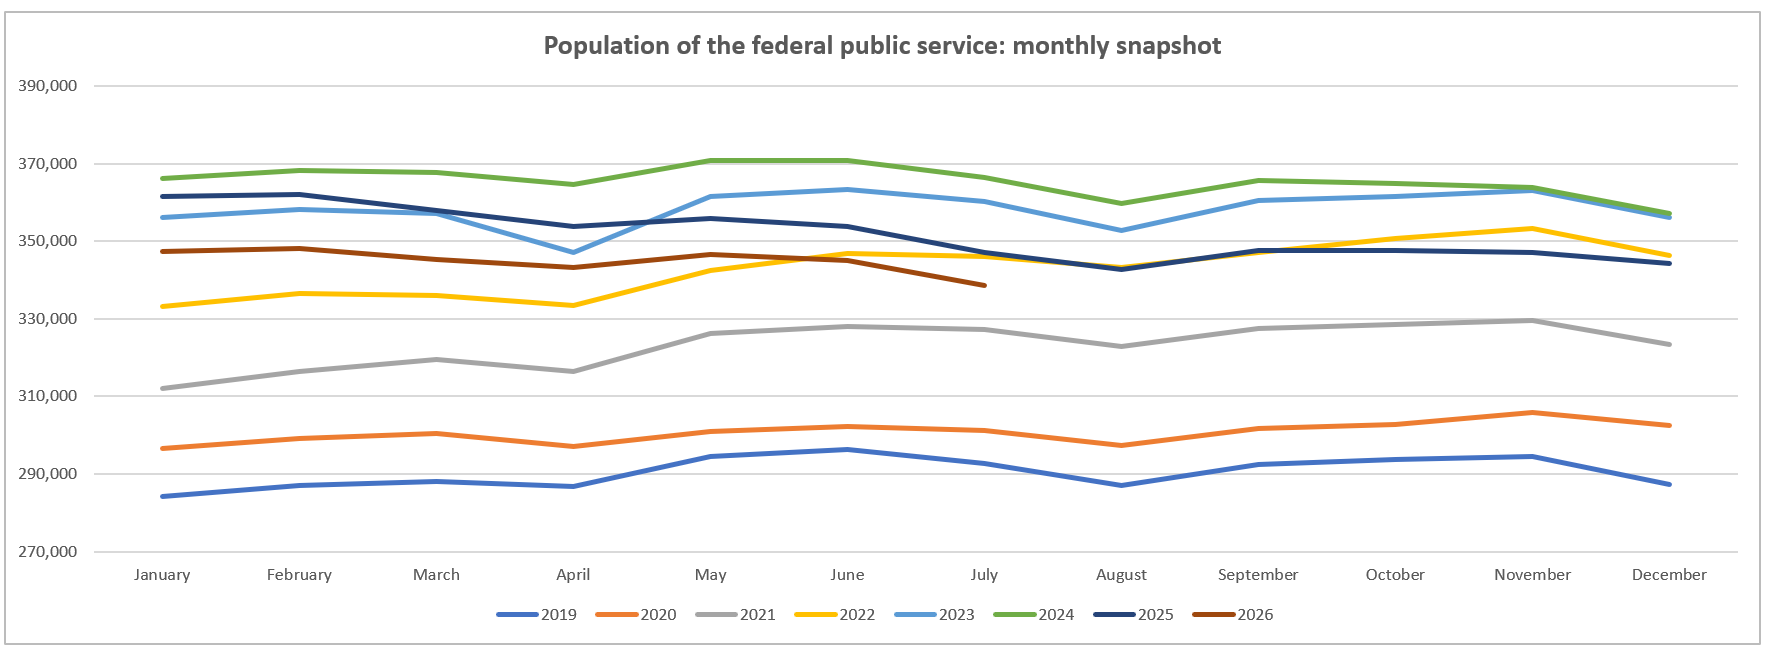
| Year | January | February | March | April | May | June | July | August | September | October | November | December |
|---|---|---|---|---|---|---|---|---|---|---|---|---|
| 2026 | 347,433 | 348,087 | 345,282 | 343,196 | 346,555 | 345,160 | 338,571 | Data unavailable | Data unavailable | Data unavailable | Data unavailable | Data unavailable |
| 2025 | 361,614 | 362,016 | 357,965 | 353,758 | 355,920 | 353,747 | 347,182 | 342,796 | 347,659 | 347,664 | 347,218 | 344,319 |
| 2024 | 366,136 | 368,264 | 367,772 | 364,578 | 370,807 | 370,965 | 366,326 | 359,707 | 365,779 | 364,895 | 364,001 | 357,207 |
| 2023 | 356,049 | 358,124 | 357,247 | 347,052 | 361,681 | 363,462 | 360,202 | 352,745 | 360,538 | 361,530 | 363,158 | 356,096 |
| 2022 | 333,180 | 336,649 | 335,957 | 333,484 | 342,365 | 346,827 | 346,086 | 343,258 | 347,012 | 350,658 | 353,353 | 346,247 |
| 2021 | 311,923 | 316,391 | 319,601 | 316,504 | 326,104 | 327,977 | 327,171 | 322,827 | 327,420 | 328,653 | 329,669 | 323,446 |
| 2020 | 296,643 | 299,055 | 300,450 | 297,013 | 301,046 | 302,203 | 301,329 | 297,444 | 301,724 | 302,860 | 305,827 | 302,408 |
| 2019 | 284,093 | 286,979 | 287,983 | 286,898 | 294,526 | 296,380 | 292,802 | 286,949 | 292,408 | 293,626 | 294,508 | 287,358 |
| Year | January | February | March | April | May | June | July | August | September | October | November | December |
|---|---|---|---|---|---|---|---|---|---|---|---|---|
| 2026 | 273,231 | 273,326 | 270,477 | 268,128 | 269,908 | 268,580 | 263,604 | Data unavailable | Data unavailable | Data unavailable | Data unavailable | Data unavailable |
| 2025 | 283,394 | 283,493 | 279,396 | 277,194 | 279,136 | 277,023 | 272,797 | 269,296 | 272,996 | 273,631 | 273,596 | 270,957 |
| 2024 | 282,018 | 283,114 | 282,152 | 279,977 | 285,450 | 285,714 | 283,093 | 277,808 | 283,036 | 283,958 | 284,093 | 279,279 |
| 2023 | 270,608 | 272,255 | 270,798 | 260,883 | 273,598 | 275,208 | 273,682 | 268,185 | 274,775 | 276,923 | 280,152 | 274,093 |
| 2022 | 253,419 | 255,348 | 254,309 | 251,701 | 258,727 | 262,121 | 262,405 | 260,812 | 263,891 | 267,009 | 268,867 | 262,344 |
| 2021 | 241,277 | 243,992 | 245,739 | 241,995 | 248,385 | 249,517 | 249,437 | 246,321 | 249,884 | 250,992 | 251,174 | 245,892 |
| 2020 | 229,739 | 231,146 | 231,176 | 227,416 | 230,289 | 232,156 | 232,308 | 229,955 | 233,788 | 235,371 | 237,219 | 234,040 |
| 2019 | 218,612 | 220,318 | 220,315 | 218,817 | 223,831 | 225,392 | 224,260 | 220,020 | 224,883 | 226,929 | 227,829 | 222,067 |
| Year | January | February | March | April | May | June | July | August | September | October | November | December |
|---|---|---|---|---|---|---|---|---|---|---|---|---|
| 2026 | 74,202 | 74,761 | 74,805 | 75,068 | 76,647 | 76,580 | 74,967 | Data unavailable | Data unavailable | Data unavailable | Data unavailable | Data unavailable |
| 2025 | 78,220 | 78,523 | 78,569 | 76,564 | 76,784 | 76,724 | 74,385 | 73,500 | 74,663 | 74,033 | 73,622 | 73,362 |
| 2024 | 84,118 | 85,150 | 85,620 | 84,601 | 85,357 | 85,251 | 83,233 | 81,899 | 82,743 | 80,937 | 79,908 | 77,928 |
| 2023 | 85,441 | 85,869 | 86,449 | 86,169 | 88,083 | 88,254 | 86,520 | 84,560 | 85,763 | 84,607 | 83,006 | 82,003 |
| 2022 | 79,761 | 81,301 | 81,648 | 81,783 | 83,638 | 84,706 | 83,681 | 82,446 | 83,121 | 83,649 | 84,486 | 83,903 |
| 2021 | 70,646 | 72,399 | 73,862 | 74,509 | 77,719 | 78,460 | 77,734 | 76,506 | 77,536 | 77,661 | 78,495 | 77,554 |
| 2020 | 66,904 | 67,909 | 69,274 | 69,597 | 70,757 | 70,047 | 69,021 | 67,489 | 67,936 | 67,489 | 68,608 | 68,368 |
| 2019 | 65,481 | 66,661 | 67,668 | 68,081 | 70,695 | 70,988 | 68,542 | 66,929 | 67,525 | 66,697 | 66,679 | 65,291 |
Open datasets
This information is published in HTML, XML and CSV formats and is part of the government’s Open Data Portal. The portal offers machine-readable formats, enabling citizens, private sector and non-government organizations to leverage this data in innovative and value-added ways.
For more information, review the Open Data Licence Agreement, visit the Open Data Portal or browse more datasets.
| Data file | Description |
|---|---|
| Population of the federal public service: monthly snapshots | These data present population counts for the federal public service (all departments and agencies governed by the Financial Administration Act (FAA) Schedules I, IV and V) on a monthly basis from January 2019 to the most recent month available. |
Glossary of key terms
To assist you with your analysis of federal public service human resources data, we have compiled a glossary of key terms that are used in many of the Office of the Chief Human Resources Officer’s (OCHRO) demographic snapshots and reports. This glossary has been developed to help provide a common language across OCHRO’s demographic snapshots and reports.