
Focus on Discrimination
The Focus series is a collection of reports that present the results of the 2017 Public Service Employee Annual Survey (PSEAS), broken down by theme. Focus on Discrimination looks at results related to discrimination and examines how they relate to results for other aspects of the workplace.
On this page
Overall results
-
In this section
Incidence of discrimination
12% of employees indicated that they had been the victim of discrimination on the job in the past 2 years.
Sources of discrimination
Among employees who indicated that they had been the victim of discrimination, the majority (79%) identified individuals with authority over them as a source of discrimination.
Table 1 shows the results for the sources of discrimination experienced by employees.
| Question number | Source(s) | Resulttable 1 note * |
|---|---|---|
Table 1 Notes
|
||
| 17(a) | Co-workers | 36% |
| 17(b) | Individuals with authority over me | 79% |
| 17(c) | Individuals working for me | 4% |
| 17(d) | Individuals for whom I have custodial responsibility (for example, inmates, offenders, patients, detainees) | 4% |
| 17(e) | Individuals from other departments or agencies | 8% |
| 17(f) | Members of the public (individuals or organizations) | 9% |
Key observations
The following observations do not necessarily indicate relationships of cause and effect, but they may provide insight into some of the connections between discrimination and different aspects of the workplace.
Support for a diverse workplace
Employees who agreed that their organization supports a diverse workplace were less likely than those who disagreed to indicate that they had been the victim of discrimination on the job in the past 2 years.
Specifically, 8% of employees who agreed that their organization implements activities and practices that support a diverse workplace indicated that they had been discriminated against, compared with 44% for employees who disagreed.
Respect
Employees who felt that their organization treats them with respect were less likely than those who did not to indicate that they had experienced discrimination on the job in the past 2 years.
Specifically, 7% of employees who agreed that their organization treats them with respect indicated that they had been the victim of discrimination, compared with 36% for employees who disagreed.
Psychological health of workplace
Employees who indicated that their workplace was psychologically healthy were less likely than those who did not to indicate that they had been the victim of discrimination on the job in the past 2 years.
Specifically, only 5% of employees who described their workplace as being psychologically healthy indicated that they had been discriminated against, compared with 28% for employees who did not describe their workplace as psychologically healthy.
Support for innovation
Employees who felt they had support for being innovative were less likely than those who did not to indicate that they had experienced discrimination on the job in the past 2 years.
Specifically, 6% of employees who agreed that they would be supported if they proposed a new idea, even though it might not work, indicated that they had been discriminated against, compared with 28% for employees who did not believe they would be supported.
Harassment
Employees who experienced harassment on the job in the past 2 years were more likely than those who did not to have also experienced discrimination on the job in that period.
Specifically, 38% of employees who experienced harassment also experienced discrimination, compared with only 5% for employees who did not experience harassment.
In addition, 66% of employees who experienced discrimination also experienced harassment, compared with 16% for employees who did not experience discrimination.
Work-related stress and emotional exhaustion
Employees who experienced discrimination on the job in the past 2 years were more likely to report high levels of work-related stress and emotional exhaustion.
Specifically, 57% of employees who had been discriminated against indicated that that their work-related stress was “high” or “very high,” compared with 31% for employees who had not been discriminated against.
In addition, 57% of employees who had been discriminated against indicated that they “always / almost always” or “often” felt emotionally drained at the end of their workday, compared with 30% for employees who had not been discriminated against.
Satisfaction with organization
Employees who experienced discrimination on the job in the past 2 years tended to report lower levels of satisfaction with their organization.
Only 32% of employees who indicated that they had been discriminated against were satisfied with their department or agency, compared with 70% for employees who had not been discriminated against.
Demographic results
Results by employment equity group
Women
12% of women indicated that they had been discriminated against on the job in the past 2 years. The rate was the same for men.
Among employees who indicated that they had been discriminated against, women were more likely than men to indicate that co-workers were a source of discrimination and less likely than men to indicate that individuals from other departments or agencies and individuals for whom they have custodial responsibility were sources of discrimination.
Table 2 shows the results for sources of discrimination for women and for men.
| Question number | Source(s) | Womentable 2 note * | Mentable 2 note * |
|---|---|---|---|
Table 2 Notes
|
|||
| 17(a) | Co-workers | 39% | 33% |
| 17(b) | Individuals with authority over me | 78% | 80% |
| 17(c) | Individuals working for me | 4% | 5% |
| 17(d) | Individuals for whom I have custodial responsibility (for example, inmates, offenders, patients, detainees) | 3% | 6% |
| 17(e) | Individuals from other departments or agencies | 6% | 10% |
| 17(f) | Members of the public (individuals or organizations) | 8% | 10% |
Visible minority employees
Visible minority employees were more likely than non-visible minority employees to indicate that they had been the victim of discrimination on the job in the past 2 years (19% and 11%, respectively).
Among employees who indicated that they had been discriminated against, visible minority employees were more likely than other employees to indicate that they had been discriminated against by co‑workers or by members of the public and slightly less likely to indicate that they had been discriminated against by individuals with authority over them.
Table 3 shows the results for sources of discrimination for visible minority employees and for other employees.
| Question number | Source(s) | Visible minority employeestable 3 note * | Other employeestable 3 note * |
|---|---|---|---|
Table 3 Notes
|
|||
| 17(a) | Co-workers | 40% | 36% |
| 17(b) | Individuals with authority over me | 77% | 80% |
| 17(c) | Individuals working for me | 5% | 4% |
| 17(d) | Individuals for whom I have custodial responsibility (for example, inmates, offenders, patients, detainees) | 4% | 4% |
| 17(e) | Individuals from other departments or agencies | 8% | 8% |
| 17(f) | Members of the public (individuals or organizations) | 13% | 8% |
Aboriginal employees
Aboriginal employees were more likely than other employees to indicate that they had been the victim of discrimination on the job in the past 2 years (20% and 12%, respectively).
Among employees who indicated that they had been the victim of discrimination, Aboriginal employees were more likely than other employees to indicate that the discrimination had come from co-workers or from members of the public and less likely to indicate that the discrimination had come from individuals with authority over them.
Table 4 shows the results for sources of discrimination for Aboriginal employees and for other employees.
| Question number | Source(s) | Aboriginal employeestable 4 note * | Other employeestable 4 note * |
|---|---|---|---|
Table 4 Notes
|
|||
| 17(a) | Co-workers | 46% | 36% |
| 17(b) | Individuals with authority over me | 76% | 79% |
| 17(c) | Individuals working for me | 4% | 4% |
| 17(d) | Individuals for whom I have custodial responsibility (for example, inmates, offenders, patients, detainees) | 5% | 4% |
| 17(e) | Individuals from other departments or agencies | 10% | 8% |
| 17(f) | Members of the public (individuals or organizations) | 12% | 9% |
Employees with a disability
Employees with a disability were nearly 3 times more likely than other employees to indicate that they had been the victim of discrimination on the job in the past 2 years (32% and 11%, respectively).
Among employees who indicated that they had been the victim of discrimination, those with a disability were more likely than other employees to identify individuals with authority over them as a source of discrimination.
Table 5 shows the results for sources of discrimination for employees with a disability and for other employees.
| Question number | Source(s) | Employees with a disabilitytable 5 note * | Other employeestable 5 note * |
|---|---|---|---|
Table 5 Notes
|
|||
| 17(a) | Co-workers | 37% | 36% |
| 17(b) | Individuals with authority over me | 85% | 78% |
| 17(c) | Individuals working for me | 4% | 4% |
| 17(d) | Individuals for whom I have custodial responsibility (for example, inmates, offenders, patients, detainees) | 2% | 4% |
| 17(e) | Individuals from other departments or agencies | 9% | 8% |
| 17(f) | Members of the public (individuals or organizations) | 8% | 9% |
Age
Incidence of discrimination
Younger employees, especially those aged 24 and under, were less likely than older employees to indicate that they had been the victim of discrimination on the job in the past 2 years. Among employees aged 35 and older, the incidence of discrimination for all age groups was identical (13%).
Figure 1 shows the results for the incidence of discrimination by age.
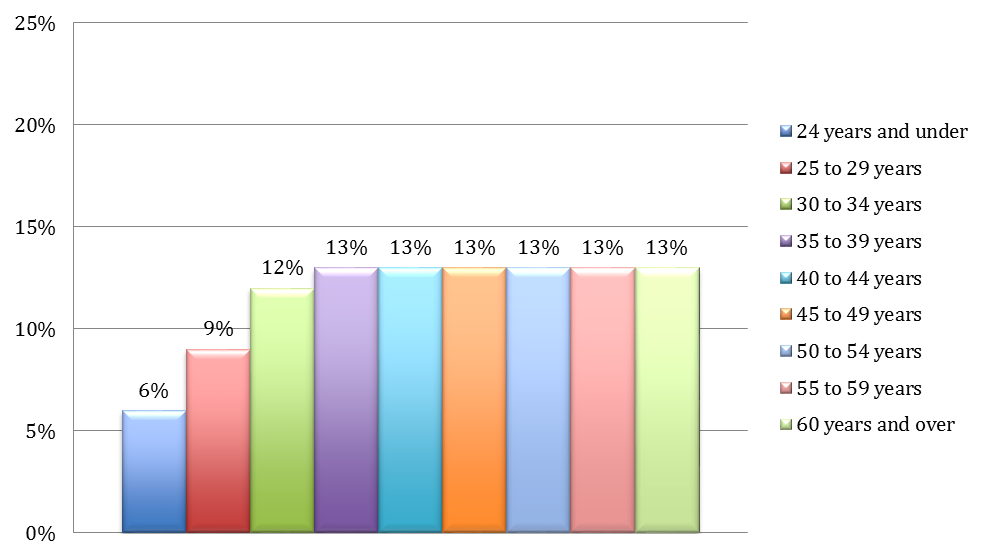
Figure 1 - Text version
| 24 years and under | 25 to 29 years | 30 to 34 years | 35 to 39 years | 40 to 44 years | 45 to 49 years | 50 to 54 years | 55 to 59 years | 60 years and over |
|---|---|---|---|---|---|---|---|---|
| 6% | 9% | 12% | 13% | 13% | 13% | 13% | 13% | 13% |
Source of discrimination
Among employees who indicated that they had been the victim of discrimination, younger employees, especially those aged 24 and under, were more likely than older employees to identify co‑workers or individuals from other departments or agencies as sources of discrimination; they were less likely than older employees to identify individuals with authority over them as a source of discrimination.
Table 6 shows the results for sources of discrimination by age.
| Question number | Source(s) | Age grouptable 6 note * | ||||||||
|---|---|---|---|---|---|---|---|---|---|---|
| 24 years and under | 25 to 29 years | 30 to 34 years | 35 to 39 years | 40 to 44 years | 45 to 49 years | 50 to 54 years | 55 to 59 years | 60 years and over | ||
Table 6 Notes
|
||||||||||
| 17(a) | Co-workers | 55% | 49% | 39% | 37% | 38% | 34% | 34% | 33% | 34% |
| 17(b) | Individuals with authority over me | 59% | 66% | 76% | 79% | 79% | 82% | 82% | 80% | 79% |
| 17(c) | Individuals working for me | 3% | 3% | 4% | 4% | 5% | 4% | 4% | 4% | 3% |
| 17(d) | Individuals for whom I have custodial responsibility (for example, inmates, offenders, patients, detainees) | n/atable 6 note ** | 4% | 9% | 5% | 4% | 3% | 3% | 2% | 2% |
| 17(e) | Individuals from other departments or agencies | 12% | 8% | 8% | 8% | 8% | 8% | 7% | 8% | 9% |
| 17(f) | Members of the public (individuals or organizations) | 17% | 18% | 12% | 11% | 8% | 8% | 7% | 6% | 6% |
Years of service
Incidence of discrimination
Employees with 3 or more years of service in either the federal public service or in their department or agency were less likely than employees with more years of service to be the victim of discrimination.
Figure 2 shows the incidence of discrimination by years of service.

Figure 2 - Text version
| Years of service | less than 3 years | 3 to 10 years | 11 to 20 years | More than 20 years |
|---|---|---|---|---|
| In federal public service | 6% | 13% | 14% | 12% |
| In current organization | 8% | 14% | 14% | 12% |
Source of discrimination
Regardless of the number of years of service they have, employees most often indicated individuals with authority over them as a source of discrimination. However, employees with fewer years of service in either the federal public service or in their current organization, especially those with less than 3 years of service, were more likely than employees with more years of service to identify co‑workers and members of the public as sources of discrimination.
Table 7 shows the results for sources of discrimination by years of service.
| Question number | Source(s) | Years in federal public servicetable 7 note * | Years in current organizationtable 7 note * | ||||||
|---|---|---|---|---|---|---|---|---|---|
| Less than 3 years | 3 to 10 years | 11 to 20 years | More than 20 years | Less than 3 years | 3 to 10 years | 11 to 20 years | More than 20 years | ||
Table 7 Notes
|
|||||||||
| 17(a) | Co-workers | 46% | 39% | 35% | 31% | 42% | 37% | 35% | 30% |
| 17(b) | Individuals with authority over me | 58% | 76% | 82% | 84% | 69% | 78% | 83% | 83% |
| 17(c) | Individuals working for me | 3% | 4% | 5% | 4% | 4% | 4% | 4% | 5% |
| 17(d) | Individuals for whom I have custodial responsibility (for example, inmates, offenders, patients, detainees) | 2% | 5% | 4% | 3% | 2% | 5% | 5% | 4% |
| 17(e) | Individuals from other departments or agencies | 11% | 8% | 8% | 8% | 10% | 8% | 7% | 7% |
| 17(f) | Members of the public (individuals or organizations) | 18% | 10% | 8% | 7% | 13% | 8% | 8% | 7% |
Occupational category
Incidence of discrimination
Employees in the Executive category were the least likely to indicate that they had been the victim of discrimination on the job in the past 2 years; employees in the Operational category were nearly 4 times more likely than employees in the Executive category to indicate that they had been the victim of discrimination.
Figure 3 shows the incidence of discrimination by occupational category. See Appendix 1 for a listing of the occupational groups in each occupational category.

Figure 3 - Text version
| Executive | Scientific and professional | Administration and Foreign Services | Technical | Administrative Support | Operational |
|---|---|---|---|---|---|
| 6% | 11% | 11% | 12% | 12% | 21% |
Source of discrimination
The source of discrimination most commonly indicated by employees in all occupational categories was individuals with authority over them, and employees in the Executive category and those in the Scientific and Professional category indicated this source the most often.
Employees in the Operational category were the most likely to indicate co‑workers, individuals for whom they have a custodial responsibility, members of the public, and individuals from other departments or agencies as sources of discrimination.
Table 8 shows the sources of discrimination by occupational category.
| Question number | Source(s) | Categorytable 8 note * | |||||
|---|---|---|---|---|---|---|---|
| Executive | Scientific and Professional | Administration and Foreign Services | Technical | Administrative Support | Operational | ||
Table 8 Notes
|
|||||||
| 17(a) | Co-workers | 25% | 31% | 35% | 38% | 39% | 42% |
| 17(b) | Individuals with authority over me | 84% | 84% | 78% | 77% | 77% | 80% |
| 17(c) | Individuals working for me | 12% | 4% | 4% | 5% | 2% | 5% |
| 17(d) | Individuals for whom I have custodial responsibility (for example, inmates, offenders, patients, detainees) | n/atable 8 note ** | 1% | 1% | 1% | 1% | 15% |
| 17(e) | Individuals from other departments or agencies | 3% | 6% | 7% | 10% | 7% | 11% |
| 17(f) | Members of the public (individuals or organizations) | 3% | 6% | 8% | 9% | 7% | 13% |
Supervisory status
Incidence of discrimination
Supervisors were less likely than non-supervisors to indicate that they had been the victim of discrimination on the job in the past 2 years (9% and 13%, respectively).
Source of discrimination
Supervisors were less likely than non-supervisors to identify co-workers as a source of discrimination and, as would be expected, more likely than non‑supervisors to identify individuals working for them as a source of discrimination. Supervisors and non‑supervisors were equally likely to identify individuals with authority over them and individuals from other departments or agencies as sources of discrimination.
Table 9 shows the sources of discrimination by supervisory status.
| Question number | Source(s) | Supervisortable 9 note * | Non‑supervisortable 9 note * |
|---|---|---|---|
Table 9 Notes
|
|||
| 17(a) | Co-workers | 30% | 38% |
| 17(b) | Individuals with authority over me | 79% | 79% |
| 17(c) | Individuals working for me | 11% | 3% |
| 17(d) | Individuals for whom I have custodial responsibility (for example, inmates, offenders, patients, detainees) | 2% | 4% |
| 17(e) | Individuals from other departments or agencies | 8% | 8% |
| 17(f) | Members of the public (individuals or organizations) | 6% | 9% |
Community
Incidence of discrimination
The survey asked employees to indicate the community with which they most closely identify. Employees who identified with the security community were the most likely to indicate that they had been the victim of discrimination on the job in the past 2 years, followed by those who identified with the compliance, inspection and enforcement community.
Figure 4 shows the results of the 5 communities with the highest proportion of employees who experienced discrimination.

Figure 4 - Text version
| Security | Health care practitioners | Real property | Compliance, inspection and enforcement | Other services to the public |
|---|---|---|---|---|
| 26% | 15% | 14% | 14% | 14% |
Source of discrimination
The most commonly indicated source of discrimination among employees in the 5 communities above was individuals with authority over them, with employees in the compliance, inspection and enforcement community indicating that source of discrimination the most often. Employees in the security community were also the most likely to identify co-workers and individuals for whom they have custodial responsibility as sources of discrimination.
Table 10 shows the results for sources of discrimination for the 5 communities with the highest proportion of employees experiencing discrimination.
| Question number | Source(s) | Communitytable 10 note * | ||||
|---|---|---|---|---|---|---|
| Security | Compliance, inspection and enforcement | Healthcare practitioners | Real property | Other services to the public | ||
Table 10 Notes
|
||||||
| 17(a) | Co-workers | 45% | 31% | 41% | 36% | 39% |
| 17(b) | Individuals with authority over me | 79% | 82% | 69% | 78% | 75% |
| 17(c) | Individuals working for me | 5% | 3% | 3% | 4% | 4% |
| 17(d) | Individuals for whom I have custodial responsibility (for example, inmates, offenders, patients, detainees) | 24% | 3% | 15% | 0% | 2% |
| 17(e) | Individuals from other departments or agencies | 12% | 6% | 8% | 11% | 7% |
| 17(f) | Members of the public (individuals or organizations) | 12% | 13% | 10% | 6% | 14% |
Size of organization
Incidence of discrimination
Employees in micro and small organizations were the least likely to report being the victim of discrimination on the job in the past 2 years. Employees in very large organizations were the most likely to report being the victim of discrimination.
Figure 5 shows the results for discrimination by size of organization. See Appendix 2 for a listing of departments and agencies by size of organization.

Figure 5 - Text version
| Micro (fewer than 150 employees) | Very small (150 to 499 employees) | Small (500 to 999) | Medium (1,000 to 4,999 employees) | Large (5,000 to 9,999 employees) | Very Large (10,000 employees or more) |
|---|---|---|---|---|---|
| 9% | 9% | 10% | 11% | 11% | 14% |
Source of discrimination
In all sizes of organizations, the source of discrimination most commonly indicated by employees was individuals with authority over them.
Table 11 shows the results for sources of discrimination by size of organization.
| Question number | Source(s) | Size of organizationtable 11 note * table 11 note *** | |||||
|---|---|---|---|---|---|---|---|
| Micro | Very small | Small | Medium | Large | Very large | ||
Table 11 Notes
|
|||||||
| 17(a) | Co-workers | 38% | 39% | 35% | 36% | 35% | 37% |
| 17(b) | Individuals with authority over me | 79% | 82% | 78% | 81% | 78% | 79% |
| 17(c) | Individuals working for me | n/atable 11 note ** | 4% | 4% | 4% | 5% | 4% |
| 17(d) | Individuals for whom I have custodial responsibility (for example, inmates, offenders, patients, detainees) | n/atable 11 note ** | n/atable 11 note ** | n/atable 11 note ** | 1% | 1% | 6% |
| 17(e) | Individuals from other departments or agencies | 11% | 5% | 6% | 7% | 8% | 8% |
| 17(f) | Members of the public | n/atable 11 note ** | 3% | 5% | 7% | 7% | 10% |
Methodological notes
Throughout this report, the totals used to calculate the percentages are based on the following and do not include the responses “Don’t know” and “Not applicable”:
- the sum of “Strongly agree” and “Somewhat agree” responses
- the sum of “Always / Almost always” and “Often” responses
- the sum of “Very high” and “High” responses
For additional results, consult the Public service employee surveys website.
Appendix 1: Occupational categories
| Occupational category | Occupational group |
|---|---|
| Executive | CIEXC, DE (NFB), DM, EC (CRA), EX, EXPCX, GR-EX, MGT (CNSC), MGT (NRC), REX, RLE |
| Scientific and Professional | AC, AG, AR, AU, BI, CH, CISPC, DE, DS, EC, ED, EN, ES, FO, HR, LC, LIB, LP, LS, MA, MD, MT, ND, NU, OP, PC, PH, PM-MCO, PS, RCO, RO (NRC), SE, SG, SI, SP (NFB), SW, UT, VM |
| Administration and Foreign Services | AD (NFB), AS, CO, CS, FI, FS, HR/RH (CRA), IS, OM, PE, PG, PM, SP (CRA), TR, WP |
| Technical | AI, AO, CIPTC, DD, EG, EL, EU, GT, PI, PY, RO, SO, TC, TI, TO |
| Administrative Support | AD (NRC), AS (NFB), CIASC, CM, CR, DA, OE, ST |
| Operational | CX, FB, FR, GL, GS, HP, HS, LI, OP (NFB), OP (NRC), PO-IMA, PO-TCO, PR, SC, SR |
| Other | AB, CIPTC, Governor in Council Appointees, GR, IM, MG, Other, RE, REG, Students |
Appendix 2: Organizations by size
Micro (fewer than 150 employees)
- Canadian Intergovernmental Conference Secretariat
- Canadian Northern Economic Development Agency
- Civilian Review and Complaints Commission for the RCMP
- Copyright Board Canada
- The Correctional Investigator Canada
- Farm Products Council of Canada
- Financial Consumer Agency of Canada
- Indian Oil and Gas Canada
- International Joint Commission
- Military Grievances External Review Committee
- Military Police Complaints Commission of Canada
- Office of the Commissioner for Federal Judicial Affairs Canada
- Office of the Commissioner of Lobbying of Canada
- Office of the Information Commissioner of Canada
- Office of the Public Sector Integrity Commissioner of Canada
- Patented Medicine Prices Review Board
- Polar Knowledge Canada
- RCMP External Review Committee
- Status of Women Canada
- Veterans Review and Appeal Board
Very small (150 to 499 employees)
- Administrative Tribunals Support Service of Canada
- Canadian Environmental Assessment Agency
- Canadian Grain Commission
- Canadian Human Rights Commission
- Canadian Institutes of Health Research
- Canadian Radio-television and Telecommunications Commission
- Canadian Transportation Agency
- Federal Economic Development Agency for Southern Ontario
- Infrastructure Canada
- National Film Board
- Natural Sciences and Engineering Research Council
- Office of the Commissioner of Official Languages
- Office of the Privacy Commissioner of Canada
- Office of the Secretary to the Governor General
- Parole Board of Canada
- Social Sciences and Humanities Research Council of Canada
- Transportation Safety Board of Canada
Small (500 to 999 employees)
- Atlantic Canada Opportunities Agency
- Canada School of Public Service
- Canadian Nuclear Safety Commission
- Canadian Space Agency
- Courts Administration Service
- Department of Finance Canada
- Immigration and Refugee Board of Canada
- Library and Archives Canada
- Privy Council Office
- Public Prosecution Service of Canada
- Public Service Commission of Canada
Medium (1,000 to 4,999 employees)
- Indigenous and Northern Affairs Canada
- Innovation, Science and Economic Development Canada
- National Research Council Canada
- Natural Resources Canada
- Parks Canada
- Public Health Agency of Canada
- Public Safety Canada
- Treasury Board of Canada Secretariat
- Veterans Affairs Canada
Large (5,000 to 9,999 employees)
- Agriculture and Agri-Food Canada
- Canadian Food Inspection Agency
- Department of Justice Canada
- Environment and Climate Change Canada
- Fisheries and Oceans Canada
- Health Canada
- Immigration, Refugees and Citizenship Canada
- Royal Canadian Mounted Police
- Shared Services Canada
- Statistics Canada
- Transport Canada
Very large (10,000 employees or more)
- Canada Border Services Agency
- Canada Revenue Agency
- Correctional Service Canada
- Department of National Defence
- Employment and Social Development Canada
- Public Services and Procurement Canada
© Her Majesty the Queen in Right of Canada, represented by the President of the Treasury Board, 2017,
ISBN: 978-0-660-24529-4
Page details
- Date modified: