
Focus on Work-Life Balance and Workload
The Focus series is a collection of reports that present the results of the 2014 Public Service Employee Survey (PSES), broken down by theme. Focus on Work-Life Balance and Workload looks at results in the areas of work-life balance and workload and examines how they relate to results for other aspects of the workplace. The information provided in this report is intended help target efforts to improve people management practices in the public service.
Results and Comparisons Over Time
The 2014 PSES asked four questionsSee Footnote 1 relating to work-life balance and workload. Table 1 shows the results for all four questions.
| Question Number | Question | 2008 (%) |
2011 (%) |
2014 (%) |
|---|---|---|---|---|
Table 1 Notes
|
||||
| Q9 | I have support at work to balance my work and personal life. | n/aSee Table 1 – Note * | 75 | 71 |
| Q10 | I feel I can claim overtime compensation (in money or leave) for the overtime hours that I work. | 65 | 62 | 61 |
| Q20 | I can complete my assigned workload during my regular working hours. | 64 | 69 | 70 |
| Q35 | Subject to operational requirements, my immediate supervisor supports the use of flexible work arrangements (e.g., flexible hours, compressed workweeks, telework). | n/aSee Table 1 – Note * | 75 | 78 |
In 2014, employees were more likely than they were in 2011 to indicate that they have support for the use of flexible work arrangements but less likely to indicate that they have support at work to balance their work and personal life.
The 2014 results show that 70% of employees can complete their assigned workload during their regular working hours (Q20), similar to 2011 (69%) and much higher than in 2008 (64%). In terms of work-life balance, 71% of employees reported that they have support at work to balance their work and personal life (Q9), a decrease from 2011 (75%). When asked whether their immediate supervisor supports the use of flexible work arrangements (Q35), 78% of employees agreed, up from 2011 (75%). Sixty-one percent of employees agreed that they feel that they can claim overtime compensation for the overtime hours that they work (Q10), similar to 2011 (62%) but lower than in 2008 (65%).
In 2014, four out of ten employees (40%) indicated that they work according to one or more of the following flexible working arrangements: compressed workweeks (23%), flexible work schedule (15%), telework (4%), income-averaging (3%) and job-sharing (less than 1%).See Footnote 2
Demographic Findings
Flexible working arrangements
In 2014, employees who worked according to a flexible working arrangement consistently reported greater support for work-life balance than employees who did not work according to a flexible working arrangement.
For example, employees who worked according to at least one flexible working arrangement were more likely than employees who did not to also indicate that they have support at work to balance their work and personal life (75% compared with 68%, Q9). Employees who worked according to a flexible working arrangement were also more likely than those who did not to indicate that their immediate supervisor supports the use of such arrangements (89% compared with 70%, Q35) (see Figure 1).
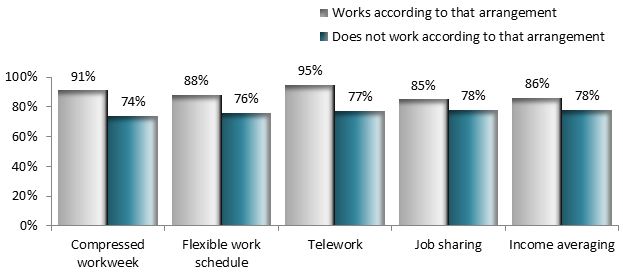
Figure 1 - Text version
Figure 1 illustrates the proportion of employees who responded affirmatively to Q35 (Subject to operational requirements, my immediate supervisor supports the use of flexible work arrangements) by whether they work according to a flexible work arrangement.
| Works according to one of the flexible work arrangement | Compressed Work Week | Flexible Work Schedule | Telework | Job Sharing | Income Averaging |
|---|---|---|---|---|---|
| Yes | 91% | 88% | 95% | 85% | 86% |
| No | 74% | 76% | 77% | 78% | 78% |
In relation to workload, few differences were noted between employees who worked according to a flexible working arrangement and those who did not, except for employees who used income-averaging and those who job-shared. For example, 75% of employees who used income-averaging and 85% of employees who job-shared indicated that they can complete their assigned workload during their regular working hours (Q20), compared with 70% of employees who do not use income averaging or job-share.
Occupational category
Perceptions of support for work-life balance and workload vary widely among occupational categories.See Footnote 3 Employees in the Operational category tended to report less support for work-life balance and flexible working arrangements than employees in other occupational categories. For example, 54% of employees in the Operational category agreed that they have support at work to balance their work and their personal life (Q9), compared with 68% to 74% for employees in other occupational categories. Employees in the Executive category tended to report a heavier workload than employees in other occupational categories. For example, Executive employees were half as likely as Administrative Support employees to indicate that they can complete their assigned workload during their regular working hours (36% compared with 78%, Q20) (see Figure 2).
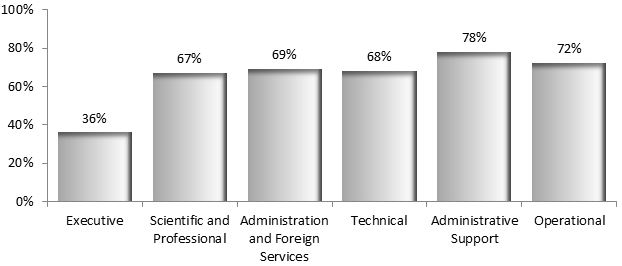
Figure 2 - Text version
Figure 2 illustrates the proportion of employees in each occupational category who responded affirmatively to Q20 (I can complete my assigned workload during my regular working hours).
| Executive | Scientific and Professional | Administration and Foreign Services | Technical | Administrative Support | Operational |
|---|---|---|---|---|---|
| 36% | 67% | 69% | 68% | 78% | 72% |
Community
The 2014 PSES asked employees to indicate the community with which they most closely identify. Employees who identified with the human resources community tended to have the most positive perceptions of the support they receive for work-life balance (79%, Q9) and for the use of flexible working arrangements (85%, Q35); employees who identified with the security community tended to have the least positive perceptions of the support they receive for work-life balance (52%, Q9) and for the use of flexible working arrangements (58%, Q35). Employees who identified with the client contact centre community were most likely to indicate that they can complete their assigned workload during their regular hours (82%, Q20); employees who identified with the legal services community were least likely to indicate that they can complete their assigned workload during their regular hours (59%, Q20).
Age
Employees aged 24 years or younger tended to report higher levels of support for work-life balance and flexible working arrangements than did their older counterparts. For example, 88% of employees aged 24 years or younger indicated that their immediate supervisor supports the use of flexible work arrangements (Q35), compared with 77% to 80% for employees in older age groups. Employees aged 24 years or younger were also particularly inclined to agree that they can complete their assigned workload during their regular working hours (91% compared with 66% to 80% for employees in older age groups, Q20) (see Figure 3).

Figure 3 - Text version
Figure 3 illustrates the proportion of employees who responded affirmatively to Q20 (I can complete my assigned workload during my regular working hours) by age group.
| 24 years and under | 25–29 years | 30–34 years | 35–39 years | 40–44 years | 45–49 years | 50–54 years | 55–59 years | 60 years and over |
|---|---|---|---|---|---|---|---|---|
| 91% | 80% | 74% | 71% | 68% | 66% | 66% | 68% | 71% |
Years of service
Similar to the pattern observed for age, employees with less than one year of service in the public service or in their current organization tended to report greater support for work-life balance and flexible work arrangements than did employees with more years of service. For example, 81% of employees with less than one year of service in their current organization indicated that they have support at work to balance their work and personal life (Q9), compared with 68% to 74% for employees with more years of service in their current organization. Employees with less than one year of service in the public service or in their current organization were also more inclined than employees with more years of service to indicate that they can complete their assigned workload during their regular working hours (see Figure 4, Q20).

Figure 4 - Text version
Figure 4 illustrates the proportion of employees who responded affirmatively to Q20 (I can complete my assigned workload during my regular working hours) by years of service in the public service and in their current organization
| Years of Service | Less than 1 year | 1 to 4 years | 5 to 9 years | 10 to 14 years | 15 to 19 years | 20 to 24 years | 25 to 29 years | 30 or more years |
|---|---|---|---|---|---|---|---|---|
| In public service | 88% | 79% | 73% | 68% | 64% | 63% | 63% | 65% |
| In organization | 81% | 73% | 71% | 67% | 65% | 63% | 64% | 66% |
Organization size
Employees in smaller organizations tended to report greater support for work-life balance and flexible working arrangements than did employees in larger organizations. For example, 81% of employees in micro-organizations (those with fewer than 150 employees) agreed that they have support at work to balance their work and personal life (Q9), compared with 69% of employees in very large organizations (those with 10,000 employees or more).
Employees in smaller organizations were also more likely to feel they can claim compensation for overtime hours that they work. For example, 71% of employees in micro-organizations (those with fewer than 150 employees) and 67% of employees in very small organizations (those with 150 to 500 employees) indicated that they feel they can claim overtime compensation (in money or in leave) for the overtime hours that they work (57% to 62% for employees in larger organizations, Q10).
Key Observations
Support for work-life balance linked to recognition
Employees who felt that they have support for work-life balance tended to report positive perceptions of performance management, particularly in relation to recognition. For example, employees who agreed that they have support at work to balance work and personal life (Q9) were more likely than those who disagreed to indicate that they receive meaningful recognition for work well done (69% compared with 21%, Q12).
Support for work-life balance linked to respect in the workplace
Employees who received support for work-life balance or whose immediate supervisor supports the use of flexible work arrangements were more likely to feel that their workplace is respectful. For example, employees who agreed that they have support at work to balance their work and personal life (Q9) were more likely than those who disagreed to indicate that their organization respects individual differences (86% compared with 50%, Q56) and that their organization treats them with respect (89% compared with 47%, Q57).
Support for work-life balance linked to sense of empowerment
Employees who felt that they have support at work for work-life balance were more inclined to feel empowered at work. For example, 79% of employees who agreed that they have support at work to balance their work and personal life (Q9) also felt that they have support at work to provide a high level of service (Q18), compared with 28% of employees who disagreed that they have support at work for work-life balance.
Support for flexible work arrangements linked to satisfaction with quality of supervision
Employees who indicated that their immediate supervisor supports the use of flexible work arrangements tended to be more satisfied with the quality of supervision they receive. Specifically, 86% of employees who indicated that their immediate supervisor supports the use of flexible work arrangements (Q35) reported satisfaction with the quality of supervision they receive (Q36), compared with 37% of employees who disagreed that their immediate supervisor supports the use of flexible work arrangements.
Support for work-life balance linked to satisfaction with the organization
The results show that support to balance work and personal life is related to higher levels of satisfaction with the organization. In particular, employees who agreed that they have support at work to balance their work and personal life (Q9) were more likely than those who disagreed to indicate that they are satisfied with their organization (75% compared with 27%, Q59).
Organizational performance linked to workload
Survey results show that organizational issues such as lack of stability, overly complicated or unnecessary business processes, shortage of resources, too many approval stages and constantly changing priorities have a negative impact on the quality of employees’ work. In addition, the results suggest that these organizational issues are linked to employees’ perceptions of their workload. For example, 47% of employees who felt that the quality of their work suffers because of unreasonable deadlines (Q21d) reported that they can complete their assigned workload during their regular working hours (Q20), compared with 87% who did not feel the quality of their work suffers because of it. Further, employees who felt that the quality of their work suffers because of having to do the same or more work but with fewer resources (Q21e) were less likely than those who did not to also report that they can complete their assigned workload during regular working hour (53% compared with 91%, Q20).
Methodological Notes
For the purposes of this report, results for the two most positive responses on the scale (e.g., “Strongly agree” and “Somewhat agree”) were added together to create a single percentage total for positive responses. Similarly, results for the two most negative responses on the scale (e.g., “Strongly disagree” and “Somewhat disagree”) were added together to create a single percentage total for negative responses. The totals used to calculate the percentages do not include the responses “Don’t know” and “Not applicable.”
The observations in this report do not necessarily indicate relationships of cause and effect, but they can provide insight into connections between different aspects of the workplace.
For additional results and for the distribution of respondents by demographic characteristics, consult the 2014 PSES website.
Appendix
| Occupational Category | Occupational Group |
|---|---|
| Executive | CI-EXC, DM, EC(CRA), EX, EXPCX, GR-EX, LC, MGT, PL, RLE |
| Scientific and Professional | AC, AG, AR, AP-AA, AP-PA, ASG-ITS-LA, AU, BI, CH, CI-SPC, DE, DS, EC, ED, EN, ES, FO, HR, LA, LP, LS, MA, MD, MT, ND, NU, OP, PC, PH, PM-MCO, PS, SE, SG, SI, SW, UT, VM |
| Administration and Foreign Services | AS, CO, CS, FI, FS, HR(CRA), IS, OM, PE, PG, PM, TR, WP |
| Technical | AI, AO, CIPTC, DD, EG, EL, EU, GT, PI, PY, RO, SO, TI |
| Administrative Support | CIASC, CM, CR, DA, OE, ST |
| Operational | CX, FB, FR, GA, GL, GS, HP, HS, IN, LI, PO-IMA, PO-TCO, PR, SC, SR |
| Other | AB, CIVIL, FT, Governor in Council, GR, IM, MDMDG, MG, NB, RE, REG, RM, SP(CRA), Student, UNI, Other |
Page details
- Date modified: