
Evaluation of the Official Languages Support Programs 2003-04 to 2020-21
Evaluation Services Directorate
November 28, 2022
On this page
- List of tables
- List of figures
- List of acronyms and abbreviations
- Summary
- 1. Introduction
- 2. Profile of OLSPs
- 3. Approach and Methodology
- 4. Findings
- 5. Conclusion
- 6. Recommendations, management response, and action plan
- Appendix A: evaluation framework
- Appendix B: interviews conducted with key stakeholders
- Appendix C: structure of OLSPs from 2003-04 to 2020-21
- Appendix D: findings from previous OLSP evaluations
- Appendix E: actual and expected expenditures for OLSPs, 2003-04 to 2020-21
- Appendix F: expected and actual expenditures for DOLC and EOL, 2003-04 to 2020-21
- Appendix G: allocation of OLSP financial resources
- Appendix H: OLSP result chains
- Appendix I: Bibliography
List of tables
- Table 1: OLSP Expenditures
- Table 2: DOLC grants and contributions by component, 2003-04 to 2019-20
- Table 3: EOL grants and contributions by component, 2003-04 to 2019-20
- Table 4: evaluation questions
- Table 5: evaluation limitations and mitigation strategies
- Table 6: evolution of PCH priorities, 2004-05 to 2020-21
- Table 7: number of students in minority language schools, 2003-04 to 2019-20
- Table 8: demographic weight by first official language spoken (FOLS) in a minority context, 2006 to 2021
- Table 9: number of students in second official language learning programs, 2003-04 to 2019-20
- Table 10: the bilingualism rate of Canadians from 2006 to 2021
- Table 11: bilingualism rate of Canadians aged 15 to 19, 2006 to 2021
- Table 12: operating expenditures ($M), 2009-10 to 2019-20
- Table 13: recommendation 1 – Action Plan
- Table 14: recommendation 2 – Action Plan
- Table 15: recommendation 3 – Action Plan
List of figures
- Figure 1: progress of OLSPs
- Figure 2: language spoken most often at home, national picture (2006 to 2016)
- Figure 3: language spoken at home at least regularly, national picture (2006 to 2016)
- Figure 4: language spoken most often at work, national picture (2006 to 2016)
- Figure 5: language spoken at work at least regularly, national picture (2006 to 2016)
- Figure 6: total OLSP grants and contributions, 2003-04 to 2019-20
- Figure 7: DOLC and EOL grants and contributions, 2003-04 to 2019-20
Alternate format

Evaluation of the Official Languages Support Programs 2003-04 to 2020-21 [PDF version - 1.4 MB]
List of acronyms and abbreviations
- CR
- Core Responsibility
- DOLC
- Development of Official-Language Communities
- EOL
- Enhancement of Official Languages
- FOLS
- First Official Language Spoken
- GBA Plus
- Gender-Based Analysis Plus
- OLA
- Official Languages Act
- OLB
- Official Languages Branch
- OLMC
- Official Language Minority Community
- OLSPs
- Official Languages Support Programs
- PCH
- Canadian Heritage
- PIP
- Performance Information Profile
- SO
- Strategic Outcome
- TBS
- Treasury Board Secretariat
Summary
This is the final report on the evaluation of the Official Languages Support Programs (OLSPs). The OLSPs are composed of two programs: Development of Official-Language Communities (DOLC) and Enhancement of Official Languages (EOL). These programs account for the largest share of federal funding in official languages. The objectives of the OLSPs are to enhance the vitality and support the development of official language minority community (OLMCs), and to promote the recognition and use of both official languages throughout Canadian society. Canadian Heritage (PCH) implements the various components of these programs in collaboration with non-profit organizations and provincial and territorial governments.
This evaluation consists of a longitudinal study covering the period from the first Action Plan for Official Languages in 2003-04 to 2020-21. It focuses on the relevance, effectiveness, and efficiency of the OLSPs, with particular attention to the medium- and long-term contribution of their outcomes.
Key Findings
Relevance
As with the three previous OLSP evaluations, this evaluation reiterates the relevance of the OLSPs. On the one hand, the programs have remained aligned with the federal government’s constitutional and legislative commitments with respect to official languages, while having gained importance in PCH priorities since 2003. On the other hand, components and subcomponents were added to the OLSP structure throughout the evaluation period to target the identified needs of OLMCs and the Canadian population in general. Several official language needs persist, including access to minority and second language education and the need to protect and promote the French language considering the declining demographic weight of Francophones across the country.
Effectiveness
The OLSPs contribute to access to infrastructure, programs, services, and education in the minority language, which enhances the vitality and development of OLMCs. The OLSPs also ensure a better understanding and appreciation of the benefits of both official languages and the learning of a second official language.
Since 2006, the demographic weight of Francophone OLMCs has decreased while that of Anglophone OLMCs has increased slightly. Therefore, the viability of Francophone OLMCs remains fragile.
In addition, the rate of bilingualism among Canadians increased moderately between 2006 and 2021. Especially during this period, the rate of bilingualism outside Quebec decreased slightly, despite an increase in the number of students enrolled in second language learning programs. Consequently, the EOL program alone is insufficient to increase the national rate of bilingualism. More specifically, there is a gap between the ambitious goals of the EOL program and its funding.
Efficiency
Improvements were made to the OLSPs during the evaluation period, including adjustments to accountability. However, certain issues have limited the efficiency of the OLSPs: the fact that grant and contribution expenditures have remained unchanged for 12 consecutive years, and the complex structure of the OLSPs due to the addition of components and subcomponents since 2003. Furthermore, many key stakeholders perceive that provincial and territorial funding is not sufficiently aligned with current needs and that their accountability is not sufficiently transparent.
Recommendations
Based on the findings of this evaluation and to support ongoing program management, it is recommended that the Assistant Deputy Minister, Official Languages, Heritage and Regions:
Recommendation 1
Review the structure of the OLSPs and their priorities and objectives, with particular attention to those of the EOL program.
Recommendation 2
Analyze the results chain to improve the consistency of the logic model and its associated indicators.
Recommendation 3
Revise the accountability process and targeted data collection to strengthen informed decision-making.
1. Introduction
The Evaluation of the Official Languages Support Programs (OLSPs) is a longitudinal study covering the period from the first Action Plan for Official Languages in 2003-04 to 2020-21. The evaluation focuses on the relevance, effectiveness, and efficiency of the OLSPs, with particular attention to the medium- and long-term contribution of their outcomes.
The purpose of the evaluation is to provide Canadian Heritage (PCH) senior management with information to support program decision-making. The evaluation was conducted in accordance with the requirements of Section 42.1(1) of the Financial Administration Act and the Treasury Board Secretariat’s Policy on Results.
The following sections present a profile of the OLSPs, followed by the evaluation approach and methodology, a summary of key evaluation findings, conclusions, and recommendations.
2. Profile of OLSPs
2.1. Historical background
The Official Languages Act (OLA) has guided government action on official languages since 1969. The OLA was amended in 1988 to provide greater support for the promotion of English and French as well as the development of OLMCs. The federal government is thus fulfilling its official languages commitments under sections 41 and 43 of the OLA, particularly through the implementation of the OLSPs. In addition, the provinces and territories are required by Section 23 of the Canadian Charter of Rights and Freedoms to guarantee primary and secondary education to OLMCs, which is English in Quebec and French everywhere else in Canada.
Since the implementation of the OLSPs, there have been several administrative changes related to the management of the official languages support programs. In particular, the federal government restructured five departments in 1993 to form the Department of Canadian Heritage, while also receiving the mandate to coordinate the official languages commitments and obligations under Part VII of the OLA. Since then, the Official Languages Branch (OLB) has been managing the OLSPs, in collaboration with PCH regional offices, non-profit organizations, and provincial and territorial governments. Finally, on March 1, 2022, the federal government introduced a bill entitled An Act to achieve substantive equality between the official languages of Canada to adapt the OLA so that it is more responsive to current language issues in Canada.
The OLSPs consist of two programs that include components and subcomponents:
- The Development of Official-Language Communities (DOLC) program stems from section 43 of Part VII of the OLA. The DOLC program enhances the vitality of Canada’s OLMCs and enables them to participate fully in all aspects of Canadian life. The objective of the program is to help OLMCs develop and build a support network. It includes the following components: Community Life and Minority-Language Education.
- The Enhancement of Official Languages (EOL) program stems from section 43 of the OLA. The EOL program supports a better understanding and appreciation of the benefits of linguistic duality among Canadians. Its objective is to promote the full recognition and use of English and French in Canadian society. It includes the following components: Promotion of Linguistic Duality and Second Language Learning.Footnote 1
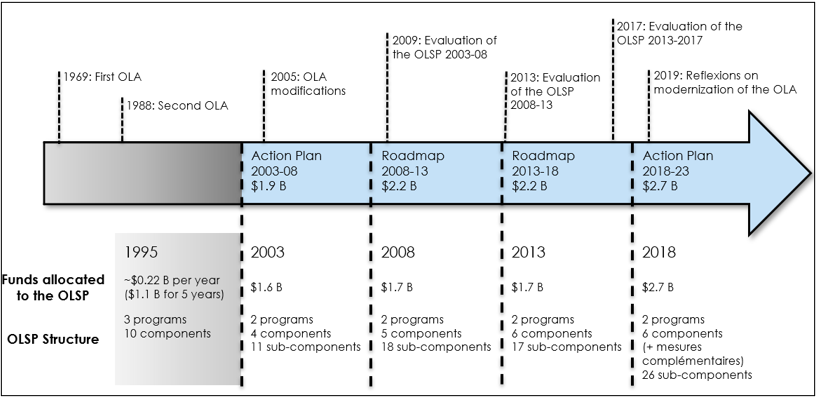
The structure of the OLSPs has been modified since 2003. Figure 1 presents these changes between 2003-04 and 2020-21 based on the five-year strategies, including funds dedicated to OLSPs and the progression of the program structure. A table with more detail on the OLSP components and subcomponents for each period can be found in Appendix C.
Sources: PCH administrative data and PIP 2020.
Note: Some program documents present the OLSP structure differently because of different communication objectives, such as internal or external communications or targeted communications with recipients or with senior program management.
Figure 1: progress of OLSPs – text version
History of the structure and allocation of funds from OLSPs from 2003–04 to 2020–21
- In 1995, the program began with a budget of $1.1 billion over five years, including 3 programs and 10 components.
- In 2003, the first 2003–08 Action Plan was launched, with a budget of $1.9 billion. OLSPs had a budget of $1.6 billion and consisted of 2 programs, 4 components, and 11 subcomponents.
- In 2008, the 2008–13 Roadmap was launched, with a budget with $2.2 billion. OLSPs had a budget of $1.7 billion and consisted of 2 programs, 5 components, and 18 subcomponents.
- In 2013, the 2013–18 Roadmap was launched, with a budget with $2.2 billion. OLSPs received a budget of $1.7 billion and consisted of 2 programs, 6 components, and 17 subcomponents.
- In 2018, the 2018–23 Action Plan was launched, with a budget of $2.7 billion. OLSPs had a budget of $2.7 billion and consisted of 2 programs, 6 subcomponents, 2 complementary measures, and 26 subcomponents.
History of official languages and OLSP evaluations
- Creation of the Official Languages Act (OLA) in 1969.
- Amendment to the OLA in 1988.
- Amendment to the OLA in 2005.
- First evaluation of OLSPs in 2009 by PCH.
- Second evaluation of OLSPs in 2013 by PCH.
- Third evaluation of OLSPs in 2017 by PCH.
- Discussion on the modernization of the OLA in 2019.
2.2. Operation, objectives, and expected outcomes
In accordance with Part VII of the OLA, OLSPs have two primary objectives:
- Enhance the vitality and support the development of Canada OLMCs.
- Promote the full recognition and use of both English and French in Canadian society.
2.3. Management and governance
The OLSPs are implemented by the OLB within the Official Languages, Heritage and Regions sector of PCH. The Assistant Deputy Minister of the sector is responsible for the administration of the OLSPs. The OLB is responsible for the planning, implementation, and management of these programs.
Two OLB directorates—Operations and Regional Coordination and Policy and Research—are responsible for implementing and monitoring programs in accordance with applicable requirements, policies, directives, and procedures. PCH regional offices support the delivery of some program subcomponents. The OLB conducts research in official languages and sometimes collaborates on research projects with Statistics Canada and other federal institutions and specialized firms.
2.4. Financial resources
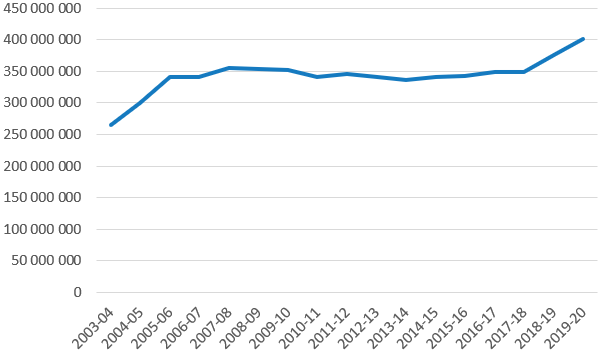
From 2003-04 to 2020-21, a total of $5.8 billion has been awarded in grants and contributions by the OLSPs. Operating expenditures totalled $156.3 million between 2009-10 and 2019-20 (Table 1).Footnote 2 In 2019-20, the DOLC program accounted for 67% of OLSPs ($3.9 billion), while the EOL program accounted for 33% ($1.9 billion) (see Appendix’ E, F, and G).Footnote 3
| Fiscal year | Operating expendituresTable 1 note b | Grants and contributions | Total |
|---|---|---|---|
| 2003-04 | Unavailable | 264,257,559 | 264,257,559 |
| 2004-05 | Unavailable | 300,263,331 | 300,263,331 |
| 2005-06 | Unavailable | 341,470,897 | 341,470,897 |
| 2006-07 | Unavailable | 340,194,966 | 340,194,966 |
| 2007-08 | Unavailable | 355,602,392 | 355,602,392 |
| 2008-09 | Unavailable | 353,530,688 | 353,530,688 |
| 2009-10 | 14,156,754Table 1 note c | 351,479,343 | 365,636,097 |
| 2010-11 | 13,889,504 | 340,561,244 | 354,450,748 |
| 2011-12 | 14,312,637 | 345,180,279 | 359,492,916 |
| 2012-13 | 16,516,360 | 340,688,196 | 357,204,556 |
| 2013-14 | 13,316,615 | 336,105,054 | 349,421,669 |
| 2014-15 | 13,200,465 | 340,896,744 | 354,097,209 |
| 2015-16 | 13,458,458 | 342,653,178 | 356,111,636 |
| 2016-17 | 13,413,591 | 349,544,205 | 362,957,796 |
| 2017-18 | 13,419,831 | 348,197,797 | 361,617,628 |
| 2018-19 | 13,532,248 | 376,163,138 | 389,695,386 |
| 2019-20 | 17,089,241 | 401,412,890 | 418,502,131 |
| Total | 156,305,704 | 5,828,201,901 | 5,984,507,605 |
Source: PCH financial data.
Table 1 notes
- Table 1 note a
-
Total amounts are based on rounding of other amounts shown in the table and may vary slightly from actual amounts.
- Table 1 note b
-
Operating expenditures were not available from 2003-04 to 2008-09.
- Table 1 note c
-
Operating expenditures for 2009–10 to 2011–12 include the coordination program.
Between 2003-04 and 2019-20, approximately 74% of OLSP funds were awarded to the Minority-Language Education component and 26% to the Community Life component (Table 2). For EOL, almost 96% of the funds went to the Second Language Learning component and 4% to the Promotion of Linguistic Duality component (Table 3). The breakdown of resources for these programs by their respective components and subcomponents can be found in Appendix G.
| Components | Grants and contributions ($M) Table 2 note a | Grants and contributions (% of program) Table 2 note b |
|---|---|---|
| Community Life | 1,023.04 | 26.2% |
| Minority-Language Education | 2,871.07 | 73.6% |
| Total | 3,894.11 | 99.8% |
Source: Data from PCH’s Annual Report on Official Languages (2003-04 to 2019-20).
Table 2 notes
- Table 2 note a
-
Component financial data are available only from PCH’s Annual Report on Official Languages, which diverge slightly from PCH’s official financial data; there is a discrepancy of approximately $22 million between these two sources. Despite this difference in total amounts, this analysis still allows us to see the distribution of funds by program component.
- Table 2 note b
-
This table does not include funds allocated to the Language Rights Support component, which represents approximately 0.2% of total program funding.
| Components | Grants and contributions ($M) Table 3 note a | Grants and contributions (% of program) Table 3 note b |
|---|---|---|
| Promotion of Linguistic Duality | 80.36 | 4.2% |
| Second Language Learning | 1,853.05 | 95.7% |
| Total | 1,933.41 | 99.9 % |
Source: Data from PCH’s Annual Report on Official Languages (2003-04 to 2019-20).
Table 3 notes
- Table 3 note a
-
Component financial data are available only from PCH’s Annual Report on Official Languages, which diverge slightly from PCH’s official financial data; there is a discrepancy of approximately $22 million between these two sources. Despite this difference in total amounts, this analysis still allows us to see the distribution of funds by program component.
- Table 3 note b
-
This table does not include funds allocated to the Language Rights Support component, which represents approximately 0.1% of total program funding. The OLB is no longer responsible for this program since 2017-18.
3. Approach and Methodology
This section presents the evaluation approach and methodology. It includes details on scope, calibration, evaluation questions, data collection methods, as well as constraints, limitations, and mitigation strategies.
3.1. Scope of the evaluation
The evaluation was conducted jointly by PCH evaluation services and an external consultant. It was conducted in accordance with the Departmental Evaluation Plan 2019-20 to 2023-24 and covered the period from 2003-04 to 2020-21. In accordance with the Financial Administration Act and the Policy on Results and its associated Directive,Footnote 4 the evaluation examined the relevance, effectiveness, and efficiency of the OLSPs. Specifically, the evaluation was undertaken as a longitudinal impact study to measure the attainment of the medium- and long-term outcomes of the OLSPs.
Three OLSP evaluations have been completed since 2003.Footnote 5 These confirmed the relevance of the OLSPs, but raised issues related to the attribution of their medium- and long-term outcomes.Footnote 6 Consequently, the evaluation used a contribution analysis approach based on the theory of change to describe the contribution of the OLSPs’ medium- and long-term outcomes. The theory of change is based on the performance information profile (PIP) logic model.Footnote 7 The results chain for the DOLC and EOL programs can be found in Appendix H.
3.2. Evaluation questions
The evaluation explored seven questions listed in the table below. Additional information on the indicators, data sources, and data collection methods associated with these questions can be found in the evaluation framework (presented in Appendix B).
| Issues | Evaluation Questions |
|---|---|
| Relevance |
|
| Effectiveness |
|
| Efficiency |
|
3.3. Data collection methods
Seven data collection methods were used to conduct the evaluation.
- Review of administrative data: Information from available databases, including financial data, was compiled, and analyzed to identify longitudinal trends.
- Document review: A review of several program documents and files provided background and contextual information required to understand how the program operates. Documents included terms and conditions, PIPs, previous audit and evaluation reports, recipient contribution agreements, and financial reports.
- Public opinion surveys: A comparative analysis of data from four public opinion surveys was conducted in 2005, 2012, 2016, and 2018 to identify trends related to the evaluation questions.Footnote 8
- Case studies: A case study on the EOL program and a series of case studies on the vitality of eight OLMCs across the country were conducted. These OLMCs had also been the subject of case studies in 2012 and 2016, contributing to the longitudinal aspect of this evaluation. Each case study included telephone interviews with several key community stakeholders (such as representatives of target groups, service providers, and well-known local observers) as well as an analysis of relevant documents on various factors of OLMC vitality.
- Experts’ panel: A panel of five experts in the field of official languages and OLMC development shared their knowledge of the relevance, effectiveness, and efficiency of the OLSPs, thereby validating the preliminary findings of the evaluation.
- Key stakeholder interviews: There were 82 interviews conducted with key OLSP stakeholders (see Appendix A).
- Literature review: A targeted review of grey and scientific literature documented the progression of the official languages context in Canada since 2003, as well as aspects related to the evaluation questions.
3.4. Constraints, limitations, and mitigation strategies
The main challenges in evaluating the OLSPs were disruptions to the evaluation schedule, particularly due to the COVID-19 pandemic, lack of data for analysis of long-term outcome achievement, and limited or inconsistent data across the evaluation period. Table 5 presents the challenges and mitigation strategies associated with each.
| Limitations | Mitigation Strategies |
|---|---|
| The COVID-19 pandemic affected data collection, particularly from key stakeholder interviews, and disrupted the schedule for this evaluation. |
The evaluation schedule was revised numerous times to ensure adequate time for each of its phases. The interviews were conducted virtually and scheduled at convenient times for the key stakeholders. |
| Difficulty in attributing long-term outcomes of OLSPs. | Contribution analysis for medium- and long-term outcomes was used to assess the achievement and logic of outcomes based on the theory of change. |
| The longitudinal aspect of the OLSP evaluation was limited by a lack of information and some unavailable data. | Data from several sources were collected, including interviews with former PCH employees, to facilitate data triangulation. |
| The types of data and methods of collection changed between 2003 and 2020. | Use of various data sources and collaboration with the program to confirm data and analyses. |
4. Findings
4.1. Relevance
4.1.1. Ongoing program needs
To what degree have the OLSPs been adapted to meet the changing needs of Canadians since 2003?
- Since 2003, significant and ongoing progress has been made to ensure that the OLSPs meet the official languages needs of OLMCs and Canadians, particularly in terms of access to services and education in the minority language and second language.
- However, needs and challenges remain in terms of offering and accessing post-secondary education in the minority language, shortages of qualified teaching staff, and addressing the sociodemographic changes and different realities across the country’s OLMCs.
The OLSPs remained aligned with the needs of OLMCs and Canadians during the evaluation period. The OLSPs have addressed multiple needs of OLMCs and Canadians, such as access to education and services in the minority language and access to second-language education. To achieve this, measures were put in place to ensure alignment. First, in designing the five-year strategies, Canadians and OLSP stakeholders were consulted to identify their needs, challenges, and possible solutions.Footnote 9
In addition, the OLSPs were restructured on a few occasions by adding components and subcomponents to improve the focus on certain emerging needs. As shown in Figure 1, the programs have grown from 4 to 6 components, and from 11 to 26 subcomponents. As a result of these efforts, OLSPs have made progress in access to services, organizations, media, and gathering places; minority-language education; and access to second-language learning opportunities. Moreover, the adoption of the “by and for” governance approach was seen by many key stakeholders as relevant to meeting the needs of OLMCs.
Between 2003 and 2021, the needs and circumstances of OLMCs and Canadians changed with respect to official languages. For example, since 2003, immigration has been on the rise in OLMCs, which has changed the needs of some communities. Sociodemographic changes due to an aging population, the exodus of young people from OLMCs, low fertility rates, etc. have also altered the needs of OLMCs. Finally, the communities have needs that extend beyond the issues of essential services or their demographic weight. Consideration of their governance is required, as well as of their economic, artistic, and cultural development in the OLMCs.Footnote 10
The data show that the various OLMCs have different realities and needs. For example, for Francophone OLMCs, the main challenge is to be able to transmit their language, live in French, and maintain their demographic weight. For Anglophone OLMCs, it is more a question of having access to education in the minority language, being recognized, and being able to participate in Quebec society.Footnote 11 Finally, whether Francophone or Anglophone, needs also vary from one community to another,Footnote 12 especially between urban centres and remoter rural areas.
For the general Canadian population, needs remain in terms of access to French immersion programs in Canada outside Quebec and English second language learning in Quebec. There is also a need to address the shortage of French second language teachers.
4.1.2. Alignment with federal government priorities and the Department’s core responsibilities
To what degree are the OLSPs aligned with the strategic outcomes and core responsibilities of Canadian Heritage and the government’s priorities (including GBA Plus) from 2003 to 2021?
- The OLSPs have remained aligned with PCH’s priorities and the Government of Canada’s constitutional and legislative obligations regarding official languages.
- Official languages have become increasingly important in PCH’s priorities.
- Factors such as age, ethnicity and immigration status, geographic location, and education level affect how well Canadians know their official languages.
Evolution of the federal government’s priorities with respect to official languages
The OLSPs contribute to the federal government’s constitutional commitments regarding official languages. In accordance with section 41 of the OLA, the Government of Canada is committed to enhancing the vitality of the OLMCs in Canada and supporting their development, as well as fostering the full recognition and use of both English and French in Canadian society.Footnote 13
The three previous evaluations also confirmed the link between OLSP objectives and the federal government’s constitutional and legislative obligations. The OLSP alignment with these obligations has been maintained throughout the evaluation period.
Specifically, the OLSPs contribute to the fulfillment of PCH Core Responsibility 5: Official Languages for the following two long-term outcomes:
- Canadians recognize and support Canada’s official languages.
- Federal institutions develop and implement policies and programs in accordance with Section 41 of the OLA.
The OLSP outcomes are part of one of PCH’s three strategic outcomes: “Canadians share, express and appreciate their Canadian identity.” Finally, the outcomes of the OLSPs contribute to the achievement of the Government of Canada’s outcome of “A diverse society that promotes linguistic duality and social inclusion.”Footnote 14 The overall objectives of the OLSPs are also aligned with the official languages priorities of PCH and the Government of Canada. For example, an analysis of the Speeches from the Throne from 2000 to 2021 shows an evolution in the government’s priorities with respect to official languages. This evolution is also reflected in the increasing importance of official languages in PCH’s priorities. According to various departmental plans and PCH Reports on Plans and Priorities, OLSPs have grown since 2004-05 from a program sub-sub activity to one of the Department’s five core responsibilitiesFootnote 15 (Table 6). In addition, the Government of Canada has appointed a minister specifically for official languages since 2003.
| Period | Strategic Outcome (SO)/Core Responsibility (CR) | Program Activity | Program Sub-Activity | Program Sub-Sub Activity |
|---|---|---|---|---|
|
2004-05 to 2008-09 |
SO2: “Canadians live in an inclusive society built on intercultural understanding and citizen participation.” |
2.5: Promotion of intercultural understanding and 2.6: Community development and capacity building |
2.5.1: Official languages and 2.6.1: Official languages |
EOL and DOLC |
| 2009 to 10 | SO2: “Canadians have a sense of their Canadian identity.” | 2.6: Official languages |
2.6.1: DOLC 2.6.2: EOL |
N/A |
|
2010-11 to 2017-18 |
SO2: “Canadians share, express, and value their Canadian identity.” | 2.3: Official languages |
2.3.1: DOLC 2.3.2: EOL |
N/A |
|
2018-19 to 2020-21 |
CR5: Official languages |
5.1: DOLC 5.2: EOL |
N/A | N/A |
Sources: Departmental Performance Reports, Departmental Plans, and Reports on Plans and Priorities, PCH.
As shown in Table 6, from 2004 to 2009, OLSPs were a “program sub-sub activity” for different program activities with broader mandates than official languages.
In 2009-10, the strategic outcomes changed, and official languages became a program activity until 2018. As of 2018-19, official languages are the Department’sFootnote 16 fifth most important core responsibility, for which only the OLB is responsible within PCH. Thus, between 2003 and 2021, the federal government’s priorities related to official languages were gradually strengthened to accord them greater importance.
OLSPs and GBA Plus
OLB developed a generic database in 2017, based on the 2001 to 2016 censuses and data from the provinces and territories, that allows for the analysis of official languages using GBA Plus. The data collected shows that “the official languages issue is not one of sex or gender.”Footnote 17 In fact, the gender gap in the rate of bilingualism in the population or in the number of students in minority-language and second-language education programs is small.
There are, however, factors that are relevant to the analysis of OLSPs in terms of GBA Plus considerations. Knowledge of the official languages among Canadians varies according to age, ethnicity or immigration status, geographic location,Footnote 18 and level of education. The OLB uses some of these factors in the frameworks for OLMC vitality and for linguistic duality.Footnote 19
4.2. Effectiveness
4.2.1. DOLC Program
From 2003 to 2021, to what degree has the DOLC program had medium- and long-term impacts nationally and regionally?
- The OLSPs contribute to access to infrastructure, programs, services, and education in the minority language, which enhances the vitality and development of OLMCs.
- In Canada outside Quebec, there is an increase in the number of students in French-language schools, while in Quebec the number of students in English-language schools has decreased over the evaluation period.
- According to census data, between 2006 and 2021, the demographic weight of Francophone OLMCs has decreased while that of Anglophone OLMCs has increased slightly. The viability of Francophone OLMCs is therefore fragile.
- The results chain does not provide a good measure of the long-term outcome of the DOLC program because of its overlap with medium-term outcomes.
Medium-term outcomes
Access to infrastructure, programs, and services for OLMCs
OLSPs contribute to better access to infrastructure, programs, and services for OLMCs. The data analysis reveals that, between 2012 and 2021, most OLMCs were located within 25 km of a community and cultural organization. The DOLC program contributes to the cultural milieu of OLMCs by supporting community media as well as artistic and cultural productions in the minority language. Key stakeholders highlighted the addition and renovation of school and community spaces as part of the progress made in infrastructure. However, access to services and programs is more limited in remoter areas than in larger centres.
Several key stakeholders mentioned that funding has been stagnant or inadequate for the past 15 years. This has limited the access of OLMCs to services and programs and has therefore reduced their ability to meet their needs. However, since the Action Plan implemented in 2018, there has been increased support for infrastructure projects and new program development.
Access to education in the minority language
OLSPs have contributed to access to education in the minority language. The data indicate that the number of students in minority language schools increased slightly in Canada between 2003-04 and 2019-20, from 250,000 to 260,000 students (Table 7). More specifically, outside of Quebec, the number of students in French-language schools has increased, while in Quebec the number of students in English-language schools has decreased over the evaluation period.
| Regions | 2003-04 | 2019-20 | Difference |
|---|---|---|---|
| Canada | 251,748 | 259,395 | 7,647 |
| Outside Quebec | 143,587 | 174,369 | 30,782 |
| Quebec | 108,161 | 85,026 | -23,135 |
Source: Statistics Canada (2020).
The recruitment and retention of rights-holders are important issues. In fact, more than one third of Francophone rights-holders did not exercise their rights to be educated in their first official language in 2014.Footnote 20
Between 2012 and 2018, most OLMCs were located within 25 km of a minority language elementary or high school. In addition, OLSPs are more supportive of the early childhood to post-secondary continuum in a minority context. OLSPs have expanded the range of programs available online for post-secondary education. This trend has also been reflected in some high schools where online courses are offered. However, post-secondary education needs support to ensure the continuum to minority language education, as these are key institutions for OLMCs.
Between 2003 and 2020, provincial and territorial governments provided financial support for second-language education programs. Interviews and the literature review show that since 2003 there has been greater openness and support for official languages by the provinces and territories. Moreover, between 2003 and 2008, improved federal-provincial agreements allowed for the construction of schools and the hiring of teachers. Due to the shortage of teachers in French-language minority schools, DOLC has been funding a strategy since 2019 to recruit and retain these teachers.
Furthermore, based on analysis of OLSP financial data, funding for the Minority-Language Education component increased only slightly between 2004-05 and 2017-18, from $162.5 million to $166.2 million, an increase of $3.7 million. However, since 2018-19, there has been a significant increase due to the latest Action Plan.
Participation in society, development, and vitality of OLMCs
OLSPs contribute to the development and vitality of OLMCs through access to services, organizations, and education in the minority language. In general, Canadians living in OLMCs can participate in Canadian society and ensure their development and vitality. Several key stakeholders reported that since 2003, there have been more gathering spaces, organizations, services, programs, activities, and events that allow OLMCs to exchange and share their experiences and culture.
The proportion of Canadians with a minority language as their first official language spoken (FOLS)Footnote 21 decreased between 2006 and 2021, from 6.4% to 5.5%. More specifically, in Quebec the proportion of individuals with English as their FOLS increased from 2006 to 2021, from 13.4% to 14.9%. On the other hand, the proportion of individuals with French as their FOLS outside Quebec decreased slightly from 2006 to 2021, from 4.2% to 3.5%.
| FOLS | 2006 | 2011 | 2016 | 2021 |
|---|---|---|---|---|
| English in Quebec | 13.4% | 13.5% | 13.7% | 14.9% |
| French outside Quebec | 4.2% | 4.0% | 3.8% | 3.5% |
Sources: Research Team, Official Languages Branch, Canadian Heritage, Census of Canada data from 2006 to 2021.
The rate of linguistic continuity is an indicator that measures the ability of OLMCs to participate in Canadian society and to ensure their development.Footnote 22 According to census data from 2006 to 2016, more speakers in Quebec use the minority language most often at home than individuals with English as their first language. New Brunswick is the province that comes closest to linguistic continuity in terms of the language spoken most often at home (1.00, or as many individuals who have French as their mother tongue as there are speakers of French).
There has been an increase in the use of the minority language at home on a regular basis for several provinces and territories between 2006 and 2016. This increase was more pronounced in the western provinces, which in 2006 had the lowest indices of linguistic continuity in Canada (Figure 2). There was, however, a slight decrease in the rate of linguistic continuity between 2006 and 2016 for Ontario, Manitoba, and the Atlantic provinces, except for Newfoundland and Labrador.
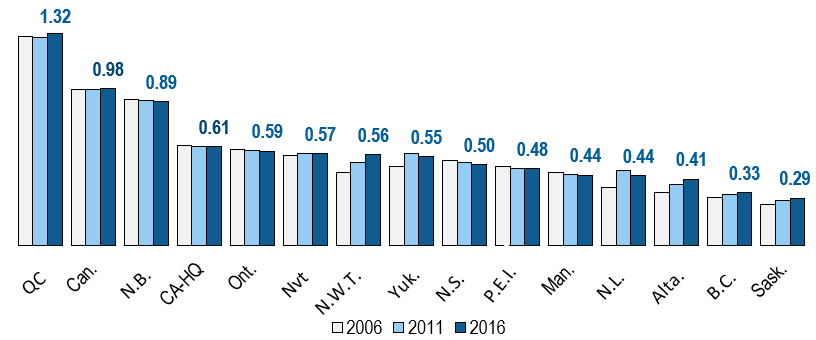
Note: Only the 2016 indices are identified in this figure to facilitate reading. 1.00 = as many individuals who have French as their mother tongue as there are speakers of French at home.
Source: Research Team, Official Languages Branch, Canadian Heritage, based on Census of Canada data from 2006 to 2016.
Figure 2: language spoken most often at home, national picture (2006 to 2016) – text version
| Province/Territory | 2006 | 2011 | 2016 |
|---|---|---|---|
| Canada | 0.97 | 0.97 | 0.98 |
| Newfoundland and Labrador | 0.36 | 0.47 | 0.44 |
| Prince Edward Island | 0.49 | 0.48 | 0.48 |
| Nova Scotia | 0.53 | 0.52 | 0.50 |
| New Brunswick | 0.91 | 0.90 | 0.89 |
| Quebec | 1.30 | 1.29 | 1.32 |
| Ontario | 0.60 | 0.59 | 0.59 |
| Manitoba | 0.45 | 0.44 | 0.44 |
| Saskatchewan | 0.26 | 0.28 | 0.29 |
| Alberta | 0.33 | 0.38 | 0.41 |
| British Columbia | 0.30 | 0.32 | 0.33 |
| Yukon | 0.49 | 0.57 | 0.55 |
| Northwest Territories | 0.46 | 0.52 | 0.56 |
| Nunavut | 0.56 | 0.57 | 0.57 |
| Canada (outside Quebec) | 0.62 | 0.61 | 0.61 |
Census data show growth in the use of the minority language spoken at least regularly at home across Canada, except in New Brunswick and Nunavut (Figure 3).

Note: Only the 2016 indices are identified in this figure to facilitate reading. 1.00 = as many individuals who have French as their mother tongue as there are speakers of French at home.
Source: Research Team, Official Languages Branch, Canadian Heritage, based on Census of Canada data from 2006 to 2016.
Figure 3: language spoken at home at least regularly, national picture (2006 to 2016) – text version
| Province/Territory | 2006 | 2011 | 2016 |
|---|---|---|---|
| Canada | 1.07 | 1.07 | 1.08 |
| Newfoundland and Labrador | 1.44 | 1.48 | 1.63 |
| Prince Edward Island | 0.92 | 0.98 | 1.04 |
| Nova Scotia | 0.97 | 1.01 | 1.03 |
| New Brunswick | 1.03 | 1.02 | 1.02 |
| Quebec | 1.99 | 2.04 | 2.15 |
| Ontario | 1.01 | 1.05 | 1.07 |
| Manitoba | 0.83 | 0.89 | 0.92 |
| Saskatchewan | 0.70 | 0.78 | 0.89 |
| Alberta | 0.82 | 0.91 | 0.97 |
| British Columbia | 0.88 | 0.97 | 1.01 |
| Yukon | 1.05 | 1.06 | 1.10 |
| Northwest Territories | 0.94 | 1.08 | 1.21 |
| Nunavut | 0.99 | 1.16 | 0.97 |
| Canada (outside Quebec) | 0.98 | 1.01 | 1.04 |
For OLMCs outside Quebec, more individuals have used French most often at work since 2006, except in Nova Scotia, New Brunswick, and Prince Edward Island. Quebec is the only other province where OLMCs speak their language most often at work (Figure 4).
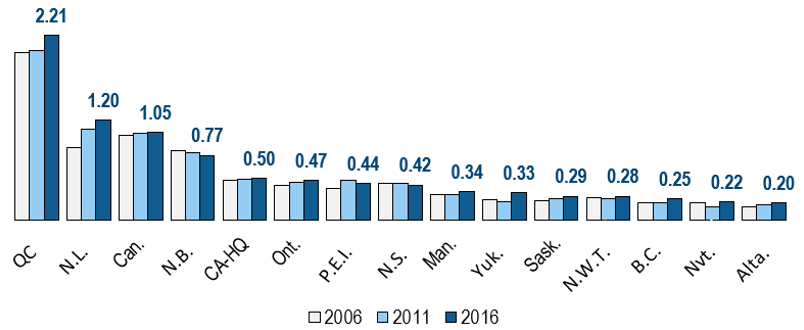
Note: Only the 2016 indices are identified in this figure to facilitate reading. 1.00 = as many individuals who have French as their mother tongue as there are speakers of French at work.
Source: Research Team, Official Languages Branch, Canadian Heritage, based on Census of Canada data from 2006 to 2016.
Figure 4: language spoken most often at work, national picture (2006 to 2016) – text version
| Province/Territory | 2006 | 2011 | 2016 |
|---|---|---|---|
| Canada | 1.02 | 1.04 | 1.05 |
| Newfoundland and Labrador | 0.87 | 1.09 | 1.20 |
| Prince Edward Island | 0.38 | 0.48 | 0.44 |
| Nova Scotia | 0.43 | 0.44 | 0.42 |
| New Brunswick | 0.83 | 0.80 | 0.77 |
| Quebec | 2.01 | 2.04 | 2.21 |
| Ontario | 0.42 | 0.45 | 0.47 |
| Manitoba | 0.31 | 0.31 | 0.34 |
| Saskatchewan | 0.24 | 0.26 | 0.29 |
| Alberta | 0.16 | 0.18 | 0.20 |
| British Columbia | 0.20 | 0.21 | 0.25 |
| Yukon | 0.24 | 0.21 | 0.33 |
| Northwest Territories | 0.27 | 0.26 | 0.28 |
| Nunavut | 0.21 | 0.16 | 0.22 |
| Canada (outside Quebec) | 0.47 | 0.49 | 0.50 |
For language spoken at least regularly at work, only OLMCs in British Columbia, Alberta, Manitoba, and Saskatchewan did not cross the parity threshold in 2016. That said, this rate of linguistic continuity is increasing across Canada, except in New Brunswick and Prince Edward Island (Figure 5).
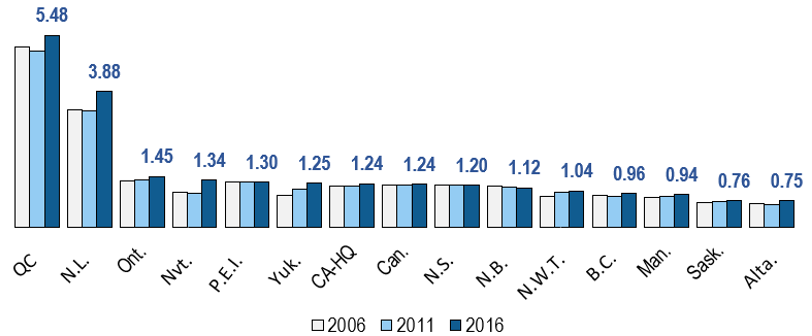
Note: Only the 2016 indices are identified in this figure to facilitate reading. 1.00 = as many individuals who have French as their mother tongue as there are speakers of French at work.
Source: Research Team, Official Languages Branch, Canadian Heritage, based on Census of Canada data.
Figure 5: language spoken at work at least regularly, national picture (2006 to 2016) – text version
| Province/Territory | 2006 | 2011 | 2016 |
|---|---|---|---|
| Canada | 1.21 | 1.21 | 1.24 |
| Newfoundland and Labrador | 3.36 | 3.31 | 3.88 |
| Prince Edward Island | 1.30 | 1.29 | 1.30 |
| Nova Scotia | 1.19 | 1.20 | 1.20 |
| New Brunswick | 1.18 | 1.15 | 1.12 |
| Quebec | 5.14 | 5.02 | 5.48 |
| Ontario | 1.34 | 1.36 | 1.45 |
| Manitoba | 0.86 | 0.89 | 0.94 |
| Saskatchewan | 0.69 | 0.72 | 0.76 |
| Alberta | 0.68 | 0.65 | 0.75 |
| British Columbia | 0.90 | 0.89 | 0.96 |
| Yukon | 0.92 | 1.10 | 1.25 |
| Northwest Territories | 0.89 | 1.01 | 1.04 |
| Nunavut | 0.99 | 0.96 | 1.34 |
| Canada (outside Quebec) | 1.18 | 1.18 | 1.24 |
According to previous OLSP evaluations, the DOLC program has contributed to the vitality of OLMCs by maintaining an active community network and supporting the efforts of provincial and territorial governments. In addition, more organizations are providing services to OLMCs in a growing number of areas. Some of these organizations have collaborated with various institutions at different levels of government.
Long-term outcomes
Viability of OLMCs
Although there is progress in DOLC contribution to medium-term outcomes, the viability of OLMCs remains fragile. In fact, during the evaluation period, there was a decrease in the demographic weight of Francophone OLMCs and in the number of students in minority schools for Anglophone OLMCs. These findings are indicators of the fragility of OLMC viability, particularly for Francophone OLMCs.
Given their different contexts and needs, the meaning of OLMC viability is quite different between Francophones and Anglophones and between rural and urban settings. For Francophone OLMCs, challenges to their viability are related to their ability to transmit their language, to live in French, and to ensure their demographic weight.Footnote 23 For Quebec’s OLMCs, the challenges to their viability lie more in the need to have better access to minority education, to be recognized, and to be able to participate fully in Quebec society. In fact, the viability of all OLMCs is threatened, in part because of demographic issues such as an aging population, the emigration of young people to large centres, and low fertility rates.Footnote 24 According to previous OLSP evaluations and key stakeholders, OLMCs are dependent on OLSP funding and if the program is no longer accessible, this could further weaken these communities. Viability also depends on the collaboration of many stakeholders, such as provincial, territorial, and municipal governments, as well as communities.
Finally, DOLC contribution to the viability of OLMCs is difficult to assess since the formulation and indicators are like the medium-term outcomes. According to some of the key stakeholders and experts consulted, it would be useful to consider the socioeconomic issues facing OLMCs so that their development capacity and viability can be more properly measured. In the performance measures section, 4.2.3, this issue will be discussed further.
4.2.2. EOL Program
From 2003 to 2021, to what degree has the EOL program had medium- and long-term impacts nationally and regionally?
- The OLSPs contribute to a better understanding and appreciation of the benefits of both official languages and to the learning of a second official language.
- Between 2003-04 and 2019-20, the number of students in second language learning programs (without French immersion) outside Quebec has decreased, while the supply of French immersion programs is not meeting the growing demand.
- The bilingualism rate of Canadians has increased only slightly between 2006 and 2021. More specifically, the rate of bilingualism in Quebec during this period has increased significantly, while it has decreased in Canada outside Quebec.
- This is despite an increase in the number of students enrolled in second language learning programs. The EOL program’s efforts to increase working knowledge of both official languages appear insufficient to increase the national rate of bilingualism.
- There is a gap between the ambitiousFootnote 25 goals of the EOL program and its funding. Furthermore, the results chain does not provide a good measure of EOL’s long-term outcome.
Medium-term outcomes
Canadians have a better understanding and appreciation of the benefits of both official languages.
Since 2003, OLSPs have contributed to a better understanding and appreciation by Canadians of the benefits of both official languages. Comparative analysis of public opinion surveys confirms that a high rate of Canadians recognizes the benefits of bilingualism throughout the evaluation period. Francophones are more likely than Anglophones to agree that both official languages play an important role in Canadian identity.
Canadians generally agree that the two official languages are an important part of what it means to be Canadian. Research also shows that Canadians support official languagesFootnote 26 and that language is an essential part of their identity, especially among Francophones and allophones.Footnote 27
In addition, public opinion survey data shows that Canadians perceive that learning both official languages is an asset in obtaining employment. According to the expert panel, Canadians are learning French and English because of its importance in today’s job market. While many Canadians generally see the economic benefits of being bilingual, some key stakeholders argue that this appreciation may go beyond economic arguments. Knowledge of both official languages also has various advantages related to culture and social cohesion.
More Canadians have a working knowledge of both official languages.
The OLSPs facilitate access to second-language education. The total number of students enrolled in second-language learning programs increased slightly between 2003 and 2020, growing from 2.4 million in 2003-04 to 2.5 million in 2019-20 (Table 9). This increase is attributed primarily to the growth of French immersion programs across the country. Enrollment increased by 72% during the evaluation period, from 282,839 to 487,191 students. In Quebec, the number of students in second-language programs increased during the same period by 20%, from 650,113 to 777,072 students.
However, the number of students enrolled in French as a second language programs outside Quebec has decreased by approximately 16% from 1.5 million to 1.3 million students. In fact, the total number of students in these provinces also declined during the same period, from 4.76 million to 4.70 million, a decrease of about 1%. From 2003-04 to 2019-20, the number of majority language students enrolled outside of Quebec has declined by 1.6%. Thus, the decrease in the number of students enrolled in French as a second language programs outside Quebec is more significant than the decrease in the total number of majority language students, which represents a disturbing trend in official language learning.
| Regions | 2003-04 | 2019-20 | Difference | Variation |
|---|---|---|---|---|
| Outside Quebec (French immersion) | 282,839 | 487,191 | 204,352 | 72% |
| Outside Quebec (without immersion) | 1,506,258 | 1,263,225 | - 243,033 | -16% |
| Quebec | 650,113 | 777,072 | 126,959 | 20% |
| Canada (total) | 2,439,210 | 2,527,488 | 88,278 | 4% |
Source: Research Team, Official Languages Branch, Canadian Heritage.
French immersion programs lack qualified teachers to meet the ever-growing enrollment demand.Footnote 28 Between 1,000 and 1,400 teaching positions would need to be filled for French immersion programs and between 7,000 and 8,000 for all other French second language programs across the country. These shortages are estimated to affect 42% of immersion schools and approximately one third of French second-language schools.Footnote 29 In some provinces where there is a large gap between supply and demand for these programs, waiting lists or lotteries to secure a spot have been created.Footnote 30
In general, according to the censuses, the bilingualism rates of Canadians increased very slightly between 2006 and 2021, remaining low and only growing from 17.4% to 18% (Table 10). To be more specific, over this period, the rate of bilingualism in Quebec increased significantly, from 40.6% to 46.4%, but the rate of bilingualism of Canadians outside Quebec decreased from 10.2% to 9.5%.
| Regions | 2006 | 2011 | 2016 | 2021 |
|---|---|---|---|---|
| Canada | 17.4% | 17.5% | 17.9% | 18.0% |
| Outside Quebec | 10.2% | 9.8% | 9.9% | 9.5% |
| Quebec | 40.6% | 42.8% | 44.7% | 46.4% |
Source: Statistics Canada, 2006 to 2021 Censuses.
The bilingualism rate of Canadian youth aged 15 to 19 increased by 4.4% between 2006 and 2021 (Table 11). This increase is attributable to the increase in bilingualism in Quebec, which rose by almost 17 percentage points. At the same time, the overall bilingualism rate of young Canadians is higher than it is for youth outside Quebec, especially Anglophones.
| Regions | 2006 | 2011 | 2016 | 2021 |
|---|---|---|---|---|
| Canada | 22.4% | 22.7% | 24.7% | 26.8% |
| Outside Quebec | 15.0% | 14.2% | 15.5% | 16.4% |
| Quebec | 48.0% | 51.8% | 58.8% | 65.1% |
Source: Statistics Canada, 2006 to 2021 Censuses.
According to a Statistics Canada study, the increase in the bilingualism rate of young Canadians outside Quebec between 2011 and 2016 can be explained by the increase in enrollment in French immersion programs and better retention of bilingual skills.Footnote 31 However, many Canadians do not have access to opportunities to practise their second official language once they finish school. Moreover, some of the experts consulted pointed out that a working knowledge of a language does not necessarily mean that Canadians will use it.
Another obstacle identified by the experts consulted is the feeling of language insecurity. For example, many Francophiles are not comfortable conversing in French, believing that their speaking skills are inadequate. For fear of being criticized, some refrain from using their second official language.
In sum, the rate of bilingualism in the population remained low over the evaluation period, particularly among English-speaking Canadians. Recognition of official languages does not necessarily translate into learning the second official language, especially outside Quebec.
Long-term outcomes
Canadians recognize and support the official languages.
The OLSPs help ensure that Canadians recognize and support the official languages. According to several key stakeholders, Canadians have become more open to official languages since 2003. Various surveys show a high level of support for official languages among Canadians. However, while Canadians support official languages, the rate of bilingualism in the country has remained low since 2006.
Several key stakeholders mentioned that funding for the EOL program was insufficient to support its ambitious goals. The 2009 evaluation noted that more resources were needed to contribute to the EOL program’s intended outcomes. Key stakeholders also indicated that the wording of the long-term outcome was not clear enough, thereby limiting its contribution. Furthermore, this outcome overlaps with the medium-term outcome, which affects the logic of the EOL results chain. As with DOLC, the long-term outcomes of EOL are difficult to measure because of their formulation and indicators, which are like medium-term outcomes.
4.2.3 OLSP performance measures
The OLSP performance measures were adjusted during the evaluation period. Several indicators were modified in collaboration with recipients and stakeholders to make them more appropriate, quantitative, and capable of measuring long-term outcomes.
Some key stakeholders noted that the addition of indicators has made monitoring more complex because of the amount of information that needs to be collected. Some also argued that the indicators could be more closely aligned with the expected outcomes of the OLSPs and that more emphasis could be placed on qualitative indicators. The perception of the OLSP performance measurement was thus mixed. Some claim that it facilitates good OLSP management, while others believe that it should be easier to use and more adapted to the activities carried out by recipients.
The formulation of long-term outcomes for both DOLC and EOL overlaps with their medium-term outcomes and poses a challenge for measuring them properly. This is because the same indicator is used to measure DOLC’s second medium-term outcome and EOL’s first medium-term outcome as their respective long-term outcomes. This issue has a significant impact on measuring the effectiveness of OLSPs.
4.2.4. Barriers and catalysts
What barriers and catalysts have influenced the achieved outcomes?
- Several factors have influenced the contribution of the OLSPs by acting as both catalysts and barriers, such as funding, collaboration with the provinces and territories, the COVID-19 pandemic, OLSP structure, and labour shortages.
Various factors have acted as both obstacles and catalysts for OLSPs. First, the following factors have acted as catalysts:
- Funding has contributed to the development of OLMCs and the promotion of official languages in Canada. In addition, the use of multi-year agreements and the enhancement of the most recent 2018-23 Action Plan have been catalysts for OLSPs.
- Collaboration between the federal government and the provinces and territories has been an important catalyst for OLSPs, particularly in the education sector.
- The COVID-19 pandemic has contributed to cohesion and mutual support among some OLMC organizations and has allowed for flexibility in the use of funding.
OLSPs have also been affected by the following barriers:
- Funding has been a barrier for many recipients as it was not indexed to inflation from 2008-09 to 2017-18.
- Many felt that a better overall and long-term vision could be further developed between the federal and the provincial and territorial governments.
- The COVID-19 pandemic has created uncertainty in many recipient organizations, particularly in the community and cultural sectors.
- The administrative structure was seen by several key stakeholders as a barrier because it is complex and cumbersome, particularly due to delays in approval and funding.
- The shortage of qualified French language teachers has also been a significant barrier for OLSPs.
4.3. Efficiency
4.3.1. OLSP Design and Delivery
To what degree has the design and delivery of the OLSPs resulted in optimal efficiency of program resources? Could some aspects be improved?
- OLSPs have adapted their accountability during the evaluation period to improve efficiency.
- There were factors that limited OLSP delivery, such as the complexity of OLSP structure and funding, which increased only slightly between 2008-09 and 2017-18.
- Several key stakeholders argued that the funding formula is not sufficiently aligned with the current needs of the provinces and territories and that their accountability processes are not sufficiently transparent.
OLSP grant and contribution expenditures
Total OLSP grant and contribution expenditures increased from $264.3M to $401.4M between 2003-04 and 2019-20 (for a total of $5.8B), which represents an average annual increase of $8.6M or 2%. Contributions accounted for 97% of all funding from grants and contributions, while grants accounted for 3%.
As shown in Figure 6, OLSP grants and contributions increased from 2003-04 to 2005-06, and then stagnated until 2017-2018. More specifically, OLSP grants and contributions decreased between 2006-07 and 2017-18, representing an average annual decrease of $560.6K or 0.1%. This has limited the financial resources of recipients and, consequently, their contribution to the OLSP expected outcomes.
Subsequently, OLSP grants and contributions increased from 2018-19 to 2019-20 with new investments under the 2018-23 Action Plan. This recent increase is seen by many key stakeholders as a catch-up rather than a real improvement.
Source: PCH financial data
Figure 6: total OLSP grants and contributions, 2003-04 to 2019-20 – text version
| Fiscal year | OLSP Expenditure |
|---|---|
| 2003-04 | 264 257 559 |
| 2004-05 | 300 263 331 |
| 2005-06 | 341 470 897 |
| 2006-07 | 340 194 966 |
| 2007-08 | 355 602 392 |
| 2008-09 | 353 530 688 |
| 2009-10 | 351 479 343 |
| 2010-11 | 340 561 244 |
| 2011-12 | 345 180 279 |
| 2012-13 | 340 688 196 |
| 2013-14 | 336 105 054 |
| 2014-15 | 340 896 744 |
| 2015-16 | 342 653 178 |
| 2016-17 | 349 544 205 |
| 2017-18 | 348 197 797 |
| 2018-19 | 376 163 138 |
| 2019-20 | 401 412 890 |
DOLC and EOL grant and contribution expenditures
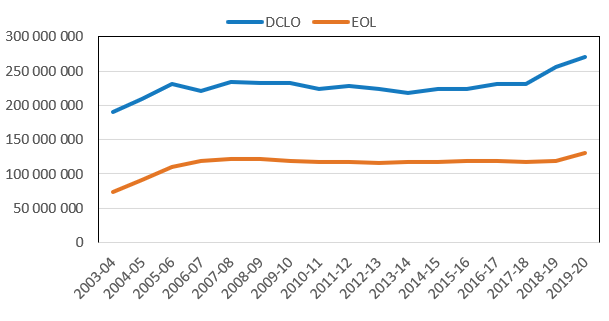
Total DOLC grant and contribution expenditures increased from $190.1M to $270.3M, totalling $3.9B. Total EOL grant and contribution expenditures increased from $74.1 million to $131.1 million, totalling $1.9 billion (Figure 7).
As a result, the DOLC program received a larger proportion of grants and contributions. This gap between the two programs subsequently decreased over the evaluation period. DOLC’s proportion of grants and contributions decreased from 73% to 67%, while EOL’s proportion increased from 27% to 33% between 2003-04 and 2019-20.
Several key program stakeholders have referred to EOL as the “poor relation” of OLSPs because of the gap between its objectives and its funding. According to them, EOL requires more financial resources to achieve its objectives. For example, one key stakeholder mentioned that there is a large volume of requests through EOL that cannot be met due to lack of funding. “Having more would help a lot to have better results.” In interviews, the importance and progress of DOLC were recognized and some key stakeholders would like to replicate this progress for EOL, without redistributing resources from DOLC to EOL.
Source: PCH financial data
Figure 7: DOLC and EOL grants and contributions, 2003-04 to 2019-20 – text version
| Fiscal year | Total DCLO | Total EOL |
|---|---|---|
| 2003-04 | 190,143,422 | 74,114,137 |
| 2004-05 | 209,311,144 | 90,952,187 |
| 2005-06 | 231,137,454 | 110,333,443 |
| 2006-07 | 221,516,799 | 118,678,167 |
| 2007-08 | 233,826,441 | 121,775,951 |
| 2008-09 | 232,057,467 | 121,473,221 |
| 2009-10 | 232,010,976 | 119,468,367 |
| 2010-11 | 223,751,206 | 116,810,038 |
| 2011-12 | 228,311,417 | 116,868,862 |
| 2012-13 | 224,538,971 | 116,149,225 |
| 2013-14 | 217,992,849 | 118,112,205 |
| 2014-15 | 224,024,166 | 116,872,578 |
| 2015-16 | 224,185,827 | 118,467,351 |
| 2016-17 | 231,275,084 | 118,269,121 |
| 2017-18 | 230,558,029 | 117,639,768 |
| 2018-19 | 256,563,541 | 119,599,597 |
| 2019-20 | 270,308,814 | 131,104,076 |
OLSP expected and actual expenditures
Except for the 2019-20 fiscal year, actual grant and contribution expenditures have exceeded expected expenditures in every fiscal year since 2003–04, amounting to an average annual shortfall of $8.2M or 2.4%.
Specifically, actual annual grant expenditures were below expected annual expenditures, averaging an annual surplus of $34.8M or 80%. Conversely, actual annual expenditures of contributions exceeded expected annual expenditures in each fiscal year, averaging an annual shortfall of $42.9 million or 15% (see Appendix E).
For DOLC, actual annual expenditures of grants and contributions were below expected amounts in nine fiscal years and were above in eight fiscal years, for an average annual surplus of $1.5M or 0.7%. For EOL, actual annual expenditures of grants and contributions exceeded expected annual expenditures throughout the evaluation period, for an average annual shortfall of $6.6M or 6% (see Appendix F).
Operating expenditures
Total OLSP operating expenditures between 2009-10 and 2019-20 increased from $14.1M to $17.1M, for an average annual increase of $293K or 3%Footnote 32 (Table 12). Specifically, salary and benefit expenditures decreased between 2012-13 and 2019-20, averaging $306K or 2% annually for salaries and $92.2K or 5% for benefits. Operations and maintenance expenditures also decreased from 2012-13 to 2018-19, and then increased in 2019-20 by $3.6M. The annual average decrease in total operating amounts coupled with the addition of subcomponents illustrates the program’s efficiency. However, key stakeholders noted that the efficiency of OLSPs has been limited by high staff turnover.
| Fiscal year | Salaries | Benefits | Operations and maintenance | Total |
|---|---|---|---|---|
| 2009-10 | Unavailable | Unavailable | Unavailable | 14.2 |
| 2010-11 | Unavailable | Unavailable | Unavailable | 13.9 |
| 2011-12 | Unavailable | Unavailable | Unavailable | 14.3 |
| 2012-13 | 12.9 | 2.1 | 1.5 | 16.5 |
| 2013-14 | 10.3 | 1.7 | 1.3 | 13.3 |
| 2014-15 | 10.0 | 1.6 | 1.6 | 13.2 |
| 2015-16 | 10.3 | 1.6 | 1.6 | 13.5 |
| 2016-17 | 9.9 | 1.5 | 2.0 | 13.4 |
| 2017-18 | 10.7 | 1.4 | 1.3 | 13.4 |
| 2018-19 | 10.8 | 1.4 | 1.3 | 13.5 |
| 2019-20 | 10.8 | 1.4 | 4.9 | 17.1 |
| Total | 85.7 | 12.8 | 15.5 | 156.3 |
Source: PCH financial data.
Administrative cost ratio
The administrative cost ratio is an indicator of program efficiency based on the administrative costs of delivering grants and contributions. This ratioFootnote 33 has changed only slightly over the evaluation period, ranging from 3% to 4% between 2009-10 and 2020-21. The average administrative cost ratio is 4%. Despite the addition of components and subcomponents throughout the evaluation period, the ratio remained stable.
OLSP structure
The structure of OLSPs has become more complex due to the addition of components and subcomponents since 2003. The expansion of OLSPs has increased the administrative workload of program staff. Furthermore, the addition of initiatives has created an imbalance in the distribution of OLSP grant and contribution funding. Most of the expenditures were allocated to the two Intergovernmental Cooperation subcomponents in education during the evaluation period. These subcomponents account for 72% of total DOLC funding and 93% of total EOL funding. At the same time, eight OLSP subcomponents received less than 0.1% of total grant and contribution funding for the same period (see Appendix F). According to key stakeholders, the OLSP funding structure creates additional processes and should be reviewed for clarity and efficiency.
Finally, the role of the various regional offices and headquarters was found to differ across the provinces and territories. Some key stakeholders said that they work primarily with their regional office, while others said they work only with headquarters. A few key stakeholders indicated that communication and collaboration between regional offices and headquarters could be improved, for example by clarifying roles.
Perceptions of funding challenges and improvements
The funding formula for the provincial/territorial and federal governments are seen as positive. However, several key stakeholders expressed the desire to have a better understanding of the rationale behind the amounts allocated to each province and territory. The amounts allocated are perceived to be insufficiently aligned with the changing demographics and specific needs of each province and territory. For example, the amounts allocated are not proportional to the number of students in second-language instruction and minority-language education, or to the number of individuals belonging to OLMCs.
Key stakeholders also mentioned that the application process could be streamlined and that applicants could be given access to the status of their application. Using an online platform would facilitate the application process. Furthermore, key stakeholders indicated that the time between the posting of forms online and the submission of funding applications was too short, particularly for smaller organizations with limited resources to apply for funding.
The time between funding negotiations and the announcement of the amount awarded was, for some organizations, too long. Some had to spend funds before receiving confirmation of a positive decision. A representative of a group working for linguistic duality stated that “Information is not readily available. Negotiations are between the federal and provincial governments, so we are not very well informed. We are often presented with a fait accompli.” Some key stakeholders suggested that funding criteria could be made more flexible to better align with the objectives of the organizations and the provinces and territories. For example, during the COVID-19 pandemic, it was reported that OLSPs adopted more flexible practices for managing funds by, for example, reallocating federal financial support for the following year.
Several key stakeholders would like to see the OLSPs focus onFootnote 34 core, recurring funding for a single project rather thanFootnote 35 project-based, non-recurring funding. Some key stakeholders proposed the intermediate funding model for this purpose. Under this approach, federal institutions would work with stakeholders to develop initiatives, while intermediary organizations would be responsible for delivering these initiatives. According to some key stakeholders, this is an avenue that would simplify the administrative structure.
The accountability processes
Accountability processesFootnote 36 have been streamlined and adapted since 2009 with a focus on more targeted data collection. The changes have resulted in more effective accountability processes than in the past, according to key stakeholders. However, some argued that it could be more useful, streamlined, and aligned with desired OLSP outcomes, and that it should be delivered in a timely manner to inform decision-making. Some suggested that accountability should be tailored to the size of the organization, that there should be less text and more video and photos of projects, and that digital reports should be used. At the same time, program staff are reporting that they are facing increasing demands for accountability. This presents an opportunity to provide accountability that accommodates both federal government requirements and the needs of recipients.
For some key stakeholders, provincial and territorial accountability is not sufficiently transparent. Some OLMC representatives are questioning the use of funds and compliance with the provincial and territorial matching obligations required by the OLSPs. Furthermore, there is a lack of accessible information on the use of provincial and territorial funds to be able to determine how they are distributed.
4.3.2. Collaboration with stakeholders
How can collaboration with stakeholders be optimized to achieve the desired outcomes of the OLSPs?
- Since 2003, cooperation between the OLSPs and the provinces and territories has been generally positive and has improved over the evaluation period. For example, improvements to bilateral agreements have fostered cooperation on official languages between the federal government and the provinces and territories.
- Despite this progress, an opportunity exists to further develop this cooperation, which is essential to the operation of the OLSPs. For example, it was noted that provinces and territories would prefer to be consulted more at the planning stage. They would also like the consultations to be more meaningful.
Intergovernmental collaboration is essential to the implementation of the program. Between 2003-04 and 2020-21, the OLSPs concluded protocolsFootnote 37 on minority-language education for every province and territory, as well as protocols on second-official-language education for every province and territory except Quebec.Footnote 38 Improvements and recommendations from previous evaluations included adding stakeholder consultation clauses to funding agreements and ensuring collaboration between components and subcomponents.Footnote 39
These agreements account for at least 80% of the OLSP budget. This funding helps supports provincial and territorial governments in official languages. As such, the number of strategic plans, policies, laws, and regulations that support official languages and OLMCs across Canada has increased since 2003.Footnote 40
Despite the legislative and administrative support of the provinces and territories, challenges remain with respect to this support due to funding cuts in post-secondary French-language education in a minority context. According to some key stakeholders representing provincial and territorial governments, cooperation between the OLSPs and the provinces and territories could be improved by holding more consultations at the planning stage to ensure that the two levels of government are better aligned with respect to official languages. It was specified that these consultations must be meaningful and have a real impact on what direction the OLSPs take.
Finally, key stakeholders have suggested that an opportunity exists to further foster collaboration among recipient organizations. Others reported that organizations work mostly in silos. Still others mentioned that OLSP staff turnover affects collaboration between recipients and the program because of the difficulty of establishing stable contacts over time.
5. Conclusion
This longitudinal evaluation confirms the relevance of OLSPs throughout the evaluation period. OLSPs have supported the development of OLMCs, the promotion of linguistic duality, and official language learning. OLSPs fulfill the federal government’s constitutional and legislative commitments regarding official languages. In addition, official languages have grown in importance at PCH since 2003, becoming one of the Department’s five core responsibilities.
Since 2003, several measures were adopted to ensure alignment between OLSPs and the official languages needs of Canadians and OLMCs. For example, consultations were held and components and subcomponents were added to improve responsiveness to the needs of OLMCs and Canadians. The structural changes, however, have made OLSPs more complex by creating an imbalance in funding between components and subcomponents.
OLSPs are effective in helping to achieve the desired medium- and long-term outcomes. The DOLC program has helped with access to infrastructure, programs, services, and education in the minority language, which enhances the vitality and development of OLMCs. However, the number of students in minority-language schools has increased only slightly in Canada and has decreased for Anglophone OLMCs in Quebec between 2003-04 and 2019-20. Moreover, since 2006, the demographic weight of Francophone OLMCs has decreased while that of Anglophone OLMCs has increased slightly. Therefore, the sustainability of OLMCs remains fragile, particularly that of Francophone OLMCs.
The EOL program ensures a better understanding and appreciation of the benefits of both official languages and of learning a second official language. The number of students enrolled in second language programs has increased in Quebec, while it has decreased in the rest of Canada. Furthermore, the number of students in French immersion has increased, but the supply of this program cannot meet the growing demand. In addition, there are few opportunities for Canadians to practise their second official language once they have completed their education. Compared to DOLC, EOL has more limited funding to contribute to its ambitious goals. Therefore, an opportunity exists to align its goals more closely with the resources provided.
Despite the alignment and contribution of the OLSPs, several minority-language and second-language education needs require special attention, such as access to post-secondary education in the minority language, recruitment of eligible persons, and the shortage of qualified teachers.
Specifically, the OLSP results chain does not provide a good measure of expected long-term outcomes. Their formulation and indicators overlap with those of the expected medium-term outcomes.
OLSP efficiency improved during the evaluation, particularly by adapting accountability and collaboration with stakeholders. Despite this progress, several key stakeholders noted that an opportunity exists to make accountability more responsive to the needs of recipients while meeting the requirements of the Government of Canada. Some suggested that accountability should be tailored to the size of the organization, digitized, and more focused.
Some factors have also limited OLSP delivery, such as the complexity of the OLSP structure due to the addition of components and subcomponents, and grant and contribution amounts that have increased minimally between 2008-09 and 2017-18. Finally, several key stakeholders believe that the funding formula is not sufficiently aligned with the current needs of the provinces and territories and that the accountability processes of the provinces and territories are not sufficiently transparent.
6. Recommendations, management response, and action plan
Considering the findings and conclusions of the evaluation, three recommendations are made to address areas requiring attention for the improvement of OLSP effectiveness and efficiency.
Recommendation 1
The evaluation recommends that the Assistant Deputy Minister, Official Languages, Heritage and Regions, review the structure, priorities and objectives of the Official Languages Support Programs (OLSPs), with particular attention to the objectives of the Enhancement of Official Languages (EOL) Program.
Management response
The Official Languages Branch (OLB) agrees with the recommendation of the evaluation.
PCH’s Official Languages, Heritage and Regions Sector, which includes the OLB’s and PCH’s regional offices, is aware of the importance of reviewing the structure of the OLSPs. The OLSPs represent the Federal Government’s largest investment in official languages, totalling over $565 million per year, and its structure has become considerably more complex over the years.
Nevertheless, this review must take into account the current context, including:
- The fact that Bill C-13: An Act to amend the Official Languages Act, to enact Use of French in Federally Regulated Private Businesses Act and to make related amendments to other Acts, tabled on March 1, 2022, is currently before Parliament. Bill C-13 could be passed in May 2023 and receive Royal Assent as early as June 2023.
- The ongoing development of the next Action Plan for Official Languages for 2023–2028 and its implementation. The new Action Plan is expected to be announced by March 2023.
- The fact that some of the OLSPs are part of the third cohort of the corporate program review project with the Equity, Diversity and Inclusion (EDI) Lens (Fall 2022 / Winter 2023).
The restructuring of the OLSPs must comply with the Treasury Board’s Policy on Transfer Payments (2008), other directives, and PCH’s transfer payment rules (program terms and conditions, and guidelines, etc.). These changes will also have an impact on the communication of the rules for program applicants/recipients, which will be reflected on PCH’s website.
Furthermore, as required by s. 43(2) of the current Official Languages Act for PCH action, the OLB must ensure that it consults the public and maintains an ongoing dialogue with the OLSP recipients throughout the fiscal year to secure their involvement and commitment.
The goal is to make the structure of the OLSPs simpler, more flexible, and more sustainable. The new structure could therefore be established at a more global level, which would make it possible to reflect the legislative objectives, provisions, and changes in official languages policies for which PCH is/will be naturally responsible, to include or modify programs without calling it into question, to clarify delivery channels to recipients (including identifying and removing systemic barriers in accessing OLSPs in terms of EDI or other issues), and to facilitate transparent accountability on a regular and consistent basis while allowing for adjustment to circumstances (e.g. developing flexible requirements to address specific issues or to make room for innovative projects).
Consideration of a possible restructuring of the OLSPs has already begun. In 2020, the OLB commissioned an exploratory study on the OLSP restructuring at the Centre de leadership et d’évaluation (CLÉ). The CLÉ analyzed the development of the OLSPs through a series of interviews and literature study and examined five recent cases of program restructuring that could constitute good practices in this field.
In 2022, a project charter proposing an approach to initiate and implement restructuring of the OLSPs was also completed. The proposed project charter focuses on the multifaceted nature of the work to be carried out and its sometimes complex implications at various levels. In addition, the proposed timeline for the restructuring involves several steps, including consultations both internally at PCH (Grants and Contributions Centre, among others) and externally, with official languages stakeholders, consultations with the Treasury Board for approval of the proposed new structure, support from PCH’s communications services for the dissemination of the new structure on PCH’s website, etc. The current target date for adoption of the new structure is Fall 2025, with an effective date of April 1, 2026.
| Action plan item | Deliverable | Timetable | Person in charge |
|---|---|---|---|
| 1.1. Review the OLSP structure taking into account the legislative context (objectives and provisions of the new Act) and ongoing policy development (new Action Plan for 2023–28). | 1.1.1. Report outlining the various possible scenarios (approved at DG level) | December 2023 | OLB Research and Strategic Planning Team |
| 1.1.2. Approval of the new OLSP structure (ADM level) | March 2024 | OLB Research and Strategic Planning Team | |
| 1.1.3 Approval of documents related to the new OLSP structure by the central agencies involved | September 2024 | OLB Research and Strategic Planning Team | |
| 1.1.4 New structure posted on the website | December 2024 | OLB Research and Strategic Planning Team |
Full implementation date: December 2024
Recommendation 2
The evaluation recommended that the Assistant Deputy Minister, Official Languages, Heritage and Regions, review the results chain to improve the consistency of the logic model and the indicators associated with it.
Management response
The OLB agrees with the recommendation of the evaluation.
The planned restructuring of the OLSPs will include a complete reframing of the results chain to improve the consistency of the logic model and the associated indicators.
This approach is designed to make the structure of the OLSPs simpler, more flexible, and more sustainable.
| Action plan item | Deliverable | Timetable | Person in charge |
|---|---|---|---|
| 2.1. Identify a result chain based on the preferred logic model for the new OLSP structure and identify the associated indicators using relevant and reliable evidence. | 2.1.1. Document proposing results/indicators based on the identified evidence (approved at DG level) | December 2024 | OLB Research and Strategic Planning Team |
| 2.2. Review the structure of the OLB’s Performance Information Profile (PIP) to reflect the new OLSP structure | 2.2.1. New version of the PIP approved (approved at DG level) | April 2025 | OLB Research and Strategic Planning Team |
Full implementation date: April 2025
Recommendation 3
The evaluation recommends that the Assistant Deputy Minister, Official Languages, Heritage and Regions, review the accountability process and the collection of targeted data to strengthen informed decision-making.
Management response
The OLB agrees with the recommendation of the evaluation.
The planned restructuring of the OLSPs will include a review of the accountability process and the collection of targeted data to strengthen informed decision-making.
Statistics Canada has made efforts to collect disaggregated data. Statistics Canada also intends to collaborate with its program recipients to maximize data collection opportunities.
In recent years, the OLB has developed two frameworks associated with the results chain: the Framework for the Vitality of Official-Language Minority Communities and the Linguistic Duality Framework. Both these tools will help to improve the results chain.
| Action plan item | Deliverable | Timetable | Person in charge |
|---|---|---|---|
| 3.1. Establish a schedule for the regular collection of evidence related to the results chain (Statistics Canada, opinion polls, etc.) | 3.1.1. Detailed list (Excel) of sources used including expected release dates (approval at DG level) | December 2024 | OLB Research and Strategic Planning Team |
| 3.2. Implement a system for regular data collection from the various OLSP recipients based on the expected results. | 3.2.1. Follow-up table on data collection according to the PIP | April 2025 | OLB Research and Strategic Planning Team |
Full implementation date: April 2025
Appendix A: evaluation framework
| Indicators | Targeted review of relevant literature | Document and file review | Data analysis | Stakeholder interviews | Case studies | Public opinion surveys | Experts’ panel |
|---|---|---|---|---|---|---|---|
| 1.1 - Alignment (perceived and documented) between program changes and the identified needs of Canadians | X | X | X | - | - | X | |
| 1.2 - Changes in the official language needs of Canadians from 2003 to 2021 | X | X | - | X | - | X | |
| 1.3 - Stakeholders’ perceptions (internal and external) of the changing official language needs of Canadians from 2003 to 2021 | - | - | - | X | - | - | - |
| 1.4 - Attitudes, perceptions, and aspirations of OLMCs regarding their individual and collective development and growth | - | - | - | - | - | X | - |
| 1.5 - Attitudes, perceptions, and aspirations of Canadians regarding their knowledge and appreciation of both official languages | - | - | - | - | - | X | - |
| 1.6 - Comparison and evolution of the needs of Francophone and Anglophone minority communities | X | - | X | X | X | - | - |
| Indicators | Targeted review of relevant literature | Document and file review | Data analysis | Stakeholder interviews | Case studies | Public opinion surveys | Experts’ panel |
|---|---|---|---|---|---|---|---|
| 2.1 - Historic development of the Government of Canada’s role in official languages (in relation to the constitutional, legislative, and policy frameworks) | X | X | - | - | - | - | - |
| 2.2 - Links (perceived and documented) between the objectives of the DOLC program and the priorities of PCH and the Government of Canada | X | X | - | X | - | X | - |
| 2.3 - Links (perceived and documented) between the objectives of the EOL program and the priorities of PCH and the Government of Canada | X | X | - | X | - | X | - |
| 2.4 - Evolution of OLSPs in relation to Government of Canada priorities from 2003 to 2021 (including GBA Plus) | X | X | - | X | - | - | - |
| Indicators | Targeted review of relevant literature | Document and file review | Data analysis | Stakeholder interviews | Case studies | Public opinion surveys | Experts’ panel |
|---|---|---|---|---|---|---|---|
| 3.1 - Trends in the degree of collaboration among multiple partners for the development and vitality of OLMCs | - | X | X | - | X | - | - |
| 3.2 - Comparison of education levels using the minority-majority index | - | - | X | - | - | - | - |
| 3.3 - Trends in the measurement of OLMC vitality indicators | - | - | X | - | - | - | X |
| 3.4 - Trends in the percentage of OLMC members living within 25 km of a minority language elementary or high school | - | - | X | - | - | - | - |
| 3.5 - Trends in the percentage of OLMC members living within 25 km of a regional/local community development organization | - | - | X | - | - | - | - |
| 3.6 - Trends in the proportion of OLMC members living within 25 km of a cultural/artistic organization | - | - | X | - | - | - | - |
| 3.7 - Trends in the linguistic continuity rate | - | - | X | - | - | - | - |
| 3.8 - Perceptions of all stakeholders and experts regarding the achievement of medium- and long-term outcomes | - | X | - | X | X | - | X |
| 3.9 - Level of stakeholder satisfaction with partner integration and connections | - | X | X | X | X | X | - |
| 3.10 - Level of maturity of community partnerships over time | - | - | - | - | X | - | - |
| 3.11 - Key OLSP stakeholder evidence and perceptions of unexpected outcomes | - | - | X | - | - | - | - |
| Indicators | Targeted review of relevant literature | Document and file review | Data analysis | Stakeholder interviews | Case studies | Public opinion surveys | Experts’ panel |
|---|---|---|---|---|---|---|---|
| 4.1 - Trends in the degree to which official languages are recognized and supported by all Canadians | X | - | X | - | - | X | - |
| 4.2 - Trends in the bilingualism rate of Canadian youth (15–19 years old) | X | - | X | - | - | - | - |
| 4.3 - Trends in the perception of Canadians with respect to linguistic duality and official languages | X | - | X | - | - | X | X |
| 4.4 - Perceptions of all OLSP stakeholders regarding the achievement of the EOL program’s medium- and long-term outcomes | - | X | - | X | X | X | - |
| 4.5 - Trends in the perception of rapprochement between majority and minority language communities | X | - | - | - | X | X | X |
| 4.6 - Key OLSP stakeholder evidence and perceptions of unexpected outcomes | - | - | X | X | - | - | - |
| Indicators | Targeted review of relevant literature | Document and file review | Data analysis | Stakeholder interviews | Case studies | Public opinion surveys | Experts’ panel |
|---|---|---|---|---|---|---|---|
| 5.1 - Perceptions of all OLSP stakeholders on barriers and catalysts | - | X | - | X | X | - | - |
| 5.2 - Influence (perceived and documented) of barriers to program implementation | - | X | - | X | X | - | - |
| 5.3 - Influence (perceived and documented) of catalysts on program implementation | - | X | - | X | X | - | - |
| Indicators | Targeted review of relevant literature | Document and file review | Data analysis | Stakeholder interviews | Case studies | Public opinion surveys | Experts’ panel |
|---|---|---|---|---|---|---|---|
| 6.1 - Perceived and documented links between OLSP design and delivery and optimal use of resources | - | X | X | X | - | - | X |
|
6.2 - Audit results
|
- | X | X | - | - | - | - |
| 6.3- Perceptions of PCH representatives regarding the efficiency of OLSP design and delivery | - | X | - | X | - | - | - |
| 6.4 - Trends in the level of stakeholder satisfaction with the program delivery model (including the national/regional aspect of implementation) | - | X | X | X | X | - | - |
| 6.5 - Trends in the allocation of resources of the two OLSP programs in relation to achieved outcomes | - | - | X | - | - | - | - |
| 6.6 - Comparison between national and regional levels in terms of resource allocation and efficiency | - | - | X | X | - | - | - |
| 6.7 - Perceptions of all OLSP stakeholders regarding the program management and implementation structure | - | X | - | X | - | - | X |
| 6.8 - Potential improvements to OLSP management and delivery method | - | X | - | X | - | - | X |
| Indicators | Targeted review of relevant literature | Document and file review | Data analysis | Stakeholder interviews | Case studies | Public opinion surveys | Experts’ panel |
|---|---|---|---|---|---|---|---|
| 7.1 - Evolution of departmental collaboration from 2003 to 2021 | - | X | - | X | X | - | - |
|
7.2 - Key stakeholder perceptions and data related to:
|
- | - | - | X | - | - | - |
Appendix B: interviews conducted with key stakeholders
| Stakeholder groups | Number of interviews |
|---|---|
| Internal key stakeholders: Exploratory interviews (planning phase) | 10 |
| Internal key stakeholders: PCH – OLSP Branch and Regional OLSP Managers (conducting phase) | 20 |
| Internal subtotal | 30 |
| External key stakeholders (conducting phase): Provinces and territories – minority language education and second language learning | 10 |
| External key stakeholders (conducting phase): Other stakeholders in the education sector (Council of Ministers of Education, Canada; school boards) | 3 |
| External key stakeholders (conducting phase): Provinces and territories – minority language services | 9 |
| External key stakeholders (conducting phase): OLMC representatives (Anglophone and Francophone communities) | 23 |
| External key stakeholders (conducting phase): Linguistic duality and second language groups | 7 |
| External subtotal | 52 |
| Total | 82 |
Appendix C: structure of OLSPs from 2003-04 to 2020-21
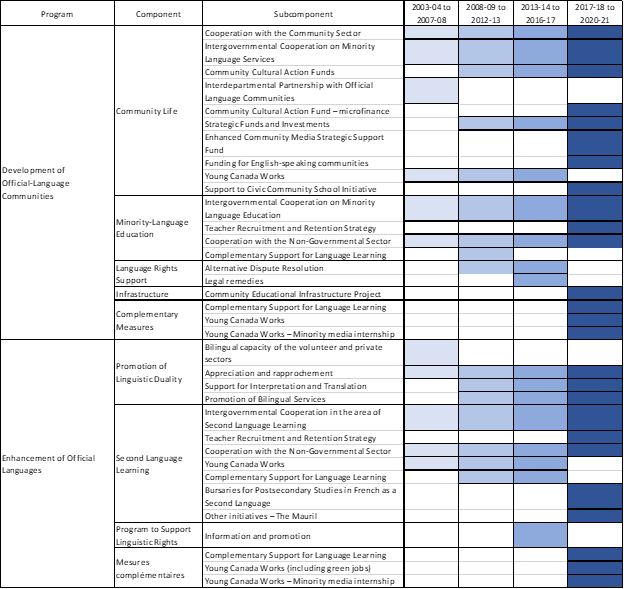
Sources: Reports: Evaluation of the OLSPs (2009), Performance measurement, evaluation, and risk strategy for OLSPs (May 2013), PIP of official languages (February 2020).
Annexe C: structure of OLSPs from 2003-04 to 2020-21 – text version
Program: Development of Official-Language Communities
| Subcomponent | 2003-04 to 2007-08 | 2008-09 to 2012-13 | 2013-14 to 2016-17 | 2017-18 to 2020-21 |
|---|---|---|---|---|
| Cooperation with the Community Sector | X | X | X | X |
| Intergovernmental Cooperation on Minority Language Services | X | X | X | X |
| Community Cultural Action Funds | - | X | X | X |
| Interdepartmental Partnership with Official Language Communities | - | X | X | X |
| Community Cultural Action Fund – microfinance | X | - | - | - |
| Strategic Funds and Investments | - | X | X | X |
| Enhanced Community Media Strategic Support Fund | - | - | - | X |
| Funding for English-speaking communities | - | - | - | X |
| Young Canada Works | X | X | X | - |
| Support to Civic Community School Initiative | - | - | - | X |
| Subcomponent | 2003-04 to 2007-08 | 2008-09 to 2012-13 | 2013-14 to 2016-17 | 2017-18 to 2020-21 |
|---|---|---|---|---|
| Intergovernmental Cooperation on Minority Language Education | X | X | X | X |
| Teacher Recruitment and Retention Strategy | - | - | - | X |
| Cooperation with the Non-Governmental Sector | X | X | X | X |
| Complementary Support for Language Learning | - | X | - | - |
| Subcomponent | 2003-04 to 2007-08 | 2008-09 to 2012-13 | 2013-14 to 2016-17 | 2017-18 to 2020-21 |
|---|---|---|---|---|
| Alternative Dispute Resolution | - | X | X | - |
| Legal remedies | - | - | X | - |
| Sous-volet | 2003-2004 à 2007-2008 | 2008-2009 à 2012-2013 | 2013-2014 à 2016-2017 | 2017-2018 à 2020-2021 |
|---|---|---|---|---|
| Community Educational Infrastructure Project | - | X | X | X |
| Subcomponent | 2003-04 to 2007-08 | 2008-09 to 2012-13 | 2013-14 to 2016-17 | 2017-18 to 2020-21 |
|---|---|---|---|---|
| Complementary Support for Language Learning | - | - | - | X |
| Young Canada Works | - | - | - | X |
| Young Canada Works – Minority media internship | - | - | - | X |
Program: Enhancement of Official Languages
| Subcomponent | 2003-04 to 2007-08 | 2008-09 to 2012-13 | 2013-14 to 2016-17 | 2017-18 to 2020-21 |
|---|---|---|---|---|
| Bilingual capacity of the volunteer and private sectors | X | - | - | - |
| Appreciation and rapprochement | X | X | X | X |
| Support for Interpretation and Translation | - | X | X | X |
| Promotion of Bilingual Services | - | X | X | X |
| Subcomponent | 2003-04 to 2007-08 | 2008-09 to 2012-13 | 2013-14 to 2016-17 | 2017-18 to 2020-21 |
|---|---|---|---|---|
| Intergovernmental Cooperation in the area of Second Language Learning | X | X | X | X |
| Teacher Recruitment and Retention Strategy | - | - | - | X |
| Cooperation with the Non-Governmental Sector | X | X | X | X |
| Young Canada Works | X | X | X | - |
| Complementary Support for Language Learning | - | X | X | - |
| Bursaries for Postsecondary Studies in French as a Second Language | - | - | - | X |
| Other initiatives – The Mauril | - | - | - | X |
| Subcomponent | 2003-04 to 2007-08 | 2008-09 to 2012-13 | 2013-14 to 2016-17 | 2017-18 to 2020-21 |
|---|---|---|---|---|
| Information and promotion | - | - | X | - |
| Subcomponent | 2003-04 to 2007-08 | 2008-09 to 2012-13 | 2013-14 to 2016-17 | 2017-18 to 2020-21 |
|---|---|---|---|---|
| Complementary Support for Language Learning | - | - | - | X |
| Young Canada Works (including green jobs) | - | - | - | X |
| Young Canada Works – Minority media internship | - | - | - | X |
Appendix D: findings from previous OLSP evaluations
| Issues | Evaluation 2009 (covering the period from 2003-04 to 2007-08) | Evaluation 2013 (covering the period from 2008-09 to 2012-13) | Evaluation 2017 (covering the period from 2013-14 to 2016-17) |
|---|---|---|---|
| Relevance | All three evaluations confirmed the relevance of OLSPs. It was concluded that the Program meets Canadians’ official languages needs and the Government of Canada’s constitutional and legislative obligations with respect to official languages. | All three evaluations confirmed the relevance of OLSPs. It was concluded that the Program meets Canadians’ official languages needs and the Government of Canada’s constitutional and legislative obligations with respect to official languages. | All three evaluations confirmed the relevance of OLSPs. It was concluded that the Program meets Canadians’ official languages needs and the Government of Canada’s constitutional and legislative obligations with respect to official languages. |
| Effectiveness | Overall, the activities funded under the Community Life, Minority-Language Education, and Promotion of Linguistic Duality components contributed to the achievement of OLSP expected outcomes. Some interaction between the components and other parts of the OLSPs was also noted, but this interaction remains minimal and the very structure of the OLSPs does not systematically encourage such collaboration. As they share common goals, a more direct interaction between the components is preferable. | Overall, the OLSPs are achieving their objectives and showing positive results. | OLSP activities contribute to the achievement of immediate outcomes. However, it was difficult to measure medium- and long-term outcomes, particularly for the Minority-Language Education and Second Language Learning components, due to the five-year evaluation cycle versus the time frames associated with provincial and territorial reporting. |
| Efficiency |
A cost-effectiveness and alternatives analysis concluded that, in general, OLSPs are an effective approach for guiding PCH intervention in the area of official languages. Accountability poses significant challenges for recipient groups, but also for minority language education and services (costly and of limited use). |
The financial resources of OLSPs were used according to the budget allocation. Progress has been made in streamlining the accountability process (reduction in the number of reports for provinces and territories, and with a particular emphasis on more targeted information). |
There is a limited amount of information to systematically demonstrate the efficiency and economic benefit of OLSPs. However, it was noted that:
|
Sources: PCH, Evaluations of the OLSPs, 2009, 2013, and 2017.
Appendix E: actual and expected expenditures for OLSPs, 2003-04 to 2020-21
| Fiscal year | Expected grants | Expected contributions | Expected total |
|---|---|---|---|
| 2003-04 | 46,083,842 | 211,979,036 | 258,062,878 |
| 2004-05 | 47,734,842 | 246,313,706 | 294,048,548 |
| 2005-06 | 47,734,542 | 276,051,469 | 323,786,011 |
| 2006-07 | 47,734,542 | 274,685,438 | 322,419,980 |
| 2007-08 | 41,244,775 | 292,272,238 | 333,517,013 |
| 2008-09 | 41,920,611 | 310,223,789 | 352,144,400 |
| 2009-10 | 41,921,000 | 294,790,000 | 336,711,000 |
| 2010-11 | 38,922,815 | 298,632,300 | 337,555,115 |
| 2011-12 | 38,922,815 | 297,721,206 | 336,644,021 |
| 2012-13 | 38,922,815 | 297,721,206 | 336,644,021 |
| 2013-14 | 38,922,815 | 294,272,306 | 333,195,121 |
| 2014-15 | 38,922,815 | 297,022,306 | 335,945,121 |
| 2015-16 | 38,922,815 | 298,522,306 | 337,445,121 |
| 2016-17 | 38,922,815 | 298,272,306 | 337,195,121 |
| 2017-18 | 38,922,815 | 307,772,306 | 346,695,121 |
| 2018-19 | 38,922,815 | 313,664,368 | 352,587,183 |
| 2019-20 | 76,327,815 | 338,464,368 | 414,792,183 |
| Total | 741,007,304 | 4,948,380,654 | 5,689,387,958 |
Note: The difference between actual and expected is the actual amount less the expected amount. A positive value indicates a deficit for the fiscal year. The difference in proportion is the difference between the actual and expected amount in proportion to the expected amount.
Source: PCH financial data.
| Fiscal year | Actual grants | Actual contributions | Actual total |
|---|---|---|---|
| 2003-04 | 5,933,186 | 258,324,373 | 264,257,559 |
| 2004-05 | 5,064,771 | 295,198,560 | 300,263,331 |
| 2005-06 | 5,325,804 | 336,145,093 | 341,470,897 |
| 2006-07 | 5,389,433 | 334,805,533 | 340,194,966 |
| 2007-08 | 7,696,125 | 347,906,267 | 355,602,392 |
| 2008-09 | 8,959,403 | 344,571,285 | 353,530,688 |
| 2009-10 | 7,247,340 | 344,232,003 | 351,479,343 |
| 2010-11 | 6,758,588 | 333,802,656 | 340,561,244 |
| 2011-12 | 6,509,118 | 338,671,161 | 345,180,279 |
| 2012-13 | 8,038,410 | 332,649,786 | 340,688,196 |
| 2013-14 | 7,659,907 | 328,445,147 | 336,105,054 |
| 2014-15 | 7,211,295 | 333,685,449 | 340,896,744 |
| 2015-16 | 7,232,171 | 335,421,007 | 342,653,178 |
| 2016-17 | 10,504,685 | 339,039,520 | 349,544,205 |
| 2017-18 | 13,558,783 | 334,639,014 | 348,197,797 |
| 2018-19 | 17,214,514 | 358,948,624 | 376,163,138 |
| 2019-20 | 19,509,413 | 381,903,477 | 401,412,890 |
| Total | 149,812,946 | 5,678,388,955 | 5,828,201,901 |
Note: The difference between actual and expected is the actual amount less the expected amount. A positive value indicates a deficit for the fiscal year. The difference in proportion is the difference between the actual and expected amount in proportion to the expected amount.
Source: PCH financial data.
| Fiscal year | Difference | Difference (%) |
|---|---|---|
| 2003-04 | 6,194,681 | 2.40% |
| 2004-05 | 6,214,783 | 2.11% |
| 2005-06 | 17,684,886 | 5.46% |
| 2006-07 | 17,774,986 | 5.51% |
| 2007-08 | 22,085,379 | 6.62% |
| 2008-09 | 1,386,288 | 0.39% |
| 2009-10 | 14,768,343 | 4.39% |
| 2010-11 | 3,006,129 | 0.89% |
| 2011-12 | 8,536,258 | 2.54% |
| 2012-13 | 4,044,175 | 1.20% |
| 2013-14 | 2,909,933 | 0.87% |
| 2014-15 | 4,951,623 | 1.47% |
| 2015-16 | 5,208,057 | 1.54% |
| 2016-17 | 12,349,084 | 3.66% |
| 2017-18 | 1,502,676 | 0.43% |
| 2018-19 | 23,575,955 | 6.69% |
| 2019-20 | -13,379,293 | -3.23% |
| Total | 138,813,943 | 2.44% |
Note: The difference between actual and expected is the actual amount less the expected amount. A positive value indicates a deficit for the fiscal year. The difference in proportion is the difference between the actual and expected amount in proportion to the expected amount.
Source: PCH financial data.
Appendix F: expected and actual expenditures for DOLC and EOL, 2003-04 to 2020-21
| Fiscal Year | Expected grants | Expected contributions | Expected total DOLC |
|---|---|---|---|
| 2003-04 | 0 | 197,841,716 | 197,841,716 |
| 2004-05 | 42,135,000 | 161,386,419 | 203,521,419 |
| 2005-06 | 42,134,700 | 177,707,801 | 219,842,501 |
| 2006-07 | 42,134,700 | 171,066,170 | 213,200,870 |
| 2007-08 | 35,644,933 | 186,348,949 | 221,993,882 |
| 2008-09 | 36,822,973 | 202,090,500 | 238,913,473 |
| 2009-10 | 36,823,000 | 189,867,000 | 226,690,000 |
| 2010-11 | 33,322,973 | 192,709,011 | 226,031,984 |
| 2011-12 | 33,322,973 | 191,797,917 | 225,120,890 |
| 2012-13 | 33,322,973 | 191,797,917 | 225,120,890 |
| 2013-14 | 33,322,973 | 188,349,017 | 221,671,990 |
| 2014-15 | 33,322,973 | 191,099,017 | 224,421,990 |
| 2015-16 | 33,322,973 | 192,599,017 | 225,921,990 |
| 2016-17 | 33,322,973 | 192,349,017 | 225,671,990 |
| 2017-18 | 33,322,973 | 201,849,017 | 235,171,990 |
| 2018-19 | 33,322,973 | 207,141,079 | 240,464,052 |
| 2019-20 | 59,312,973 | 224,841,079 | 284,154,052 |
| Total | 594,915,036 | 3,260,840,643 | 3,855,755,679 |
Note: The difference between actual and expected is the actual amount less the expected amount. A positive value indicates a deficit for the fiscal year. The difference in proportion is the difference between the actual and expected amount in proportion to the expected amount.
Source: PCH financial data.
| Fiscal Year | Actual grants | Actual contributions | Actual total DOLC |
|---|---|---|---|
| 2003-04 | 0 | 190,143,422 | 190,143,422 |
| 2004-05 | 4,595,787 | 204,715,357 | 209,311,144 |
| 2005-06 | 4,972,337 | 226,165,117 | 231,137,454 |
| 2006-07 | 5,224,229 | 216,292,570 | 221,516,799 |
| 2007-08 | 7,151,550 | 226,674,891 | 233,826,441 |
| 2008-09 | 7,666,376 | 224,391,091 | 232,057,467 |
| 2009-10 | 6,592,173 | 225,418,803 | 232,010,976 |
| 2010-11 | 6,250,717 | 217,500,489 | 223,751,206 |
| 2011-12 | 6,029,022 | 222,282,395 | 228,311,417 |
| 2012-13 | 7,642,617 | 216,896,354 | 224,538,971 |
| 2013-14 | 7,130,253 | 210,862,596 | 217,992,849 |
| 2014-15 | 6,691,936 | 217,332,230 | 224,024,166 |
| 2015-16 | 6,556,111 | 217,629,716 | 224,185,827 |
| 2016-17 | 9,557,992 | 221,717,092 | 231,275,084 |
| 2017-18 | 12,388,453 | 218,169,576 | 230,558,029 |
| 2018-19 | 16,082,264 | 240,481,277 | 256,563,541 |
| 2019-20 | 18,102,915 | 252,205,899 | 270,308,814 |
| Total | 132,634,732 | 3,748,878,875 | 3,881,513,607 |
Note: The difference between actual and expected is the actual amount less the expected amount. A positive value indicates a deficit for the fiscal year. The difference in proportion is the difference between the actual and expected amount in proportion to the expected amount.
Source: PCH financial data.
| Fiscal Year | Difference grants | Difference contributions | Difference DOLC |
|---|---|---|---|
| 2003-04 | 0 | -7,698,294 | -7,698,294 |
| 2004-05 | -37,539,213 | 43,328,938 | 5,789,725 |
| 2005-06 | -37,162,363 | 48,457,316 | 11,294,953 |
| 2006-07 | -36,910,471 | 45,226,400 | 8,315,929 |
| 2007-08 | -28,493,383 | 40,325,942 | 11,832,559 |
| 2008-09 | -29,156,597 | 22,300,591 | -6,856,006 |
| 2009-10 | -30,230,827 | 35,551,803 | 5,320,976 |
| 2010-11 | -27,072,256 | 24,791,478 | -2,280,778 |
| 2011-12 | -27,293,951 | 30,484,478 | 3,190,527 |
| 2012-13 | -25,680,356 | 25,098,437 | -581,919 |
| 2013-14 | -26,192,720 | 22,513,579 | -3,679,141 |
| 2014-15 | -26,631,037 | 26,233,213 | -397,824 |
| 2015-16 | -26,766,862 | 25,030,699 | -1,736,163 |
| 2016-17 | -23,764,981 | 29,368,075 | 5,603,094 |
| 2017-18 | -20,934,520 | 16,320,559 | -4,613,961 |
| 2018-19 | -17,240,709 | 33,340,198 | 16,099,489 |
| 2019-20 | -41,210,058 | 27,364,820 | -13,845,238 |
| Total | -462,280,304 | 488,038,232 | -25,757,928 |
Note: The difference between actual and expected is the actual amount less the expected amount. A positive value indicates a deficit for the fiscal year. The difference in proportion is the difference between the actual and expected amount in proportion to the expected amount.
Source: PCH financial data.
| Fiscal Year | Expected grants | Expected contributions |
Expected total EOL |
|---|---|---|---|
| 2003-04 | 46,083,842 | 14,137,320 | 60,221,162 |
| 2004-05 | 5,599,842 | 84,927,287 | 90,527,129 |
| 2005-06 | 5,599,842 | 98,343,668 | 103,943,510 |
| 2006-07 | 5,599,842 | 103,619,268 | 109,219,110 |
| 2007-08 | 5,599,842 | 105,923,289 | 111,523,131 |
| 2008-09 | 5,097,638 | 108,133,289 | 113,230,927 |
| 2009-10 | 5,098,000 | 104,923,000 | 110,021,000 |
| 2010-11 | 5,599,842 | 105,923,289 | 111,523,131 |
| 2011-12 | 5,599,842 | 105,923,289 | 111,523,131 |
| 2012-13 | 5,599,842 | 105,923,289 | 111,523,131 |
| 2013-14 | 5,599,842 | 105,923,289 | 111,523,131 |
| 2014-15 | 5,599,842 | 105,923,289 | 111,523,131 |
| 2015-16 | 5,599,842 | 105,923,289 | 111,523,131 |
| 2016-17 | 5,599,842 | 105,923,289 | 111,523,131 |
| 2017-18 | 5,599,842 | 105,923,289 | 111,523,131 |
| 2018-19 | 5,599,842 | 106,523,289 | 112,123,131 |
| 2019-20 | 17,014,842 | 113,623,289 | 130,638,131 |
| Total | 146,092,268 | 1,687,540,011 | 1,833,632,279 |
Note: The difference between actual and expected is the actual amount less the expected amount. A positive value indicates a deficit for the fiscal year. The difference in proportion is the difference between the actual and expected amount in proportion to the expected amount.
Source: PCH financial data.
| Fiscal Year | Actual grants | Actual contributions |
Actual total EOL |
|---|---|---|---|
| 2003-04 | 5,933,186 | 68,180,951 | 74,114,137 |
| 2004-05 | 468,984 | 90,483,203 | 90,952,187 |
| 2005-06 | 353,467 | 109,979,976 | 110,333,443 |
| 2006-07 | 165,204 | 118,512,963 | 118,678,167 |
| 2007-08 | 544,575 | 121,231,376 | 121,775,951 |
| 2008-09 | 1,293,027 | 120,180,194 | 121,473,221 |
| 2009-10 | 655,167 | 118,813,200 | 119,468,367 |
| 2010-11 | 507,871 | 116,302,167 | 116,810,038 |
| 2011-12 | 480,096 | 116,388,766 | 116,868,862 |
| 2012-13 | 395,793 | 115,753,432 | 116,149,225 |
| 2013-14 | 529,654 | 117,582,551 | 118,112,205 |
| 2014-15 | 519,359 | 116,353,219 | 116,872,578 |
| 2015-16 | 676,060 | 117,791,291 | 118,467,351 |
| 2016-17 | 946,693 | 117,322,428 | 118,269,121 |
| 2017-18 | 1,170,330 | 116,469,438 | 117,639,768 |
| 2018-19 | 1,132,250 | 118,467,347 | 119,599,597 |
| 2019-20 | 1,406,498 | 129,697,578 | 131,104,076 |
| Total | 17,178,214 | 1,929,510,080 | 1,946,688,294 |
Note: The difference between actual and expected is the actual amount less the expected amount. A positive value indicates a deficit for the fiscal year. The difference in proportion is the difference between the actual and expected amount in proportion to the expected amount.
Source: PCH financial data.
| Fiscal Year | Difference grants | Difference contribution | Difference EOL |
|---|---|---|---|
| 2003-04 | -40,150,656 | 54,043,631 | 13,892,975 |
| 2004-05 | -5,130,858 | 5,555,916 | 425,058 |
| 2005-06 | -5,246,375 | 11,636,308 | 6,389,933 |
| 2006-07 | -5,434,638 | 14,893,695 | 9,459,057 |
| 2007-08 | -5,055,267 | 15,308,087 | 10,252,820 |
| 2008-09 | -3,804,611 | 12,046,905 | 8,242,294 |
| 2009-10 | -4,442,833 | 13,890,200 | 9,447,367 |
| 2010-11 | -5,091,971 | 10,378,878 | 5,286,907 |
| 2011-12 | -5,119,746 | 10,465,477 | 5,345,731 |
| 2012-13 | -5,204,049 | 9,830,143 | 4,626,094 |
| 2013-14 | -5,070,188 | 11,659,262 | 6,589,074 |
| 2014-15 | -5,080,483 | 10,429,930 | 5,349,447 |
| 2015-16 | -4,923,782 | 11,868,002 | 6,944,220 |
| 2016-17 | -4,653,149 | 11,399,139 | 6,745,990 |
| 2017-18 | -4,429,512 | 10,546,149 | 6,116,637 |
| 2018-19 | -4,467,592 | 11,944,058 | 7,476,466 |
| 2019-20 | -15,608,344 | 16,074,289 | 465,945 |
| Total | -128,914,054 | 241,970,069 | 113,056,015 |
Note: The difference between actual and expected is the actual amount less the expected amount. A positive value indicates a deficit for the fiscal year. The difference in proportion is the difference between the actual and expected amount in proportion to the expected amount.
Source: PCH financial data.
Appendix G: allocation of OLSP financial resources
| Components | SubcomponentsDistribution of total DOLC program budget by component and subcomponent, 2003-04 to 2019-20 table note a |
|---|---|
| 1 – Community Life (26.2%) |
1.1 – Cooperation with the Community Sector (15.5%) 1.2 – Intergovernmental Cooperation on Minority-Language Services (7.9%) 1.3 – Dedicated Fund for the English-Speaking Communities of Quebec (<0.1%) 1.4 – Strategic Fund (0.5%) 1.5 – Community Media Strategic Support Fund (0.1%) 1.6 – Community Cultural Action Fund (0.3%) 1.7 – Community Cultural Action Micro-Grant Program for Minority Schools (<0.1%) 1.8 – Community Spaces Fund (<0.01%) 1.9 – Support for the Civic Community School Fund (<0.1%) 1.10 – Young Canada Works (0.8%) |
| 2 – Minority-Language Education (73.6%) |
2.1 – Intergovernmental Cooperation (71.1%) 2.2 – Complementary Support for Language Learning (0.7%)Distribution of total DOLC program budget by component and subcomponent, 2003-04 to 2019-20 table note b 2.3 – Teacher Recruitment and Retention Strategy in Minority French Language Schools (<0.1%) 2.4 – Fund for-educational and cultural infrastructures (0.7%) 2.5 – Community-Based Educational Infrastructure (<0.1%) 2.6 Cooperation with the Non-Governmental Sector (0.7%) |
Sources: Data from Annual Reports on Official Languages (2003-04 to 2019-20).
Distribution of total DOLC program budget by component and subcomponent, 2003-04 to 2019-20 table notes
- Distribution of total DOLC program budget by component and subcomponent, 2003-04 to 2019-20 table note a
-
The subcomponents have changed several times since 2003-04. For the sake of clarity, this table shows only those components and subcomponents currently in existence, which account for 99.8% of total OCOL funding.
- Distribution of total DOLC program budget by component and subcomponent, 2003-04 to 2019-20 table note b
-
As of fiscal year 2010-11, Complementary Support for Language Learning became a subcomponent in its own right. Previously, it was part of the Intergovernmental Cooperation subcomponent. In fact, these two subcomponents taken together over the entire evaluation period account for 71.8% of the total funding for the DOLC program.
| Components | SubcomponentsDistribution of total EOL program budget by component and subcomponent, 2003-04 to 2019-20 67 note a |
|---|---|
| 1– Promotion of Linguistic Duality (4.2%) |
1.1 – Appreciation and Rapprochement (3.7%) 1.2 – Support for Interpretation and Translation (0.4%) 1.3 – Promotion of Bilingual Services (0.1%) 1.4 – Bilingual Advantage Initiative (<0.1%) |
| 2– Second Language Learning (95.7%) |
2.1 – Intergovernmental Cooperation (81.3%) 2.2 – Complementary Support (11.5%)Distribution of total EOL program budget by component and subcomponent, 2003-04 to 2019-20 Table note b 2.3 – Cooperation with the Non-Governmental Sector (0.7%) 2.4 – Teacher Recruitment and Retention Strategy in French Immersion and French Second-Language Programs (0.2%) 2.5 – Bursaries for Postsecondary Studies in French as a Second Language (0.2%) 2.6 – Young Canada (1.9%) |
Sources: Data from Annual Reports on Official Languages (2003-04 to 2019-20).
Distribution of total EOL program budget by component and subcomponent, 2003-04 to 2019-20 Table notes
- Distribution of total EOL program budget by component and subcomponent, 2003-04 to 2019-20 Table note a
-
The subcomponents have changed several times since 2003-04. This table shows only those components and subcomponents currently in existence, which account for 99.9% of total EOL funding.
- Distribution of total EOL program budget by component and subcomponent, 2003-04 to 2019-20 Table note b
-
As of fiscal year 2010-11, Complementary Support for Language Learning became a subcomponent in its own right. Previously, it was part of the Intergovernmental Cooperation subcomponent. In fact, these two subcomponents taken together over the entire evaluation period account for 92.8% of the total funding for the EOL program.
Appendix H: OLSP result chains
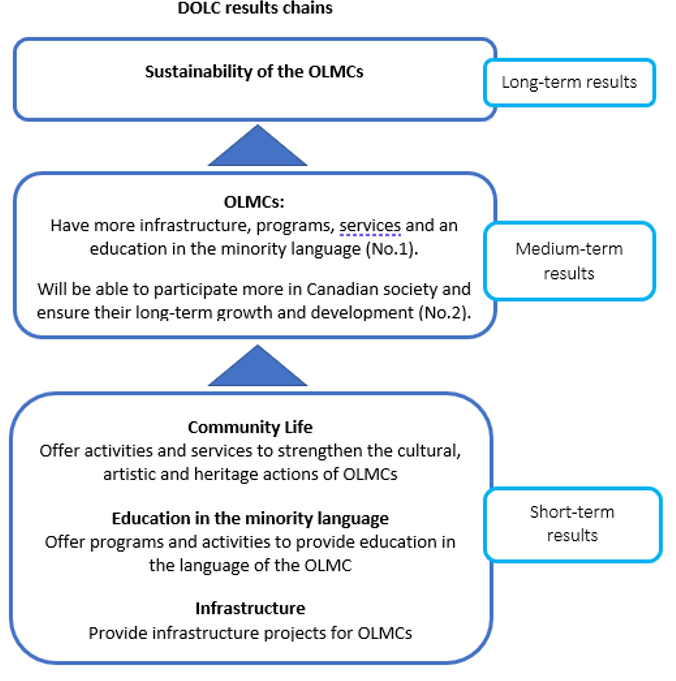
Appendix H: OLSP result chains – text version
DOLC results chains
Long-term results
- Sustainability of the OLMCs
Medium-term results
OLMCs:
- Have more infrastructure, programs, services and an education in the minority language (No.1).
- Will be able to participate more in Canadian society and ensure their long-term growth and development (No.2).
Short-term results
Community Life:
- Offer activities and services to strengthen the cultural, artistic and heritage actions of OLMCs
Education in the minority language:
- Offer programs and activities to provide education in the language of the OLMC
Infrastructure:
- Provide infrastructure projects for OLMCs
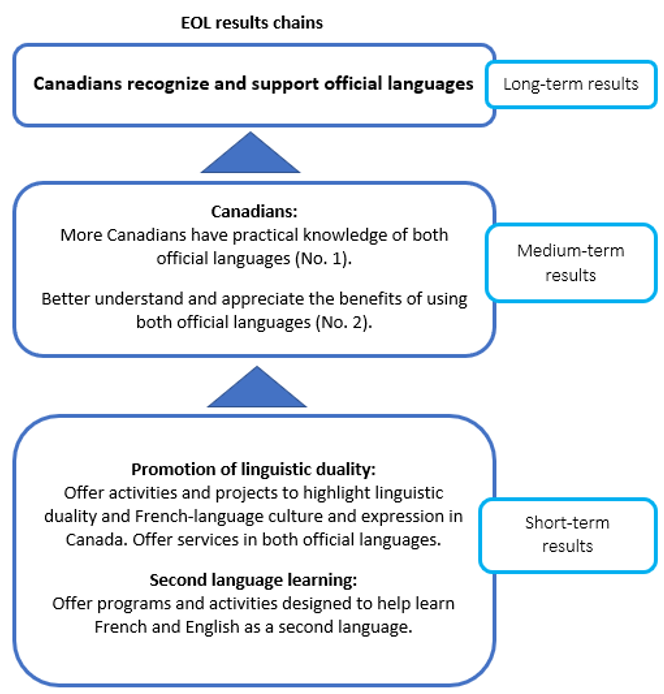
Appendix H: OLSP result chains – text version
EOL results chains
Long-term results
- Canadians recognize and support official languages
Medium-term results
Canadians:
- More Canadians have practical knowledge of both official languages (No. 1).
- Better understand and appreciate the benefits of using both official languages (No. 2).
Short-term results
Promotion of linguistic duality:
- Offer activities and projects to highlight linguistic duality and French-language culture and expression in Canada. Offer services in both official languages.
Second language learning:
- Offer programs and activities designed to help learn French and English as a second language.
Appendix I: Bibliography
- Albérola, N. (2019). Les dernières places en immersion française au Yukon se jouent à la loterie [The last remaining spots in French immersion in the Yukon are being filled through a lottery]. Regard sur l’arctique (in french only)
- Belkhodja, C., Traisnel, C., Wade, M. (2012). Typology of Canada’s Francophone minority communities: executive summary. Government of Canada.
- Bourgeois, D., Denis, W., Dennie, D., and Johnson, M. L. (2006). Provincial and Territorial Government Contributions to the Development of Francophone Minority Communities. Canadian Institute for Research on Linguistic Minorities.
- Cardinal, L., Lang, S., and Sauvé, A. (2008). Les minorités francophones hors Québec et la gouvernance des langues officielles : portrait et enjeux. La langue française en Amérique : dynamiques spatiales et identitaires, 26, 209-233.
- Carter, J. (2008). What future for English-language health and social services in Quebec? Dans Bourhis, R.Y. (Ed.), The Vitality of the English-Speaking Communities of Quebec: From Community Decline to Revival, CEETUM and CIRLM, Université de Montréal, 87–106 (PDF format).
- Centre de leadership et d’évaluation (CLÉ) (2021). Rapport d’étude (livrable 3) : Étude exploratoire sur la restructuration des Programmes d’appui aux langues officielles (PALO) [Exploratory study on the restructuring of the Official Languages Support Programs (OLSPs)] [Unpublished document]. Report submitted to the Department of Canadian Heritage (PCH).
- Department of Canadian Heritage (PCH) (2017a). Evaluation of the Official Languages Support Programs. Government of Canada
- Department of Canadian Heritage (PCH) (2017b). 2016 Cross-Canada Official Languages Consultations. Government of Canada.
- Department of Canadian Heritage (PCH) (2018). Departmental Plan 2018–2019, Government of Canada.
- Department of Canadian Heritage (PCH) (2020). Performance Information Profile, Government of Canada.
- Dufresne, Y. & Ruderman, N. (2018). Public Attitudes toward Official Bilingualism in Canada: Making Sense of Regional and Subregional Variation. American Review of Canadian Studies, 48(4), 371–386.
- Environics Institute for Survey Research (Environics) (2019). Confederation of Tomorrow 2019 Survey of Canadians, Official Bilingualism at 50 (PDF format).
- Forgues, É. (2010). Autonomie, vitalité et identité des communautés en situation minoritaire : Proposition d’un cadre conceptuel. International Journal of Canadian Studies, 42, 183–206 (in french only).
- Forgues, É., Robineau, A., Pépin-Filion, D., and Bouchard, M.-A. (2020). La construction d’espaces francophones comme projet de société en milieu minoritaire [The construction of Francophone space as a social project in a minority setting]. Linguistic Minorities and Society, 13, 29–48 (in french only).
- Hudon, M.-È. (2019). Language regimes in the provinces and territories (Publication no. 2011-66-E). First version published in 2011. Library of Parliament, Government of Canada.
- Lamarre, P. (2008). English education in Quebec: issues and challenges. Dans Bourhis, R.Y. (Ed.), The Vitality of the English-Speaking Communities of Quebec: From Community Decline to Revival, CEETUM and CIRLM, Université de Montréal, 63–86 (PDF format).
- Létourneau, J. (2002). Language and identity in today’s Quebec: Questions, challenges, possibilities Globe: revue internationale d’études québécoises, 5(2), 79–110.
- Nielsen (2016). Official Languages and Bilingualism Survey Research Presentation (PDF format).
- Office of the Commissioner of Official Languages (OCOL) (2019). Accessing opportunity: A study on challenges in French-as-a-second-language education teacher supply and demand in Canada. Government of Canada
- Office québécois de la langue française (2019). Rapport sur l’évolution de la situation linguistique au Québec [Report on the evolution of the linguistic situation in Quebec]: April 2019. Government of Quebec.
- Official Languages Branch (OLB) (2019). Base générique de l’Analyse comparative entre les sexes plus [Generic Basis for Gender-Based Analysis Plus] [Unpublished document]. Government of Canada
- Official Languages Branch (OLB) (2021a). Framework for the Vitality of Official-Language Minority Communities (OLMC), Government of Canada.
- Official Languages Branch (OLB) (2021b). Fostering Appreciation and Cooperation Between English Speakers and French Speakers in Canada: Framework to Examine the Current State and Guide Action, Government of Canada.
- Parkin, A. and Turcotte, A. (2004). Bilingualism: Part of our past or part of our future? Centre for Research and Information on Canada (CRIC) (PDF format).
- Pilleri, L. (2019). La pénurie d’enseignants freine le bilinguisme (in french only) [Teacher shortage hinders bilingualism]. L’express.
- Radio-Canada (2019a). Longue liste d’attente pour une place en maternelle en immersion française (in french only) [Long waiting list for French immersion kindergarten]. Radio-Canada.
- Radio-Canada (2019b). Moins de places dans les écoles d’immersion française de Vancouver (in french only) [Fewer spaces in Vancouver’s French immersion schools]. Radio-Canada.
- Sioufi, R. and Bourhis, R.Y. (2018). Acculturation and Linguistic Tensions as Predictors of Quebec Francophone and Anglophone Desire for Internal Migration in Canada. Journal of Language and Social Psychology, Volume 37(2), 136–159.
- Socius (2021). The shortage of French Immersion and French as a second language teachers: Study report. The Canadian Association of Immersion Professionals and the Canadian Association of Second Language Teachers.
- Statistics Canada (2021). Table 37-10-0009-01: Number of students in official languages programs, public elementary and secondary schools, by program type, grade and sex Government of Canada DOI.
- Treasury Board Secretariat (TBS)(2016) Policy on Results, Government of Canada.
- Turcotte, M. (2019). Results from the 2016 Census: English-French bilingualism among Canadian children and youth. Statistics Canada, Government of Canada.
- Vox Pop Labs (2018). Study on the appreciation and perception of Canada’s two official languages. Report submitted to the Department of Canadian Heritage.
© His Majesty the King in Right of Canada, represented by the Minister of Canadian Heritage, 2023
Catalogue No.: CH7-18/1-2023E-PDF
ISBN: 978-0-660-46943-0
Page details
- Date modified: