
Olympic Ranking Index
A Look into Canada’s Rank in Olympic Sports
2015-2018
Insight Unit
Sport Canada
November 2019
On this page
Alternate format

Olympic Ranking Index [PDF version - 772 KB]
List of abbreviations
- AUS
- Australia
- AUT
- Austria
- CAN
- Canada
- CHN
- China
- CZE
- Czech Republic
- ETH
- Ethiopia
- FIN
- Finland
- FRA
- France
- GBR
- Great Britain
- GER
- Germany
- HUN
- Hungary
- ITA
- Italy
- JAM
- Jamaica
- JPN
- Japan
- KEN
- Kenya
- KOR
- Korea
- NED
- Netherlands
- NOR
- Norway
- NZL
- New Zealand
- POL
- Poland
- RUS
- Russia
- SLO
- Slovenia
- SUI
- Switzerland
- SWE
- Sweden
- USA
- United States of America
About
The Olympic Ranking Index (the Index) is a product of Sport Canada, based on data collected and compiled through the Sport Tracking, Assessment, and Technical Statistics (STATS) database.
The Index offers a system to determine Canada’s annual ranking on the basis of its aggregate results across all senior world championships and Olympic Games that occurred over a four-year period. The Index provides a fair, consistent and objective foundation to track, compare and evaluate a nation’s overall performance over time.
A number of indicators are used: gold medal count, medal count, medal points, top 5 count, top 5 pointsFootnote 1, top 8 count, and top 8 pointsFootnote 1. These indicators help produce three indices:
- Combined Olympic Ranking Index
- Summer Olympic Ranking Index
- Winter Olympic Ranking Index
This report is divided into three sections:
- Results
- Sport Ranking
- Methodology
A Paralympic version of this index, called Paralympic Maturity Index, has been developed to provide a system for tracking and evaluating nations’ performances on the basis of their aggregate results across all Paralympic senior world championships and Paralympic Games. This is in a separate document.
| Indicators | Combined Rank | Summer Rank | Winter Rank |
|---|---|---|---|
| Gold medal count | 11 | 17 | 5 |
| Medal count | 9 | 12 | 3 |
| Medal points | 9 | 15 | 3 |
| Top 5 count | 8 | 11 | 4 |
| Top 5 points | 9 | 13 | 4 |
| Top 8 count | 7 | 11 | 3 |
| Top 8 points | 8 | 11 | 3 |
Summary
- Combined Olympic Ranking Index
- Combines both winter and summer Olympic events.
- Summer Olympic Ranking Index
- Track results across all summer Olympic events.
- Winter Olympic Ranking Index
- Track results across all winter Olympic events.
The results are presented within three indices that evaluate Canada’s performance during the 2015-2018 period.
Medal Performance Indicators
- The medal points provide the most accurate method of evaluating nations’ medal performances.
- They combine both volume of performance, number of medals won, and level of performance.
- Gold Medal Count
- Medal Count
- Medal Points
(Points awarded to each medal colour: gold = 5pts, silver = 3pts, bronze = 1pt)
Systemic Success and Depth of Field
When used in combination with medal indicators such as medal percentage, they assess systematic success and depth of a nation’s teams.
- Top 5 Count
- Top 5 Points
(Points awarded to each position: 1st = 7pts, 2nd = 5pts, 3rd = 3pts, 4th = 2pts, 5th = 1pt.) - Top 8 Count
- Top 8 Points
(Points awarded to each position: 1st = 10pts, 2nd = 8pts, 3rd = 6pts, 4th = 5pts, 5th = 4pts, 6th = 3pts, 7th = 2pts, 8th = 1pt.)
Seven indicators are used to track and evaluate Canada’s overall performance over a four year timeframe.
2015-2018 Event Count Summary
| Season | Sport | 2015 | 2016 | 2017 | 2018 | 2015-2018 |
|---|---|---|---|---|---|---|
| Summer | Archery | 5 | 4 | 5 | - | 14 |
| Athletics | 47 | 47 | 47 | 13 | 154 | |
| Badminton | 5 | 5 | 5 | 5 | 20 | |
| Baseball | 1 | - | 1 | - | 2 | |
| Basketball | - | 4 | 2 | 3 | 9 | |
| Boxing | 10 | 13 | 10 | 5 | 38 | |
| Canoeing | 16 | 16 | 16 | 16 | 64 | |
| Cycling | 18 | 18 | 19 | 22 | 77 | |
| Diving | 8 | 8 | 8 | - | 24 | |
| Equestrian | - | 6 | - | 6 | 12 | |
| Fencing | 10 | 11 | 12 | 12 | 45 | |
| Field Hockey | - | 2 | - | 1 | 3 | |
| Golf | - | 2 | - | - | 2 | |
| Gymnastics | 18 | 18 | 14 | 18 | 68 | |
| Judo | 14 | 14 | 15 | 15 | 58 | |
| Karate | - | 12 | - | 10 | 22 | |
| Modern Pentathlon | 2 | 2 | 2 | 2 | 8 | |
| Rowing | 14 | 14 | 14 | 14 | 56 | |
| Rugby | - | 2 | - | 2 | 4 | |
| Sailing | 10 | 10 | 10 | 10 | 40 | |
| Shooting | 5 | 15 | 5 | 15 | 40 | |
| Skateboarding | 1 | 2 | 2 | 1 | 6 | |
| Soccer | 1 | 2 | 1 | - | 4 | |
| Softball | 1 | 1 | 1 | 1 | 4 | |
| Sport Climbing | - | 2 | - | 2 | 4 | |
| Sport Parachuting | - | 5 | - | - | 5 | |
| Surfing | 2 | 2 | 2 | 2 | 8 | |
| Swimming | 37 | 34 | 37 | - | 108 | |
| Synchro Swim | 2 | 2 | 2 | - | 6 | |
| Table Tennis | 3 | 4 | 3 | 2 | 12 | |
| Taekwondo | 8 | 8 | 8 | - | 24 | |
| Team Handball | 2 | 2 | 2 | - | 6 | |
| Tennis | 2 | 5 | 2 | - | 9 | |
| Triathlon | 3 | 3 | 3 | 3 | 12 | |
| Volleyball | 2 | 4 | 2 | 2 | 10 | |
| Water Polo | 2 | 2 | 2 | - | 6 | |
| Weightlifting | 15 | 15 | 16 | 14 | 60 | |
| Wrestling | 18 | 18 | 25 | 18 | 79 | |
| Winter | Alpine Skiing | 13 | - | 11 | 13 | 37 |
| Biathlon | 11 | 11 | 11 | 11 | 44 | |
| Bobsleigh and Luge | 9 | 9 | 9 | 9 | 36 | |
| Cross Country Ski | 12 | - | 12 | 12 | 36 | |
| Curling | 3 | 3 | 3 | 3 | 12 | |
| Figure Skating | 5 | 4 | 5 | 5 | 19 | |
| Freestyle Ski | 8 | - | 8 | 8 | 24 | |
| Hockey | 2 | 2 | 2 | 2 | 8 | |
| Nordic Combined | 3 | - | 2 | 3 | 8 | |
| Ski Cross | - | - | 2 | - | 2 | |
| Ski Jumping | 4 | - | 4 | 4 | 12 | |
| Snowboarding | 10 | - | 10 | 10 | 30 | |
| Speed Skating | 22 | 22 | 22 | 22 | 88 | |
| Total | - | 384 | 385 | 394 | 316 | 1,479 |
Results
PointsFootnote 2
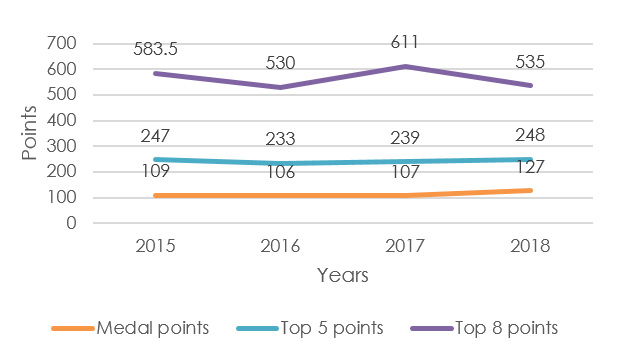
Figure 1: Canada’s Combined Points – text version
| Year | Medal points | Top 5 points | Top 8 points |
|---|---|---|---|
| 2015 | 109 | 247 | 583.5 |
| 2016 | 106 | 233 | 530 |
| 2017 | 107 | 239 | 611 |
| 2018 | 127 | 248 | 535 |
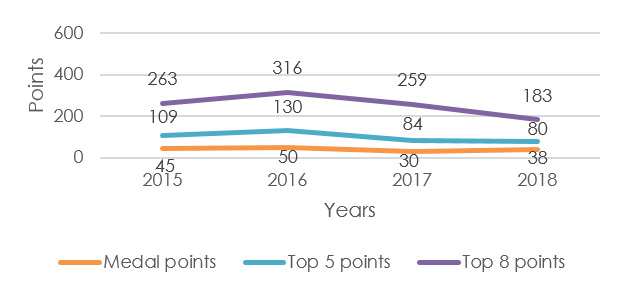
Figure 2: Canada’s Summer Points – text version
| Year | Medal points | Top 5 points | Top 8 points |
|---|---|---|---|
| 2015 | 45 | 109 | 263 |
| 2016 | 50 | 130 | 316 |
| 2017 | 30 | 84 | 259 |
| 2018 | 38 | 80 | 183 |
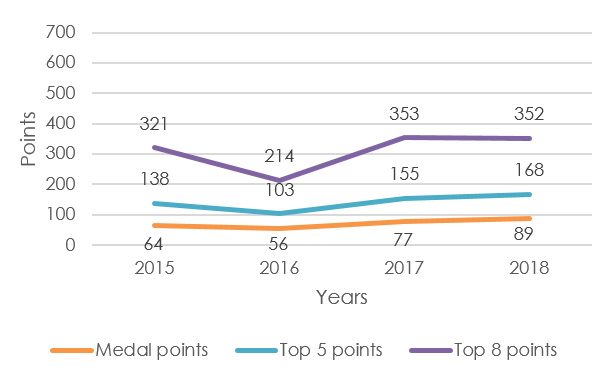
Figure 3: Canada’s Winter Points – text version
| Year | Medal points | Top 5 points | Top 8 points |
|---|---|---|---|
| 2015 | 64 | 138 | 321 |
| 2016 | 56 | 103 | 214 |
| 2017 | 77 | 155 | 353 |
| 2018 | 89 | 168 | 352 |
Medal Points
- Canada’s combined medal points are increasing.
- Canada’s summer medal points slightly increased between 2017 and 2018; going from 30 to 38 points, after dropping from 2016 to 2017Footnote 3.
- Canada’s winter medal points increased by 12 points since 2017.
Top 5 Points
- Canada’s combined top 5 points are increasing.
- Canada’s summer top 5 points decreased by 4 points since 2017. This could be a result of there being 79 less medal events in summer 2018 than summer 2017.
- For the winter top 5 points, a slight decrease occurred in 2016; Canada obtained 103 top 5 points. Its top 5 points have since then increased; Canada obtained 155 points in 2017 and 168 points in 2018.
Top 8 Points
- Canada’s combined top 8 points decreased from 2017 to 2018.
- Canada obtained most of its summer top 8 points in 2016. This is primarily due to its performance during the Rio 2016 OlympicsFootnote 4.
- Canada closely maintains its top 8 points in winter sports; going from 353 in 2017 to 352 in 2018
Generally, Canadian athletes place mostly in the top 8 in competitions rather than in the top 5 or top 3; thus resulting in more top 8 points for Canada.
Combined Olympic Ranking Index
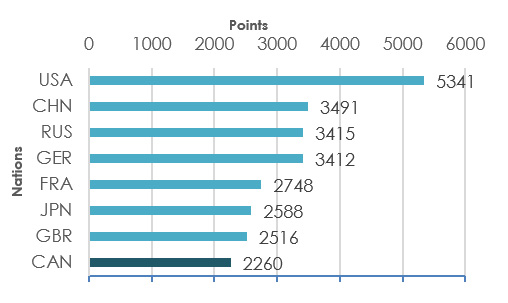
Figure 4: Combined top 8 points, 2015-2018 – text version
| Nation | Top 8 points |
|---|---|
| USA | 5,341 |
| CHN | 3,491 |
| RUS | 3,415 |
| GER | 3,412 |
| FRA | 2,748 |
| JPN | 2,588 |
| GBR | 2,516 |
| CAN | 2,260 |
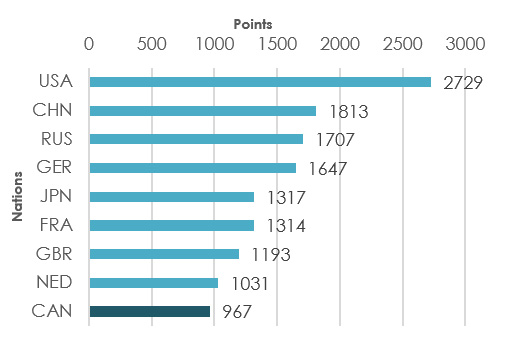
Figure 5: Combined top 5 points, 2015-2018 – text version
| Nation | Top 5 points |
|---|---|
| USA | 2,729 |
| CHN | 1,813 |
| RUS | 1,707 |
| GER | 1,647 |
| JPN | 1,317 |
| FRA | 1,314 |
| GBR | 1,193 |
| NED | 1,031 |
| CAN | 967 |
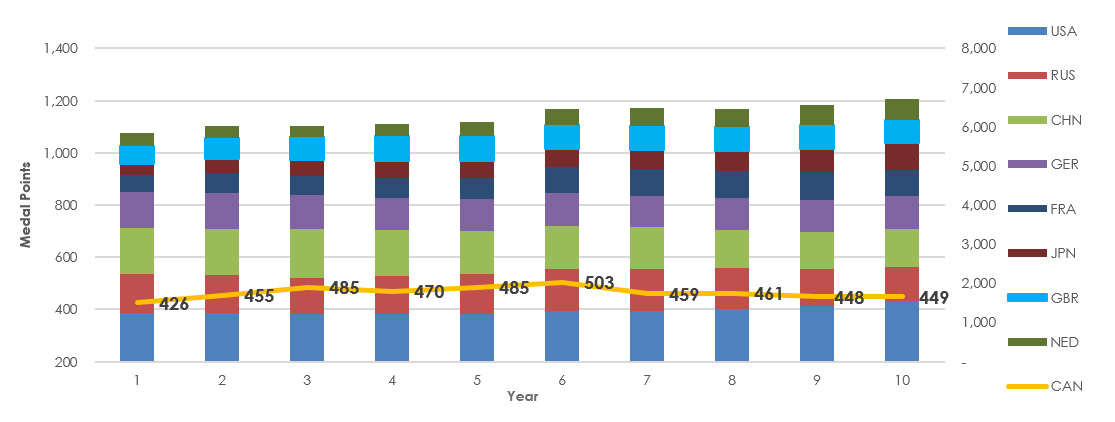
Figure 6: Ten-year (2009-2018) trend of top 8 nations based on combined medal points – text version
| Nation | 2009 | 2010 | 2011 | 2012 | 2013 | 2014 | 2015 | 2016 | 2017 | 2018 |
|---|---|---|---|---|---|---|---|---|---|---|
| USA | 1,253 | 1,251 | 1,203 | 1,227 | 1,216 | 1,295 | 1,292 | 1,338 | 1,408 | 1,541 |
| RUS | 974 | 963 | 943 | 951 | 1,024 | 1,061 | 1,074 | 1,043 | 950 | 871 |
| CHN | 1,186 | 1,171 | 1,230 | 1,171 | 1,106 | 1,104 | 1,072 | 981 | 946 | 964 |
| GER | 907 | 917 | 883 | 837 | 814 | 834 | 797 | 811 | 812 | 842 |
| FRA | 455 | 509 | 492 | 513 | 529 | 668 | 686 | 693 | 715 | 678 |
| JPN | 283 | 361 | 397 | 418 | 435 | 466 | 495 | 509 | 612 | 698 |
| GBR | 461 | 533 | 582 | 643 | 647 | 616 | 611 | 617 | 607 | 585 |
| NED | 322 | 302 | 298 | 314 | 359 | 420 | 455 | 473 | 495 | 533 |
| CAN | 426 | 455 | 485 | 470 | 485 | 503 | 459 | 461 | 448 | 449 |
- Canada ranked in 11th position for gold medal count (42 gold medals) in the 2015-2018 cycle.
- Canada ranked in 9th position for total number of medals (167) and medal points (449). This was a slight improvement for Canada. It placed 9th in the previous cycle (2014-2017) with 162 medals and 448 medal points.
- Canada maintained 7th position for total number of top 8 with a total of 499 top 8 finishes in 2018.
- Canada ranked in 8th position for top 8 points with a total of 2,260 points. Canada maintained its rank from the previous cycle, but slightly improved its top 8 point total from 2,188 in 2014-2017.
- Canada ranked in 8th position behind Japan with 299 top 5 finishes. Canada obtained a total of 967 points for top 5 finishes, putting Canada at 9th position behind the Netherlands.
- The United States, China, Russia, Germany, and France maintained their positions in the top 5 for medal count.
- The United States maintained the lead for combined medal points, top 8 and top 5 points; creating a wider gap with the remaining nations.
- China sat at the 2nd position with 964 medal points; an increase of 18 points. Russia dropped to 3rd position with 871.
Summer Olympic Ranking Index
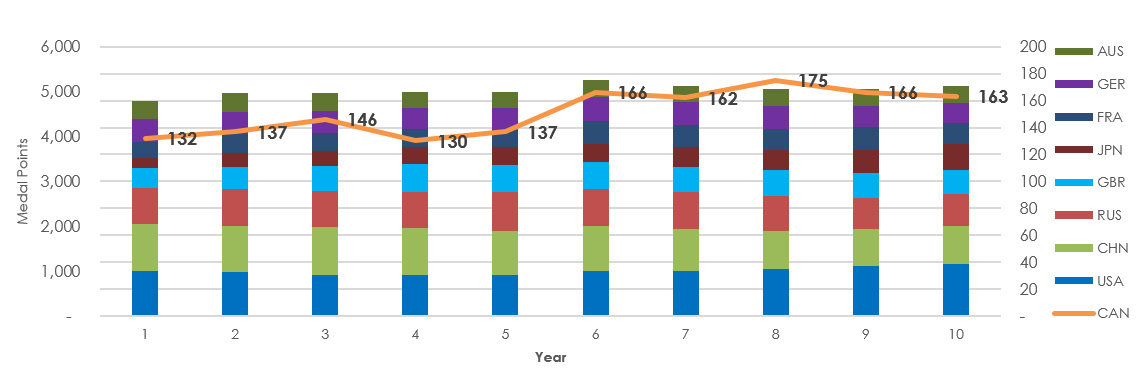
Figure 7: Ten-year (2009-2018) trend of top 8 nations based on summer medal points – text version
| Nation | 2009 | 2010 | 2011 | 2012 | 2013 | 2014 | 2015 | 2016 | 2017 | 2018 |
|---|---|---|---|---|---|---|---|---|---|---|
| USA | 1,003 | 977 | 908 | 924 | 910 | 1,014 | 996 | 1,048 | 1,121 | 1,167 |
| CHN | 1,053 | 1,030 | 1,086 | 1,032 | 981 | 984 | 942 | 850 | 817 | 840 |
| RUS | 802 | 820 | 794 | 817 | 864 | 844 | 825 | 778 | 694 | 706 |
| GBR | 432 | 502 | 549 | 615 | 620 | 584 | 568 | 574 | 566 | 545 |
| JPN | 231 | 303 | 350 | 371 | 391 | 414 | 432 | 442 | 511 | 577 |
| FRA | 363 | 417 | 402 | 401 | 381 | 500 | 498 | 486 | 506 | 465 |
| GER | 496 | 507 | 483 | 484 | 479 | 531 | 499 | 505 | 461 | 447 |
| AUS | 409 | 405 | 395 | 357 | 360 | 379 | 374 | 367 | 374 | 381 |
| CAN | 132 | 137 | 146 | 130 | 137 | 166 | 162 | 175 | 166 | 163 |
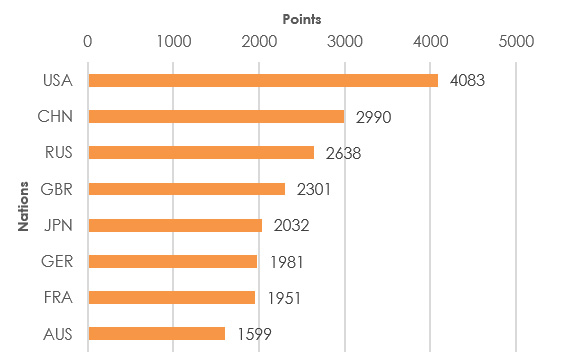
Figure 8: Summer top 8 points, 2015-2018 – text version
| Nation | Top 8 points |
|---|---|
| USA | 4,083 |
| CHN | 2,990 |
| RUS | 2,638 |
| GBR | 2,301 |
| JPN | 2,032 |
| GER | 1,981 |
| FRA | 1,951 |
| AUS | 1,599 |
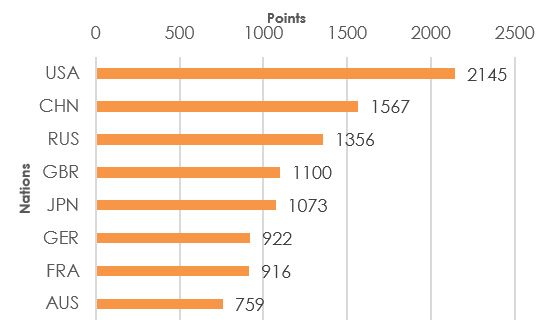
Figure 9: Summer top 5 points, 2015-2018 – text version
| Nation | Top 5 points |
|---|---|
| USA | 2,145 |
| CHN | 1,567 |
| RUS | 1,356 |
| GBR | 1,100 |
| JPN | 1,073 |
| GER | 922 |
| FRA | 916 |
| AUS | 759 |
- Canada ranked in 17th position for number of gold medals obtained during the cycle (16).
- Canada ranked in 12th position for total number of medals with a total of 69 medals. Canada held 13th position with 68 total medals in 2014-2017.
- Canada maintained the 15th position for medal points with a total of 163 points in 2018. Canada previously obtained a total of 166 medal points in 2017.
- Canada tied South Korea in 11th position behind the Netherlands with a count of 143 top 5 finishes.
- Canada obtained a total of 403 points for top 5 finishes. This put Canada in 13th position behind New Zealand.
- Canada ranked in 11th position for total number of top 8 finishes with a total of 249 during the 2015-2018 cycle. Canada previously held 10th position with a total of 241 top 8 finishes.
- Canada ranked in 11th position for top 8 points with a total of 1,021 points.
Winter Olympic Ranking Index
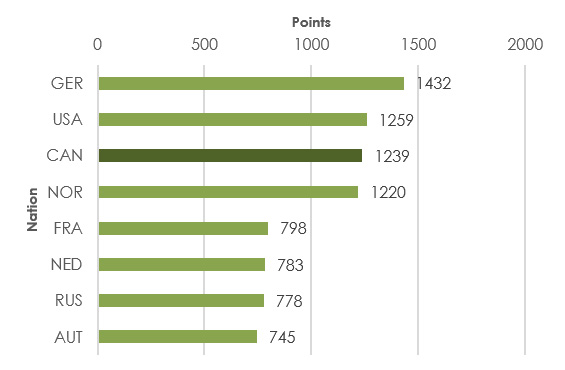
Figure 10: Winter top 8 points, 2015-2018 – text version
| Nation | Top 8 points |
|---|---|
| GER | 1,432 |
| USA | 1,259 |
| CAN | 1,239 |
| NOR | 1,220 |
| FRA | 798 |
| NED | 783 |
| RUS | 778 |
| AUT | 745 |
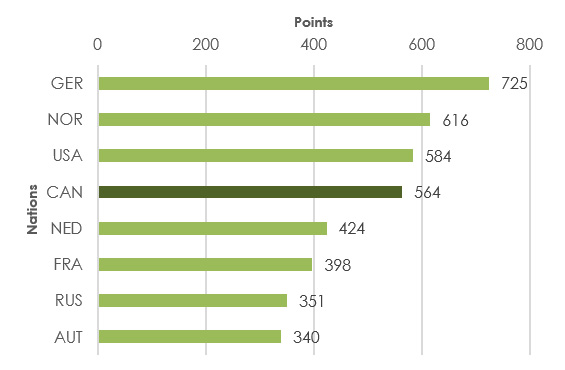
Figure 11: Winter top 5 points, 2015-2018 – text version
| Nation | Top 5 points |
|---|---|
| GER | 725 |
| NOR | 616 |
| USA | 584 |
| CAN | 564 |
| NED | 424 |
| FRA | 398 |
| RUS | 351 |
| AUT | 340 |
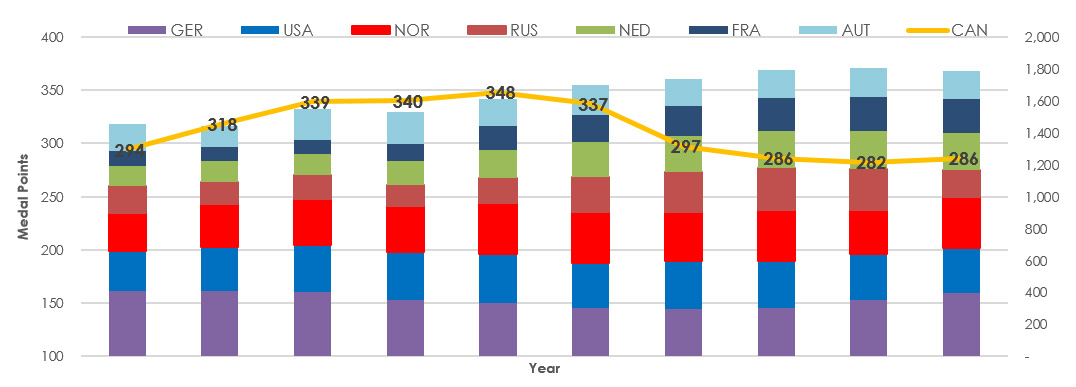
Figure 12: Ten-year (2009-2018) trend of top 8 nations based on winter medal points – text version
| Nation | 2009 | 2010 | 2011 | 2012 | 2013 | 2014 | 2015 | 2016 | 2017 | 2018 |
|---|---|---|---|---|---|---|---|---|---|---|
| GER | 411 | 410 | 400 | 353 | 335 | 303 | 298 | 306 | 351 | 395 |
| CAN | 294 | 318 | 339 | 340 | 348 | 337 | 297 | 286 | 282 | 286 |
| USA | 250 | 274 | 295 | 303 | 306 | 281 | 296 | 290 | 287 | 284 |
| NOR | 235 | 267 | 291 | 284 | 317 | 322 | 311 | 319 | 277 | 320 |
| RUS | 172 | 143 | 149 | 134 | 160 | 217 | 249 | 265 | 256 | 165 |
| NED | 125 | 126 | 132 | 146 | 173 | 218 | 227 | 233 | 242 | 236 |
| FRA | 92 | 91 | 90 | 112 | 148 | 168 | 188 | 207 | 209 | 213 |
| AUT | 169 | 131 | 190 | 195 | 173 | 187 | 169 | 170 | 183 | 174 |
- Canada ranked in 5th position with a total of 26 gold medals. Canada held 3rd position for medal count with a total of 98 medals.
- Canada ranked in 3rd position for medal points with a total of 286 points.
- Canada ranked in 4th position behind Norway with 156 top 5 finishes.
- Canada obtained a total of 564 points for top 5 finishes. This put Canada in the 4th position behind the United States.
- Canada ranked in 3rd position for total number of top 8 finishes with a total of 250. Canada previously held 3rd position with a total of 239 top 8 finishes. Canada also ranked in 3rd position for top 8 points with a total of 1,239 points.
The Four
Australia, Great Britain, and Norway are often identified as good candidates for performance comparison purposes with Canada. Australia and Great Britain focus their investments on performance efforts almost exclusively on summer sports. Norway mostly focuses its efforts on winter sports. Canada splits its investments in performance efforts among both.
The combined summer and winter ranking therefore provides an interesting comparative perspective by illustrating the overall performance outcome of each nation’s investment in Olympic sport.
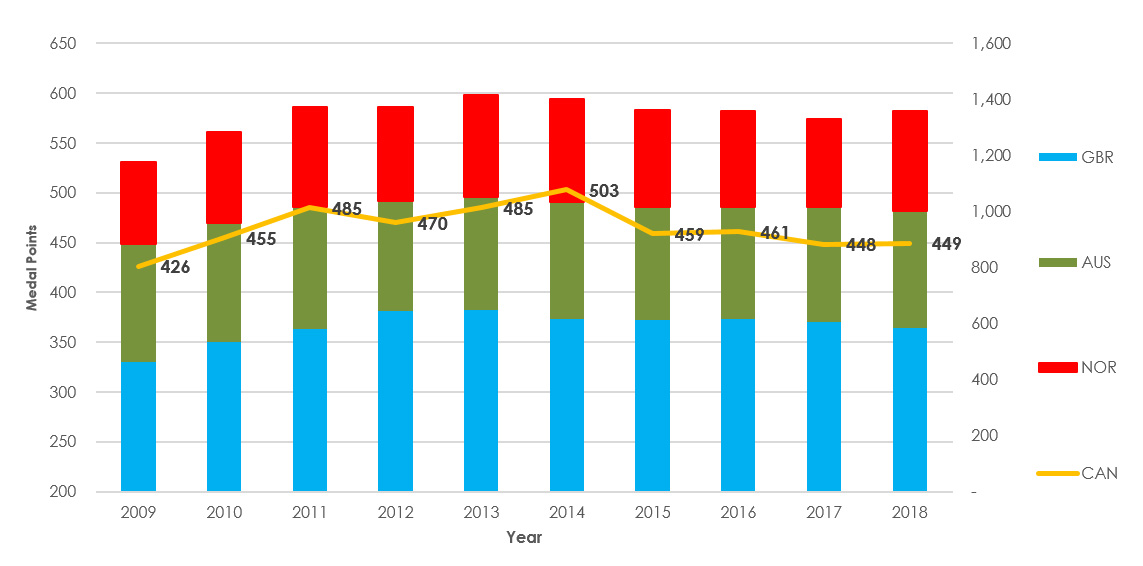
Figure 13: Ten-year trend of Great Britain, Canada, Australia, and Norway based on combined medal points – text version
| Nation | 2009 | 2010 | 2011 | 2012 | 2013 | 2014 | 2015 | 2016 | 2017 | 2018 |
|---|---|---|---|---|---|---|---|---|---|---|
| GBR | 461 | 533 | 582 | 643 | 647 | 616 | 611 | 617 | 607 | 585 |
| CAN | 426 | 455 | 485 | 470 | 485 | 503 | 459 | 461 | 448 | 449 |
| AUS | 423 | 426 | 433 | 395 | 404 | 417 | 405 | 398 | 410 | 417 |
| NOR | 293 | 324 | 357 | 333 | 363 | 369 | 347 | 345 | 311 | 356 |
- Canada’s positioning in relation to the other 3 nations remains consistent over the years.
- Great Britain maintains a significant lead over the other 3 nations for another consecutive year although it experienced a 22 point drop in medal points in 2018.
- With 585 medal points obtained during the 2015-2018 cycle, Great Britain maintains an average difference of 178 points with the other nations.
- Australia got closer to Canada with its 417 points achieved this cycle. Australia previously obtained 410 medal points compared to 448 medal points obtained by Canada in 2014-2017.
Sport RankingFootnote 5
This is a ranking of nations by sport over the 2015-2018 cycle. The sports displayed have the highest proportion of events over the cycle.
Summer
| Nation | Medal points | Top 5 | Top 5 points | Top 8 | Top 8 points |
|---|---|---|---|---|---|
| USA | 1 | 1 | 1 | 1 | 1 |
| KEN | 2 | 2 | 2 | 2 | 2 |
| JAM | 3 | 3 | 3 | 3 | 3 |
| CHN | 4 | 4 | 4 | 5 | 5 |
| GBR | 4 | 5 | 5 | 3 | 4 |
| ETH | 6 | 7 | 7 | 7 | 7 |
| POL | 7 | 8 | 8 | 6 | 8 |
| GER | 8 | 6 | 6 | 3 | 6 |
| CAN | 11 | 10 | 11 | 10 | 10 |
| Nation | Medal points | Top 5 | Top 5 points | Top 8 | Top 8 points |
|---|---|---|---|---|---|
| GBR | 2 | 3 | 2 | 4 | 3 |
| NED | 1 | 1 | 1 | 1 | 1 |
| AUS | 3 | 2 | 3 | 2 | 2 |
| FRA | 5 | 6 | 5 | 3 | 4 |
| GER | 6 | 4 | 6 | 5 | 6 |
| USA | 4 | 5 | 4 | 6 | 5 |
| NZL | 7 | 7 | 7 | 7 | 7 |
| SUI | 8 | 11 | 10 | 8 | 10 |
| CAN | 22 | 10 | 15 | 12 | 12 |
| Nation | Medal points | Top 5 | Top 5 points | Top 8 | Top 8 points |
|---|---|---|---|---|---|
| USA | 1 | 1 | 1 | 1 | 1 |
| AUS | 2 | 2 | 2 | 2 | 2 |
| HUN | 4 | 7 | 5 | 7 | 6 |
| CHN | 3 | 4 | 3 | 3 | 3 |
| GBR | 5 | 3 | 4 | 4 | 4 |
| JPN | 6 | 5 | 6 | 5 | 5 |
| ITA | 7 | 9 | 8 | 9 | 9 |
| RUS | 8 | 6 | 7 | 6 | 7 |
| CAN | 9 | 8 | 9 | 8 | 8 |
Winter
| Nation | Medal points | Top 5 | Top 5 points | Top 8 | Top 8 points |
|---|---|---|---|---|---|
| AUT | 1 | 1 | 1 | 1 | 1 |
| SUI | 2 | 2 | 2 | 2 | 2 |
| USA | 3 | 4 | 4 | 7 | 5 |
| NOR | 4 | 3 | 3 | 4 | 4 |
| FRA | 5 | 5 | 5 | 3 | 3 |
| CAN | 6 | 9 | 6 | 9 | 7 |
| SWE | 6 | 6 | 7 | 6 | 6 |
| SLO | 8 | 10 | 8 | 10 | 5 |
| Nation | Medal points | Top 5 | Top 5 points | Top 8 | Top 8 points |
|---|---|---|---|---|---|
| NOR | 1 | 1 | 1 | 1 | 1 |
| SWE | 2 | 2 | 2 | 2 | 2 |
| RUS | 3 | 4 | 3 | 5 | 4 |
| FIN | 4 | 3 | 4 | 3 | 3 |
| USA | 5 | 5 | 5 | 4 | 5 |
| ITA | 6 | 7 | 6 | 10 | 9 |
| CAN | 7 | 7 | 7 | 8 | 8 |
| SUI | 8 | 7 | 7 | 6 | 6 |
| Nation | Medal points | Top 5 | Top 5 points | Top 8 | Top 8 points |
|---|---|---|---|---|---|
| NED | 1 | 1 | 1 | 1 | 1 |
| KOR | 2 | 2 | 2 | 3 | 2 |
| CAN | 3 | 3 | 3 | 2 | 3 |
| CHN | 4 | 4 | 4 | 4 | 4 |
| USA | 5 | 5 | 5 | 7 | 6 |
| JPN | 6 | 7 | 7 | 5 | 7 |
| RUS | 7 | 6 | 6 | 6 | 5 |
| CZE | 8 | 10 | 8 | 11 | 10 |
Methodology
The Olympic Ranking Index is a product of Sport Canada, based on data collected and compiled through the Sport Tracking, Assessment, and Technical Statistics (STATS) database.
The frequency of senior world championships varies from sport to sport and, in some cases, between disciplines of a sport. Consequently, the number of sports and events awarding medals at senior world championships differs every year, making it difficult to establish a consistent comparison method of a nation’s performance based on its total results at senior world championships from one year to the next. In order to reduce the impact of these annual variations, two parameters are considered in the development of the Index.
Parameters
1: Olympic medal events
The sports that are on the current Olympic program represent a total of 339 medal events. These events have well-established international competitive opportunities across continents. In addition, they are all regularly contested during senior world championships and Olympic Games. Although field sizes and number of entries per nation are generally more restricted during Olympic Games, the sport-specific and event-specific rules and conditions are the same in both types of competition. This, then, provides the first step to developing a consistent and valid comparative approach.
2: Four-year cycle
The use of aggregate results over a multi-year period is a well-established and proven method of ranking nations. Soccer, Volleyball and Figure Skating are just a few sports whose International Federation uses a World Ranking system based on aggregate multi-year results to rank nations, teams or athletes.
During any concurrent four-year cycle, every Olympic medal event, whether summer or winter, has one Olympic Games and at least one Senior World Championship. For the four-year cycle ending in December 2018, this represents a total of 1,479 events. Furthermore, the aggregate four-year total of events for any given sport tends to remain proportionate to the number of events on the Olympic program the sport represents out of the total of all Olympic events.
Limitations
1: Olympic sports and events only
The Index does not include results achieved in non-Olympic sports and non-Olympic events. The number of Olympic sports and events is a known and limited parameter while the number of non-Olympic sports and events is open. There are dozens of non-Olympic sports that have World Championships but that are either not played or not supported in Canada. There are also a number of non-Olympic sports that are well organized and supported in Canada and elsewhere, but are less widely represented. The absence of standards regarding minimum field sizes, number of nations, selection criteria and event frequency further complicates the identification of which non-Olympic sports and events could or should be included. Sports and events added to the Olympic program are included as of the third year preceding their debut at an Olympic Games. Sports and events discontinued from the Olympic program are removed following their last Olympic presence or in the year a replacement event is approved by the International Olympic Committee (IOC).
2: The length of the ranking cycle has an effect on ranking
The four-year cycle aggregates performances across all of a sport’s Olympic events in each of its World Championships and Olympic Games of that four-year cycle. Sports that have both a large number of events and an annual World Championship carry more weight than sports that have worlds every 2 years or that have few events. In addition, a number of winter and summer sports have annual World Championships including in Olympic years. In order to avoid any double counting, a maximum of one result per year is included in the Index. Therefore, in the case of a sport having both Olympic and Worlds the same year, only the Olympic results are included for that year.
3: Ranking is based on four years
The Index provides an accurate representation of a nation’s ranking as of December 31 of each year based on the cumulated results of the past four years. This does not provide an accurate representation of results achieved for a specific year. Any given year’s results only account for approximately a quarter of the four-year ranking.