
Literature review on the Canadian art market and the socio-economic conditions of the visual arts market
Final report
For Creative Marketplace and Innovation Branch, Department of Canadian Heritage
April 2018
Preface
This literature review on the Canadian visual arts market was carried out at the request of the team at Canadian Heritage's Creative Marketplace and Innovation Branch (CMIB). Focusing on studies published in the last 10 years, the review examines the economic impact of the visual arts market and the socio-economic conditions of cultural workers, including visual artists. All reviewed publications are listed in the appendix.
The purpose of this literature review was to:
- Examine the structure of the art world and the economic impact of the Canadian visual arts market
- Describe the visual arts supply chain and how it has changed, if at all
- Provide an overview of the socio-economic conditions of cultural workers, including visual artists, and segment data on the market's accessibility to ethnocultural communities such as visible minorities, Indigenous people, women, etc.
- Report any other important consideration found in the literature on the Canadian visual arts market
I sincerely hope the information in this report will be useful to those unfamiliar with the art world and allow the CMIB team to carry on its development efforts with an in-depth understanding of the inner workings of the visual arts market.
Christine Blais
Doctoral Candidate in Art History and Market Studies
On this page
- Preface
- List of acronym and abbreviation
- List of figures
- Highlights
- Difficulty of finding data on the visual arts market
- An opaque market
- Growth of private sales
- Challenges of art galleries and dealers
- Impact of digital platforms on direct sales by Inuit artists
- More art collectors, less spending per artwork
- Cultural diversity and gender equality
- Better understanding the practices of Indigenous and minority artists
- Increased presence of Indigenous art in traditional distribution networks
- The socio-economic conditions of cultural workers can be as precarious as those of artists
- Methodology
- Introduction
- Part 1 – Distribution networks
- Part 2 – The visual arts market
- Part 3 – Socio-economic conditions of cultural workers
- Appendix
- Bibliography
List of acronym and abbreviation
- ACE
- Arts Council England
- ADAC
- Art Dealers Association of Canada
- AGAC
- The Contemporary Art Galleries Association
- CALQ
- Conseil des arts et des lettres du Quebec
- CCA
- Canada Council for the Arts
- CENSUS
- Canadian proram to draw a statistical portrait of the country every five years
- CMIB
- Creative Marketplace and Innovation Branch
- CSA
- Culture Sattelite Account
- IAB
- Iqaluit Auction Bids
- MAC
- Montreal Art Council
- MCC
- Ministère de la Culture et des Communications
- NADA
- New Art Dealers Alliance
- NAICS
- North American Industry Classification System
- NHS
- National Household Survey
- OCCQ
- Observatoire de la culture et des communications du Québec
- RAAV
- Regroupement des artistes en arts visuels du Québec
- SSHRC
- Social Sciences and Humanities Research Council
- TCI
- TCI Management Consultants
- TEFAF
- The European Fine Art Fair
List of figures
- Figure 1: Visual arts ecosystem model (McIntyre 2004, 6)
- Figure 2: Artist profiles map (Sagot Duvauroux and Moureau 2012, 51)
- Figure 3: Public museum representation by culture (Maranda 2017)
- Figure 4: Gallery representation by culture (Maranda 2009)
- Figure 5: Gallery representation by gender (Maranda 2014)
Highlights
Difficulty of finding data on the visual arts market
Much research remains to be done on the art market. Unfortunately, because of its opacity, it can be particularly difficult to obtain exact figures measuring the contribution of the visual arts to the Canadian economy. Most surveys use different or incomplete methodologies. Some studies on the visual arts market had to be suspended due to a lack of cooperation from market players (Routhier 2006) or a lack of raw data, in particular as a result of changes to Statistics Canada's "Survey of Household Spending" and the drop in culturally relevant data (Hill Strategies Research 2016).
An opaque market
The opacity of the visual arts market makes it very difficult to obtain data. Because of the anonymous nature of transactions, data obtained from research is often incomplete. As such, a significant amount of extrapolation is required to get usable data. It is very difficult to assess the market value of the visual arts.
Growth of private sales
The "TEFAF Art Market Report 2017" highlights a change in the supply chain of visual arts products at the international level, with transactions shifting from auction houses (public sales) to galleries and other private stakeholders (Pownall 2016). This is due to growing demand from collectors favouring opaque transactions, concerned about global socio-economic developments (Brexit, American politics, etc.) and above all, in search of greater anonymity. Auction houses are also increasingly offering private sales services (Pownall 2016; McAndrew 2017).
Challenges of art galleries and dealers
The gross revenues of art galleries vary widely and most dealers and private galleries post marginal profits of 10% or less (negative) mainly due to high operating expenses to ensure mediation work (physical space, fairs, payroll). As Routhier (2006) points out, income diversification is often necessary and many businesses are forced to rely on other sources of income such as appraisals, framing, publishing, etc.
Impact of digital platforms on direct sales by Inuit artists
While wholesale suppliers and dealers remain important platforms for Inuit art sales across Canada and internationally, direct-to-consumer transactions have soared in recent years owing to digital platforms, which have made selling artworks and handicrafts much more profitable for these artists. This has enhanced their quality of life, especially considering the extremely high cost of living in the North (Big River Analytics 2017).
More art collectors, less spending per artwork
The Quebec Ministry of Culture and Communications' (MCC) quinquennial survey of cultural practices reveals that 7.4% of Quebecers acquired a work of art in 2004, 11.6% in 2009 (Audet et al. 2009), and 26% in 2014 (MCC 2016). However, though this data should be taken with a grain of salt given the methodological framework, the "Survey of Canadian Household Spending from 2012 to 2016"shows that Canadians are spending less and less per work of art (including antiques and decorative items): $100 in 2012, $82 in 2013, $87 in 2014, $75 in 2015 and $78 in 2016.
Cultural diversity and gender equality
Maranda (2017) makes it clear that the cultural industry still has a long way to go with respect to cultural parity and pay equity between men and women. Women working in cultural institutions earn on average 20% less than men despite outnumbering them. According to the researcher, women are also less likely to be in leadership positions. Parity is also lacking in the visual arts distribution industry: while a majority of living artists are women (over 60%), only a small proportion of them are represented by galleries (Delgado 2018; agYU 2014). While the Canadian population is becoming increasingly diverse, cultural institutions have lagged behind, whether regarding staff, independent curators or artists (Maranda 2017).
Better understanding the practices of Indigenous and minority artists
Indigenous and minority artists often face the same problems. These include having difficulty achieving professional status, lacking visibility, not being fairly recognized (Uzel 2017, 9, 51) and feeling discouraged (Uzel 2017, 57–58). Conversely, they differ in other key aspects such as mixed techniques and media, cultural heritage and the notion of "contemporary" (so often opposed to "traditional"). Multimedia practices, which often include traditional techniques, are not always as appreciated by the community as they are by sponsors. Consequently, better peer representation on selection committees and panels is recommended to foster a better understanding of these practices (Uzel 2017).
Increased presence of Indigenous art in traditional distribution networks
Maranda (2009) reveals a substantial improvement in gallery representation (from 16% to 47% in 2012) and level of education among Indigenous artists, which may be connected to growing average incomes and, according to researchers, may also be evidence of a trend.
The socio-economic conditions of cultural workers can be as precarious as those of artists
It is well established that artists have low incomes and that still holds true, though the situation has improved overall. That said, the literature shows that some indicators apply to cultural workers as well (Azoulay & Paradis 2018; Maranda 2017; Hill 2014; AGAC 2016). While a majority of visual arts professionals have post-secondary degrees, they still earn less than the average Canadian worker. Many do not have regular employment, temporary jobs being more common (according to Azoulay and Paradis [2018, 10]; there are now almost three times more cultural workers holding more than one job than there were in 1990).
Methodology
This review was carried out over a period of nine (9) weeks, from February 26 to April 27, 2018. It focused on recent literature, i.e., published in the last decade (with some exceptions), covering both mainstream and specialized media. Three main types of documents were consulted: very recent articles (newspapers, specialized magazines), theoretical works and research and survey reports (e.g., Statistics Canada, the Observatoire de la culture et des communications du Québec (OCCQ), Hill Strategies). References are cited in-text using the author-date system and consulted works are listed in the appended bibliography.
Since the Canadian art market and its economic impact are seldom discussed in academic literature, most of the works consulted were articles from periodicals or reports from cultural or government organizations. Some academic publications are included in the report to address certain fundamental and major theories that help put the data into perspective and make it easier to understand the dynamics of the art market and industry (symbolic economy, fields and spheres of art, etc.).
Some works were recommended to Canadian Heritage in fall 2017 in the context of broader consultations with Canadian cultural professionals. These include "Waging Culture: A Report on the Socio-Economic Status of Canadian Visual Artists", by Michael Maranda (2009), and "Les artistes en arts visuels – Portrait statistique des conditions de pratique au Québec", published by Observatoire de la culture et des communications du Québec in 2010 (Routhier 2013b). These works appear in the bibliography, preceded by an "(R)" for "recommended."
Throughout the literature review on the Canadian visual arts market, we tried to use sources from across Canada or sources that would allow us to provide a representative analysis of the whole country and/or address specific situations in each province, as the case may be. However, the research communities in Quebec seem to have been particularly productive and proactive in collecting and analyzing data. The Institut de la statistique du Québec's Observatoire de la culture et des communications (OCCQ) has produced various surveys providing valuable information, in particular with respect to the acquisition of artworks by Quebec institutions, businesses and municipalities (Routhier 2015, 2013a, 2011, 2006) and the socio-economic conditions of cultural workers, including artists (Routhier 2013b, 2013c). Also, with all the public consultations being held with a view to updating Quebec's cultural policy (2016), several organizations have released briefs of interest to this study.
Given the paucity of information from Canadian sources, some international studies were used to assess the economic weight of the Canadian art market (for example: McAndrew 2017, 2018; Pownall 2017; Deloitte 2016). Other international studies are also referenced, in particular regarding the cultural products distribution chain (McIntyre 2004; Dalhoff 2017; Belting 2013), the issues facing cultural entrepreneurs (Resch 2016; McAndrew 2018) and academic publications on the fundamental theories of the art world (Moulin 1992, 2002; Moulin & Quemin 1993; Moureau & Sagot-Duvauroux 2012; Benhamou 2011; Hutter & Thorsby 2008), as they provided valuable theoretical and global perspectives.
Given the scope of the review and the short timeframe to carry it out, only the latest and most important works directly related to the mandate were selected for "laymanization." The goal was to provide a broad and detailed analysis of the four priority areas set out by Canadian Heritage (listed in the preface). This literature review is intended to be unbiased and free of professional opinions and personal judgments.
Final report
Literature review: the Canadian art market and the socio-economic conditions of the visual arts market
Introduction
David Heffel, President of Heffel Fine Art, said in a 2016 interview that "the Canadian art market is at a new level. Maturity is a thing that comes to mind, collectors are now thinking about new ways to share their collections with the public and we're also seeing a sophistication develop in our marketplace (Craig 2016)." Local artists across the country seem to be getting more visibility from various audiences, in particular thanks to museum exhibitions, which are trending up, and major investments in public works by businesses and municipalities. Canadian private and corporate collectors are also increasingly active, getting media coverage and making their collections available to the public through private museums or public exhibitions. Canadian artists have also been getting more attention on the international scene in recent years. The same goes for high-profile biennial events and art fairs, where Canadian artists and businesses (galleries and dealers) have been enjoying greater visibility. So how is the Canadian art market doing in this context and what issues and challenges are Canadian artists and workers currently up against?
Very few comprehensive studies have been done on the art market. This review does not aim to offer a new perspective on the matter or to further the research, but rather to provide an in-depth look at the inner workings of the Canadian visual arts industry over the last ten years. Before delving into the review, which is broken down into three parts (distribution networks, the art market and socio-economic conditions), we should start by defining some key concepts that form the theoretical framework of the study.
The art market is often simply divided into "primary" and "secondary" segments that are clumsily associated with contemporary or earlier art. The primary segment refers to artists' initial sales, whereas the secondary segment refers to subsequent sales (resales). In reality, the market should probably be thought of as a set of markets, each representing a type of art or area (when viewed from an international perspective). However, the dynamics of the art market, as discussed in this study, are more complex.
Known for her trailblazing art market research, sociologist Raymonde Moulin (1992) distinguishes three main markets. The "chromos" market, initially defined by Quebec professor Francine Couture in her thesis in the early 1980s. "Chromos" works are generally mechanically produced studio paintings with no real artistic intentions on the part of the artist other than to meet consumer demand for themed artwork. They are usually "good quality but stereotypical decorative items manufactured for a monopolistic competition market with a wide audience and an abundant supply (e.g., artwork sold in big box retail stores and decorative pieces)." Then you have the "classified works" market, i.e., sure-value items that "history has already passed judgment on and have a fixed supply." The third market category, contemporary and current works, has a more fluid supply. Cultural economist Françoise Benhamou specifies that the last two markets are small and have very few stakeholders to distribute and legitimate artwork (i.e., accept it into the market) (Benhamou 2011, 43).
Legitimation network
Economic historian Stefano Baia Curioni has recently determined that the contemporary art appraisal process is governed by a complex and dynamic network of actors (Baia Curioni, Forti & Leone 2015). They are today, more than ever, mobile actors in an international art market (Moulin & Quemin 1993; Baia Curioni, Forti & Leone 2015; Belting 2013), and private galleries play a key social role in these international networks, in particular owing to how important art fairs and major exhibitions are to the art market. In parallel, it is important to understand the role of artwork legitimation networks, i.e., consensus-building stakeholders that recognize current artistic practices. Benhamou refers to these networks as "tastemaker communities," a caricatural term for the art world's legitimation authorities, who hold great sway over the symbolic value and social capital of artwork: dealers, critics, curators, commissioners-curators, the research community, along with some high-end collectors and mega-galleries or "leading galleries" (Moulin 1992), which are highly influential private galleries with hybrid business models, i.e., crosses between commercial galleries and museums.
The concept of symbolic value
In the art world, the value of works cannot be determined from a purely financial or economic perspective. Economics cannot be the only guideline for assessing the value of art. As posited by sociologist Pierre Bourdieu: "all the calculations in the world have no hope of even remotely improving our understanding of what exactly makes a work of art valuable and desirable (Bourdieu 2000, 24)." That is where symbolic value comes in—the symbolic value attributed to works, artists and provenance, for example, can help explain how prices are determined (Velthuis 2007). Bourdieu indicates that "this is clear in areas like the [...] artistic field, where social production mechanisms of non-economic interests—in the strictest sense—are governed by laws unrelated to economics [...] (Bourdieu 2000, 23)." Thus, in the art world, price does not equal value. A 2017 study conducted by art insurance specialist AXA Art made that point clear: a quarter of interviewed European collectors believed that the price of an artwork had no correlation with its value, with most of them feeling that the prominence of the artist and emotional attachment to the artwork were more important factors in the decision-making process than price (Dalhoff 2017, 23).
The art world network is therefore vital to establishing the value of artwork but is not quite the same as the (commercial) visual arts distribution network. The distribution network can be boiled down to a few types of stakeholders, which will be addressed in the following pages, such artist entrepreneurs, commercial galleries and auction houses. The profitability of these businesses and cultural organizations varies (Azoulay & Paradis 2018), and we will try to shed some light on the issues these principal entrepreneurs face. In addition, we will discuss two platforms that have grown considerably in recent years: fairs and digital technology. We will also examine how distributors are changing their business models, in particular with respect to public and private sales.
The second part of the report will analyze studies that have attempted to assess the Canadian art market's economic impact. It should be noted that these studies are greatly limited by the opacity of the art market, which makes finding financial sales data very difficult. Consequently, the figures obtained by the researchers should be taken with a grain of salt, as they were likely arrived at, at least to some extent, through extrapolation. The methodology of each study will be detailed as much as possible so readers can judge for themselves.
The third and final part of the report consolidates recent studies on the socio-economic conditions of cultural workers in the visual arts. Although the issues of non-artist workers are often highlighted, few studies address them. Research is limited in this area, and future studies should be more comprehensive. On the other hand, there is plenty of source material on the socio-economic conditions of visual artists, in particular minority and Indigenous artists, thanks to growing government concerns regarding cultural policies and institutions increasingly emphasizing cultural parity in their programming (Maranda 2017).
Part 1 – Distribution networks
1.1 Supply chain
According to Baia Curloni, the art market is a networked environment where insiders and outsiders meet and supply does not follow demand—rather, supply drives the exchange system (Baia Curioni 2014, 38). The challenge of summarizing the visual arts supply chain is describing it. To quote the Observatoire de la culture et des communications du Québec (OCCQ), the supply chain is not the same for "museum artists as it is for others (Routhier 2013b)."
The term "museum artist" used by the Observatoire (OCCQ) is very appropriate because, as we saw in the introduction of this report, the cultural products supply chain is not only driven by the distribution of products (artwork), but rather by a set of conventions specific to the art world whereby museums legitimate the symbolic value of artists and their work. Many publications have attempted to define the cultural product supply chain, but none has taken into account the theoretical framework specific to the art world network (Rivest 1992; Dalhoff 2017).
That said, in a study commissioned by Arts Council England, McIntyre (2004) put forward a more than adequate diagram illustrating the visual arts production and distribution network, although it could use an update considering its publication date (Fig. 1). McIntyre's simple model of the professional visual arts ecosystem is perfectly suitable for our purposes.
The proposed ecosystem is structured as follows:
- Artists grow and develop in their academic environment, where they build their peer network
- They then participate in typically curated exhibitions
- This visibility and recognition within the cultural community can provide access to the distribution network, including dealers (galleries, fairs) and publicly funded spaces
- Galleries can generally use their network and business connections to get artists into public and corporate collections
The model shows how the artwork of all artists, whether living, emerging, established or even deceased, contemporary or not, makes its way through legitimation networks. Of course, in the case of resales, works are traded between sellers and buyers. To complete the diagram, another stakeholder would have to be added where the two circles meet: the auction house.
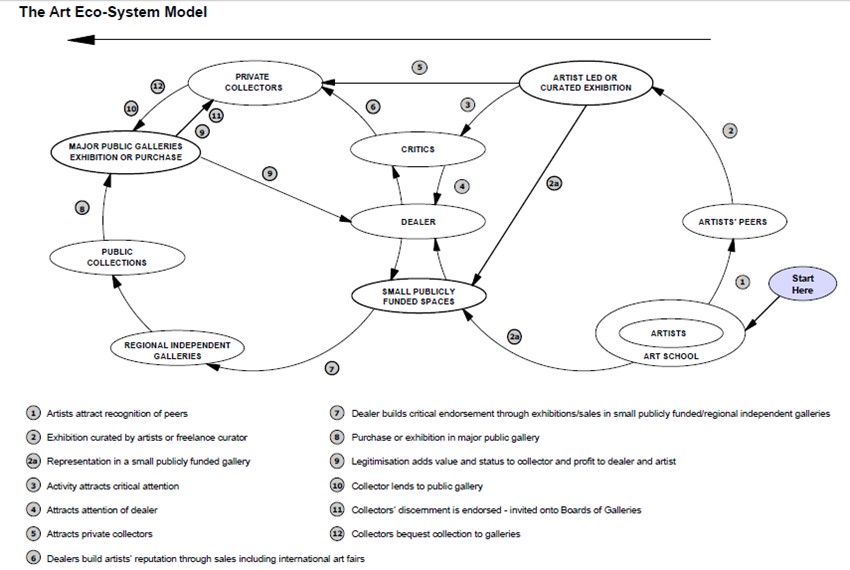
Figure 1: Visual arts ecosystem model (McIntyre 2004, 6) – text version
The visual arts ecosystem model is a graphic representation of the environment visual artists exist in.
The model uses arrows and circles to show how artwork makes its way through legitimation networks.
At the bottom of the model is a numbered list of parts of the network. Those parts are associated in the diagram with corresponding features and outputs.
Part of the Network Corresponding Feature Corresponding output 1 Artists attract recognition of peers Artist and Art school Artists' peers 2 Exhibition curated by artists or freelance curator Artists' peers Artist led or curated exhibition 2a Representation in a Small publically funded gallery Artist led or curated exhibition Small publicly funded spaces Artists and Art school Small publicly funded spaces 3 Activity attracts critical attention Artists led or curated exhibition Critics 4 Attracts the attention of dealer Critics Dealer 5 Attracts private collectors Artists led or curated exhibition Private collectors 6 Dealers build artists' reputation through sales including international art fairs Critics Private collectors 7 Dealer builds critical endorsement/sales in small publicly funded/regional independent gallery Small publicly funded spaces Regional independent galleries and public connections 8 Purchase or exhibition in major public gallery Public connections Major public galleries exhibition or purchase 9 Legitimation adds value and status to collector and profit to dealer and artist Major public galleries exhibition or purchase Private collectors 10 Collector lends to public gallery Private collectors Major public galleries exhibition or purchase 11 Collectors' discernment is endorses – invited onto Boards of Galleries Private collectors Major public galleries exhibition of purchase 12 Collectors bequest collection galleries Private collectors Major public galleries
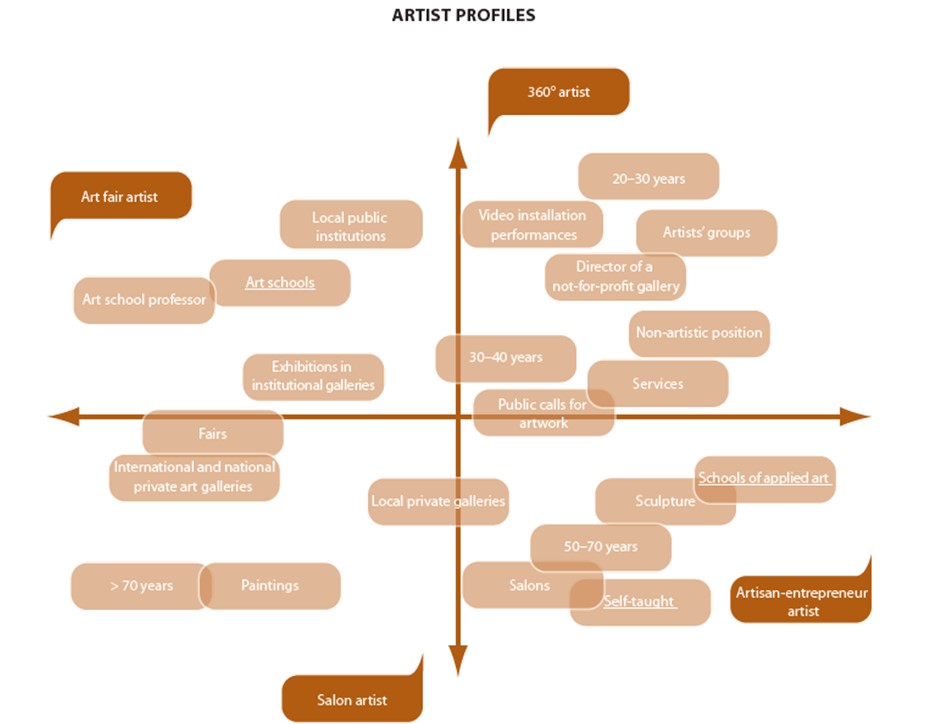
According to Dominique-Sagot Duvauroux and Nathalie Moureau (2010), there are basically four distributor segments, each corresponding to very distinct artist profiles (Fig. 2) providing context for McIntyre's "dealers."Footnote 1 On one hand, you have the mass-produced items the authors call "mass consumer products," which can be likened to the aforementioned "chromos" and can include commercial Indigenous artwork (Big River 2017; Nordicity). This is the market of "artists in the process of legitimation"—typically young artists who have yet to be accepted by traditional legitimation and distribution networks. These artists generally try to build their reputation online and through low-profile artist and exhibition centres. They can be generally targeted by emerging galleries with innovative business models and medium-sized galleries, who take some of them under their wings. Medium-sized galleries are the biggest segment in the commercial ecosystem. Typically run by a manager (often the owner) and a few employees, these galleries seek to showcase a good mix of emerging and more established artists more likely to appeal to collectors. Sagot-Duvauroux and Moureau also distinguish the "high-profile vanguard" market, which includes the relatively few "360o artists" (multidisciplinary and innovative) and "fair artists" (commercially successful with current works responding to demand) with established reputations, access to the institutional market and fairly speculative values. These artists generally start out in mid-level galleries and work their way up to mega galleries, highly commercial establishments providing artists with strong sales and international exposure from participation in various events. These galleries have considerable operating budgets and are often financially supported by patrons. Lastly, Sagot-Duvauroux and Moureau identify an "established talent" market, typically a secondary market for recognized living or dead artists, i.e., for works having entered into history and institutions (Savot-Duvauroux and Moureaux 2010).
-
Figure 2: Artist profiles map (Sagot Duvauroux and Moureau 2012, 51) –text version
This infographic displays profiles of artists through a graph.
In each quadrant are text bubbles with text describing types of artists.
The first quadrant is labeled "360 degree artist". In this quadrant are the following descriptions that reflect these artists:
- 20-30 years
- Video installation performances
- Artists' groups
- Director of a not-for-profit gallery
- 30-40 years
- Non-artistic position
- In the services
- Public calls for artwork
The second quadrant is labeled "art fair artist". In this quadrant are the following are descriptions that reflect these artists:
- A part of local public institutions
- Art school professors
- Involved in Art schools
- Have their exhibition in institutional galleries
In the third quadrant are the "salon artist". In this quadrant are the following descriptions that reflect these artists:
- Involved in fairs, international and national private art galleries and local private galleries
- > 70 years
- Paintings
In the fourth quadrant are the "artisan-entrepreneur artist". In this quadrant are the following descriptions that reflect these artists:
- Self-taught
- Schools of applied art
- Main art form is making sculptures
- Display their work in local private galleries and salons
- 50-70 years
1.1.1 Artist entrepreneurs
In 1992, Rivest defined artists as "creators, designers, etc., and professionals in control of their own work. As such, they are ultimately responsible for the direction their careers and businesses take (Rivest 1992, 5)." Artists nevertheless receive plenty of advice and guidance from stakeholders in the art distribution network, which Rivest calls the "integrated distribution network." This definition of the professional artist still holds true today. However, both artists and the network have become professionalized, as we will discuss in Chapter III on the very high level of education of today's artists.
Unfortunately, very little public information was found on the realities of artist entrepreneurs or their involvement in their own market. Routhier (2013b) pointed out that a large proportion (3/4) of Quebec artists are self-employed and that 31% of them have their own business (Routhier 2013b, 75).
A survey by Big River Analytics (2017) shows that for Inuit art, the link between the artist and the buyer has recently greatly expanded owing to digital platforms. Most sales by Nunavut artists are now made directly to consumers. This has made selling artworks and handicrafts much more profitable for these artists, especially considering the extremely high cost of living in the North.
Artists also have access to many professional platforms where they can market their works themselves, including fairs like The Artist Project (Toronto), La Biennale de Québec, the Saint-Lambert fair, and a project to launch in 2018, the Marché émergent fair, set up by Carrefour jeunesse-emploi du Centre-Ville (Montreal) in collaboration with prominent Montreal cultural organizations.
In addition, members of some artist associations often have access to low-cost training and workshops aimed at developing their business knowledge and skills. Artist centres also showcase their members' work at some of the events they organize, such as fundraising sales and auctions.
1.1.2 Commercial galleries
Art sociologist Nathalie Heinich once said that contemporary art has "expanded the frontiers of art so much that it is now accessible only to those who have managed to enter its well-defined world, which is no longer penetrated through the contemplation of objects [...] but through the stories that surround them, that is, the people who tell them." That is why gallery owners play such an important role—they are not just distributors, but also mediators. Dominique Sagot-Duvauraux and Nathalie Moureau classify gallery owners, the champions of contemporary art, as "promotional galleries," as indicated above.
In 2016, the Contemporary Art Galleries Association (AGAC)Footnote 2 conducted a study highlighting some of the issues encountered by private contemporary art galleries. Their findings on average revenues are consistent with those of other studies, i.e., gross revenues vary greatly from one gallery to another: from $40,000 to nearly $2 million. Correspondingly, Pownall's analysis of NAICSFootnote 3 data covering roughly the same period shows that the vast majority of dealers and private galleries (>1,000) generate less than C$500,000 in revenues and about 300 to 400 businesses generate $500,000 to $1 million (Pownall 2017, Fig. 117). These figures may seem impressive, but keep in mind that these are gross revenues.
The commercial practices of private galleries are fairly similar in the sense that the business models of most of these companies—be they large, medium or small—are governed by certain conventions. Their role of promoting artists and marketing and disseminating their work has traditionally involved maintaining an inventory, covering promotion costs (catalogue, vernissages, etc.) and providing mediation services (employees, premises with fixed opening hours, etc.). International fairs have gotten bigger and bigger since the 1990s, and gallery owners have been investing significant sums to participate in these events and try to develop new markets (Resch 2016; AGAC 2016; Winkelman 2015; Pownall 2017). These conventions are followed by virtually all gallery owners showcasing current, contemporary or older works. Resch (2016) has suggested that the budget items that hurt the profitability of art dealers and galleries the most are location and fairs—both major expenses. AGAC (2016) shares this opinion, and considering all the Canadian galleries that have closed in recent years, the situation seems to be similar across the country.
Art galleries and dealers around the world are mainly concerned about the following issues: finding new customers (71.78%), consigning new works/increasing their inventories (49.5%), fair and exhibition costs (49.01%), financial profitability capacity (46.04%) and maintaining and retaining customers (43.07%) (Pownall 2017, 52–55). While many of the entrepreneurs running many of these more traditional small- and medium-sized businesses are certainly well versed in the visual arts, they often lack management training, which can explain their low profitability (Resch 2016, 49).
It should be noted that when working with living artists, gallery owners and artists agree on the terms of a commission, which is usually 50% (Benhamou 2011, 44; AGAC 2016; Rivest 1992).Footnote 4 Since galleries rarely receive grants (except for certain projects), they rely on this commission to keep their business running and to cover all commercialization costs (including managing the gallery, transporting artwork, marketing and sometimes framing, carried out in whole or in part with the artist). As a result, AGAC (2016) notes that about 35% of galleries were in the red in 2015, an alarming figure that brings into question the viability of these companies. These findings were echoed by Harvard economist and Professor Magnus Resch, who conducted a study which showed that 60% of art galleries in the United States, France and Germany (Resch 2016, 26) had negative or marginal profits of 10% or less.
However, larger businesses, in addition to having elaborate organizational structures and more employees (Routhier 2006; Resch 2016) facilitating daily operations, are putting a fair bit of emphasis on the secondary market. According to Routhier (2006), "reselling is rare among small dealers and is largely exclusive to dealers with average-to-high revenues (Routhier 2006, 10)." Furthermore, AGAC (2016) figures show that contemporary art galleries that sell artwork to secondary markets generally get a substantial share of their revenues from those sales. With so many dealers and galleries seemingly dependent on reselling artwork to survive, maybe these businesses are just not very profitable.
Nevertheless, new business models are starting to emerge that place greater emphasis on entrepreneurship than on art world conventions. As demonstrated by Resch (2016), galleries using these models are generally profitable when managed according to business principles, but do not always benefit from the legitimation of the art world, which is problematic and detrimental for artists. Unfortunately, the literature on these innovations is limited at the moment, so any further analysis will have to wait.
It should also be noted that galleries and dealers involved in the First Nations art trade use a different and, sadly, poorly documented model, limiting the information we can provide in this report. However, we do know that art produced by a living artist must first be traded through a Co-op.
1.1.3 Auction houses
Through their transparency and expert-led research, auction houses provide additional services by revealing appraisals and purchase prices and advancing our knowledge of artwork, resulting in an increasingly informed public (Pownall 2017, 44). New collectors are increasingly better informed, strengthening the private sales sector (Pownall 2017, 46). Now more than ever, auction houses and galleries have mutually beneficial relationships.
Auction houses have traditionally been associated with public sales of secondary market art. However, they are increasingly selling primary market works, in particular since British artist Damien Hirst set the precedent by auctioning his art at Sotheby's in 2008. Closer to home, street art is also sold at some Montreal auction houses. Clearly, strictly categorizing the business models of art market stakeholders based on a primary/secondary market split has become very misleading.
While auction houses have been used as economic health indicators for the art market, the literature cautions against reading too much into public sales. Record sales typically happen when outstanding works are put up for auction (leading to some occasionally ridiculous sales figures) or when extensive media coverage provides exceptional visibility and publicity. For example, the Canadian art market posted some impressive numbers in 2016, but that was mainly due to a Lawren Harris exhibition curated by actor Steve Martin—an event that featured at least one record-setting sale. This kind of success does not necessarily carry over to the next year, as David Heffel pointed out in an interview with the Financial Post: "In fact, national art markets are often subject to the persuasions and tastes that align with what is most coveted at the highest spending brackets (Craig 2016)." Moreover, Heffel Fine Art is particularly interesting, not only because the company is one of the country's leading auction institutions, but also because of how its business model has shifted toward private and online sales in recent years—a prime example of the phenomenon observed by Pownall. This trend is detailed in section 1.2.2.
With respect to Inuit art, Big River Analytics illustrates the full impact of art auction sales by factoring in all elements indirectly associated with them (transportation, photography, maintenance, catalogue production, etc.): "The casual reselling of Inuit arts and crafts does not represent significant new economic activity. However, the large-scale auctioning of many pieces conducted by auction houses does generate an economic impact through the work of curating, photography, design, the production of catalogues, restoration, the building of bases, insurance, marketing and the storing of artistic pieces (Big River Analytics 2017)." Two auction houses dominate the secondary sales of Inuit art in Canada: Walker's Fine Art and Estate Auctions, and Waddington's Auctioneers and Appraisers.
1.1.4 Events such as art fairs
Big events like fairs are becoming a critical platform for the art trade. They allow various stakeholders (galleries, collectors, institutions, commissioners) to help legitimate cultural products (works and artists) that can integrate the sphere of contemporary art, thereby giving these products symbolic value (Baia Curioni 2014). Economic historian Baia Curioni rightly states that:
At any rate, these supply networks define what art is, contribute to producing it, and are an intimate part of its essence. These are not distribution chains that can be disintermediated (for example, by the Internet) without serious consequences. These are mediation chains that transform the meaning of what they mediate… their action is still a necessity, at least in the contemporary system. (Baia Curioni 2014, 38)
At most large fairs, only dealers and galleries are allowed to have exhibits, while some smaller local events will also assign booths to artist-entrepreneurs. Canadian fairs such as the Toronto International Art Fair and Quebec's Foire Papier are key events directly generating millions in benefits and cultivating new audiences at the local level. Conversely, an ever-increasing number of Canadian dealers are participating in international fairs such as NADA (Miami, New York), Los Angeles Contemporary, Material or Zona Mexico, Taxi (Brussels), and Volta (Basel, New York), to name but a few. While artists represented at these high-profile international events can get a massive boost in recognition, it comes at high cost for dealers.
1.2 Supply chain innovation
1.2.1 Private and public sales
The "TEFAF Art Market Report 2017" reveals an interesting supply chain phenomenon. Transactions have recently been shifting from auction houses (public sales) to galleries and other private actors (Pownall 2016). This market trend is one of the report's main themes and makes it even more difficult to get data on the size of the art market because the private sector is more opaque.
As the researchers have highlighted throughout the TEFAF report, buyers want opaque transactions. They are concerned about the rather uncertain global socio-economic context (Brexit, American politics, etc.) and above all, seek anonymity. After all, in public sales, buyers and purchase prices are typically disclosed to the general public, often as part of a big media frenzy.
So private sales are no longer only carried out between private individuals (over-the-counter transactions) or at galleries, but also at auction houses. Traditionally interested in public sales only, auction houses have forced their way into this market segment by developing new business models to meet demand (McAndrew 2017 and 2016; Belting 2013; Pownall 2016). This trend can be observed at some Canadian auction houses, such as Heffel Fine Art, which is very transparent about the diversification of its activities, providing all the details on their website.
1.2.2 Digital technology
Regarding the development of digital platforms, a priority highlighted in an increasing number of cultural policies is starting to take hold: more and more galleries and dealers are selling art on online sales platforms (Pownall 2017, 13, 34–35; ArtTactic 2017; Poper 2017). This is a step forward considering that most of them were resisting the shift to online markets. That said, these online sales platforms will never be able to completely replace physical transactions in the traditional art world. Online platforms are mainly used by artists, galleries and institutions for promotional purposes. Digital technology is above all a vital mediation tool—the public's window into the art world.
As briefly mentioned in Section 1.1.1 on artist entrepreneurs, artists in the Far North are increasingly relying on online sales platforms. According to a Big River Analytics survey (2016), "IAB (Iqaluit Auction Bids) and local buy/sell Facebook pages have created a direct-to-consumer (online) distribution channel at a scale that is new in the Inuit arts economy. Because of the seasonality of sales (higher in winter and lower in summer), this study was unable to measure the impact of Facebook online sales directly; however, statements by participants of the information sessions held across Inuit Nunangat indicate the rise of online sales is driving the increased importance of the direct-to-consumer distribution channel."
Part 2 – The visual arts market
2.1 Overall value of the Canadian art market
The most up-to-date report attempting to quantify Canada's visual arts market is the TEFAF Art Market Report (Pownall 2017). According to the data collected and analyzed, 2016 saw the resurgence of the visual arts economy after a few down years internationally. The Canadian auction market (public sales) was valued at US$586 million in 2016, a 42% increase over 2015 (Pownall 2017, 177). Ontario had the biggest market, followed by British Columbia and Quebec (Pownall 2017, 179), with key hubs located near the U.S. border (Pownall 2017, 178). By extrapolating the data on hand, it was estimated that dealers and galleries had generated US$1.3 billion in 2015. Dealers surveyedFootnote 5 expected their turnover to double in 2016, and Maastricht analysts extrapolated a 20% growth for 2017.
Deloitte (Luxembourg) also released an international report that very briefly addressed the Canadian market, but the methodology they used to evaluate it is unclear. It should be noted, however, that they valued the Canadian market at US$1.3 billion (Deloitte 2017, 20) in 2016, the same comparative year as Pownall (2017). Nevertheless, they highlighted the growth of the Canadian market, in particular the four main hubs of Toronto, Montreal, Vancouver and Calgary.
The Contemporary Art Galleries Association's report (AGAC 2016) has a fairly small sample size (only 15 Quebec galleries), but that still represents more than 60% of the organization's Quebec members. Overall, these 15 AGAC-member galleries in Quebec are said to have contributed at least $5.5 million to the art market in 2015, for a total of nearly 1,500 works sold (AGAC 2016, Addendum 1), mainly to Quebec customers. Primary sales of contemporary works accounted for $3.5 million.
According to a report on art dealer sales by the Observatoire de la culture et des communications du Québec (Routhier 2006Footnote 6), there were approximately 273 original art dealers in Quebec in 2001–2002. They made an estimated $65.5 million in sales that year, including exports (the study does not distinguish between sales to Quebecers, Canadians and international buyers). Quebec art accounted for 65% of all sales by Quebec dealers, with art from the rest of Canada accounting for 17%. The ratios were largely the same for dealers representing artists in museum collections and those who were not. For the sake of clarity and representativeness, dealers were segmented based on the reputation of the artists they represented. While only 25% of dealers represented museum artists, they generated 44% of sales in Quebec (Routhier 2006, 10). Dealers that did not represent museum artists had to rely on other activities to supplement their income. The majority of sales came from the primary market (66%).
2.2 Methodological limitations of these surveys on the visual arts economy
Reported figures for visual arts sales in Canada vary widely from source to source.
One major factor explaining this discrepancy is differences in methodology (AGAC 2016; Pownall 2017; Routhier 2006, 2013; TCI 1999). Even in the study of Statistics Canada and CSA data, the classification of cultural businesses involved in the visual arts trade is inconsistent, which can introduce some bias when reconciling data. Furthermore, some calculations include unique works of craftsmanship (TCI 1999; Routhier 2006) while others do not (AGAC 2016; Pownall 2016; SSHRC 2018). Consequently, it can be difficult to ascertain what is meant by "original works."
The term "dealer" is also inconsistently defined from one study to another. Some include all retail businesses trading original works, while others include big box retail stores (TCI 1999, when using data from Statistics Canada). Then there are those that limit the term to private galleries that are members of a professional organization (AGAC 2016) or to art galleries and antique dealers having participated in one of the 50 international fairs (access to which is fairly limited) and to auction houses as in Pownall (2017). As a result, total sales figures are generally extrapolated and difficult to compare due to a lack of research history; each group mentioned above conducted only one study of the Canadian market and used their own methodology, thereby making any comparison unreliable.
2.3 Specificities of the Indigenous and Inuit art markets
It is important to point out that the art market studies cited above probably did not include Inuit and Indigenous artists given their poor representation in galleries, nor direct sales by artists regardless of cultural origin. In recent years, studies specific to Inuit artists (Nordicity, Big River Analytics) have shown that their distribution network has some unique features not found among Indigenous communities, which use a fairly standard distribution network (Uzel 2017; Maranda).
The Inuit art market
Big River Analytics' study (2017) indicates that the main distribution channels are direct sales to consumers, retailers and wholesalers. The importance of distribution channels generally varies from region to region.
Direct-to-consumer sales, mainly online, are growing steadily in all areas of the Far North. The growth of this distribution channel can be attributed to lower retail and wholesale sales. 67% of the market's direct impact comes from direct-to-consumer sales—that is $22.1 million net of expenses (Big River Analytics). Online sales networks, primarily local Facebook buy/sell groups and the 26,300-member Iqaluit Auction Bids, have increased the importance of direct-to-consumer sales for artists (Big River Analytics 2017).
Nordicity's (2010) study shows that the economic impact of art production and distribution generated $27 million in direct payments to artists in 2010, leading to over $50 million in sales to consumers, including $30 million in sales through distributors across the rest of Canada and around the world. 10% of Nunavut residents earned income from selling art. Opportunities are as diverse as Nunavut's art distribution networks, which range from an artist-created and -operated "wholesale" distribution chain and co-ops (e.g., at Cape Dorset) to third party retailers and direct-to-consumer distribution via a cottage industry (Nordicity 2010, 8). Wholesalers account for less than 35% of artists' sales ($9.6 million), but over 60% of public sales, including about $16 million to retailers (Nordicity 2010, 6, 9–10). Nunavut's largest export market is the rest of Canada, at about $20 million, followed by the United States at $7.5 million and the rest of the world at $4.5 million.
In a more recent study, Big River Analytics (2016) shows that in 2015, Inuit artists producing visual arts and crafts for income earned over $33 million net of all costs,Footnote 7 and the inputs they purchased and money they spent generated an additional $12.5 million in spinoffs (Big River Analytics 2016), showing an increase from 2010 to 2016. In addition, Inuit artists producing visual arts and crafts for consumption, through their purchase of materials and other inputs, generated $17 million in economic activity (Big River Analytics 2016). However, these figures must be put into perspective because they cannot be directly compared to estimates from other studies on the Nunavut arts and crafts industry, as no other studies have addressed the indirect impacts of the production of arts and crafts for consumption.
2.4 Consumers of visual arts products
Consumers are the last and most important link in the supply chain. After all, artists do not live off the spirit of the times or charity, and many have to sell their work to maximize their income. That is why it is so hard to get clear data on the economic impact of the visual arts market: the art market is too opaque. Data on art sales and art customers is also hard to find.
Quebec appears to be the main source of data on the growth of visual arts consumption. Purchase data are available, in particular for corporate collections, as are some household spending data, which are also available for the rest of Canada.
The Quebec Ministry of Culture and Communications' quinquennial survey of cultural practices reveals that 7.4% of Quebecers acquired a work of art in 2004 and 11.6% in 2009 (Audet et al. 2009). In 2014, 26% of Quebecers purchased a work of art (and 10% purchased a handicraft product) (MCC 2016, 49). The average purchase amount for artworks and handicrafts was $502 (MCC 2016, 49). Conversely, though these data should be taken with a grain of salt given the methodological framework, the "Survey of Canadian Household Spending from 2012 to 2016" shows that Canadians are spending less and less per work of art (including antiques and decorative items): $100 in 2012, $82 in 2013, $87 in 2014, $75 in 2015 and $78 in 2016 (Statistics Canada 2017).Footnote 8
Corporate collections
The Quebec Observatoire (OCCQ) used to conduct a biannual study assessing visual arts consumption by institutions, corporate collectors (including Crown Corporations) and municipalities in Quebec. The study included purchases made directly from artists (including 1% works). The most recent edition shows that 3/4 of works acquired in 2013–2014 were from artists outside Quebec (23% from Quebec) and that only 30% of total sales in 2013–2014 were from Quebec suppliers (galleries, dealers, consultants) (Routhier 2015). This downward trend continues. For example, in 2010–2011, 73% of purchases were made in Quebec (Routhier 2013b), while in 2008–2009 it was 92% (Routhier 2011).
Part 3 – Socio-economic conditions of cultural workers
There have been numerous studies on the socio-economic conditions of cultural workers, but only a few detailing the circumstances of visual artists and other visual arts workers. While recent surveys have covered the conditions of visual artists relatively well, we still have little information on cultural workers in the visual arts sector, including workers in organizational administration or in the art distribution or legitimation network. This part of the report is divided into two sections, one on non-artistic cultural workers and the other on professional artists, in order to shed light on their respective socio-economic conditions.
There seems to have been significant changes in methodology from the "2006 Census" to the "2011 National Household Survey". As a result, data from some reports cannot be compared with previous ones (in particular Hill 2014). The Canadian "Culture Satellite Account" (CSA) can be an interesting source of raw data if carefully interpreted, but the system it uses to estimate the number of cultural workers is different from those used in many other reports. Hill Strategies, for example, bases its survey on occupations, while CSA report estimates are based on cultural industries and products. In addition to its different methodology, CSC estimates differ in terms of reference year and data sources (Hill 2014).
Nevertheless, the latest literature has identified some key indicators regarding the issues affecting cultural workers. To be specific, these workers have low income, often do not have regular employment, work fewer and fewer paid hours per week and typically have temporary jobs (they are almost three times more likely to have more than one job than in 1990), according to a brief by Coalition La Culture, le Cœur du Québec (Azoulay and Paradis 2018, 10).
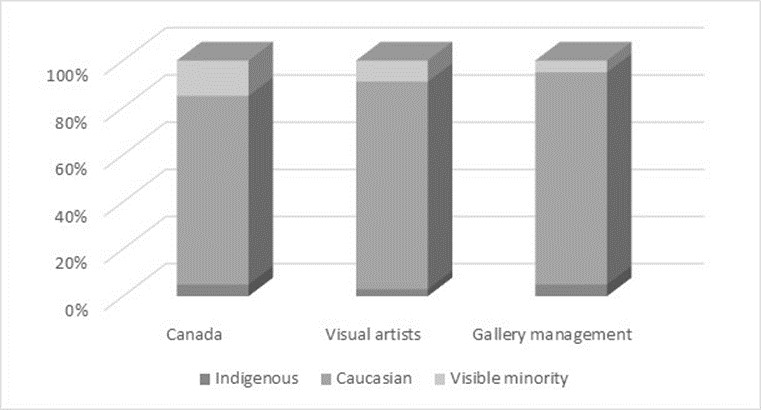
In his study on Indigenous peoples and cultural minorities in Montreal, Professor Jean-Philippe Uzel points out that "arts organizations run by Indigenous people are still the least well-endowed and the least well-supported in the Canadian art world as a whole (Uzel 2017, 36)." In a Canadian Art article, Maranda (2017) also highlights the disparity among artists on display at public institutions and among employees working at these institutions (in connection with the programming). Figure 3 illustrates this disparity.
-
Figure 3: Public museum representation by culture (Maranda 2017) – text version
This bar graph shows the representation, by percentage, of ethno-cultural groups in public museums for three groups: Canada, visual artists and gallery management.
In Canada,
- Indigenous: approximately 0.5%
- Caucasian: approximately 75%
- Visible minority: approximately 24.5%
Visual artists
- Indigenous: approximately 0.2%
- Caucasian: approximately 78%
- Visible minority: approximately 21.8%
Gallery artists
- Indigenous: approximately 0.5%
- Caucasian: approximately 81%
- Visible minority: approximately 18%
While Canada's population has become more and more diverse over the past 20 years, minorities are poorly represented in the visual arts, with proportionately fewer artists, sales and exhibitions. Maranda's conclusion sums it up nicely: "Key Finding: Gallery management is whiter than Canadian artists in particular, and the Canadian public in general [ ...]. The quick conclusion: as a sector, we aren't doing all that well in reflecting the population at large, on either ethnic or gender lines" (Maranda 2017).
3.1 Socio-economic conditions of visual artists
Generally speaking, artists certainly seem to be passionate about their work: while their income is below the Canadian average and they are generally better educated than most Canadians, only 38% of them have considered changing careers (27% for financial reasons); 91.8% of them have positive outlooks, saying that they want to "retire as late as possible" (Routhier 2013b, 82–83). It should be noted that Caucasians are overrepresented among visual artists in all studies (agYU Out There 2014a; Maranda 2014).
Artists are generally well educated. According to Statistics Canada's "2011 National Household Survey" (NHS), 77% of Canadian artists aged 25 and over have a postsecondary degree (Hill 2015, 2010; Uzel 2016, 26–27).
Income
Studies have shown that the average earnings of Canadian visual artists have not gone up much. In 2010, they had an average of $17,176 in earnings (median of $10,358) and $24,672 in income (Hill 2014).Footnote 9 These figures are corroborated by Routhier, who found that in 2010, 57% of Quebec artists had earned less than $29,999, while the average working Quebecer (according to Statistics Canada, which the study used as reference) had a personal income of $35,400 (Routhier 2013b, 8).
Most artists have to engage in other professional activities to secure a decent income: "It would seem that teaching the visual arts at the college or university level is the best financial option; 15% of artists do this and their average personal income is $54,200. Visual arts-related management, organization and facilitation activities are also options, with 16% of artists earning income from them in 2010. (Routhier 2013b, 35)."
Creative income was the main source of income for only 20% of artists. In fact, "the average income from visual arts creation before deducting production expenses is $10,600, but the median income is only $3,300 (Routhier 2013b, 9, 23–24)."Footnote 10
Artists' average earnings are low in all major Canadian population centres, and there are significant gaps between artists and workers in other industries (Hill 2010, 6). "The earnings gap is 36% or 37% in Montreal, Toronto and Vancouver but is more than 50 % in Calgary and Ottawa (Hill 2010, 6)."
Median creative income also varies according to type of art. Artists who focus on drawing and printmaking have a lower median creative income ($1,500) than artists who focus on sculpting ($5,000). The Observatoire (OCCQ) study also shows that median creative income tends to go up the more working time artists devote to the visual arts (Routhier 2013b, 38). Creative income includes not only creation, but also royalties, art sales and rentals, etc. The following definition, provided in a report along with two graphs illustrating average income distributions, is particularly enlightening (Routhier 2013b, 40–41). "Artistic work in the visual arts essentially involves designing and producing artworks (sculptures, prints, paintings, installations, photographic works, textile works, etc.) and then ensuring their dissemination. This work generates various types of creative income." In the visual arts, sales are the main source of revenue.
Artist profiles
As a result of its study, the Onservatoire (OCCQ) was able to identify six major profiles for visual artists in Quebec based on characteristics such as income, source of income, amount of time spent on artistic work, education and gender: casual artists (about 21% or 760 people), versatile artists (15% or 550 people), struggling artists (19% or 680 people), prolific artists (28% or 1,020 people), senior artists (12% or 440 people) and master artists (5% or 180 people) (Routhier 2013, 11). Pan-Canadian studies show that this typology is fairly representative of artists across the country.
Researchers described the six artist profiles as follows (Routhier 2013b, 17–22):
- Casual artists (21% of the pool of artists): Spend little working time on their artistic career. Personal income is typically low (average net creative income of $2,310; their expenses exceed this amount). High proportion of women (70%) and young adults (20% under 35). Few CALQ or CCA grant recipients. Two-thirds have income from activities outside the field of visual arts (Routhier 2013b, 18).
- Versatile artists (15%): Spend most of their time on non-creative work. Above average earnings for artists. Typical artist demographics. Two-thirds have a university degree in visual arts (bachelor's, master's or doctorate) and 40% have a second degree in another field. Average net income of $43,600 (including $1,560 in creative income). Few CALQ or CCA grant recipients (Routhier 2013b, 19).
- Struggling artists (19%): Many young adults (20% under 35) and as many men as women. Average personal income under $10,000 (including $1,670 in creative income). Spend on average 2/3 of working time on artistic work (median production: 9 works), but creative expenses exceed creative income (Routhier 2013b, 19).
- Prolific artists (28%): Full-time artists who live off their art. Average income is $10,900 (almost all creative income). As many men as women. Large proportion with no degree in visual arts, but many grant recipients. Half are represented by a gallery or an agent, 10% produced 1% works and more than half sold or exhibited works outside Quebec in 2010 (Routhier 2013b, 20).
- Senior artists (12%): Two-thirds over 55 and as many men as women. 40% have a university degree in a field other than visual arts and a third teach visual arts. Above average personal earnings for artists ($36,700), but little creative income ($2,810). Half are represented by a gallery and the same proportion sold or exhibited works outside Quebec in 2010 (Routhier 2013b, 21).
- Master artists (5%): Mature artists—mostly men living in large cities (60%). Highly educated with well above average incomes for artists ($86,400). Most are grant recipients. Same ratios as prolific artists in terms of representation, sales outside Quebec and 1% works produced. 70% teach visual arts at a college or university (Routhier 2013b, 21).
Age
According to data collected by Michael Maranda's team (agYU Out There 2014a), the average age of artists remained stable at around 43 from 2007 to 2012, but the average age of minority artists decreased from 39 to 37. This either suggests that the number of young artists is growing, which would be representative of the overall labour force, or that visible minority artists are rapidly leaving the profession. Sales, studio time, professional expenses, and gallery representation increase with age, with grants, royalties and creative income peaking around 35–45 (Maranda 2009, 41–49).
Education
Nearly 40% of artists have an undergraduate degree, compared to 16% of the labour force according to Statistics Canada (2006 data). According to Maranda (2009), 44.9% of artists have a graduate degree (compared to 6.9% of the labour force), typically a master's degree, although 4.6% have a doctorate and 5% are doctoral students (Maranda 2009, 14).
Mobility
Overall, 80% of the world's most renowned artists live and work in the countries where they were born, contrary to the assumption that popular artists should be more likely to travel and leave their countries of origin (Quemin 2015, 836). The visual arts scene has really opened up to the outside world (Canadian and international) in the last ten years.
As the research demonstrates, however, this openness to the world does not necessarily entail that local artists—Indigenous, minority or otherwise—are any more likely to have their work exhibited in foreign institutions or to sell more in other provinces (Uzel 2017, 28–29; Routhier 2013b). The data actually shows that corporate and institutional acquisitions are in constant decline (Routhier 2014, 2011, 2009; AGAC 2016). As Uzel explains, the community has opened up to the international scene in the sense that museums and events are now giving foreign artists more visibility (Uzel 2017, 29), apparently for the benefit of Canadian audiences. While this limits the visibility of Canadian visual artists, AGAC stresses that it exposes the public to internationally recognized practices in the art world, which "increases demand for the latest, most rigorous" and high-level practices (AGAC 2016, 15).
Nevertheless, more and more Canadian galleries are participating in international fairs in the United States, Mexico and Europe, and Canadian artists are being put on display in international contexts, which can lead to collaborations outside Canada. The Uzel-led study highlights that while this international shift has allowed many artists of various nationalities to be exhibited in Quebec and the rest of Canada, but few Canadian minority artists are exhibited internationally. The same is true for Indigenous artists who have little presence on the Canadian scene (Uzel 2017, 31–32). There is a correlation between Indigenous and minority artists with an international presence, representation by recognized distributors (dealers and galleries) and level of education: the best educated artists get the most international exhibitions (Uzel 2017, 32).
Gallery representation
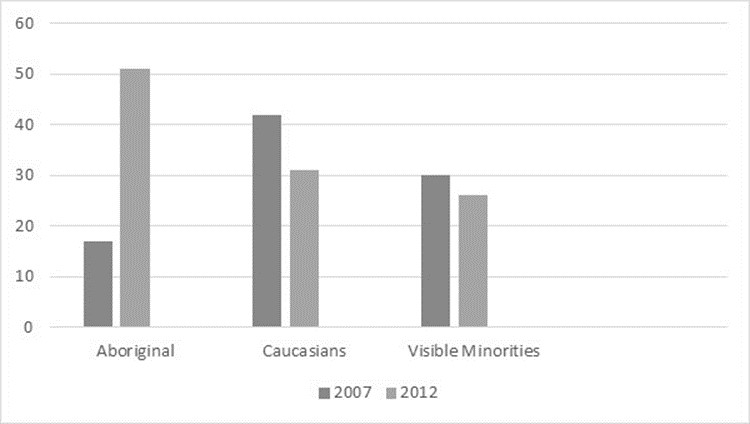
Caucasian artists were 10% less represented in galleries in 2012 than in 2007, and their sales income has dropped by 35% as a result (agYU Out There 2014a). Their median income, however, has gone up about 10%, from $20,200 to $22,400.
-
Figure 4: Gallery representation by culture (Maranda 2009) – text version
This bar graph shows the percentage of Aboriginal, Caucasian and visual minorities groups represented in galleries in 2007 and 2012.
In 2007,
- Aboriginals: approximately 16%
- Caucasians: approximately 41%
- Visible minorities: approximately 30%
In 2012,
- Aboriginal: approximately 51%
- Caucasians: approximately 43%
- Visible minorities: approximately 25%
Financial support of the practice
Grants are the main source of financial support for artists, but only a fraction of them receive any (18%, see Routhier 2013b, 44). "While men and women are about as likely to receive grants (20% and 17% respectively), the median grant for female recipients ($4,900) is lower than that of male recipients ($10,000). In addition, artists are less and less likely to receive grants as they age (37% of grants are given to the youngest artists and 6% to the oldest) (Routhier 2013b, 44)."
Income security and retirement
"Visual artists have relatively poor access to social assistance and income security plans (Routhier 2013b, 51–52)." Self-employed workers are not covered by employee pension plans, so retirement planning is not as straightforward. However, quite a few artists have paid jobs outside the art world, suggesting that they may benefit from less risky social assistance and retirement plans.
The Observatoire (OCCQ) study shows that only 32% of artists have made contributions to pension plans, though 59% of them have investments. While the study provides no information on retirement income, 92% of artists said they wanted to retire as late as possible. The OCCQ therefore assumes that the vast majority of artists will continue to work well after they turn 65 (Routhier 2013b, 52), which ties into the survey that found artists over 55 to be overrepresented.
3.2 Socio-economic conditions of artists from ethnocultural communities and specific groups
The literature on Canada's ethnocultural communities is quite limited (Nordicity 2010, 2016; Trépanier 2009; Misdrahi 2015; Big River Analytics 2017; Uzel 2017; Anamik 2015; Gauvin and Haentjens 2001). Some books have been published on gender divisions, but most of the information available on the working conditions of women in the visual arts is found in broader studies.
It should be noted that the only recent studies we could find on Indigenous people were from Quebec. However, some provinces like British Columbia and Manitoba have high concentrations of Indigenous artists and groups, suggesting that there may be issues specific to these areas. In that regard, the scope of this study is limited.
A recent study commissioned by the Conseil des arts de Montréal (Uzel 2017) on the professional issues and socio-economic conditions of Indigenous and visible minority artists in Montreal is particularly illuminating. One striking conclusion was that it can be quite difficult for these artists to integrate the cultural community and, especially, to have their work accepted on the same level as that of non-Indigenous and non-minority artists. Indigenous and minority artists often face the same problems. These include having difficulty achieving professional status, lacking visibility, not being fairly recognized (Uzel 2017, 9, 51) and feeling discouraged (Uzel 2017, 57–58). Conversely, they differ in other key aspects such as techniques and media, cultural heritage and the notion of "contemporary" (so often opposed to "traditional").
A survey of arts organizations revealed that some of the issues encountered by Indigenous and minority artists appear to be related not to a lack of integration programs, but rather to programmers, panelists and selection committees (often peers) having a poor understanding of their aesthetic codes (Uzel 2017, 40–42).
Indigenous, non-Caucasian, female and senior artists each face specific issues that will be detailed in the following sections. All aspects of artistic income are roughly the same for both Canadian-born and immigrant artists (Maranda 2009, 53). According to Maranda (2009), immigrants sell more works but also have higher non-artistic income, suggesting that artistic work is not their main source of income. However, arts-related earnings tend to be higher among native-born Canadians. In the end, median earnings are the same for both groups (though average earnings are higher for immigrant artists). Nevertheless, Uzel indicates that "the average annual earnings of Indigenous and minority artists are lower than those of other artists (Uzel 2017, 34)."
Since cultural heritage figures so prominently in the arts, especially among Indigenous and minority artists, "there is some consensus that certain forms of expression do not really fit within conventional categories of visual arts [...] and that conventional visual arts disciplines and mediums (paintings, sculptures, photographs, etc.) do not adequately reflect the reality of Indigenous art and that it is important to consider other forms of cultural expression (Uzel 2017, 48)." "Conversely, other artists and art presenters argue that Indigenous visions of art can be expressed through existing disciplines (theatre, poetry, visual arts), even if it means adapting and transforming them, as in the case of installation art, which is more prominent among Indigenous artists than non-Indigenous artists. This discussion is significant because it impacts the debate on whether the creations of Indigenous artists can truly be judged by their 'peers' (Uzel 2017, 49)." Only a third (1/3) of surveyed Montreal presenters (organizations, groups, artist centres) said that "there are procedures to ensure staff diversity within their organization (Uzel 2017, 42)."
3.2.1 Indigenous artists
Indigenous artists represent 4.6% of the Canadian population, but only 2.2% of visual artists. Visible minorities make up 19% of the Canadian population, but only 9% of visual artists, almost 45% of whom are Canadian-born, suggesting that the disparity in the representation of visible minorities is because so few immigrants are becoming artists, which may just be a generational problem (agYU Out There 2014a). Uzel (2017) points out that Indigenous artists are much more mobile than minority artists.
Income
The median income of Indigenous artists fell from 2007 ($18,600) to 2012 ($15,300), despite their average income improving substantially (agYU Out There 2014a).Footnote 11 This illustrates the income gap among Indigenous artists, which can be due to a range factors including a popular small artist group or an increase in earnings from sources outside the visual arts. The study shows a marked improvement in gallery representation (from 16% to 47% in 2012) and level of education, which may explain the rise in average income and may be indicative of a trend according to researchers.
Exhibition
As demonstrated by art sociology studies, in particular those carried out by Moulin, institutions are key players in the legitimation of art. Researchers have been studying the cause-and-effect relationships influencing the careers of Indigenous and minority artists and have determined that institutions play an important role (Uzel 2017, 24–26). By examining artist resumes, researchers have established a correlation between exhibition venues and professional recognition: "[there is a] correlation between the highly hierarchical categories of Montreal venues and the types of careers Montreal artists have—international, national or regional (Uzel 2017, 26).
An increasing number of institutions, exhibition centres and networks dedicated to the dissemination of Indigenous practices have adopted stricter collection and exhibition policies regarding the proportion of works by Indigenous artists (Uzel 2017, 36). While these organizations have clearly been making efforts to recognize Indigenous practices, parity has not yet been achieved. "Recognizing the place of Indigenous people in modern Canadian culture and society does not mean giving them a 'numerically equitable' presence. Above all, it means recognizing their place at the centre of Canadian culture (Uzel 2017, 39–40)."
3.2.2 Minority artists
As part of his research, Michael Maranda (2009) compared the incomes, working time and gallery representation of Caucasian, visible minority and Indigenous artists in Canada. The study reveals that in 2012, minority visual artists had higher average incomes than Caucasian visual artists, but their median incomes were 28% lower (agYU Out There 2014a; Uzel 2017). This may be explained by the fact that a greater proportion of visible minority artists had a second job.
According to Maranda (2009), immigrants with legal status in Canada tend to have more post-secondary education, so visible minorities have a few more years of education than other groups. Researchers have found that the more educated a person is, the more likely they are to be home owners and live in metropolitan areas. Women are generally more educated than men (Maranda 2009, 14).
Although minorities account for 33% of Montreal's population (Uzel 2017), minority artists account for no more than 12% or 13% of visual artists on display in Montreal's two major art exhibition networks." This figure cannot be corroborated for Canada as a whole.
3.2.3 Women artists
A large majority of visual artists are women (agYU Out There 2014b; Hill 2014; Routhier 2013). Women are more likely to be home owners and live in big cities. They are also typically more educated than men, which is true of the labour force in general. In the arts community, 96% of women have at least an undergraduate degree, compared to 88% of men (agYU Out There 2014b).
In Inuit communities, more women produce visual arts than men, but they earn half as much: "The large differences in male and female art incomes can be explained by examining the types of art that each gender engages in (Big River Analytics 2016)." In a nutshell, women tend to sew and men tend to carve, a traditionally more masculine discipline with a higher market value. The same financial gap can be seen among non-Inuit artists, but to a lesser extent.
-
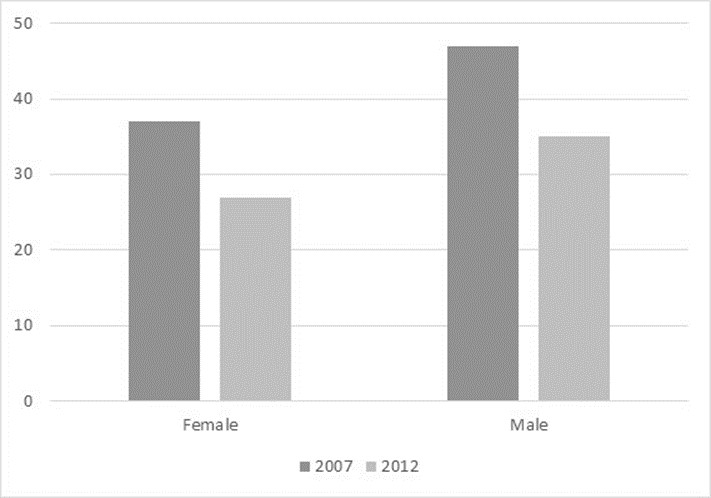
Figure 5: Gallery representation by gender (Maranda 2014) – text version
This bar graph shows the percentage of males and females represented in galleries in 2007 and 2012.
In 2007,
- Females: approximately 36%
- Males: approximately 46%
In 2012,
- Females: 28%
- Males: 36%
Maranda (2014) points out that, when taking into account all Canadian artists, gallery representation is lower among women (28%) than men (36%) (Fig. 3). The situation does not seem to have changed, as according to gallery owner Émilie Grandmont-Bérubé, we still have a long way to go: "[Among AGAC members,] only 4 out of 40 galleries have achieved parity, and 4 others have less than 16% women. The average is around 25–35%. And of the 4 gender-balanced galleries, 3 are run by women (Delgado 2018)." There is every reason to believe that this disparity among artists is just as significant within the broader segment of cultural workers and entrepreneurs, on which little to no research seems to have been conducted.
Female artists receive on average 30% of their income from sales and 50% from grants, whereas men are the exact opposite, with 50% from sales and 30% from grants. Women earn 2/3 the artistic income of men. As Michael Maranda highlights: "Turning to the Waging Culture data, for visual artists, the net practice average hourly income wage gap in 2007 was 27%. This gap increased by 2012, however, to a shocking 60%. That bears repeating: for every $1/hr a male artist earns, a female artist earned 40¢. About the only mitigating factor here is that the average hourly wage of artists is so miniscule to being with (agYU Out There 2014b)."
3.2.4 Senior artists
A study was commissioned specifically to better understand the issues affecting mature artists (Hill, Sidimus and Marks 2010). Maranda observed that income from art sales generally starts to go up as artists enter their forties and peaks around the age of 65 (Maranda 2009, 41–49). However, income insecurity remains an issue for the vast majority of artists, and many do not have retirement funds, which can be a major concern for older artists.
Overall, however, Routhier shows that some mature artists, whom she refers to as "masters," generally have more favourable socio-economic conditions than artists in other categories (see typology in Section 3.1).
In terms of royalties, "one-third (32%) of visual artists [in Quebec] earned copyright income in 2010, and those with such income earned a median of $890. [...] 24% of artists reported having entrusted the management of their copyrights to one or more Canadian copyright collectives (Routhier 2013bb, 78)."
It would seem that the older they are, the more likely artists are to have obtained the services of a copyright management company. According to the OCCQ study, one third of artists 65 and over have entrusted their rights to a management company. However, it appears that this increase in interest in rights management services among older artists is unrelated to the amount of royalties being paid out. Also, "[20%] claim to have an estate plan, a document that specifies what happens to their art when they pass away. The proportion of artists with an estate plan increases with age (Routhier 2013b, 78–79)." This was also demonstrated for Canada as a whole by Hill, Sidimus and Marks (2010).
3.3 Socio-economic conditions of cultural workers in the field of visual arts
The socio-economic conditions of workers in the visual arts or promoting and disseminating the visual arts are not specifically addressed in most studies (Hill 2014; Routhier; SSHRC 2018; etc.).
All sectors combined, cultural occupations comprise 3.82% of the country's labour force. One in 26 Canadian workers has a cultural occupation for a total of 671,100 people. Artists (136,600) represent 21% of all cultural workers, and women 50%.
The "cultural workers" category is defined as follows: "Cultural workers include Canadians who were classified into 50 occupation codes, including heritage occupations (such as librarians, curators and archivists), cultural occupations (such as graphic designers, print operators, editors, translators and architects) and the nine arts occupations (Hill 2014)." Of the 50 professional codes, those relevant to this study are A341 - Library, Archive, Museum and Art Gallery Managers, F112 - Technical Occupations Related to Museums and Art Galleries and F012 - Conservators and Curators. Much like other sectors, the visual arts community also relies on F024 - Professional Occupations in Public Relations and Communications. Unfortunately, this means that this study is limited in that the professions covered by each of these groups are very different from one another. Any data collected on them is therefore greatly limited in its application to the visual arts. The realities of museum managers and entrepreneurs like gallery managers are completely different.Footnote 12 Larger institutions and companies provide job security and working conditions that galleries, exhibition centres, non-profit galleries and other organizations simply cannot provide. The way these categories have been drawn up greatly limits our research, and we find it concerning that administrative occupations related to exhibition centres and non-profit organizations (e.g., cultural professional associations, art event organizers) are not included in cultural occupation surveys.
As discussed in Section 3.1.3 on women artists, cultural workers are also affected by this phenomenon. Maranda (2017) points out that "directors and curators are 70% women and 30% men. This compares to 62% versus 38% for visual artists, and an approximate 52% versus 48% for the general population." So while there are more women artists and cultural workers in the arts community, their income is still lower than that of men, particularly in the institutions studied by Maranda, where women earned on average 20% less than men and were less likely to hold senior management positions (Maranda 2017).
Appendix
Annotated bibliography
Final report
For Creative Marketplace and Innovation Branch, Department of Canadian Heritage
April 2018
Bibliography
- Adams, James (2017). " Is Canada's art market ready to grow up? " "The Globe and Mail", November 25, 2012 (updated March 27, 2017).
- Keywords: secondary market, Canada, economic growth, contemporary art, market segment
- Summary: Article about auctions of well-established (blue-chip) Canadian artists who have achieved impressive sales prices in recent years. The group is dominated by pre-war artists such as Lawren Harris, Tom Thompson and Emily Carr. Some contemporary Canadian artists are rather well known internationally but are rarely sold here. The author states that "if Canadian auctioneers are serious in their talk about contemporary or at least post-Second World War consignments being the Future, they're going to have to dedicate more time, imagination and resources to it."
- (R) agYU Out There (2014a). " Waging Culture: The Ethnicity Effect. " "The Art Gallery of York University"blog, July 21, 2014.
- Keywords: artists' socio-economic conditions, culture, cultural diversity, Indigenous artists, income, representation, education
- Summary: Resource recommended by a consultation panelist. This web page features a series of short summaries of Michael Maranda's study, Waging Culture (Maranda 2012), posted on what appears to be the Art Gallery of York University forum. The post compares 2007 and 2012 data on Canadian artists (age, income and representation) broken down by ethnicity (immigrant, Indigenous and Caucasian artists).
- (R) agYU Out There (2014b). " Waging Culture: The Sex Gap (!). " "The Art Gallery of York University blog, May 21, 2014.
- Keywords: artists' economic conditions, gender gap, income, representation, education
- Summary: Resource recommended by a consultation panelist. This web page features a series of short summaries of Michael Maranda's study, Waging Culture (Maranda 2012), posted on what appears to be the Art Gallery of York University forum. The post compares 2007 and 2012 data on gallery representation and economic conditions in the visual arts industry segmented by gender.
- Canadian Museums Association (2008). " Visual Arts Summit 2007 Report " [PDF document].
- Keywords: education, cultural sector stakeholders
- Summary: Document presenting the discussions held by panels of visual arts professionals at the 2007 Visual Arts Summit held in Canada by the Canadian Museums Association. The panels addressed various current issues including the state of public art galleries (institutions), the market, research, etc.
- Audet, Claudine et al. (2009). « Enquête sur les pratiques culturelles au Québec ». Québec: Ministère de la Culture, des Communications et de la Condition féminine.
- Keywords: broad culture, cultural consumption, collection, Quebec
- Summary: Data from the Quebec Ministry of Culture and Communications' quinquennial survey of cultural practices. The study highlights an increase in visual arts acquisitions from 2004 to 2009: 7.4% of Quebecers acquired a work of art in 2004 and 11.6% in 2009.
- Azoulay, Audrey and Pierre-Emmanuel Paradis (2018). "Étude économique." In « Pour la culture: cinq propositions pour une politique économique adaptée aux arts et à la culture ». Coalition La Culture, Le Cœur du Québec, January 2018, pp. 9–37.
- Keywords: cultural economic growth, Quebec, socio-economic conditions of cultural workers, job insecurity
- Summary: Study conducted by economists and commissioned by Coalition La Culture, Le Cœur du Québec, a group whose mission is to have culture recognized and given more importance in provincial policies. The economist responsible for Chapter III identified five indicators illustrating the insecurity of the cultural sector: "income is dropping in a relative sense; workers often do not have regular employment; they work fewer and fewer paid hours per week; they typically have temporary jobs; they are almost three times more likely to have more than one job than in 1990 (Azoulay and Paradis 2018, 10)." However, the study only takes into account issues related to non-market organizations (Azoulay and Paradis 2018, 12).
- Baia Curioni, Stefano (2014). "Which Fairs – Which Art. Exchange Rituals and Impossible Markets." In Francesco Garutti, ed. "Fairland". Milan: Miart; Rome: Depart Foundation, pp. 27–40.
- Keywords: supply chain, art fairs, economy, supply and demand, conventions versus innovation, Internet
- Summary: Economic historian Stefano Baia Curioni classifies contemporary art fairs and describes their system of conventions, in particular the roles of stakeholders overseeing the exchange system. According to the author, the art market is a network environment featuring both insiders and outsiders in which supply does not follow demand, in fact, supply drives the exchange system (Baia Curioni 2014, 38). Fairs are key components of today's exchange system, allowing various stakeholders (galleries, collectors, institutions, commissioners) to help legitimate cultural products (works and artists) that can integrate the sphere of contemporary art, thereby giving these products symbolic value.
- Bellavance, Guy et al. (2011). « Le secteur des arts visuels au Canada: Synthèse et analyse critique de la documentation récente ». Montréal: Institut national de la recherche scientifique, Centre – Urbanisation Culture Société.
- Keywords: artists, socio-economic conditions
- Summary: Study commissioned by the Visual Arts Alliance. While it provides a helpful framework, the data is no longer up to date (from early 2000s) and its reliability could be challenged by more recent and in-depth studies.
- Belting, Hans (2013). "The Art Market." In Hans Belting, Andrea Buddensieg and Peter Weibel, eds. "The Global Contemporary and the Rise of New Art Worlds". Karlsruhe, Germany; Cambridge, MA; London, UK: ZKM Center for Art and Media Karlsruhe and MIT Press, pp. 261–265
- Keywords: art economy, international, distribution networks, globalization
- Summary: Interview on the visual arts market with economist Clare McAndrew and art historian Hans Belting.
- Benhamou, Françoise (2011). « L'économie de la culture ». 7th ed. Paris: La découverte, 126 p.
- Keywords: cultural economy, France, theory, art markets, international comparables, cultural policies
- Summary: Book by Françoise Benhamou, a well-known economist and researcher in the art world. It goes over the development of cultural markets, including the art market and economic analyses thereof, and concludes with a review of French cultural policies.
- Big River Analytics (2017). " Impact of the Inuit Arts Economy. " "Indigenous and Northern Affairs Canada", July 12, 2017 (last update).
- Keywords: economic impact of culture, primary and secondary visual arts markets, Inuit art, artists' socio-economic conditions, broad culture, crafts
- Summary: Study on the economic impact of the production and distribution of cultural products in Inuit communities. Produced for Indigenous and Northern Affairs Canada, the study found that 26% of the labour force in the region was involved in the production of visual arts for income or non-income purposes. The Big River survey combines data from Statistics Canada and is in line with research on the area (e.g., Nordicity 2014). It provides an overview of the networks distributing Inuit visual arts and the economic impact of the primary and secondary market (auctions, called "secondary sales"). All in all, a unique study on Indigenous and Inuit art, and on the Canadian art market as a whole.
- Bilton, Chris (2015). "Management in the cultural industries." In Kate Oakley and Justin O'Connor, eds. "The Routledge Companion to the Cultural Industries". London, UK; New York, NY: Routledge, pp. 283–295
- Keywords: cultural economy, cultural workers, management
- Summary: Addresses management issues across all cultural sectors. Studies such as Resch (2016) can be more relevant and useful to this study.
- Bloom, Michael, ed. (2008). " Valuing Culture: Measuring and Understanding Canada's Creative Economy " [PDF document]. Ottawa: The Conference Board of Canada.
- Keywords: cultural economy, cultural workers, Canada
- Bourdieu, Pierre (2000). " Les structures sociales de l'économie ". Paris: Éditions du seuil, 361 p.
- Keywords: cultural economy, theoretical framework, art market, artistic fields
- Craig, Sean (2016). " Growing global reputation pushes Canadian art market up amidst another down year. " "Financial Post", December 30, 2016.
- Keywords: art market, Canada, secondary market, public sales, inconsistent growth, Heffel
- Summary: Interview with David Heffel about the Canadian art market in light of record sales in 2016 under exceptional economic conditions. Heffel is reported to have said that the Canadian art market has reached a certain maturity in terms of collection, mediation (relations with the public) and positioning on the international market. However, Heffel noted that publicly announced sales figures (e.g., from the media) should be taken with a grain of salt because there are several factors at play and they change from year to year.
- CHRC (2018). "Provincial and Territorial Cultural Indicators show continuing economic strength of the cultural sector. " "Cultural Human Resources Council – 2018 Announcements".
- Keywords: art economy, value, economic growth, broad culture, cultural workers, Canada, provinces
- Summary: Announcement by CHRC, member of the Cultural Statistics Strategy Consortium, regarding the release of Statistics Canada's latest "Cultural Satellite Account" data. Graphs are used to illustrate the growth of Canada's cultural economy in 2016.
- Dahloff, Dieter H. (2017). " Evaluating Contemporary Art. " "AXA ART", November 8, 2017.
- Keywords: primary market, value, art world stakeholders, supply chain, contemporary art, opacity, prejudice
- Summary: Research report commissioned by art insurer AXA. The report is divided into three parts and seems to be aimed at new collectors. In parts A and B, the author describes in plain terms key concepts of the contemporary art market, making sure not to play down the market's complexity: ecosystem and structure, various markets, art valuation and lists of websites with news and information on the art market. In the third part, the author provides six strategies for negotiating the price of an artwork.
- Daschko, Marla Waltman (2011). "Conceptual Framework for Culture Statistics 2011".
- Ottawa: Minister of Industry, Statistics Canada.
- Keywords: methodology, Canada
- De Peuter, Greig and Nicole S. Cohen (2015). "Emerging Labour Politics in Creative Industries." In Kate Oakley and Justin O'Connor, eds. "The Routledge Companion to the Cultural Industries". London, UK; New York, NY: Routledge, pp. 305–318
- Keywords: cultural policies, parity, human resources, broad culture
- Delgado, Jérôme (2018). "La foire 'Papier' passe à l'ère #MoiAussi." Le Devoir, April 16, 2018.
- Keywords: women in visual arts, status quo of the art world, power relations, galleries, art fairs, gender parity, news
- Summary: Article discussing the return of the "Papier" fair in a context where one of its partners, a collector, has been accused of sexually assaulting an artist. Delgado reports on the fair's educational programming, which will address current issues. Emilie Grandmont-Bérubé, co-owner of Galerie Trois Points, provides striking statistics showing that gender parity has not yet been achieved in the visual arts sector and that women still have a long way to go to carve out their place as both artists and gallery owners.
- Deloitte (2017). "Art & Finance Report 2017". 5th ed. Luxembourg: Deloitte Luxembourg and ArtTactics, 272 p.
- Keywords: art market, international, promotional material
- Summary: Fifth edition of an art market report commissioned by Deloitte. This edition provides an overview of the previous four (4) years. Only two pages address the Canadian market, but this edition is particularly focused on the firm's service offer to clients (promotional material). They estimate the value of the Canadian market at US$1.3 billion (Deloitte 2017, 20). Nevertheless, they highlight the growth of the Canadian market, in particular the four main hubs of Toronto, Montreal, Vancouver and Calgary.
- Dumlao, Maria, Elaine Kaufmann, Danielle Mysliwiec and Anne Polashenski (2007). "Brainstormers and Gender Inequity in the Art World." "Women's Studies Quarterly: Activisms" 35, 3/4 (fall/winter 2007), pp. 144–149
- Keywords: gender inequity, women, cultural community, art world, emerging art, performance, case study
- Summary: From the outset, the authors demonstrate that women are fighting an uphill battle in the visual arts world. This includes female emerging artists, who are less represented in galleries, get less attention from institutions (fewer exhibitions) and are paid less than their male peers. Moreover, according to the authors, this disparity is often ignored by others in the art world, i.e., professionals, who serve as legitimation authorities, thereby perpetuating this tradition of iniquity. "Although most in the art world take pride in being outside the mainstream, they uncritically acquiesce to the status quo that privileges men" (Dumalo et al. 2007, 144). To illustrate this fact, the authors indicate that they will demonstrate how they view this status quo in their public performances as The Brainstormers.
- Environics Research Group (2017). "Arts and Heritage Access and Availability Survey 2016–2017". Ottawa, ON: Department of Canadian Heritage and Canada Council for the Arts.
- Keywords: accessibility, broad culture, Canada
- Summary: Mainly addresses the issue of community members lacking access to culture, as opposed to the conditions of artists within communities, which is the topic of this review. There are many studies on this issue and most have been excluded from this study because they are off topic.
- Fine, Gary Alan (2003). "Crafting Authenticity: The Validation of Identity in Self-Taught Art." "Theory and Society" 32, 2 (April 2003), pp. 153–180.
- Keywords: theory, art world, non-professional artists, marginality, self-taught artists
- Summary: The sociologist examines the market for "self-taught artists," i.e., artists who establish themselves outside the traditional network, "defined as being outside of the art community" (Fine 2003, 155). According to theories on the art world (Moulin; Bourdieu), in order to become part of the art network, works must be legitimated by stakeholders who attest to their authenticity and symbolic value (such as institutions, commissioners, peers, galleries). As seen in Maranda (2009), Uzel (2017), Routhier (2013b) and Hill, education is a dominant factor in network integration. Conducting the study from an ethnographic perspective, Fine characterizes artists not by their creative skills, but by their marginality and the fact that they remain on the margins of the artistic community despite there being a market for the goods they produce.
- Fournier, Marcel and Myrtille Roy-Valex (2002). "Art contemporain et internationalisation: les galeries québécoises et les foires." Sociologie et sociétés 34, 2, pp. 41–62.
- Keywords: internationalization, private galleries, Quebec, fairs, exports
- Summary: Since the emergence of globalization in the late 1990s, Quebec galleries have increasingly sought to develop new markets and showcase their artists to international stakeholders. Since then, fairs have grown in number, becoming the leading platform for promoting local talent.
- Gauvin, Rachel and Marc Haentjens (2001). Visual Arts in Minority Francophone Communities.
- Keywords: visible minorities, Canada, cultural community
- Summary: Report commissioned by the Canada Council for the Arts. Released in 2001, the report is no longer up to date. This appears to be the most recent study to specifically deal with linguistic groups, though some more global studies addressing the socio-economic conditions of artists in a broader sense also provide data on the subject (Maranda 2009; Hill; etc.).
- Grandmont-Bérubé, Émilie, Christine Blais and Simone Rochon (2016). Mémoire dans le cadre des consultations publiques pour le renouvellement de la politique culturelle du Québec. Montreal: Contemporary Art Galleries Association.
- Keywords: private galleries, primary market, value, socio-economic conditions of cultural workers
- Summary: Brief released by the Contemporary Art Galleries Association in the context of public consultations aimed at updating Quebec's cultural policies. The report highlights issues encountered by contemporary art galleries, which operate mainly—though not exclusively—in the primary market: negative or slim profit margins, budget items, funding. The report provides some ideas on how to support and, above all, stimulate the art market and demand for the visual arts in Quebec, but also in Canada.
- House of Commons, Culture, Media and Sport Committee (2005). The Market for Art. London, UK: House of Commons, The Stationery Office Limited.
- Keywords: United Kingdom, visual arts market study, government report, international comparables
- Summary: Report on the cultural market, including the visual arts, written more than a decade ago for the House of Commons of the United Kingdom.
- Hill, Kelly (2015). " Educating Artists: An analysis of the educational backgrounds of working artists and the labour market activities of arts program graduates in Canada. " Statistical Insights on the Arts 13, 2 (June).
- Keywords: artists' conditions, broad culture, Canada, education, professionalization
- Summary: Analysis of post-secondary arts programs pursued by artists in Canada in 2011 across various sectors. The study shows that visual artists are overeducated in relation to the labour force. It also demonstrates that a significant proportion of people trained to be artists are working in other sectors.
- Hill, Kelly (2014). " A Statistical Profile of Artists and Cultural Workers in Canada. " Statistical Insights on the Arts 12, 2 (October).
- Keywords: labour force, artists' socio-economic conditions, cultural workers' socio-economic conditions, broad culture
- Summary: 42nd report in the Statistical Insights on the Arts series, a pan-Canadian study based on the National Household Survey (2011) and the Labour Force Survey. It examines artists and cultural workers, in particular their numbers, demographic characteristics and income, and provides comparisons with the overall Canadian labour force. The study features a lot of interesting data, especially on minorities but also on artists and the cultural community as a whole. For the purposes of this study, only data on visual artists and, where possible, cultural workers in the visual arts and heritage sectors were used. In 2010, visual artists had an average of $17,176 in earnings (median of $10,358) and $24,672 in income. The socio-economic conditions of workers in the field of visual arts or promoting and disseminating visual arts are not specifically addressed in this study.
- Hill, Kelly (2010). "Mapping Artists and Cultural Workers in Canada's Large Cities." Hill Strategies Research.
- Keywords: artists' socio-economic conditions, cultural workers, large cities, culture in general, concentration of artists and cultural workers per neighbourhood, 2001/2006
- Summary: Report analyzing cultural workers, mainly artists, across nine cultural sectors. It sheds light on their numbers, income, education and gender disparities. It also examines how the socio-economic situation of cultural workers has changed from 2001 to 2006 in various large city neighbourhoods (Montreal, Ottawa, Toronto, Calgary, and Vancouver). The study was carried out by Hill Strategies with the support and funding of these cities and through the Creative City Network of Canada initiative. It is based on data specifically provided by Statistics Canada following the 2006 Census. Workers in the visual arts industry are not segmented.
- Hill, Kelly, Joysanne Sidimus and Celine Marks (2010). "Senior Artists in Canada." The Senior Artists' Research Project, Hill Strategies Research.
- Keywords: artists' socio-economic conditions, age, professional success
- Hill Strategies Research (2016). " Lack of data leads to suspension of Statistical Insights on the Arts series. " Hill Strategies, May 11, 2016.
- Keywords: methodology, art market, study limitations
- Summary: Announcement by this major research group in the cultural sector stating that it is suspending its study on the arts industry, at least for 2016–2017, owing to a lack of raw data, in particular as a result of changes to Statistics Canada's Survey of Household Spending and a decrease in data related to culture. Moreover, as is the case with the OCCQ in Quebec, research groups are more inclined to work on special projects with organizations and associations to meet specific needs.
- Hutter, Michael and David Throsby, eds. (2008). Beyond Price: Value in Culture, Economics, and the Arts. Cambridge; New York, NY: Cambridge University Press.
- Keywords: value, art market, symbolic value, theories, broad culture
- Summary: Owing to contributions from multidisciplinary researchers, this book, edited by a renowned sociologist and economist, attempts to provide a consistent and innovative take on the art world by offering a new perspective on how works of art are economically evaluated—an opaque topic. The book questions theories emphasizing symbolic value but also warns that a purely economic approach is no better, as a wide range of factors must be taken into account when assessing the value of these products.
- Jyrämä, Annukka (2002). "Contemporary Art Markets — Structure and Actors: A Study of Art Galleries in Finland, Sweden, France and Great Britain." International Journal of Arts Management 4, 2 (winter 2002), pp. 50–65.
- Keywords: art market stakeholders, United Kingdom, France, Sweden, Finland, art galleries, market structure, distribution network
- Summary: Interesting article providing a basis of comparison between the structure of the European art market and contemporary art gallery management. Of course, a 15-page article simply cannot fully address such a broad topic, especially when it focuses on galleries in two of the world's leading art market hubs—London and Paris—which, in spite of globalization, still feature some unique local and national characteristics.
- Kapferer, Judith (2010). "Twilight of the Enlightenment: The Art Fair, the Culture Industry, and the 'Creative Class'." Social Analysis: The International Journal of Social and Cultural Practice 54, 2 (summer 2010), pp. 9–27
- Keywords: sociology of art, creative economy, cultural industries, art fairs, Europe, critique
- Summary: Although the topic of this article is not directly related to that of this study, the author provides some very interesting information on how the creative industry has evolved well beyond the confines of applied visual arts. According to the author, following post-war socio-economic upheavals in both the United States and England, the visual arts and culture in general were popular subjects in universities, but concrete jobs were hard to come by outside academia. Culture gradually brought about changes in various industries, leading to the establishment of a creative class, thus a creative economy.
- Kaplan, Isaac (2016). " Should the Art Market Be More Heavily Regulated? " Artsy, May 23, 2016.
- Keywords: regulations, art market, study limitations
- Macquisten, Ivan (2016). " Should the art market be more transparent? " Apollo – The International Art Magazine, September 16, 2016.
- Keywords: transparency, international art market, study limitations
- Maranda, Michael (2017). " Hard Numbers: A Study on Diversity in Canada's Galleries. " Canadian Art, April 5, 2017.
- Keywords: Canada, cultural workers, minorities, institutions
- Summary: Article analyzing recent research (2016). The author points out that while cultural diversity and equity feature prominently in cultural policies, there is actually virtually no data on hand to assess the situation. He presents data he compiled in 2015 while studying public museums, including data on minority artists and employees.
- (R) Maranda, Michael (2009). Waging Culture: A Report on the Socio-Economic Status of Canadian Visual Artists. Toronto, ON: Art Gallery of York University.
- Keywords: artists' socio-economic conditions, Canada, Indigenous people, minorities, gallery representation
- Summary: ® Resource recommended by a consultation panelist. Michael Maranda compares the socio-economic conditions of Caucasian, Indigenous and visible minority artists in Canada. The report includes a wealth of raw data from a survey of a broad sample of Canadian artists and their networks.
- Martin, Bénédicte (2007). "How Visual Artists Enter the Contemporary Art Market in France: A Dynamic Approach Based on a Network of Tests." International Journal of Arts Management 9, 3 (spring 2007), pp. 16–33.
- Keywords: artists, art market, France, networks
- McAndrew, Clare (2017). The Art Market 2018. Basel and Zurich, Switzerland: Art Basel and UBS, 175 p.
- Keywords: art market, international, collectors
- Summary: Study on the economic impact of the art market commissioned by UBS and the Art Basel fair. Led by cultural economist Dr. Clare McAndrew, the study has a section on visual arts distribution networks that presents data on private galleries (split into primary and secondary markets), including their sales and other indicators such as longevity, profitability and issues these galleries are likely to face in 2018. The study gets its data from public auction figures as well as surveys and interviews with medium-to-large-sized galleries having participated in international fairs, as in McAndrew 2017 and Pownall 2017. While the issues raised in these studies are extremely relevant and may well reflect issues encountered by other galleries that do not participate in these events, the fact remains that this type of study fails to take into account the realities of local and medium-sized galleries, which make up the bulk of businesses in this sector.
- McAndrew, Clare (2016). The Art Market 2017, Basel and Zurich, Switzerland: Art Basel and UBS.
- Keywords: art market, international, acquisitions, galleries, primary and secondary markets
- Summary: Art market research commissioned by UBS and Art Basel. This study aimed at providing an overall picture of the art world and its market differs from similar studies (i.e., Pownall 2017) in that it focuses on art collectors and the growth of major collectors worldwide and by country.
- McIntyre, Morris Hargreaves (2004). Taste Buds: How to cultivate the art market. London, UK: Arts Council England.
- Keywords: cultural economy, United Kingdom, government report, cultural economic growth, value chain/ecosystem
- Summary: Study commissioned by Arts Council England providing valuable insights into visual arts production, supply and distribution. The study was conducted prior to the launch of Own Art, a program that reduces financial risks to galleries and artists by allowing the general public to finance art purchases through the government (Arts Council) rather than galleries.
- MCC – Ministère de la Culture et des Communications du Québec (2016). Enquête sur les pratiques culturelles au Québec 2014 – Faits saillants de l'Enquête 27 (March) [PDF document ] . Québec: Gouvernement du Québec.
- Keywords: broad culture, Quebec, collecting
- Summary: Most recent quinquennial survey of cultural practices in Quebec (Audet et al. 2009). The survey details the evolution of consumption and cultural practices in Quebec in many cultural sectors. The visual arts are mentioned only once in the report, while habits related to the book, performing arts, television and music industries are examined in depth. All in all, the report shows an increase in art purchases from 2009 (Audet et al. 2009) to 2014: "$502: Average purchase amount for artworks and handicrafts. Works of art were purchased by 26% of the population, and handicrafts by 10% (MCC 2016, 49)."
- Department of Industry (2014). Canadian Culture Satellite Account, 2010 [PDF document].
- Keywords: arts economy, economic growth, broad culture, cultural workers, Canada, provinces, raw data
- Summary: Raw database on Canada's cultural economy. See SSHRC (2018) for interpretation of latest data.
- Misdrahi, Marian (2015). "Être 'découvert' ou se faire 'reconnaître'? Le processus de détermina-tion de la valeur artistique dans l'attribution de bourses en arts visuels." Sociologie et sociétés 47, 2, pp. 65–83
- Keywords: creation grants, culture, international, legitimation
- Moulin, Raymonde (2002). "Le monde de l'art : acteurs, institutions, marchés…" Sciences Humaines , Special Issue 37 (June–August 2002), pp. 44–47.
- Keywords: theoretical principles of the art market, ecosystem/value chain, sociology of art, art world
- Summary: Leading author on art market theory. Provides a clear overview of the roles of art stakeholders and legitimation authorities and their influence on the value of art. According to Moulin, the value of art is determined where art institutions and markets converge.
- Moulin, Raymonde (1992). L'artiste, l'institution et le marché. Paris: Flammarion.
- Keywords: theoretical principles of the art market, art legitimation authorities, sociology of art, art world
- Moulin, Raymonde and Alain Quemin (1993). "La certification de la valeur de l'art. Experts et expertises." Annales. Économies, Sociétés, Civilisations 48, 6 (1993), pp. 1421–1445.
- Keywords: appraisal, legitimation, art world, sociology, theoretical principles of the art market
- Summary: This document focuses on the concept of "appraisal," i.e., identifying and assessing works in order to assign a value to them. According to the sociology of art and culture, appraisal is a key component in the legitimation process. Moulin and Quemin discuss the practices and issues of the stakeholders governing the "art rating scale."
- Moureau, Nathalie and Dominique Sagot-Duvauroux. "Four Business Models in Contemporary Art." International Journal of Arts Management 14, 3 (spring 2012), pp. 44–56.
- Keywords: theoretical principles of the art market, visual arts economy, private galleries, business models, contemporary art, France
- Summary: Typology of artists and art distributors based on works produced, according to validation by legitimation authorities. Reference book describing the structure of visual arts distribution networks.
- Nathan, Max, Tom Kemeny, Andy Pratt and Greg Spencer (2016). Creative Economy Employment in the US, Canada and the UK: A Comparative Analysis. London, UK: Nesta.
- Keywords: creative economy, cultural workers, United Kingdom, Canada, United States
- Noonan, Caitriona (2015). "Constructing creativities: Higher education and the cultural industries workforce." In Kate Oakley and Justin O'Connor, eds. The Routledge Companion to the Cultural Industries. London, UK; New York, NY: Routledge, pp. 442–451.
- Keywords: broad culture, education, overqualification
- Nordicity (2016). " Needs Assessment: Arts Administration Skills and Resources in Nunavut's Arts and Culture Sector. " Provincial and Territorial Arts Research Reports. Ottawa, ON: Canada Council for the Arts, Aboriginal Affairs and Northern Development Canada and Government of Nunavut
- Keywords: cultural businesses, Indigenous communities, Inuit
- Nordicity Group and Uqsiq Communications (2010). Economic Impact Study: Nunavut Arts and Crafts.
- Keywords: economic contribution of the visual arts, Indigenous and Inuit communities
- Summary: Report commissioned by the Government of Nunavut demonstrating the signification contribution arts and crafts production has made to the territory's economy. The Nunavut visual arts scene features a mix of artworks, handicrafts, commercial works and art created primarily for the purpose of artistic expression, which is unusual and uncommon in traditional cultural industries. This "delicate balance of fine art and accessible handmade commodities has been mutually beneficial in sustaining the arts and crafts sector and benefiting other territorial industries, particularly tourism (Nordicity 2010, 5)." The researchers found that, with adequate access to training, materials and markets, Nunavut's artists would continue to translate cultural and artistic expression into significant economic benefits. Access to markets remains a major issue, particularly for artists outside large communities (Nordicity 2010, 10). The characteristics of the supply chain for these artistic products are special in that they reflect specific and unique realities.
- Ashley, Paige (2015). " New transparency in the art market ." Telegraph, March 13, 2015.
- Keywords: Study limitations, transparency, restitution
- Summary: Not relevant to this literature review. Article on the growth of restitution projects for looted or stolen works of art owing to the collaboration of auction houses.
- Patterson, Matt and Daniel Silver (2015). "Turning the Post-Industrial City into the Cultural City: The Case of Toronto's Waterfront." In Kate Oakley and Justin O'Connor, eds. The Routledge Companion to the Cultural Industries. London, UK; New York, NY: Routledge, pp. 268–280.
- Poper, Ben (2017). " How Artsy finally convinced galleries to sell fine art online ." The Verge, July 18, 2017.
- Keywords: art market, economic growth, online
- Pownall, Rachel A.J., ed. (2017). The TEFAF Art Market Report 2017. Helvoirt, Netherlands: The European Fine Art Foundation (TEFAF), 223 p.
- Keywords: supply chain, value of art market, transparency, public sales, private sales, international, Canada, changing business models, retail business
- Summary: Independent study carried out annually (since 2002) by a Maastricht University research group and disseminated for The European Fine Art Fair (TEFAF) in Maastricht. The study monitors the performance of the international market and projects art and antique sales volumes by country, based on public and private sales (with no distinction between primary and secondary markets). It highlights a growing shift from public to private sales, exemplified by the fact that auction houses are changing their business models to include private sales services. This development complicates data collection and does not improve the market's transparency, but according to the authors, it appeals to an increasing number of buyers.
- Cultural Statistics Program (2007 ). Economic Contribution of the Culture Sector to Canada's Provinces. Ottawa: Statistics Canada.
- Keywords: art economy, economic growth, broad culture, cultural workers, Canada, provinces
- Quemin, Alain (2015). " The Impact of Nationality on the Contemporary Art Market ." Sociologia & Antropologia 5, 3 (December 2015), pp. 825–586.
- Keywords: theory, sociology of art, art market, artist nationality, country of residence, globalization, success indicators, artist ratings, contemporary art
- Summary: Article by French sociologist Alain Quemin. Following in the footsteps of the most important theorists in art market sociology, the author studies the impact of nationality and location on an artist's success and analyzes the recognition process using empirical data on artists and stakeholders (validation). He demonstrates that even though globalization is supposed to have taken over the art industry, nationality still matters and a rigid international hierarchy is still very much in place (Quemin 2015, 825). The study includes data on Canada. Overall, 80% of the world's most renowned artists live and work in the countries where they were born, contrary to the sociologist's assumption that popular artists should be more likely to travel and leave their countries of origin (Quemin 2015, 836).
- RCAAQ (2018). "Des indicateurs d'augmentation de la force de la culture à prendre avec prudence." Actualités – Réseau Art Actuel , March 2, 2018.
- Keywords: methodology, culture satellite account
- Summary: Notice from major visual arts network Réseau Art Actuel warning that the Culture Satellite Account released in early 2018 contains some ambiguous data that should be interpreted with a grain of salt.
- Resch, Magnus (2016). Management of Art Galleries. 2nd ed. London, UK; New York, NY: Phaidon Press Limited.
- Keywords: art market, France, Germany, United States, management, art galleries
- Summary: Harvard economist Magnus Resch highlights the many management challenges facing private galleries in the United States, France and Germany in this second edition of his doctoral thesis. He sounds the alarm on the negative profit margins of these key players in the art market, an issue affecting medium-sized galleries around the world. He proposes solutions drawn from the field of administration, which the art community has criticized on grounds that they ignore the rules and conventions of the art world.
- Routhier, Christine (2015). " Les acquisitions d'œuvres d'art des musées, des entreprises et des institutions en 2012-2013 et 2013-2014 ." Optique culture, No. 44 (October). Quebec City: Institut de la statistique du Québec, Observatoire de la culture et des communications du Québec, 12 p.
- Keywords: visual arts market, Quebec, acquisitions, corporate and public collections, 1%
- Summary: Biannual study to assess visual arts consumption by institutions, corporate collectors (including Crown Corporations) and municipalities in Quebec. The data include purchases made directly from artists (including 1% works). A highlight of this edition is that 75% of works acquired in 2013–2014 were from artists outside Quebec (23% from Quebec) and that only 30% of total sales in 2013–2014 were from Quebec suppliers (galleries, dealers, consultants). This downward trend continues. For example, in 2010–2011, 73% of purchases were made in Quebec, while this number was 92% in 2008–2009.
- Routhier, Christine (2013a). " Les acquisitions d'œuvres d'art des musées, des entreprises et des institutions en 2010-2011 et 2011-2012. " Optique culture 29 (November). Quebec City: Institut de la statistique du Québec, Observatoire de la culture et des communications du Québec, 12 p.
- Keywords: visual arts market, Quebec, acquisitions, corporate and public collections, 1%
- (R) Routhier, Christine (2013b). Les artistes en arts visuels – Portrait statistique des conditions de pratique au Québec, 2010 . Quebec City: Institut de la statistique du Québec, Observatoire de la culture et des communications du Québec, 105 p.
- Keywords: artists' socio-economic conditions, Quebec, typology of artist profiles, education, creative income, gender divide
- Summary: Resource recommended by a consultation panelist. While its data is nearly ten years old (2010), the study remains one of the most comprehensive in terms of providing an overview of artists' socio-economic conditions in Quebec. The OCCQ used this study to establish a typology of visual artist profiles based on shared characteristics (Routhier 2013b, 17–22; Routhier 2013c). Overall, the profession seems to differ greatly from the rest of the labour force in terms of gender distribution (60% women vs. 47% in the labour force), age groups (workers over 45 are overrepresented), employment status (75% are self-employed and 31% have a business [Routhier 2013b, 75]), education (55% have a university degree in visual arts and 31% in another field as well), and income (average net income of $23,825, including $1,626 in creative income). The report's greatest asset is its typology of artist profiles which makes it possible to better identify the diversity of groups and understand each one's specificities; this allows for a new perspective some general and generalized issues regarding artists. Generally speaking, artists certainly seem to be passionate about their work: only 38% of them have considered changing careers (27% for financial reasons) and 91.8% of them have positive outlooks, saying that they want to "retire as late as possible" (Routhier 2013b, 82–83).
- Routhier, Christine (2013c). " Les artistes en arts visuels québécois: un aperçu statistique ." Optique Culture 23 (May).
- Keywords: artists' socio-economic conditions, Quebec, typology of artist profiles
- Summary: Study providing an overview of the socio-economic conditions of visual artists in Quebec based on education, income and job insecurity. Six artist profiles are identified.
- Routhier, Christine (2011). " Les acquisitions d'oeuvres d'art des musées, des entreprises et des institutions en 2009–2010 ." Optique culture, No. 10 (September). Quebec City: Institut de la statistique du Québec, Observatoire de la culture et des communications du Québec, 12 p.
- Keywords: visual arts market, Quebec, acquisitions, corporate and public collections, 1%
- Routhier, Christine (2006). "Les ventes des marchands d'œuvres d'art en 2001–2002." Statistiques en bref 20 (June). Quebec City: Institut de la statistique du Québec.
- Keywords: visual arts market, Quebec, acquisitions, primary market, secondary market, private galleries, auction houses, retail business
- Summary: Two-pronged study measuring the sum of transactions carried out by establishments that sell and purchase works of art (see also Routhier 2004). This is the only edition of the study on dealers. Other editions covered institutions, museums and corporate collectors (see Routhier 2011, 2013, 2015) and were released regularly until 2017, when the OCCQ announced that the 2015–2016 edition would be the last one owing to lack of funding. It should be noted that, to our knowledge, this is the only survey that segments sales by primary and secondary market.
- Rivest, Jacques (1992). L'artiste et son marché: les intervenants de l'art en Amérique du Nord. Conseil des arts du Québec . Consulted September 26, 2017. [Also available in print: ISBN 29802973-0-X, 12 p.]
- Keywords: ecosystem, distribution network, artists' socio-economic conditions, 1980s–1990s, artist centres, private galleries, primary market, art world conventions
- Summary: Pamphlet intended to help artists "make the most of art stakeholders." Written for the Conseil des arts du Québec in 1992, the report insists that, when it comes to their work, artists can and must take on a management role at all levels of distribution, promotion and dissemination in conjunction with other professional stakeholders in order to maximize their visibility and income. As such, artists are responsible for the "direction their careers and businesses take (Rivest 1992, 5)." The author describes artists' socio-economic conditions to contextualize their need to control the dissemination and distribution of their art. He also provides a detailed list of "art sellers" with advantages and disadvantages. These sellers are engaged in the primary market, but on different fronts: there are art stakeholders recognized by legitimation authorities as well as other sellers that have historically been largely ignored by professional artists at artist centres and private galleries, such as furniture stores and interior designers. At the very end of the report, Rivest provides tables with statistics on works of art purchased by Quebecers in the 1980s (Rivest 1992, 12).
- Robillard, Yves (1981). "Les institutions artistiques et le marché de l'art au Québec." Intervention 13 (November 1981), pp. 6–10.
- Saha, Anamik (2015). "The marketing of race in cultural production." In Kate Oakley and Justin O'Connor, eds. The Routledge Companion to the Cultural Industries. London, UK; New York, NY: Routledge, pp. 512–521.
- Keywords: Visible minorities, international studies
- Schmitt, Jean-Marie (2008). Le marché de l'art. Paris: La documentation française.
- Keywords: ecosystem, art market, France, international comparables
- Schimpf, Michael and Paul Sereda (2007 ). Towards a Geography of Culture: Culture Occupations Across the Canadian Urban-Rural Divide – 2001. Ottawa: Minister of Industry, Statistics Canada.
- Singh, Vik (2004a). Economic Contribution of Culture in Canada – A Provincial Perspective. Ottawa: Statistics Canada.
- Keywords: art economy, economic growth, broad culture, cultural workers, Canada
- Singh, Vik (2004b). Economic Contribution of the Culture Sector in Canada: A Provincial Perspective. Ottawa: Statistics Canada.
- Keywords: art economy, economic growth, broad culture, cultural workers, Canada, provinces
- Statistics Canada (2017). " Survey of Household Spending (SHS), Household Spending, Canada, Regions andProvinces, Annual (dollars) ." CANSIM 203-0021 (last update: December 12, 2017).
- Keywords: acquisition of cultural products, collectors, household spending, Canada
- Summary: Data from the Canadian Surveys of Household Spending from 2012 to 2016. In short, Canadians are spending less and less on art. This data should be taken with a grain of salt given the broad categories used in the survey (works of art, antiques and decorative items under "Household Furnishings" sub-category).
- Statistics Canada (2015). " The creative chain ." Canadian Framework for Culture Statistics 2011, November 29, 2011 (last update: November 30, 2015). Consulted February 27, 2018.
- Keywords: distribution network, theoretical framework, government document
- Summary: Statistics Canada's theoretical framework for the cultural sector's distribution networks, i.e., creative chain. A passage (Chapter 5.1) addresses the visual arts and suggests that the creative process between an original product and its use can be simple or complex, but it is always circular, depending upon the number of stages it goes through and the influence of transversal domains. For example, a painting sold by an artist directly to a consumer can be illustrated by a simple chain: creation (product) -> final demand (direct sale). Complex processes involve several intermediaries, with the original product moving from one to the next. In short, heritage and cultural products are specific. This theoretical framework also suggests some definitions, such as that for "original work."
- Statistics Canada (2004). "Earnings of Culture Workers: Findings from Canadian Census Data." Focus on Culture 15, 2. Ottawa, ON: Statistics Canada.
- Keywords: cultural workers, Canada, census, methodology
- Summary: Study predating Hill 2014. Data from 2006 and 2011 (Hill 2014) cannot be compared owing to changes in census methodology. Accordingly, this study was not analyzed in this literature review and only the latest version was taken into account.
- TCI Management Consultants Limited (1999). Study of the Market for Canadian Visual Art. Ottawa: Canadian Heritage.
- Keywords: visual arts market, Canada, values, distribution network
- Summary: Study commissioned by Canadian Heritage in 1999 covering the 1998 fiscal year. In addition to findings extrapolated from complex and questionable methodological crossovers, it should be noted that this is the only study attempting to evaluate the Canadian art market and to define the visual arts distribution network. The survey identifies the following visual arts distribution channels: Canadian commercial art galleries (about $233 million in sales in 1998), auction houses ($21 million), non-profit art galleries (rentals and sales) ($1 million), "other domestic channels" ($258 million), imports ($70 million) and government-sponsored works, including municipalities ($20 million) (TCI 1999, 4, 39).
- Thompson, Donald N. (2008). The $12 Million Stuffed Shark: The Curious Economics of Contemporary Art and Auction Houses. London, UK: Aurum Press.
- Keywords: art economy, economic growth, broad culture, cultural workers, Canada, provinces
- Summary: Book intended for the general public describing the art market ecosystem in layman's terms and responding to public demand by focusing its explanations on the contemporary art world's "star system" and on speculation. Artists with strong marketing (e.g., Jeff Koons and Damien Hirst) can boost their value by being associated with high-profile gallery owners and collectors.
- Trépanier, France (2009). Final Report: Aboriginal Arts Administration Forum. Aboriginal Leadership and Management Programs. Banff, Alberta: Banff Centre and Alberta Association of Colleges & Technical Institutes / Canadian Centre for Indigenous Leadership and Management, 54 p.
- Keywords: Indigenous art, management, cultural entrepreneur
- Summary: Report on the Banff Centre's second forum bringing together members of Indigenous communities to discuss administration, management and governance in Indigenous cultural and community organizations. The report highlights the benefits of the forum, which has given administrators, managers and coordinators the opportunity to discuss their often similar circumstances, and underscores some of the organizational issues encountered by these cultural workers, particularly in terms of leadership, financial resource management, governance and skills development, etc. The extent to which these challenges are specific to Indigenous workers is debatable, as managers of Caucasian and other cultural organizations may face similar issues.
- Uzel, Jean-Philippe (2017). Pratiques professionnelles en arts visuels issues de l'autochtonie et de la diversité à Montréal. Montreal: Conseil des arts de Montréal and Université du Québec à Montréal.
- Keywords: minority artists, Indigenous artists, Montreal, artists' socio-economic conditions, professional issues, legitimation authorities
- Summary: Study led by art historian Jean-Philipe Uzel and commissioned by the Conseil des arts de Montréal as part of its 2013–2016 Strategic Plan, an objective of which was to promote the diversity of professional practices in the visual arts. The study identifies issues encountered by Indigenous and minority artists, two groups that often face the same problems. These include having difficulty achieving professional status, lacking visibility, not being fairly recognized (Uzel 2017, 9, 51) and feeling discouraged (Uzel 2017, 57–58). Conversely, they differ in other key aspects such as techniques and media, cultural heritage and the notion of "contemporary" (too often opposed to "traditional"). The study concludes by recommending that Montreal visual arts organizations and presenters promote the practices of artists in these two groups and foster their professional development to ensure that "the Montreal visual arts community becomes more open to Indigenous and minority practices (Uzel 2017, 11)." The report stresses that sponsors and broadcasters must adapt to the realities of these artists, not the other way around (Uzel 2017, 67).
- Velthuis, Olav (2007). Talking Prices: Symbolic Meanings of Prices on the Market for Contemporary Art. Princeton, NJ and Oxford, UK: Princeton University Press.
- Keywords: symbolic value, legitimation, art world, symbolic economy, theory
- Summary: Major theoretical work explaining the concept of symbolic value as it pertains to visual arts products, i.e., how the "market architecture" (distribution network) affects (legitimizes) and explains prices.
- Baia Curioni, Stefano, Laura Forti and Ludovica Leone (2015). "Making Visible." In Olav Velthuis and Stefano Baia Curioni, eds. Cosmopolitan Canvases: The Globalization of Markets for Contemporary Art. Oxford: Oxford University Press, 299 p.
- Keywords: value, symbolic economy, theory, distribution chain, stakeholders, legitimation process, globalization, art market, contemporary galleries, art fairs
- Summary: Edited by two economists specialized in the art market, this book contains a series of essays on contemporary art markets in a context of globalization. This chapter by economic historian Stefano Baia Curioni provides an overview of the complex and dynamic network of actors involved in the contemporary art appraisal process. In a study of one of the most important and high-profile fairs, Art Basel, he describes the social role networks play and how galleries drive consensus-building and recognition. He describes the potential of these networks as mechanisms for self-recognition within the contemporary art community, in particular through the geographical distribution of artists in gallery portfolios, presented as portfolios of professional opportunities and performance indicators, particularly with regard to non-Western emerging artists.
- Winkleman, Edward (2015). Selling Contemporary Art. New York, NY: Allworth Press.
- Keywords: private galleries, art world conventions, primary market, art fairs, entrepreneurship
- Summary: Book for gallery owners that highlights some of the challenges faced by mid-sized galleries in the contemporary art market. One part of the book focuses on recent changes in the contemporary art market (web, internationalization) and how gallery owners can adapt. This part, which is the most relevant to this review, is subtitled "Things Beyond Each Dealer's Control."
- Wright, David (2015). "Imagining the cultural consumer: Class, cool and connoisseurship." In Kate Oakley and Justin O'Connor, eds. The Routledge Companion to the Cultural Industries. London, UK; New York, NY: Routledge.
- Keywords: consumers, international study