
Canadian Artists and Content Creators Economic Survey Report
On this page
- Key findings
- Introduction
- Participation
- Precarity and work arrangements
- Sources of support
- Impact of COVID-19
- Conclusions and next steps
- Appendix 1: Survey questions and results
- Question 1. From the list below, please indicate your primary field of work as an artist or content creator.
- Question 2. Do you self-identify as belonging to any of the following groups?
- Question 3. Pre-pandemic, in 2019 what proportion of your personal income came from activities related to your creative work? (Sales, performance, wages, commissions, royalties, etc.)
- Question 4. In what media, genre or space do you work?
- Question 5. Pre-pandemic in 2019 (between January and December), were you working as a {Response to Question 1}?
- Question 6. How many hours per week did you spend on average on your creative work as a {Response to Question 1}? (Note: This excludes time spent on promoting or marketing)
- Question 7. How many hours per week did you spend on average on your non-creative work as a {Response to Question 1}? (Note: This includes time spent on promoting or marketing)
- Question 8. How long have you generated income from your work as a {Response to Question 1}
- Question 9. In the 2016 Canadian Census, what did you identify as your occupation?
- Question 10. What was your employment status on December 31, 2019?
- Question 11. Please select the option(s) that best describe your employment status on December 31, 2019.
- Question 12. Please select the option that best describes how much your income levels from your work as a {Response to Question 1} typically change, year to year (without taking the pandemic into consideration):
- Question 13. What was your total gross (pre-tax) personal annual income in 2019?
- Question 14. In the past 5 years, were any of the following sources of income for your work as a {Response to Question 1}?
- Question 15. In the past 5 years, where have you sold your works, promotional/branded merchandise, or exhibits and performances?
- Question 16. In the past 5 years, which of the following sources provided direct additional financial support for your work as a {Response to Question 1}?
- Question 17. What federal sources of support did you receive in the past 5 years?
- Question 18. Since the outbreak of COVID-19 in Canada (March 2020), how much time have you spent on your creative work compared to what was typical in 2019?
- Question 19. Since the outbreak of COVID-19 in Canada (March 2020), how has your income from creative work differed, if at all, compared to what you experienced over the same period in 2019?
- Question 20. Since the outbreak of COVID-19 in Canada (March 2020), have you applied for any of the following emergency support?
- Question 21. Which of the following statements best describes how the challenges brought on by the COVID-19 pandemic have affected your plans regarding your own creative work in the long-term (after the pandemic)?
- Question 22. Now, during the pandemic, approximately what proportion of your personal income currently comes from activities related to your creative work? (Sales, performance, wages, commissions, royalties, etc.)
- Question 23. What types of industry intermediaries do you currently work with to produce or disseminate your work?
- Question 24. Besides the option(s) you selected previously (if any), why not work with other industry professionals or organizations in your field?
- Question 25. Please indicate in the checklist below the areas of support from industry professionals or organizations where you have benefitted in the past and/or would like to benefit in the future.
- Question 26. Principal place of residence:
- Question 27. Province / Territory:
- Question 28. Age:
- Question 29. Gender:
- Question 30. Marital status:
- Question 31. Dependents:
- Question 32. Language spoken most often at home:
- Question 33. Highest level of education attained (completed):
- Question 34. Is part of your education directly related to your work as a {Response to Question 1}?
- Question 35. Do you live in...
- Question 36. Do you live on a First Nations reserve?
- Question 37. What wasn’t asked in this survey that you feel is important for us to know about the circumstances of your economic viability as a Canadian artist or content creator? Please feel free to elaborate on themes from the survey. When providing comment, we request that you do not include identifying personal information about yourself or others.
List of figures
- Figure 1: Participation in the survey by field
- Figure 2: Gross personal annual income
- Figure 3: Gross personal annual income by gender
- Figure 4: Change in levels of income from creative work year to year (pre-pandemic)
- Figure 5: Proportion of income from creative work, prior to and during the COVID-19 pandemic
- Figure 6: Employment type
- Figure 7: Direct additional financial support
- Figure 8: Areas of support, past and future
- Figure 9: Impact of pandemic on creative income
- Figure 10: Impact of pandemic on time spent on creative work
List of tables
- Table 1: Participation of equity-deserving groups in survey
- Table 2: Sources of income by field
- Table 3: Industry intermediaries by field
- Table 4: Impact of pandemic on creative income by gender
- Table 5: Impact of pandemic on time spent on creative work by gender
- Table 6: Impact of pandemic on creative income by field
- Table 7: Impact of pandemic on time spent on creative work by field
- Table 8: Post-pandemic plans by field
List of acronyms and abbreviations
- AV
- Audiovisual
- CACCES
- Canadian Artists and Content Creators Economic Survey
- CERB
- Canada Emergency Response Benefit
- CESB
- Canada Emergency Student Benefit
- COVID-19
- Coronavirus Disease of 2019
- CRB
- Canada Recovery Benefit
- CRSB
- Canada Recovery Sickness Benefit
- EI
- Employment insurance
- LGBTQ2S+
- Lesbian, Gay, Bisexual, Transgender, Queer or Questioning, and Two-Spirit
Alternate format

Canadian Artists and Content Creators – Economic Survey Report [PDF version - 1.68 MB]
Key findings
This report highlights key results from the Canadian Artists and Content Creators Economic Survey (CACCES). The survey was designed to generate timely data on the challenges facing Canadian artists and content creators prior to and during the COVID-19 pandemic. CACCES, available online between May 10 and July 2, 2021, generated 4,747 valid responses.
Information was collected on the following areas: artistic field of practice, employment and income, creative work in the context of COVID-19, relationship to industry, international trade patterns, supports sought by artists, and demographic variables (for a full list of questions, see Appendix 1: Survey questions and results).
Respondents’ creative incomes are volatile and low
One quarter (25%) of respondents reported that their income from creative work could fluctuate by at least 100% from year to year (without taking the pandemic into consideration), and 60% of respondents reported that their income could fluctuate by at least 50% year to year.
Overall, 57% of survey respondents reported a total gross (pre-tax) income of under $40,000 in 2019 (this includes all income sources, including income from creative work and other sources).
Many respondents still rely on traditional income sources
Over one third (36%) of respondents reported generating income from some form of public showing or performance. This figure was higher for musical artists (56%) and performing artists like actors, dancers, and comedians (49%)—a pattern that laid the foundation for these fields to be particularly hard-hit by pandemic-related public health restrictions. The most common income sources included “analog” sources like public exhibits and physical sales. The least common sources were digital or passive forms of income generation, such as royalties and online paid downloads.
A majority of respondents are self-employed
Overall, self-employment plays a large role in how artists generate income, with a majority (64%) of survey respondents reporting some form of self-employment, whether that was in their creative field, in a related field, or in a completely different field. Most artists and content creators reported being de facto entrepreneurs and working many hours doing all the planning, marketing, networking, and administrative work that that entails. Respondents to the survey spent an average of 15.5 hours per week doing this type of non-creative work.
About 41% of respondents reported working full-time in their creative occupation. This includes people who are both employed and self-employed. This means that the majority—almost 60%—of respondents are not working full-time in their creative field. They may be working part-time in their creative field and holding down full- or part-time jobs in other fields.
The pandemic hit some fields particularly hard
Overall, 62% of respondents reported some loss of creative income during the pandemic.
This figure varied widely across artistic fields. On the upper end, 83% of musical artists and 79% of performing artists reported a loss in creative income since the outbreak of the pandemic. On the lower end, 52% of visual artists, 45% of writers, and 42% of audiovisual (AV) directors/content creators reported a loss in creative income since the outbreak of the pandemic.
Government support has been crucial during the pandemic: 56% of respondents applied for federal emergency support (including Canada Emergency Response Benefit (CERB), Canada Emergency Student Benefit (CESB), Canada Recovery Benefit (CRB), Canada Recovery Sickness Benefit (CRSB), and temporary COVID-19 relief through EI).
Introduction
Survey background
The cultural industries were one of the sectors most impacted by the public health measures put in place as a response to the spread of COVID-19 in Canada beginning in March 2020. For many workers in the creative sector, the pandemic exacerbated challenges that they were already facing because of technological change, the precarity associated with gig work and self-employment, and the rising costs of living.
Cultural policymakers need data in order to better understand and address these issues. Two gaps were identified. First, artists and content creators tend to have complex employment patterns—working several jobs, often in the gig economy—and this complexity may not get captured in large-scale data-gathering tools like the Census. Second, there was a need to generate data quickly to better understand the ongoing impacts of the COVID-19 pandemic on artists and content creators across the country.
The Canadian Artists and Content Creators Economic Survey (CACCES) was a pilot project designed to fill these gaps in a flexible, timely manner. With the assistance of organizations representing a wide range of cultural industries, Canadian Heritage designed an online survey that would be open to all creative workers, including those who might operate beyond the traditional scope of government grants and contributions programs.
Methods
CACCES was available online from May 10 to July 2, 2021, in English and French. Canadian Heritage adopted a snowball sampling method that relied on participants distributing the survey through their own professional and personal networks. The department met with Canadian arts organizations to get feedback on the survey questions, and these organizations helped disseminate the survey among their membership. The survey was also open to creative workers who were not members of an arts organization. Information sessions and a social media communications plan helped raise awareness about the survey more broadly. This approach proved successful: in the span of six weeks, the survey yielded 4,747 valid responses.
Uses and limitations of the data
Because a snowball sampling approach was used, data from CACCES cannot be used to draw inferences about the entire population of Canadian artists. However, it does provide a snapshot of the challenges facing creative sector workers in Canada during the COVID-19 pandemic.
CACCES is designed to collect economic data that complements existing data sources, in particular Statistics Canada sources like the Cultural Satellite Account. The data generated by CACCES should be interpreted in conjunction with these other sources of information.
Participation
Participation in the survey was open to all artists and content creators over the age of 16 working and living in Canada. To take the survey, participants were asked to self-identify as belonging to one of five main groups: audiovisual directors and content creators, musical artists, performing artists, visual artists, and writers. There was substantive participation from each field, with visual artists (27.4%) and writers (24.6%) making up a slightly larger proportion of respondents (Figure 1).
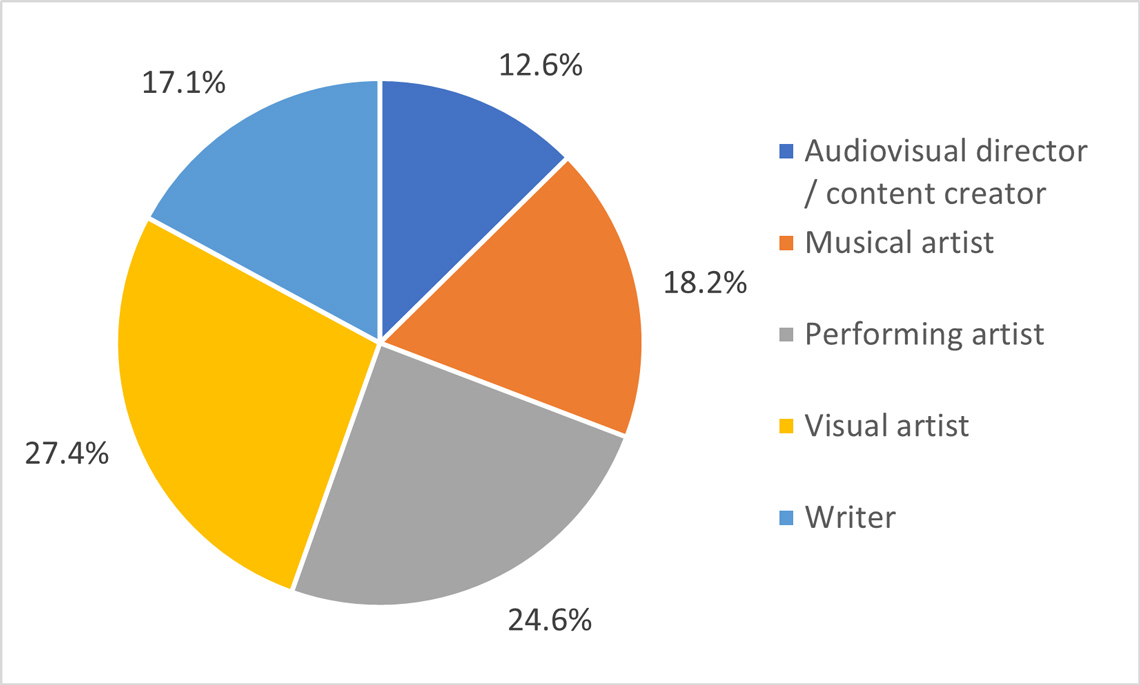
Figure 1: Participation in the survey by field – text version
| Participation in the survey by field | Percentage of respondents |
|---|---|
| Audiovisual directors and content creators | 12.6 |
| Musical artists | 18.2 |
| Performing artists | 24.6 |
| Visual artists | 27.4 |
| Writers | 17.1 |
The survey was designed to collect a wide range of demographic data to better understand the specific challenges facing equity-deserving groups. There was strong participation from artists across the country, as well as from different equity-deserving groups, including Indigenous Peoples, racialized communities, LGBTQ2S+ communities, deaf communities, persons with disabilities, and official language minority communities (Table 1).
| Group | Percentage of respondents |
|---|---|
| Women | 55.4% |
| Gender-diverse communities | 7.1% |
| LGBTQ2S+ communities | 21.3% |
| Indigenous Peoples | 3.2% |
| Racialized communities | 12.8% |
| Ethno-cultural communities | 7.8% |
| Immigrants and refugees | 8.3% |
| Religious minorities | 3.7% |
| Deaf communities and persons with disabilities | 12.2% |
| Official language minority communities | 8.0% |
| Youth | 5.7% |
| Seniors | 11.7% |
| Those with low income | 28.3% |
| Rural communities | 9.0% |
| Remote and Northern communities | 2.3% |
Precarity and work arrangements
Income levels
The creative incomes of respondents were low and volatile. Overall, a majority (57%) of survey respondents reported a total gross (pre-tax) income of under $40,000 in 2019. The overall picture is a long-tailed distribution (Figure 2), with most respondents clustered at the lower end of the income scale and a handful of high earners at the other end of the scale. (Note: Percentages in the graph do not add to 100% because 8% of respondents replied “Prefer not to say” in response to the income question.)
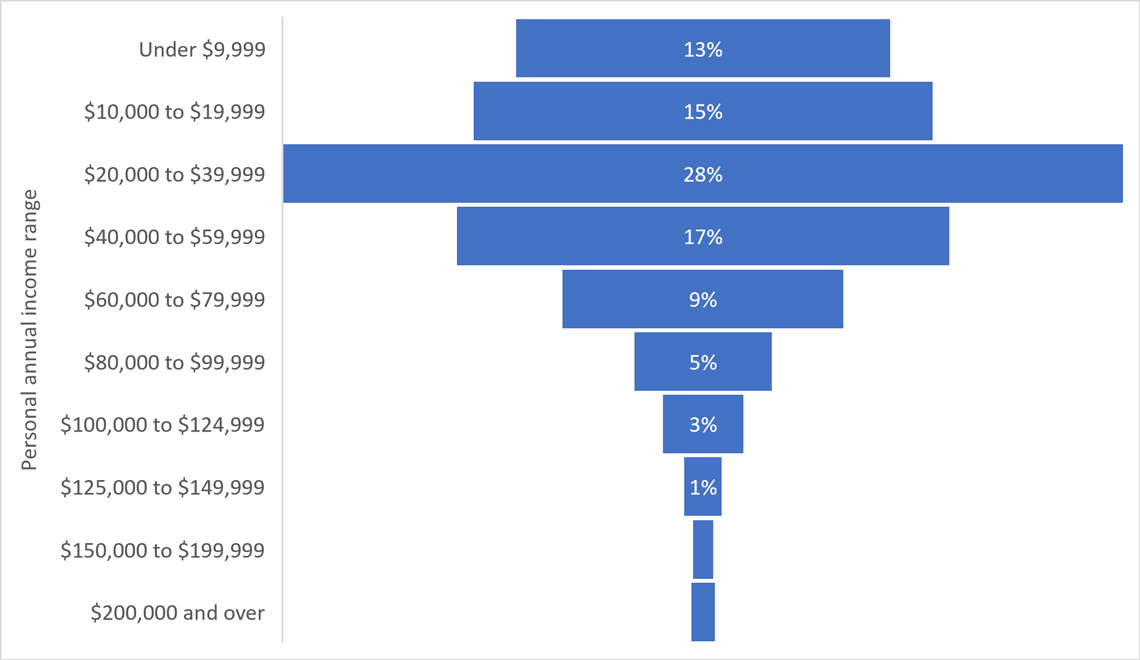
Figure 2: Gross personal annual income – text version
| Income range | Percentage of respondents |
|---|---|
| Under $9,999 | 13% |
| $10,000 to $19,999 | 15% |
| $20,000 to $39,999 | 28% |
| $40,000 to $59,999 | 17% |
| $60,000 to $79,999 | 9% |
| $80,000 to $99,999 | 5% |
| $100,000 to $124,999 | 3% |
| $125,000 to $149,000 | 1% |
| $150,000 to $199,999 | 0.7% |
| $200,000 and over | 0.8% |
While this long-tailed distribution remained consistent across all groups, it is worth highlighting that women and gender-diverse/non-binary respondents were more likely than men to report personal incomes under $40,000 per year and less likely to report higher income ($100,000 and over). Half of the respondents who identified as men reported an income under $40,000, compared with 59.3% of women and 72.4% of non-binary respondents (Figure 3). (Note: 250 respondents to the survey identified as gender diverse/non-binary.)
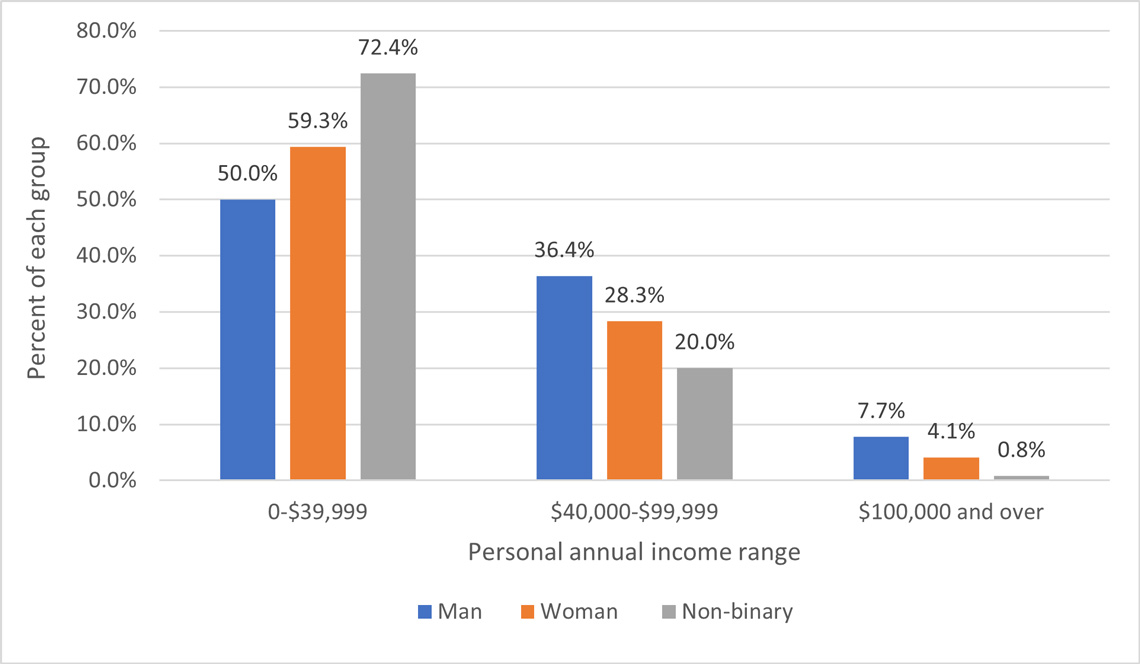
Figure 3: Gross personal annual income by gender – text version
| Personal annual income range | Man (percentage) | Woman (percentage) | Non-binary (percentage) |
|---|---|---|---|
| 0 to $39,999 | 50.0% | 59.3% | 72.4% |
| $40,000 to $99,999 | 36.4% | 28.3% | 20.0% |
| $100,000 and over | 7.7% | 4.1% | 0.8% |
Income volatility
The survey points to a high degree of income volatility among respondents. One quarter (25.3%) of respondents indicated that their income from creative work typically fluctuates by at least 100% year to year without taking the pandemic into consideration (Figure 4).
Respondents from all creative fields suffer a high degree of income volatility. On the upper end, 60% of performing artists said that their creative income fluctuates by at least 50% or 100% year to year and, at the lower end, 46% of musical artists said that their creative income fluctuates by at least 50% or 100% year to year. These figures relate to income from creative work; the survey also indicates that most respondents do not rely solely on their creative income. (See section Employment patterns below.)
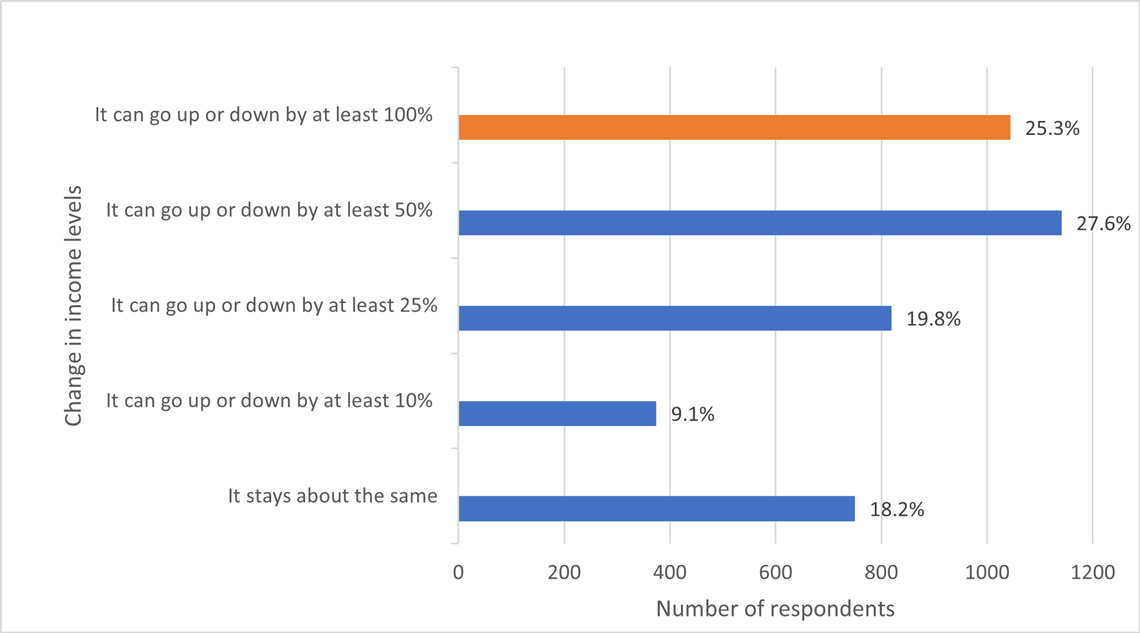
Figure 4: Change in levels of income from creative work year to year, pre-pandemic – text version
| Income change | Percentage of respondents |
|---|---|
| It stays about the same | 18.2% |
| It can go up or down by at least 10% (tenth) | 9.1% |
| It can go up or down by at least 25% (quarter) | 19.8% |
| It can go up or down by at least 50% (half) | 27.6% |
| It can go up or down by at least 100% (double) | 25.3% |
A mix of creative and non-creative income sources
Most respondents do not rely on their creative pursuits as a primary income source. Even prior to the onset of the COVID-19 pandemic, a majority of respondents (56.8%) were earning less than 50% of their personal income from their creative work (Figure 5). During the pandemic, in 2021, 73% of respondents were earning less than 50% of their personal income from their creative work.

Figure 5: Proportion of income from creative work, prior to and during the COVID-19 pandemic – text version
| Proportion of income from creative work | Percentage pre-pandemic | Percentage during the pandemic |
|---|---|---|
| None | 14.1% | 26.2% |
| Less than 25% | 30.5% | 37.9% |
| 25% to 49% | 12.2% | 8.9% |
| 50% to 74% | 9.3% | 5.2% |
| 75% to 99% | 11.0% | 5.5% |
| 100% | 23.0% | 16.3% |
Income sources from creative work
Over one third (36%) of respondents reported generating income from some form of public showing or performance. This figure was higher for musical artists (56%) and performing artists (49%)—a pattern that laid the foundation for these fields to be particularly hard-hit by pandemic-related public health measures.
| Source of income | AV director/content creator | Musical artist | Performing artist | Visual artist | Writer | Total responses |
|---|---|---|---|---|---|---|
| Public display or in-person performance of work | 90 | 482 | 572 | 391 | 189 | 1724 |
| Salaried or hourly paid job in this line of work | 202 | 310 | 561 | 336 | 171 | 1580 |
| Direct commissioning | 149 | 185 | 237 | 601 | 190 | 1362 |
| Physical sale of works | 47 | 257 | 77 | 671 | 279 | 1331 |
| Royalties and licensing | 118 | 331 | 312 | 186 | 280 | 1227 |
| Online paid download | 61 | 239 | 69 | 104 | 123 | 596 |
| None of the above | 140 | 67 | 112 | 118 | 156 | 593 |
| Sale of branded items or merchandise | 43 | 142 | 53 | 150 | 29 | 417 |
The most common income sources included “analog” sources like public showings and physical sales. The least common sources were digital or passive forms of income generation, such as royalties and online paid downloads.
Employment patterns
A primary aim of the survey was to capture the complexity of creative workers’ employment patterns. Respondents were asked to select the options that best described their employment status on December 1, 2019 (pre-pandemic), whether full- or part-time, and whether in their creative field, a related field, or a completely different field. Respondents could select multiple options. For instance, a respondent whose primary creative practice involves landscape photography but who also runs a business as a portrait photographer could choose “self-employed part-time in my field” and “self-employed part-time in a related field.”
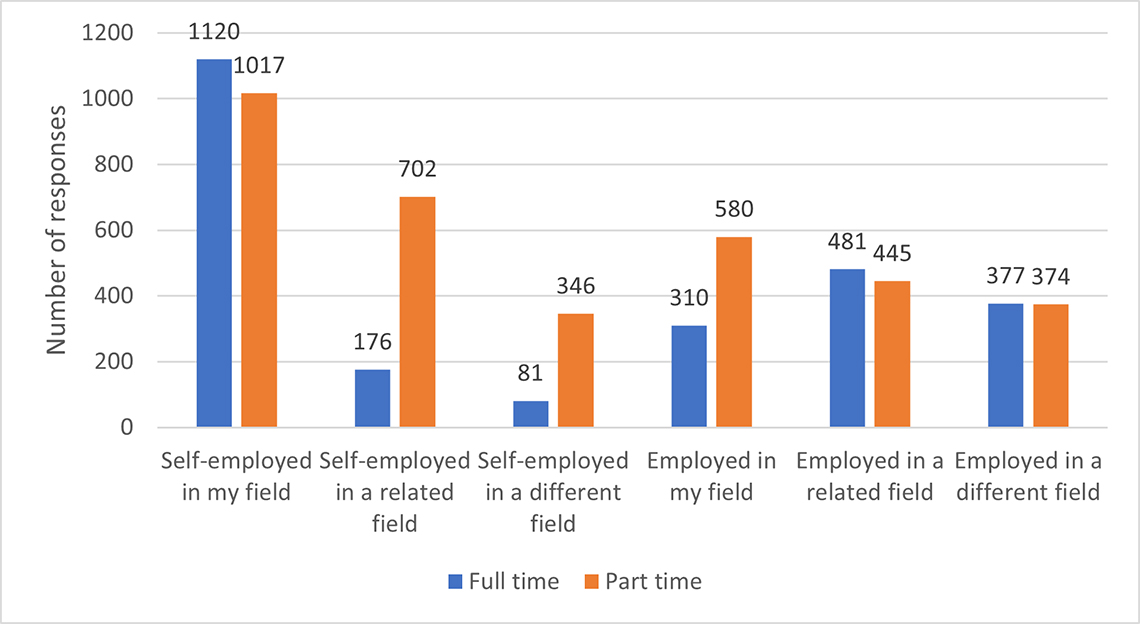
Figure 6: Employment type – text version
| Employment type | Full time | Part time |
|---|---|---|
| Self-employed in my field | 1120 | 1017 |
| Self-employed in a related field | 176 | 702 |
| Self-employed in a different field | 81 | 346 |
| Employed in my field | 310 | 580 |
| Employed in a related field | 481 | 445 |
| Employed in a different field | 377 | 374 |
About 41% of respondents to this question reported working full-time in their creative occupation (Figure 6). This includes people who are both employed and self-employed. This means that the majority—almost 60%—of respondents are not working full-time in their creative field. They may be working part-time in their creative field and holding down full- or part-time jobs in other fields.
Overall, self-employment plays a large role in how respondents generate income, with a majority (64%) of respondents reporting some form of self-employment, whether that is in their creative field, in a related field, or in a completely different field. This means that most respondents are de facto entrepreneurs and work several hours doing all the planning, marketing, networking, and administrative work that that entails. In fact, in another question, the survey found that respondents spent an average of 15.5 hours per week doing this type of non-creative or administrative work.
As one respondent explained in the survey’s final, open-ended question:
We often work more than one running gig at a time, stringing a mix of administrative and artistic work together. Since most groups use contract work, most of us are self-employed and don’t have the security that other employment can sometimes offer. We often need to be part accountant, performer, administrator, and salesperson all at once, often without access to health benefits. The COVID-19 pandemic highlighted how self-employed people are left out of the social safety net in many ways. It can be hard to predict what yearly income may be and it always changes.
Sources of support
Industry intermediaries
Overall, the survey indicates that respondents’ use of industry intermediaries (e.g. unions, managers, online platforms, rights collectives) and direct financial support (e.g. government grants, family support, crowdfunding) does not vary significantly across disciplines. There was a more notable pattern in the behaviour of one group: low-participation creative workers, which we define here as those who earned less than 25% of their income from creative work (pre-pandemic). This group makes up the majority of those not using intermediaries or accessing financial support.
The survey asked respondents which intermediaries they use to produce or disseminate their work (Table 3). The industry intermediaries most frequently mentioned focus on the dissemination side rather than the production side of creative work. For instance, “online platforms and streaming services” and “venues” were the first and third most cited industry intermediaries, respectively.
| Intermediary | AV director/content creator | Musical artist | Performing artist | Visual artist | Writer | Total |
|---|---|---|---|---|---|---|
| Online platforms and streaming services | 197 | 340 | 245 | 290 | 159 | 1231 |
| Festivals | 130 | 276 | 399 | 175 | 139 | 1119 |
| Venues (e.g. galleries, theatres, clubs) | 60 | 306 | 340 | 268 | 73 | 1047 |
| Professional unions, guilds, or associations | 62 | 176 | 338 | 84 | 134 | 794 |
| None: I work completely independently | 97 | 112 | 108 | 339 | 121 | 777 |
| Arts presenters | 31 | 233 | 323 | 72 | 59 | 718 |
| Independent managers, agents, or publicists | 68 | 163 | 322 | 55 | 92 | 700 |
| Audiovisual production companies or studios | 163 | 144 | 142 | 42 | 64 | 555 |
| Publishers or publishing firms (e.g. books, newspapers) | 34 | 43 | 33 | 93 | 336 | 539 |
| Other | 47 | 76 | 102 | 132 | 108 | 465 |
| Artist-run centres | 34 | 48 | 114 | 226 | 36 | 458 |
| Creative hubs or cooperatives | 49 | 81 | 148 | 116 | 63 | 457 |
| Professional arts training institutions | 31 | 108 | 197 | 62 | 28 | 426 |
| Rights collectives | 24 | 125 | 29 | 18 | 71 | 267 |
| Music companies or record labels | 21 | 143 | 20 | 12 | 5 | 201 |
| Music publishers | 17 | 119 | 8 | 6 | 6 | 156 |
| Art dealers | 3 | 7 | 3 | 130 | 10 | 153 |
About 16% of respondents (777 respondents) claimed that they did not use any industry intermediaries, instead working completely independently. Of these independent respondents, a majority (60.6%) can be classified as low-participation creatives (those earning less than 25% of their income from creative work). Low-participation respondents may be in this position by choice or because they are still early in their careers; in general, it may be difficult for this group to justify the additional costs associated with industry intermediaries.
Additional financial support
When asked what areas of direct additional financial support they had accessed over the past five years, about 30% of respondents (1453 people) said they had accessed “none of the above” (Figure 7). The most prevalent single support was family income or support. But if all levels of government (federal, provincial, and municipal) are considered together, government grants rank as the most prevalent support, with about 44% of responses highlighting government grants as a source of financial support.

Figure 7: Direct additional financial support – text version
| Source of additional financial support | Number of responses |
|---|---|
| None of the above | 1453 |
| Additional family income or support | 1174 |
| Provincial government grants | 877 |
| Awards, grants, or fellowships from foundations etc. | 761 |
| Federal government grants | 718 |
| Educational or training institutions | 605 |
| Municipal government grants | 474 |
| Investment income | 462 |
| Artist residencies | 428 |
| Crowdfunding or online patronage | 390 |
| Mutual aid (others in the culture sector) | 264 |
| Loans from banks or private lenders | 222 |
| Philanthropy (single patron) | 194 |
| Sponsorships or partnerships with brands | 183 |
Areas of support sought
Finally, respondents were asked what areas of support they had benefitted from in the past and/or would like to benefit from in the future. Largely, respondents expressed a desire for support in building industry connections. This included networking opportunities, finding projects and/or gigs, and promotion and marketing (Figure 8).
The largest gaps between past and desired support included social service supports, tools for ensuring discoverability, and resources for applying for grants, fellowships, or other career development opportunities. The survey was conducted during the summer of 2021 in the midst of the pandemic—a context that highlighted the need for social service supports. In the final open-ended question, one respondent described receiving the CERB as the only time in their career when they had experienced some degree of financial stability. Over 100 respondents specifically mentioned a desire for some form of universal basic income (UBI).
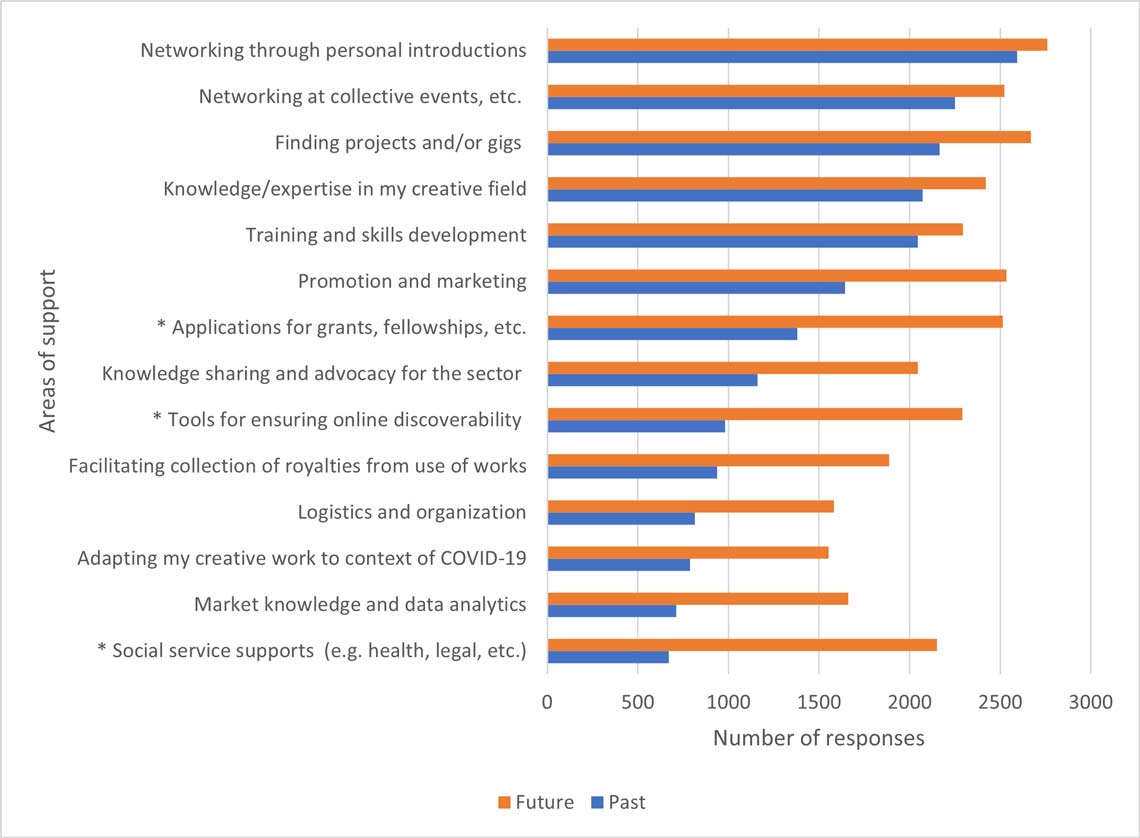
Figure 8: Areas of support, past and future – text version
| Area of support | Past | Future |
|---|---|---|
| Networking opportunities: personal introductions | 2594 | 2760 |
| Networking opportunities: collective initiatives, events, conferences, etc. | 2251 | 2523 |
| Finding projects and/or gigs | 2167 | 2669 |
| Knowledge/expertise in my creative field | 2072 | 2421 |
| Training and skills development | 2046 | 2294 |
| Promotion and marketing | 1645 | 2535 |
| Applications for grants, fellowships, or other career development opportunities | 1379 | 2514 |
| Knowledge sharing and advocacy for the sector | 1161 | 2046 |
| Tools for ensuring discoverability | 981 | 2293 |
| Facilitating payment or collection of royalties | 938 | 1887 |
| Logistics and organization | 814 | 1582 |
| Adapting my creative work to context of COVID-19 | 787 | 1554 |
| Market knowledge and data analytics | 712 | 1661 |
| Social service supports for artists and content creators (e.g. health, legal, taxes, caregiving arrangements, etc.) | 671 | 2152 |
Impact of COVID-19
Impact on income and time spent on creative work, overall
Overall, the survey suggests that the COVID-19 pandemic resulted in a loss of income from creative work for about two thirds (62.2%) of respondents. A smaller number of survey respondents reported an increase in arts-related income since the pandemic (15.7%), and about 22.1% of respondents reported no significant change (Figure 9).
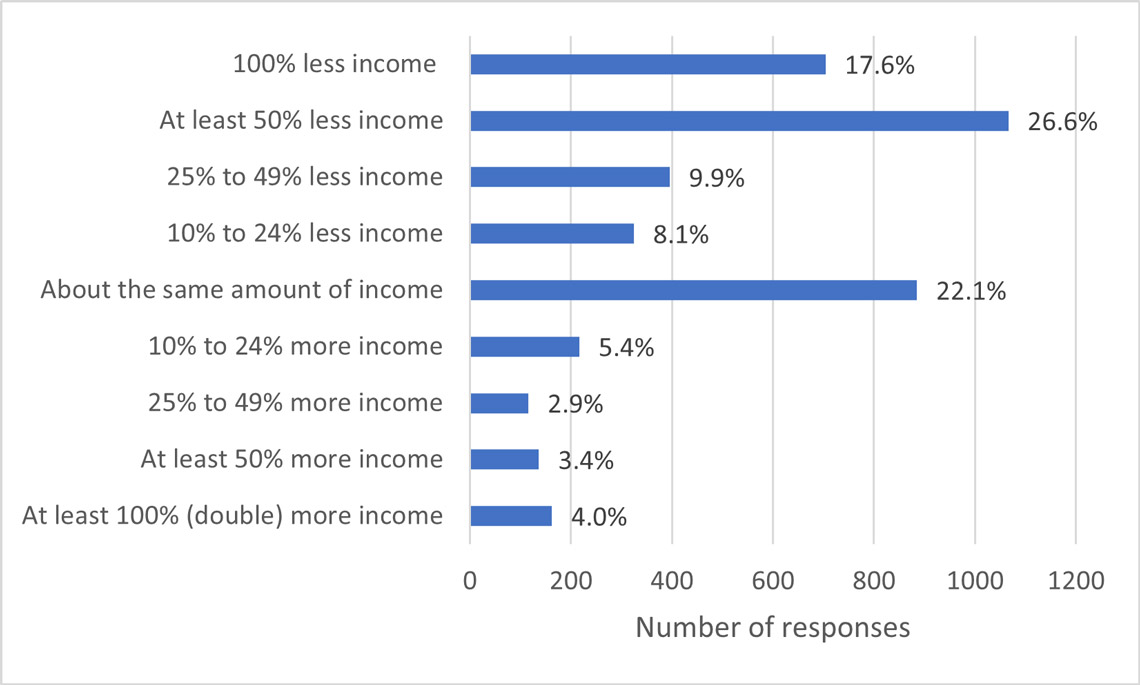
Figure 9: Impact of pandemic on creative income – text version
| Impact of pandemic on creative income | Number of responses | Percentage |
|---|---|---|
| 100% less income | 704 | 17.6% |
| At least 50% less income | 1066 | 26.6% |
| 25% to 49% less income | 395 | 9.9% |
| 10% to 24% less income | 324 | 8.1% |
| About the same amount of income | 885 | 22.1% |
| 10% to 24% more income | 216 | 5.4% |
| 25% to 49% more income | 115 | 2.9% |
| At least 50% more income | 136 | 3.4% |
| At least 100% (double) more income | 162 | 4.0% |
The pandemic’s effect on time spent on creative work is less straightforward. About 18.1% of respondents reported no change in time spent on creative work during the pandemic, but otherwise there was a roughly even split between those reporting less time (40.3%) and those reporting more time (41.6%) being spent on creative work (Figure 10).
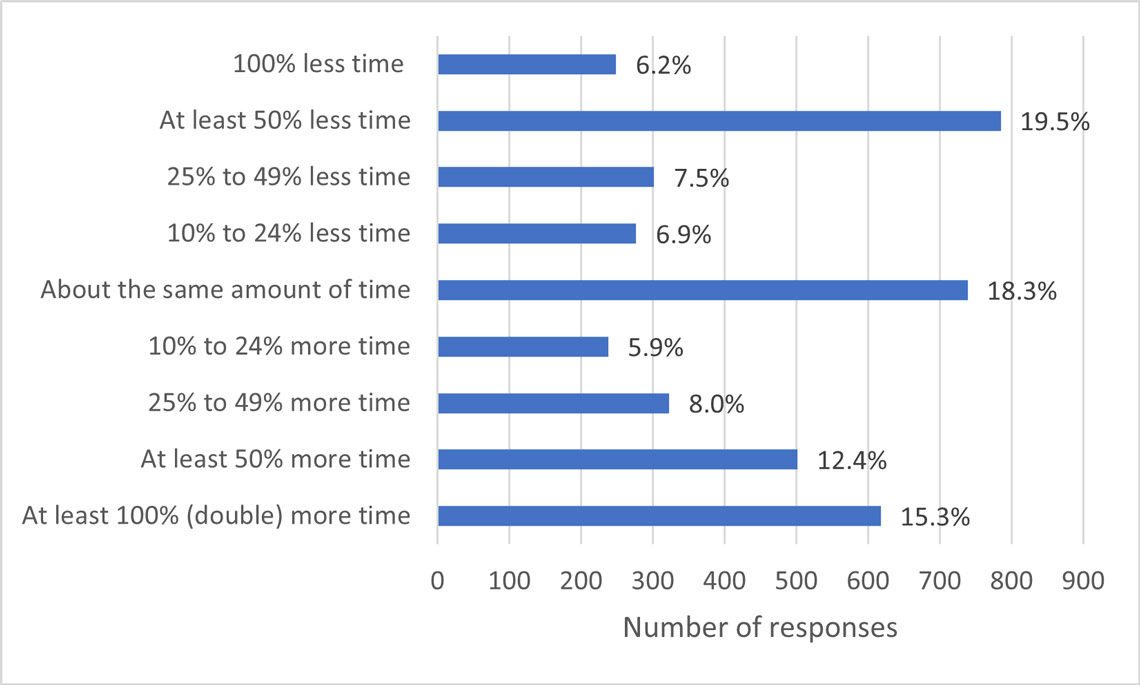
Figure 10: Impact of pandemic on time spent on creative work – text version
| Impact of pandemic on time spent on creative work | Number of responses | Percentage |
|---|---|---|
| 100% less time | 249 | 6.2% |
| At least 50% less time | 785 | 19.5% |
| 25% to 49% less time | 302 | 7.5% |
| 10% to 24% less time | 277 | 6.9% |
| About the same amount of time | 739 | 18.3% |
| 10% to 24% more time | 238 | 5.9% |
| 25% to 49% more time | 323 | 8.0% |
| At least 50% more time | 502 | 12.4% |
| At least 100% (double) more time | 618 | 15.3% |
Impact on income and time spent on creative work, by gender
When it comes to the impact of the pandemic on either income or time spent on creative work, differences across gender are small. Women, who tend to shoulder a disproportionate share of domestic work, were slightly less likely than men to report either a decrease in time spent on creative work or income from creative work (Table 4 and Table 5). About 67% of men reported a drop in income since the pandemic, compared with 60.7% of women and 55.3% of gender diverse / non-binary respondents. Gender diverse/ non-binary respondents appeared to fare better than either men or women under the pandemic, in terms of time spent on creative work and income generated from creative work (Table 4 and Table 5). It is difficult to draw conclusions from these results, since the survey also indicates that women and gender diverse / non-binary creative workers tend to earn lower incomes than men outside of the context of the pandemic.
| - | Gender diverse/non-binary | Men | Women |
|---|---|---|---|
| Less income since the pandemic | 55.3% | 67.0% | 60.7% |
| About the same income | 21.1% | 20.4% | 22.8% |
| More income since the pandemic | 23.6% | 12.6% | 16.5% |
| - | Gender diverse/non-binary | Men | Women |
|---|---|---|---|
| Less time since the pandemic | 37.2% | 41.5% | 39.9% |
| About the same amount of time | 13.6% | 19.5% | 17.7% |
| More time since the pandemic | 49.2% | 39.0% | 42.3% |
Impact on income and time spent on creative work, by creative field
More significant patterns are apparent across creative fields. Overall, 62.2% of respondents reported some loss of income from creative work during the pandemic. But two fields experienced significantly higher incidence of lost creative income: musical artists (83.1% of whom reported less income) and performing artists (78.6% of whom reported less income) (Table 6). This is likely linked to the fact that artists in both these fields rely heavily on live performances as a source of income. A similar pattern is evident in the amount of time spent on creative work since the pandemic (Table 7).
| - | AV director/content creator | Musical artist | Performing artist | Visual artist | Writer | Average all fields |
|---|---|---|---|---|---|---|
| Less income since the pandemic | 41.9% | 83.1% | 78.6% | 52.1% | 44.7% | 62.2% |
| About the same income | 31.6% | 10.8% | 10.7% | 26.5% | 37.8% | 22.1% |
| More income since the pandemic | 26.5% | 10.8% | 10.6% | 21.4% | 17.5% | 15.7% |
| - | AV director/content creator | Musical artist | Performing artist | Visual artist | Writer | Average all fields |
|---|---|---|---|---|---|---|
| Less time since the pandemic | 19.4% | 51.6% | 62.8% | 28.6% | 25.7% | 40.0% |
| About the same amount of time | 22.0% | 16.0% | 10.3% | 21.8% | 24.7% | 18.3% |
| More time since the pandemic | 58.6% | 32.4% | 26.9% | 49.6% | 49.6% | 41.7% |
Post-pandemic plans
Overall, the number of respondents who planned on quitting their creative work was low, around 3.2% (Table 8). This figure likely underestimates the rate of exit from the cultural industries overall as it would not capture those who had already left their field at the time of the survey in May 2021, over one year into Canada’s pandemic-related health measures. Creative workers who were contemplating leaving the industry at that time might also have been less inclined to complete the survey. Worth noting is the finding that musical artists were more likely than creative workers in other fields to be making plans for adapting their creative work in a post-pandemic context (16.2% of musicians planned on adapting, versus 11.3% of respondents across all fields).
| Response | AV director/content creator | Musical artist | Performing artist | Visual artist | Writer | All fields |
|---|---|---|---|---|---|---|
| I plan to carry on with my creative work | 65.1% | 60.9% | 56.1% | 65.3% | 72.3% | 63.3% |
| I plan to explore new creative expressions, media or genres in my creative occupation | 20.1% | 15.1% | 20.9% | 18.3% | 14.8% | 18.0% |
| I plan to adapt my creative work to be presented differently (e.g. digital distribution) | 9.2% | 16.2% | 11.6% | 11.0% | 7.8% | 11.3% |
| I plan to explore a different creative occupation | 3.1% | 4.3% | 6.5% | 3.0% | 3.2% | 4.2% |
| I plan to quit my creative work | 2.6% | 3.5% | 4.9% | 2.4% | 2.0% | 3.2% |
Despite the challenges of the COVID-19 pandemic, the vast majority (96.8%) of respondents planned to carry on their creative work in some form or another. Some of this can be attributed to the fact that most respondents do not rely on their creative work as their primary income source. Recall that pre-pandemic, 56.8% of respondents generated under half of their income from their creative work. During the pandemic, this figure jumped to 73% (Figure 5). The finding that most respondents plan on continuing their creative work could be read as celebration of artistic resilience but may also point to the fact that even under a “business as usual” scenario, creative work is not a reliable primary income source for most of the artists and content creators who responded to the survey.
Conclusions and next steps
As a pilot project, CACCES can be considered a success. With 4,747 valid responses, the response rate far exceeded the initial target of 1,000 responses. The survey managed to reach respondents outside the traditional scope of grants and contributions programs, including comedians, content creators, crafters, and low-participation creatives.
In general, the survey highlights several issues that creative workers, arts organizations, and other stakeholders have been grappling with for some time:
- Respondents’ incomes are low: 57% of respondents reported a total gross (pre-tax) income of under $40,000 in 2019, prior to the pandemic (this includes all income sources, including creative work and other sources).
- For survey respondents, income from creative work is volatile: 60% of respondents indicated that their creative income fluctuates by 50% to 100% year to year, without taking the pandemic into consideration.
- Many respondents had income sources aside from their creative practice: Only 41% of respondents reported working full-time in their creative occupation. This means that the majority—almost 60%—of respondents are not working full-time in their creative field. They may be working part-time in their creative field and holding down full- or part-time jobs in other fields.
- Respondents are highly entrepreneurial. A majority (64%) of respondents reported some form of self-employment.
- The survey indicated that economic outcomes vary widely for respondents working in different artistic fields. While most respondents (62%) reported some loss of creative income during the pandemic, this figure was much higher for musical artists (83%) and performing artists (79%).
These findings can be used to improve programs aimed at supporting the well-being and economic viability of Canada’s artists and content creators. Survey data is currently being used within Canadian Heritage to inform policy and program development. High-level results have been presented to external stakeholders to fill their own knowledge gaps, and this report broadens that data-sharing.
Appendix 1: Survey questions and results
To continue, please confirm: Are you 16 years of age or older? Yes / No
Question 1. From the list below, please indicate your primary field of work as an artist or content creator.
- Audiovisual director / content creator
- Musical artist
- I am a:
- Musician (vocalist / instrumentalist)
- Songwriter
- Other
- I am a:
- Performing artist
- Visual artist
- Writer
- None of the above, please specify:
Question 1. From the list below, please indicate your primary field of work as an artist or content creator – Aggregate data table
| Field | Total | Percent |
|---|---|---|
| Audiovisual director / content creator | 599 | 12.6% |
| Musical artist | 863 | 18.2% |
| Performing artist | 1169 | 24.6% |
| Visual artist | 1303 | 27.4% |
| Writer | 813 | 17.1% |
| Grand Total | 4747 | - |
Sub-Question 1. Type of musical artist – Aggregate data table
| Type of musical artist | Total |
|---|---|
| Musician (vocalist / instrumentalist) | 774 |
| Songwriter | 336 |
| Other | 176 |
Question 2. Do you self-identify as belonging to any of the following groups?
Please select all that apply:
- Women
- Gender diverse communities
- LGBTQ2S+ communities
- Indigenous Peoples
- To which Indigenous Peoples community do you belong?
- First Nations
- Métis
- Inuit
- To which Indigenous Peoples community do you belong?
- Racialized communities (e.g., South Asian, Chinese, Black)
- To which racialized community or communities (other than Indigenous) do you belong? Please select all that apply:
- South Asian
- Chinese
- Black
- Filipino
- Latin American
- Arab
- Southeast Asian
- West Asian
- Korean
- Japanese
- Other, please specify:
- To which racialized community or communities (other than Indigenous) do you belong? Please select all that apply:
- Ethno-cultural communities (e.g., Scottish, Jamaican, Moroccan)
- Immigrants and refugees
- Religious minorities
- Persons with disabilities
- Deaf communities
- Official language minority communities (i.e. Anglophones in Quebec and Francophones outside of Quebec)
- Youth
- Seniors
- Those with low income
- Rural communities
- Remote and Northern communities
- None of the above
- Prefer not to say
Question 2. Do you self-identify as belonging to any of the following groups? – Aggregate data table
| Group | Total | Percentage of all respondents |
|---|---|---|
| Women | 2629 | 55.4% |
| Gender diverse communities | 337 | 7.1% |
| LGBTQ2S+ communities | 1010 | 21.3% |
| Indigenous Peoples | 151 | 3.2% |
| Racialized communities | 608 | 12.8% |
| Ethno-cultural communities | 372 | 7.8% |
| Immigrants and refugees | 393 | 8.3% |
| Religious minorities | 177 | 3.7% |
| Deaf communities and persons with disabilities | 577 | 12.2% |
| Official language minority communities | 378 | 8.0% |
| Youth | 269 | 5.7% |
| Seniors | 555 | 11.7% |
| Those with low income | 1342 | 28.3% |
| Rural communities | 425 | 9.0% |
| Remote and Northern communities | 108 | 2.3% |
| None of the above | 593 | 12.5% |
| Prefer not to say | 0 | 0.0% |
Sub-Question 2. Based on how you have self-identified in all of the above, is your identity a central aspect of your artistic or creative work?
- Yes
- Please select all that apply:
- Yes, as an artist of traditional Indigenous art forms
- Yes, as a creator of Deaf and disability arts
- Yes, as an artist practicing within a distinct cultural tradition (e.g. from my ethno-cultural community)
- Yes, I conceive my work for a specific audience of people like myself or my community
- Yes, I strive to represent my community in my creative work to a general audience
- Yes (other)
- Please select all that apply:
- No
There is no data table for this question.
Question 3. Pre-pandemic, in 2019 what proportion of your personal income came from activities related to your creative work? (Sales, performance, wages, commissions, royalties, etc.)
- None
- Less than 25%
- 25% to 49%
- 50% to 74%
- 75% to 99%
- 100%
Question 3. Pre-pandemic, in 2019 what proportion of your personal income came from activities related to your creative work? (Sales, performance, wages, commissions, royalties, etc.) – Aggregate data table
| - | Audiovisual director / content creator | Musical artist | Performing artist | Visual artist | Writer | Total all fields | Percentage |
|---|---|---|---|---|---|---|---|
| None | 185 | 57 | 71 | 204 | 151 | 668 | 14.1% |
| Less than 25% | 119 | 245 | 241 | 494 | 348 | 1447 | 30.5% |
| 25% to 49% | 41 | 135 | 186 | 143 | 73 | 578 | 12.2% |
| 50% to 74% | 33 | 90 | 161 | 93 | 62 | 439 | 9.3% |
| 75% to 99% | 52 | 108 | 210 | 94 | 56 | 520 | 11.0% |
| 100% | 169 | 228 | 300 | 273 | 121 | 1091 | 23.0% |
| Total respondents (to the question) | 599 | 863 | 1169 | 1301 | 811 | 4743 | - |
Question 4. In what media, genre or space do you work?
Please select all that apply:
- Audiovisual director / content creator
- Film
- Television
- Video games
- Online or digital media productions
- Other (please specify):
- Musical artist
- Blues, soul, folk and roots
- Children’s music
- Classical
- Country
- Electronic and dance
- Hip-hop, R&B, rap and reggae
- Jazz
- Opera
- Pop
- Rock, metal, indie and alternative rock
- Traditional Indigenous music
- World music and world beat
- Other, please specify:
- Performing artist
- Actor
- In what media, genre or space do you work as an actor? Please select all that apply:
- Commercials
- Film
- Musical productions
- Other online or digital media productions
- Television
- Theatre
- Video games
- Voice artist
- Work for young audiences
- Other, please specify:
- In what media, genre or space do you work as an actor? Please select all that apply:
- Artistic director
- Choreographer
- Circus artist
- Comedian
- Dancer
- Host or “animateur”
- Mime
- Puppeteer
- Spoken word artist
- Storyteller
- Other, please specify:
- Actor
- Visual artist
- Crafts
- Concept art
- Design
- What type of designer are you? Please select all that apply:
- Architecture and urban
- Artistic product
- Exhibition
- Fashion
- Graphic
- Interior
- Jewellery
- Public art
- Other, please specify:
- What type of designer are you? Please select all that apply:
- Drawing and illustration – digital
- Drawing and illustration – print
- Installation art (indoor)
- Mural, public and street art (outdoor)
- Painting
- Photography – digital
- Photography – print
- Printmaking
- Sculpture
- Video game graphics
- Other, please specify:
- Writer
- Book author (published by a publishing firm)
- In what media, genre or space do you work as a book author? Please select all that apply:
- Fiction – print
- Fiction – e-books
- Non-fiction – print
- Non-fiction – e-books
- Poetry books/collections – print
- Poetry books/collections – e-books
- Theatrical plays – print
- Theatrical plays – e-books
- In what media, genre or space do you work as a book author? Please select all that apply:
- Book author (self-published)
- In what media, genre or space do you work as a book author? Please select all that apply:
- Fiction – print
- Fiction – e-books
- Non-fiction – print
- Non-fiction – e-books
- Poetry books/collections – print
- Poetry books/collections – e-books
- Theatrical plays – print
- Theatrical plays – e-books
- In what media, genre or space do you work as a book author? Please select all that apply:
- Book author (not published)
- In what media, genre or space do you work as a book author? Please select all that apply:
- Fiction – print
- Fiction – e-books
- Non-fiction – print
- Non-fiction – e-books
- Poetry books/collections – print
- Poetry books/collections – e-books
- Theatrical plays – print
- Theatrical plays – e-books
- In what media, genre or space do you work as a book author? Please select all that apply:
- Screenwriter
- In what media or genre do you work as a screenwriter? Please select all that apply:
- Film
- Television
- Video game
- Other online or digital media
- Other, please specify:
- In what media or genre do you work as a screenwriter? Please select all that apply:
- Other material
- In what media, genre or space do you work as a writer of other material? Please select all that apply:
- Blog posts
- Essays
- Magazine articles – print
- Magazine articles – online
- Newspaper articles
- Newspaper columns
- Poetry
- Short stories
- Technical writing
- Theatrical plays
- Other online or digital media
- Other, please specify:
- In what media, genre or space do you work as a writer of other material? Please select all that apply:
- Book author (published by a publishing firm)
Question 4. In what media, genre or space do you work? – Aggregate data tables
| Audiovisual directors | Total |
|---|---|
| Film | 233 |
| Television | 175 |
| Video games | 57 |
| Online or digital media productions | 366 |
| Other | 111 |
| Musical artists | Total |
|---|---|
| Blues, soul, folk and roots | 278 |
| Children’s music | 83 |
| Classical | 389 |
| Country | 99 |
| Electronic and dance | 83 |
| Hip-Hop, R&B, rap and reggae | 65 |
| Jazz | 218 |
| Opera | 150 |
| Pop | 239 |
| Rock, metal, indie and alternative rock | 229 |
| World music and world beat | 123 |
| Other | 180 |
| Performing artists | Total |
|---|---|
| Actor | 752 |
| Artistic director | 229 |
| Choreographer | 186 |
| Circus artist | 83 |
| Comedian | 171 |
| Dancer | 247 |
| Host or "animateur" | 107 |
| Mime | 11 |
| Puppeteer | 65 |
| Spoken word artist | 57 |
| Storyteller | 184 |
| Other | 399 |
| Actors | Total |
|---|---|
| Commercials | 349 |
| Film | 463 |
| Musical productions | 265 |
| Other online or digital media productions | 283 |
| Television | 444 |
| Theatre | 632 |
| Video games | 98 |
| Voice artist | 334 |
| Work for young audiences | 174 |
| Other | 49 |
| Visual artists | Total |
|---|---|
| Crafts | 292 |
| Concept art | 277 |
| Design | 348 |
| Drawing and illustration – digital | 444 |
| Drawing and illustration – print | 395 |
| Installation art (indoor) | 179 |
| Mural, public and street art (outdoor) | 109 |
| Painting | 561 |
| Photography – digital | 237 |
| Photography – print | 127 |
| Printmaking | 123 |
| Sculpture | 251 |
| Video game graphics | 69 |
| Other | 290 |
| Type of design work | Total |
|---|---|
| Architecture and urban | 23 |
| Artistic product | 136 |
| Exhibition | 46 |
| Fashion | 37 |
| Graphic | 225 |
| Interior | 25 |
| Jewellery | 28 |
| Public art | 41 |
| Other | 57 |
| Authors | Total |
|---|---|
| Book author – Published by a publishing firm | 330 |
| Book author – Self-published | 182 |
| Book author – Not published | 136 |
| Screenwriter | 183 |
| Other material | 310 |
| Book authors | Total |
|---|---|
| Fiction – print | 369 |
| Fiction – e-books | 238 |
| Non-fiction – print | 205 |
| Non-fiction – e-books | 115 |
| Poetry books/collections – print | 128 |
| Poetry books/collections – e-books | 63 |
| Theatrical plays – print | 48 |
| Theatrical plays – e-books | 21 |
| Screenwriters | Total |
|---|---|
| Film | 113 |
| Television | 136 |
| Video game | 7 |
| Other online or digital media | 52 |
| Other | 18 |
| Writers of other material | Total |
|---|---|
| Blog posts | 127 |
| Essays | 100 |
| Magazine articles – print | 99 |
| Magazine articles – online | 117 |
| Newspaper articles | 62 |
| Newspaper columns | 29 |
| Poetry | 94 |
| Short stories | 115 |
| Technical writing | 51 |
| Theatrical plays | 80 |
| Other online or digital media | 108 |
| Other | 65 |
Question 5. Pre-pandemic in 2019 (between January and December), were you working as a {Response to Question 1}?
- Yes
- No
Question 5. Pre-pandemic in 2019 (between January and December), were you working as a {Response to Question 1}? – Aggregate data table
| - | Audiovisual director / content creator | Musical artist | Performing artist | Visual artist | Writer | Total |
|---|---|---|---|---|---|---|
| Yes | 373 | 749 | 995 | 993 | 604 | 3 714 |
| No | 180 | 71 | 115 | 233 | 151 | 750 |
| Blank | 46 | 43 | 59 | 77 | 58 | 283 |
Question 6. How many hours per week did you spend on average on your creative work as a {Response to Question 1}? (Note: This excludes time spent on promoting or marketing)
- Hours per week:
- I do not know
Question 6. How many hours per week did you spend on average on your creative work as a {Response to Question 1}? (Note: This excludes time spent on promoting or marketing) – Aggregate data table
| Number of respondents | Audiovisual director / content creator | Musical artist | Performing artist | Visual artist | Writer | Total |
|---|---|---|---|---|---|---|
| Blank | 226 | 115 | 176 | 311 | 211 | 1039 |
| I do not know | 73 | 149 | 321 | 209 | 162 | 914 |
| Able to list hours per week | 300 | 599 | 672 | 783 | 440 | 2794 |
| Total | 599 | 863 | 1169 | 1303 | 813 | 4747 |
| Average hours per week (creative) | 30.55 | 25.25 | 26.72 | 26.82 | 23.31 | 26.31 |
Question 7. How many hours per week did you spend on average on your non-creative work as a {Response to Question 1}? (Note: This includes time spent on promoting or marketing)
- Hours per week:
- I do not know
Question 7. How many hours per week did you spend on average on your non-creative work as a {Response to Question 1}? (Note: This includes time spent on promoting or marketing) – Aggregate data table
| Number of respondents | Audiovisual director / content creator | Musical artist | Performing artist | Visual artist | Writer | Total |
|---|---|---|---|---|---|---|
| Blank | 227 | 115 | 177 | 313 | 211 | 1043 |
| I do not know | 109 | 222 | 368 | 339 | 213 | 1251 |
| Able to list hours per week | 263 | 526 | 624 | 651 | 389 | 2453 |
| Total | 599 | 863 | 1169 | 1303 | 813 | 4747 |
| Average hours per week (non-creative) | 17.51 | 14.88 | 17.68 | 14.48 | 13.00 | 15.47 |
Question 8. How long have you generated income from your work as a {Response to Question 1}
- I have never generated income from this work
- About 1 year
- Less than 5 years
- 5 to 9 years
- 10 to 19 years
- 20 to 29 years
- 30 years or more
Question 8. How long have you generated income from your work as a {Response to Question 1} – Aggregate data table
| - | Audiovisual director / content creator | Musical artist | Performing artist | Visual artist | Writer | Total | Percentage |
|---|---|---|---|---|---|---|---|
| I have never generated income from this work | 143 | 48 | 58 | 146 | 126 | 521 | 11.7% |
| About 1 year | 79 | 29 | 44 | 115 | 65 | 332 | 7.4% |
| Less than 5 years | 98 | 118 | 174 | 303 | 133 | 826 | 18.5% |
| 5 to 9 years | 61 | 113 | 197 | 221 | 129 | 721 | 16.2% |
| 10 to 19 years | 79 | 183 | 273 | 194 | 138 | 867 | 19.4% |
| 20 to 29 years | 58 | 127 | 168 | 101 | 81 | 535 | 12.0% |
| 30 years or more | 34 | 201 | 194 | 148 | 85 | 662 | 14.8% |
| Total respondents (to the question) | 552 | 819 | 1108 | 1228 | 757 | 4464 | - |
Question 9. In the 2016 Canadian Census, what did you identify as your occupation?
- Author/writer
- Producer, director, choreographer, or related occupations
- Musician/singer
- Conductor, composer, or arranger
- Painter, sculptor or other visual artist
- Artisan/craftsperson
- Photographer
- Graphic designer/illustrator
- Patternmaker
- Theatre, fashion, exhibit or other creative designer
- Industrial designer
- Interior designer
- Dancer
- Actor/comedian
- Teaching/education in a related field
- Other work in a related field
- Other or work in an unrelated field
- Not applicable
- I don’t know
Question 9. In the 2016 Canadian Census, what did you identify as your occupation? – Aggregate data table
| - | Audiovisual director / content creator | Musical artist | Performing artist | Visual artist | Writer | Total |
|---|---|---|---|---|---|---|
| Actor/comedian | 10 | 0 | 347 | 1 | 11 | 369 |
| Artisan/craftsperson | 2 | 0 | 2 | 55 | 0 | 59 |
| Author/writer | 6 | 4 | 10 | 4 | 239 | 263 |
| Conductor, composer, or arranger | 3 | 43 | 2 | 0 | 0 | 48 |
| Dancer | 2 | 0 | 64 | 1 | 0 | 67 |
| Graphic designer/ illustrator |
12 | 1 | 3 | 123 | 1 | 140 |
| I don’t know | 83 | 107 | 213 | 179 | 117 | 699 |
| Industrial designer | 0 | 0 | 1 | 1 | 0 | 2 |
| Interior designer | 2 | 0 | 1 | 3 | 0 | 6 |
| Musician/singer | 0 | 366 | 38 | 1 | 1 | 406 |
| Not applicable | 92 | 87 | 128 | 208 | 78 | 593 |
| Other or work in an unrelated field | 108 | 108 | 97 | 227 | 174 | 714 |
| Other work in a related field | 49 | 38 | 57 | 75 | 64 | 283 |
| Painter, sculptor or other visual artist | 6 | 0 | 0 | 225 | 2 | 233 |
| Photographer | 7 | 0 | 0 | 34 | 0 | 41 |
| Producer, director, choreographer, or related occupations | 132 | 9 | 90 | 4 | 14 | 249 |
| Teaching/education in a related field | 15 | 40 | 29 | 54 | 42 | 180 |
| Theatre, fashion, exhibit or other creative designer | 8 | 1 | 13 | 11 | 1 | 34 |
| Blank / no response | 62 | 59 | 74 | 97 | 69 | 361 |
| Total | 599 | 863 | 1169 | 1303 | 813 | 4747 |
Question 10. What was your employment status on December 31, 2019?
Please select all that apply:
- Employed
- Self-employed
- Student
- Stay-at-home parent or caregiver
- Retired
- Unemployed
- Prefer not to say
Question 10. What was your employment status on December 31, 2019? – Aggregate data table
| Employment status | Audiovisual director / content creator | Musical artist | Performing artist | Visual artist | Writer | Total |
|---|---|---|---|---|---|---|
| Prefer not to say | 6 | 7 | 7 | 23 | 14 | 57 |
| Stay-at-home parent or caregiver | 16 | 19 | 27 | 36 | 20 | 118 |
| Unemployed | 45 | 18 | 42 | 87 | 50 | 242 |
| Retired | 6 | 44 | 23 | 106 | 89 | 268 |
| Student | 70 | 62 | 80 | 127 | 42 | 381 |
| Employed | 249 | 340 | 431 | 499 | 289 | 1808 |
| Self-employed | 219 | 541 | 750 | 550 | 379 | 2439 |
Question 11. Please select the option(s) that best describe your employment status on December 31, 2019.
- Employed as a {Response to Question 1}: Full time / Part time / No
- Employed in a related field: Full time / Part time / No
- Employed in a different field: Full time / Part time / No
- Self-employed as a {Response to Question 1}: Full time / Part time / No
- Self-employed in a related field: Full time / Part time / No
- Self-employed in a different field: Full time / Part time / No
Question 11. Please select the option(s) that best describe your employment status on December 31, 2019. – Aggregate data table
| Employment status | Audiovisual director / content creator | Musical artist | Performing artist | Visual artist | Writer | Total | ||||
|---|---|---|---|---|---|---|---|---|---|---|
| Employed as a {Response to Question 1} | 890 | |||||||||
| Full time | 74 | 47 | 75 | 87 | 27 | 310 | ||||
| Part time | 53 | 153 | 177 | 121 | 76 | 580 | ||||
| Employed in a related field | 926 | |||||||||
| Full time | 68 | 100 | 104 | 126 | 83 | 481 | ||||
| Part time | 30 | 96 | 164 | 95 | 60 | 445 | ||||
| Employed in a different field | 751 | |||||||||
| Full time | 50 | 63 | 61 | 118 | 85 | 377 | ||||
| Part time | 28 | 72 | 110 | 111 | 53 | 374 | ||||
| Self-employed as a {Response to Question 1} | 2137 | |||||||||
| Full time | 123 | 238 | 344 | 268 | 147 | 1120 | ||||
| Part time | 70 | 244 | 315 | 217 | 171 | 1017 | ||||
| Self-employed in a related field | 878 | |||||||||
| Full time | 26 | 36 | 47 | 37 | 30 | 176 | ||||
| Part time | 66 | 163 | 257 | 108 | 108 | 702 | ||||
| Self-employed in a different field | 427 | |||||||||
| Full time | 9 | 18 | 17 | 20 | 17 | 81 | ||||
| Part time | 23 | 66 | 128 | 72 | 57 | 346 | ||||
Question 12. Please select the option that best describes how much your income levels from your work as a {Response to Question 1} typically change, year to year (without taking the pandemic into consideration):
- It can go up or down by at least 100% (double)
- It can go up or down by at least 50% (half)
- It can go up or down by at least 25% (quarter)
- It can go up or down by at least 10% (tenth)
- It stays about the same
Question 12. Please select the option that best describes how much your income levels from your work as a {Response to Question 1} typically change, year to year (without taking the pandemic into consideration) – Aggregate data table
| Income change | Audiovisual director / content creator | Musical artist | Performing artist | Visual artist | Writer | Total | Percentage |
|---|---|---|---|---|---|---|---|
| It can go up or down by at least 100% (double) | 99 | 150 | 274 | 287 | 234 | 1044 | 25.3% |
| It can go up or down by at least 50% (half) | 129 | 203 | 356 | 286 | 167 | 1141 | 27.6% |
| It can go up or down by at least 25% (quarter) | 74 | 206 | 230 | 208 | 101 | 819 | 19.8% |
| It can go up or down by at least 10% (tenth) | 40 | 103 | 78 | 113 | 40 | 374 | 9.1% |
| It stays about the same | 138 | 105 | 107 | 232 | 168 | 750 | 18.2% |
| Total respondents (to the question) | 480 | 767 | 1045 | 1126 | 710 | 4128 | - |
Question 13. What was your total gross (pre-tax) personal annual income in 2019?
- Under $9,999
- $10,000 to $19,999
- $20,000 to $39,999
- $40,000 to $59,999
- $60,000 to $79,999
- $80,000 to $99,999
- $100,000 to $124,999
- $125,000 to $149,999
- $150,000 to $199,999
- $200,000 and over
- Prefer not to say
Question 13. What was your total gross (pre-tax) personal annual income in 2019? – Aggregate data table
| Income range | Audiovisual director / content creator | Musical artist | Performing artist | Visual artist | Writer | Total | Percentage |
|---|---|---|---|---|---|---|---|
| Under $9,999 | 62 | 57 | 93 | 196 | 114 | 522 | 12.6% |
| $10,000 to $19,999 | 72 | 123 | 178 | 189 | 78 | 640 | 15.4% |
| $20,000 to $39,999 | 98 | 220 | 353 | 306 | 194 | 1171 | 28.3% |
| $40,000 to $59,999 | 72 | 134 | 182 | 186 | 112 | 686 | 16.6% |
| $60,000 to $79,999 | 63 | 69 | 100 | 75 | 85 | 392 | 9.5% |
| $80,000 to $99,999 | 33 | 50 | 35 | 36 | 38 | 192 | 4.6% |
| $100,000 to $124,999 | 18 | 27 | 25 | 30 | 13 | 113 | 2.7% |
| $125,000 to $149,000 | 10 | 9 | 10 | 6 | 18 | 53 | 1.3% |
| $150,000 to $199,999 | 8 | 9 | 3 | 6 | 3 | 29 | 0.7% |
| $200,000 and over | 6 | 7 | 10 | 3 | 7 | 33 | 0.8% |
| Prefer not to say | 44 | 62 | 57 | 98 | 53 | 314 | 7.6% |
| Total respondents (to the question) | 486 | 767 | 1046 | 1131 | 715 | 4145 | - |
Question 14. In the past 5 years, were any of the following sources of income for your work as a {Response to Question 1}?
Please select all that apply:
- Salaried or hourly paid job in this line of work
- Royalties and licensing for use of your work by others (including online streaming)
- Online paid download of your work
- Physical sale of works
- Sale of promotional/branded items or merchandise (online, in stores, or on site)
- Public display, exhibition, or in-person performance of work
- Direct commissioning of work
- None of the above
Question 14. In the past 5 years, were any of the following sources of income for your work as a {Response to Question 1}? – Aggregate data table
| Source of income | Audiovisual director / content creator | Musical artist | Performing artist | Visual artist | Writer | Total |
|---|---|---|---|---|---|---|
| Salaried or hourly paid job in this line of work | 202 | 310 | 561 | 336 | 171 | 1580 |
| Royalties and licensing for use of your work by others | 118 | 331 | 312 | 186 | 280 | 1227 |
| Online paid download of your work | 61 | 239 | 69 | 104 | 123 | 596 |
| Physical sale of works | 47 | 257 | 77 | 671 | 279 | 1331 |
| Sale of promotional/branded items or merchandise | 43 | 142 | 53 | 150 | 29 | 417 |
| Public display, exhibition, or in-person performance of work | 90 | 482 | 572 | 391 | 189 | 1724 |
| Direct commissioning of work | 149 | 185 | 237 | 601 | 190 | 1362 |
| None of the above | 140 | 67 | 112 | 118 | 156 | 593 |
Question 15. In the past 5 years, where have you sold your works, promotional/branded merchandise, or exhibits and performances?
Please select all that apply:
- North America
- Latin America
- Europe
- Africa
- Middle East
- Asia-Pacific
- I only sell within Canada
Question 15. In the past 5 years, where have you sold your works, promotional/branded merchandise, or exhibits and performances? – Aggregate data table
| Location | Audiovisual director / content creator | Musical artist | Performing artist | Visual artist | Writer | Total |
|---|---|---|---|---|---|---|
| North America | 102 | 380 | 325 | 488 | 273 | 1568 |
| Latin America | 23 | 52 | 31 | 29 | 29 | 164 |
| Europe | 58 | 206 | 122 | 175 | 147 | 708 |
| Africa | 3 | 14 | 10 | 6 | 12 | 45 |
| Middle East | 9 | 22 | 20 | 14 | 15 | 80 |
| Asia-Pacific | 29 | 66 | 49 | 53 | 53 | 250 |
| I only sell within Canada | 29 | 155 | 255 | 264 | 69 | 772 |
Question 16. In the past 5 years, which of the following sources provided direct additional financial support for your work as a {Response to Question 1}?
Please select all that apply:
- Federal government grants
- Provincial government grants
- Municipal government grants
- Educational or training institutions (e.g. college or university)
- Artist residencies
- Awards, grants, or fellowships from associations, foundations, or industry organizations
- Sponsorships or partnerships with brands (including on social media)
- Crowdfunding or online patronage
- Philanthropy (single patron)
- Mutual aid (others in the arts and culture sector)
- Additional family income or support (e.g. household income from spouse, parents, etc.)
- Investment income (e.g. includes inheritance, investments, real estate, etc.)
- Loans from banks or private lenders
- None of the above
Question 16. In the past 5 years, which of the following sources provided direct additional financial support for your work as a {Response to Question 1}? – Aggregate data table
| Source of additional financial support | Audiovisual director / content creator | Musical artist | Performing artist | Visual artist | Writer | Total | |
|---|---|---|---|---|---|---|---|
| Federal government grants | 106 | 164 | 228 | 104 | 116 | 718 | |
| Provincial government grants | 104 | 189 | 279 | 179 | 126 | 877 | |
| Municipal government grants | 37 | 111 | 197 | 77 | 52 | 474 | |
| Educational or training institutions | 50 | 140 | 194 | 128 | 93 | 605 | |
| Artist residencies | 21 | 69 | 154 | 105 | 79 | 428 | |
| Awards, grants, or fellowships from foundations etc. | 82 | 151 | 237 | 138 | 153 | 761 | |
| Sponsorships or partnerships with brands | 53 | 27 | 66 | 23 | 14 | 183 | |
| Crowdfunding or online patronage | 45 | 70 | 142 | 87 | 46 | 390 | |
| Philanthropy (single patron) | 22 | 63 | 56 | 37 | 16 | 194 | |
| Mutual aid (others in the arts and culture sector) | 28 | 56 | 112 | 44 | 24 | 264 | |
| Additional family income or support | 104 | 207 | 312 | 342 | 209 | 1174 | |
| Investment income | 38 | 81 | 129 | 111 | 103 | 462 | |
| Loans from banks or private lenders | 35 | 47 | 58 | 42 | 40 | 222 | |
| None of the above | 206 | 241 | 312 | 447 | 247 | 1453 | |
Question 17. What federal sources of support did you receive in the past 5 years?
Please select all that apply:
- Canada Council for the Arts
- National Film Board of Canada
- Telefilm Canada
- Canada Media Fund
- Canada Music Fund (FACTOR)
- Canada Music Fund (Musicaction)
- Creative Export Canada
- Other, please specify:
- None of the above
Question 17. What federal sources of support did you receive in the past 5 years? – Aggregate data table
| Federal source | Audiovisual director / content creator | Musical artist | Performing artist | Visual artist | Writer | Total |
|---|---|---|---|---|---|---|
| Canada Council for the Arts | 49 | 118 | 196 | 89 | 85 | 537 |
| National Film Board of Canada | 20 | 2 | 4 | 0 | 2 | 28 |
| Telefilm Canada | 32 | 1 | 5 | 1 | 15 | 54 |
| Canada Media Fund | 41 | 4 | 1 | 3 | 18 | 67 |
| Canada Music Fund (FACTOR) | 5 | 64 | 2 | 0 | 0 | 71 |
| Canada Music Fund (Musicaction) | 0 | 6 | 1 | 0 | 0 | 7 |
| Creative Export Canada | 4 | 2 | 1 | 0 | 1 | 8 |
| Other, please specify: | 20 | 25 | 31 | 14 | 16 | 106 |
| None of the above | 8 | 10 | 11 | 5 | 6 | 40 |
Question 18. Since the outbreak of COVID-19 in Canada (March 2020), how much time have you spent on your creative work compared to what was typical in 2019?
- At least 100% (double) more time
- At least 50% more time
- 25% to 49% more time
- 10% to 24% more time
- About the same amount of time
- 10% to 24% less time
- 25% to 49% less time
- At least 50% less time
- 100% less time (stopped all creative work since March 2020)
Question 18. Since the outbreak of COVID-19 in Canada (March 2020), how much time have you spent on your creative work compared to what was typical in 2019? – Aggregate data table
| - | Audiovisual director / content creator | Musical artist | Performing artist | Visual artist | Writer | Total all fields | Percentage |
|---|---|---|---|---|---|---|---|
| At least 100% (double) more time | 135 | 86 | 65 | 201 | 131 | 618 | 15.3% |
| At least 50% more time | 60 | 70 | 109 | 161 | 102 | 502 | 12.4% |
| 25% to 49% more time | 48 | 48 | 63 | 102 | 62 | 323 | 8.0% |
| 10% to 24% more time | 26 | 39 | 37 | 85 | 51 | 238 | 5.9% |
| About the same amount of time | 101 | 120 | 105 | 241 | 172 | 739 | 18.3% |
| 10% to 24% less time | 19 | 50 | 85 | 71 | 52 | 277 | 6.9% |
| 25% to 49% less time | 28 | 84 | 97 | 62 | 31 | 302 | 7.5% |
| At least 50% less time | 29 | 205 | 344 | 135 | 72 | 785 | 19.5% |
| 100% less time (stopped all creative work since March 2020) | 13 | 48 | 115 | 49 | 24 | 249 | 6.2% |
| Total respondents (to the question) | 459 | 750 | 1020 | 1107 | 697 | 4033 | - |
Question 19. Since the outbreak of COVID-19 in Canada (March 2020), how has your income from creative work differed, if at all, compared to what you experienced over the same period in 2019?
- At least 100% (double) more income
- At least 50% more income
- 25% to 49% more income
- 10% to 24% more income
- About the same amount of income
- 10% to 24% less income
- 25% to 49% less income
- At least 50% less income
- 100% less income (lost all income from creative work since March 2020)
Question 19. Since the outbreak of COVID-19 in Canada (March 2020), how has your income from creative work differed, if at all, compared to what you experienced over the same period in 2019? – Aggregate data table
| - | Audiovisual director / content creator | Musical artist | Performing artist | Visual artist | Writer | Total all fields | Percentage |
|---|---|---|---|---|---|---|---|
| At least 100% (double) more income | 47 | 11 | 23 | 53 | 28 | 162 | 4.0% |
| At least 50% more income | 21 | 10 | 28 | 48 | 29 | 136 | 3.4% |
| 25% to 49% more income | 23 | 8 | 23 | 40 | 21 | 115 | 2.9% |
| 10% to 24% more income | 30 | 16 | 34 | 93 | 43 | 216 | 5.4% |
| About the same amount of income | 144 | 81 | 109 | 290 | 261 | 885 | 22.1% |
| 10% to 24% less income | 35 | 72 | 63 | 95 | 59 | 324 | 8.1% |
| 25% to 49% less income | 36 | 94 | 101 | 106 | 58 | 395 | 9.9% |
| At least 50% less income | 64 | 281 | 376 | 213 | 132 | 1066 | 26.6% |
| 100% less income (lost all income from creative work since March 2020) | 56 | 174 | 258 | 156 | 60 | 704 | 17.6% |
| Total respondents (to the question) | 456 | 747 | 1015 | 1094 | 691 | 4003 | - |
Question 20. Since the outbreak of COVID-19 in Canada (March 2020), have you applied for any of the following emergency support?
Please select all that apply:
- Federal government support: Canada Emergency Response Benefit (CERB) or Canada Emergency Student Benefit (CESB)
- Federal government support: Employment Insurance (temporary COVID-19 relief)
- Federal government support: Canada Recovery Benefit (CRB), Canada Recovery Sickness Benefit (CRSB), Canada Recovery Caregiving Benefit (CRCB), others
- Provincial government support
- Municipal government support
- Other (e.g. support from industry, professional or arts organizations)
- None of the above
Question 20. Since the outbreak of COVID-19 in Canada (March 2020), have you applied for any of the following emergency support? – Aggregate data table
| - | Audiovisual director / content creator | Musical artist | Performing artist | Visual artist | Writer | Total all fields |
|---|---|---|---|---|---|---|
| Federal government support: Canada Emergency Response Benefit (CERB) or Canada Emergency Student Benefit (CESB) | 235 | 418 | 708 | 465 | 245 | 2071 |
| Federal government support: Employment Insurance (temporary COVID-19 relief) | 45 | 56 | 132 | 97 | 42 | 372 |
| Federal government support: Canada Recovery Benefit (CRB), Canada Recovery Sickness Benefit (CRSB), Canada Recovery Caregiving Benefit (CRCB), others | 83 | 180 | 304 | 145 | 66 | 778 |
| Provincial government support | 48 | 77 | 119 | 96 | 31 | 371 |
| Municipal government support | 10 | 19 | 28 | 10 | 2 | 69 |
| Other (e.g. support from industry, professional or arts organizations) | 31 | 86 | 82 | 34 | 37 | 270 |
| None of the above | 176 | 268 | 231 | 513 | 395 | 1583 |
Question 21. Which of the following statements best describes how the challenges brought on by the COVID-19 pandemic have affected your plans regarding your own creative work in the long-term (after the pandemic)?
- I plan to carry on with my creative work
- I plan to explore new creative expressions, media or genres in my creative occupation
- I plan to adapt my creative work to be presented differently (e.g. digital distribution)
- I plan to explore a different creative occupation
- What are the reasons for your plan to quit your creative work? (Select all that apply)
- Financial concerns about sustaining creative career
- Immediate financial needs
- Time constraints
- Creative constraints
- Lack of access to creative materials (e.g. equipment, space, tools)
- Lack of access to market (e.g. audience, buyers)
- Other (personal)
- What are the reasons for your plan to quit your creative work? (Select all that apply)
- I plan to quit my creative work
Question 21. Which of the following statements best describes how the challenges brought on by the COVID-19 pandemic have affected your plans regarding your own creative work in the long-term (after the pandemic)? – Aggregate data table
| - | Audiovisual director / content creator | Musical artist | Performing artist | Visual artist | Writer | Total all fields | Percentage |
|---|---|---|---|---|---|---|---|
| I plan to carry on with my creative work | 298 | 455 | 571 | 722 | 503 | 2549 | 63.3% |
| I plan to explore new creative expressions, media or genres in my creative occupation | 92 | 113 | 213 | 202 | 103 | 723 | 18.0% |
| I plan to adapt my creative work to be presented differently (e.g. digital distribution) | 42 | 121 | 118 | 121 | 54 | 456 | 11.3% |
| I plan to explore a different creative occupation | 14 | 32 | 66 | 33 | 22 | 167 | 4.2% |
| I plan to quit my creative work | 12 | 26 | 50 | 27 | 14 | 129 | 3.2% |
| Total respondents (to the question) | 458 | 747 | 1018 | 1105 | 696 | 4024 | - |
Sub-Question 21. What are the reasons for your plan to quit your creative work? – Aggregate data table
| Financial concerns about sustaining creative career | 96 |
|---|---|
| Immediate financial needs | 77 |
| Time constraints | 36 |
| Creative constraints | 35 |
| Lack of access to creative materials (e.g. equipment, space, tools) | 48 |
| Lack of access to market (e.g. audience, buyers) | 69 |
| Other (personal) | 39 |
Question 22. Now, during the pandemic, approximately what proportion of your personal income currently comes from activities related to your creative work? (Sales, performance, wages, commissions, royalties, etc.)
- None
- Less than 25%
- 25% to 49%
- 50% to 74%
- 75% to 99%
- 100%
Question 22. Now, during the pandemic, approximately what proportion of your personal income currently comes from activities related to your creative work? (Sales, performance, wages, commissions, royalties, etc.) – Aggregate data table
| - | Audiovisual director / content creator | Musical artist | Performing artist | Visual artist | Writer | Total all fields | Percentage |
|---|---|---|---|---|---|---|---|
| None | 129 | 197 | 246 | 292 | 190 | 1054 | 26.2% |
| Less than 25% | 109 | 312 | 404 | 388 | 312 | 1525 | 37.9% |
| 25% to 49% | 42 | 63 | 116 | 90 | 46 | 357 | 8.9% |
| 50% to 74% | 25 | 33 | 66 | 50 | 37 | 211 | 5.2% |
| 75% to 99% | 32 | 41 | 56 | 53 | 38 | 220 | 5.5% |
| 100% | 120 | 103 | 128 | 231 | 75 | 657 | 16.3% |
| Total respondents (to the question) | 457 | 749 | 1016 | 1104 | 698 | 4024 | - |
Question 23. What types of industry intermediaries do you currently work with to produce or disseminate your work?
Please select all that apply:
- Art dealers
- Artist run centers
- Arts presenters
- Audiovisual production companies or studios
- Creative hubs or cooperatives
- Festivals
- Independent managers, agents, or publicists
- Music companies or record labels
- Music publishers
- Online platforms and streaming services (e.g. open and closed catalogue websites)
- Professional arts training institutions
- Professional unions, guilds, or associations
- Publishers or publishing firms
- Rights collectives
- Venues (e.g. galleries, museums, theatres, concert halls, clubs)
- Other, please specify:
- None: I work completely independently
- Why not work with other industry professionals or organizations in your field, such as audiovisual production companies or studios / music companies or record labels / publishers or publishing firms? Please select all that apply:
- I used to, but I don’t anymore
- I can’t cover the costs
- I would like to work with industry, but not at this career stage
- I want to be in full control of my creative work
- I want to develop the necessary skills on my own
- I tried to, but did not meet the requirements
- I don’t need to
- I am ineligible (e.g., membership in one group excludes involvement in another)
- I have experienced instances of discrimination or harassment
- I am deterred by systemic barriers based on gender, sexual orientation, race, ethnic origin, age, or disability
- I wasn’t aware of them
- I don't know how to connect with these industry professionals
- Other, please specify:
- Does not apply (I’m a screenwriter)
- Why not work with other industry professionals or organizations in your field, such as audiovisual production companies or studios / music companies or record labels / publishers or publishing firms? Please select all that apply:
Question 23. What types of industry intermediaries do you currently work with to produce or disseminate your work? – Aggregate data table
| Intermediary | Audiovisual director / content creator | Musical artist | Performing artist | Visual artist | Writer | Total |
|---|---|---|---|---|---|---|
| Art dealers | 3 | 7 | 3 | 130 | 10 | 153 |
| Artist run centers | 34 | 48 | 114 | 226 | 36 | 458 |
| Arts presenters | 31 | 233 | 323 | 72 | 59 | 718 |
| Audiovisual production companies or studios | 163 | 144 | 142 | 42 | 64 | 555 |
| Creative hubs or cooperatives | 49 | 81 | 148 | 116 | 63 | 457 |
| Festivals | 130 | 276 | 399 | 175 | 139 | 1119 |
| Independent managers, agents, or publicists | 68 | 163 | 322 | 55 | 92 | 700 |
| Music companies or record labels | 21 | 143 | 20 | 12 | 5 | 201 |
| Music publishers | 17 | 119 | 8 | 6 | 6 | 156 |
| Online platforms and streaming services (e.g. open and closed catalogue websites) | 197 | 340 | 245 | 290 | 159 | 1231 |
| Professional arts training institutions | 31 | 108 | 197 | 62 | 28 | 426 |
| Professional unions, guilds, or associations | 62 | 176 | 338 | 84 | 134 | 794 |
| Publishers or publishing firms | 34 | 43 | 33 | 93 | 336 | 539 |
| Rights collectives | 24 | 125 | 29 | 18 | 71 | 267 |
| Venues (e.g. galleries, museums, theatres, concert halls, clubs) | 60 | 306 | 340 | 268 | 73 | 1047 |
| Other, please specify: | 47 | 76 | 102 | 132 | 108 | 465 |
| None: I work completely independently | 97 | 112 | 108 | 339 | 121 | 777 |
Sub-Question 23. Why not work with other industry professionals or organizations in your field? – Aggregate data table
| Reason | Audiovisual director / content creator | Musical artist | Writer | Total |
|---|---|---|---|---|
| I used to, but I don’t anymore | 17 | 63 | 36 | 116 |
| I can’t cover the costs | 73 | 163 | 55 | 291 |
| I would like to work with industry, but not at this career stage | 43 | 93 | 76 | 212 |
| I want to be in full control of my creative work | 85 | 144 | 64 | 293 |
| I want to develop the necessary skills on my own | 32 | 60 | 24 | 116 |
| I tried to, but did not meet the requirements | 31 | 72 | 62 | 165 |
| I don’t need to | 52 | 112 | 19 | 183 |
| I am ineligible (e.g., membership in one group excludes involvement in another) | 11 | 15 | 15 | 41 |
| I have experienced instances of discrimination or harassment | 25 | 37 | 24 | 86 |
| I am deterred by systemic barriers based on gender, sexual orientation, race, ethnic origin, age, or disability | 42 | 78 | 40 | 160 |
| I wasn’t aware of them | 36 | 25 | 25 | 86 |
| I don't know how to connect with these industry professionals | 85 | 179 | 114 | 378 |
| Other, please specify: | 41 | 125 | 64 | 230 |
Question 24. Besides the option(s) you selected previously (if any), why not work with other industry professionals or organizations in your field?
Please select all that apply:
- I used to, but I don’t anymore
- I can’t cover the costs
- I would like to work with industry, but not at this career stage
- I want to be in full control of my creative work
- I want to develop the necessary skills on my own
- I tried to, but did not meet the requirements
- I don’t need to
- I am ineligible (e.g., membership in one group excludes involvement in another)
- I have experienced instances of discrimination or harassment
- I am deterred by systemic barriers based on gender, sexual orientation, race, ethnic origin, age, or disability
- I don't know how to connect with these industry professionals
- Other, please specify:
There is no data table for this question.
Question 25. Please indicate in the checklist below the areas of support from industry professionals or organizations where you have benefitted in the past and/or would like to benefit in the future.
Please select all that apply:
- Networking opportunities: personal introductions
- Networking opportunities: collective initiatives, events, conferences, etc.
- Finding projects and/or gigs
- Promotion and marketing
- Applications for grants, fellowships, or other career development opportunities
- Logistics and organization
- Facilitating payment or collection of royalties from use of works
- Knowledge/expertise in my creative field
- Training and skills development
- Market knowledge and data analytics
- Adapting my creative work to context of COVID-19
- Tools for ensuring discoverability and exposure of my content online
- Knowledge sharing and advocacy for the sector
- Social service supports for artists and content creators (e.g. health, legal, taxes, caregiving arrangements, etc.)
- Other
Question 25. Please indicate in the checklist below the areas of support from industry professionals or organizations where you have benefitted in the past and/or would like to benefit in the future – Aggregate data table
| Area of support | Past | Future |
|---|---|---|
| Networking opportunities: personal introductions | 2594 | 2760 |
| Networking opportunities: collective initiatives, events, conferences, etc. | 2251 | 2523 |
| Finding projects and/or gigs | 2167 | 2669 |
| Promotion and marketing | 1645 | 2535 |
| Applications for grants, fellowships, or other career development opportunities | 1379 | 2514 |
| Logistics and organization | 814 | 1582 |
| Facilitating payment or collection of royalties from use of works | 938 | 1887 |
| Knowledge/expertise in my creative field | 2072 | 2421 |
| Training and skills development | 2046 | 2294 |
| Market knowledge and data analytics | 712 | 1661 |
| Adapting my creative work to context of COVID-19 | 787 | 1554 |
| Tools for ensuring discoverability and exposure of my content online | 981 | 2293 |
| Knowledge sharing and advocacy for the sector | 1161 | 2046 |
| Social service supports for artists and content creators (e.g. health, legal, taxes, caregiving arrangements, etc.) | 671 | 2152 |
Question 26. Principal place of residence:
- Postal code:
- Prefer not to answer
There is no data table for this question.
Question 27. Province / Territory:
- Alberta
- British Columbia
- Manitoba
- New Brunswick
- Newfoundland and Labrador
- Northwest Territories
- Nova Scotia
- Nunavut
- Ontario
- Prince Edward Island
- Quebec
- Saskatchewan
- Yukon
- I don’t live in Canada (principal residence abroad):
Question 27. Province / Territory – Aggregate data table
| Province | Audiovisual director / content creator | Musical artist | Performing artist | Visual artist | Writer | Total | Percentage |
|---|---|---|---|---|---|---|---|
| Alberta | 43 | 50 | 95 | 118 | 51 | 357 | 9.5% |
| British Columbia | 80 | 106 | 169 | 173 | 109 | 637 | 16.9% |
| Manitoba | 21 | 26 | 35 | 34 | 26 | 142 | 3.8% |
| New Brunswick | 10 | 8 | 11 | 48 | 20 | 97 | 2.6% |
| Newfoundland | 0 | 0 | 0 | 0 | 0 | 0 | 0.0% |
| Northwest Territories | 1 | 1 | 0 | 2 | 1 | 5 | 0.1% |
| Nova Scotia | 13 | 27 | 23 | 51 | 33 | 147 | 3.9% |
| Nunavut | 0 | 0 | 0 | 0 | 0 | 0 | 0.0% |
| Ontario | 192 | 394 | 501 | 438 | 262 | 1787 | 47.5% |
| Prince Edward Island | 3 | 2 | 3 | 16 | 6 | 30 | 0.8% |
| Quebec | 46 | 87 | 105 | 104 | 133 | 475 | 12.6% |
| Saskatchewan | 6 | 7 | 13 | 34 | 8 | 68 | 1.8% |
| Yukon | 2 | 2 | 1 | 8 | 6 | 19 | 0.5% |
| Total | 417 | 710 | 956 | 1026 | 655 | 3764 | - |
Question 28. Age
- Under 18 years old
- 18 to 24 years old
- 25 to 34 years old
- 35 to 44 years old
- 45 to 54 years old
- 55 to 64 years old
- 65 years old and over
Question 28. Age – Aggregate data table
| Age range | Audiovisual director / content creator | Musical artist | Performing artist | Visual artist | Writer | Total | Percentage |
|---|---|---|---|---|---|---|---|
| Under 18 years old | 5 | 3 | 3 | 7 | 1 | 19 | 0.5% |
| 18 to 24 years old | 69 | 39 | 74 | 89 | 28 | 299 | 7.8% |
| 25 to 34 years old | 117 | 181 | 290 | 283 | 99 | 970 | 25.2% |
| 35 to 44 years old | 104 | 172 | 238 | 211 | 152 | 877 | 22.8% |
| 45 to 54 years old | 63 | 124 | 154 | 164 | 124 | 629 | 16.4% |
| 55 to 64 years old | 48 | 131 | 140 | 163 | 140 | 622 | 16.2% |
| 65 years old and over | 21 | 76 | 71 | 136 | 123 | 427 | 11.1% |
| Total | 427 | 726 | 970 | 1053 | 667 | 3843 | - |
Question 29. Gender
- Woman
- Man
- Gender diverse / non-binary
Question 29. Gender – Aggregate data table
| Gender | Audiovisual director / content creator | Musical artist | Performing artist | Visual artist | Writer | Total | Percentage |
|---|---|---|---|---|---|---|---|
| Woman | 191 | 298 | 555 | 719 | 433 | 2196 | 57.1% |
| Man | 203 | 404 | 358 | 236 | 197 | 1398 | 36.4% |
| Gender diverse / non-binary | 32 | 23 | 59 | 98 | 38 | 250 | 6.5% |
| Total | 426 | 725 | 972 | 1053 | 668 | 3844 | - |
Question 30. Marital status
- Never married
- Married or living common law
- Separated, divorced, or widowed
Question 30. Marital status – Aggregate data table
| Status | Audiovisual director / content creator | Musical artist | Performing artist | Visual artist | Writer | Total | Percentage |
|---|---|---|---|---|---|---|---|
| Never married | 181 | 230 | 379 | 402 | 186 | 1378 | 36.0% |
| Married or living common law | 205 | 427 | 493 | 519 | 387 | 2031 | 53.0% |
| Separated, divorced, or widowed | 37 | 66 | 100 | 128 | 91 | 422 | 11.0% |
| Total | 423 | 723 | 972 | 1049 | 664 | 3831 | - |
Question 31. Dependents
- I have a child/children under the age of 18 years old
- I am responsible for the financial care of one or more adult relative(s)
- I do not have dependents
Question 31. Dependents – Aggregate data table
| Status | Audiovisual director / content creator | Musical artist | Performing artist | Visual artist | Writer | Total | Percentage |
|---|---|---|---|---|---|---|---|
| I have a child/children under the age of 18 years old | 108 | 127 | 172 | 172 | 134 | 713 | 18.7% |
| I am responsible for the financial care of one or more adult relative(s) | 36 | 52 | 60 | 88 | 69 | 305 | 8.0% |
| I do not have dependents | 281 | 542 | 723 | 788 | 467 | 2801 | 73.3% |
| Total | 425 | 721 | 955 | 1048 | 670 | 3819 | - |
Question 32. Language spoken most often at home
- English
- French
- Indigenous language (option to specify):
- Other (option to specify):
Question 32. Language spoken most often at home – Aggregate data table
| Language | Audiovisual director / content creator | Musical artist | Performing artist | Visual artist | Writer | Total | Percentage |
|---|---|---|---|---|---|---|---|
| English | 390 | 659 | 877 | 954 | 562 | 3442 | 81.4% |
| French | 53 | 81 | 132 | 127 | 119 | 512 | 12.1% |
| Indigenous language | 4 | 1 | 4 | 4 | 5 | 18 | 0.4% |
| Other | 41 | 43 | 61 | 69 | 45 | 259 | 6.1% |
| Total | 488 | 784 | 1074 | 1154 | 731 | 4231 | - |
Question 33. Highest level of education attained (completed)
- Did not complete high school
- High school degree or equivalent
- Some postsecondary education
- Postsecondary (CEGEP, college or other non-university) certificate or diploma
- Postsecondary (university) certificate, diploma, or degree
- Graduate degree (Master’s / PhD)
Question 33. Highest level of education attained (completed) – Aggregate data table
| Education level | Audiovisual director / content creator | Musical artist | Performing artist | Visual artist | Writer | Total | Percentage |
|---|---|---|---|---|---|---|---|
| Did not complete high school | 11 | 10 | 9 | 16 | 4 | 50 | 1.3% |
| High school degree or equivalent | 30 | 45 | 35 | 51 | 11 | 172 | 4.5% |
| Some postsecondary education | 53 | 93 | 106 | 122 | 47 | 421 | 11.0% |
| Postsecondary (CEGEP, college or other non-university) certificate or diploma | 87 | 75 | 211 | 225 | 86 | 684 | 17.8% |
| Postsecondary (university) certificate, diploma, or degree | 183 | 266 | 446 | 466 | 267 | 1628 | 42.4% |
| Graduate degree (Master’s / PhD) | 62 | 237 | 164 | 174 | 250 | 887 | 23.1% |
| Total | 426 | 726 | 971 | 1054 | 665 | 3842 | - |
Question 34. Is part of your education directly related to your work as a {Response to Question 1}?
- Yes
- No
Question 34. Is part of your education directly related to your work as a {Response to Question 1}? – Aggregate data table
| Response | Audiovisual director / content creator | Musical artist | Performing artist | Visual artist | Writer | Total | Percentage |
|---|---|---|---|---|---|---|---|
| Yes | 261 | 521 | 789 | 760 | 442 | 2773 | 72.3% |
| No | 162 | 206 | 181 | 292 | 223 | 1064 | 27.7% |
| Total | 423 | 727 | 970 | 1052 | 665 | 3837 | - |
Question 35. Do you live in...
- A major city or metropolitan area with a population of 100,000 people or more
- A city with a population between 10,000 and 99,999 people
- A town with a population between 1,000 and 9,999 people
- A rural area with a population less than 1,000 people
Question 35. Do you live in – Aggregate data table
| Settlement type | Audiovisual director / content creator | Musical artist | Performing artist | Visual artist | Writer | Total | Percentage |
|---|---|---|---|---|---|---|---|
| A rural area with a population less than 1,000 people | 20 | 36 | 29 | 111 | 41 | 237 | 6.2% |
| A town with a population between 1,000 and 9,999 people | 31 | 47 | 43 | 116 | 59 | 296 | 7.7% |
| A city with a population between 10,000 and 99,999 people | 67 | 70 | 110 | 184 | 94 | 525 | 13.7% |
| A major city or metropolitan area with a population of 100,000 people or more | 308 | 573 | 787 | 641 | 471 | 2780 | 72.4% |
| Total | 426 | 726 | 969 | 1052 | 665 | 3838 | - |
Question 36. Do you live on a First Nations reserve?
- Yes
- No
There is no data table for this question.
Question 37. What wasn’t asked in this survey that you feel is important for us to know about the circumstances of your economic viability as a Canadian artist or content creator? Please feel free to elaborate on themes from the survey. When providing comment, we request that you do not include identifying personal information about yourself or others.
There is no data table for this question.