
LED Lighting in Museums and Art Galleries – Technical Bulletin 36
Stefan Michalski, Canadian Conservation Institute
Jim Druzik (retired), Getty Conservation Institute
CCI Technical Bulletins
Technical Bulletins are published at intervals by the Canadian Conservation Institute (CCI) in Ottawa as a means of disseminating information on current techniques and principles of conservation of use to curators and conservators of Canada’s cultural objects as well as collection care professionals worldwide. The authors welcome comments.
Abstract
Light-emitting diode (LED) lamps are in the process of replacing the incandescent and fluorescent lamps that have been used by museums and art galleries for decades, but the transition is not simple. LED lamps vary widely in the quality of light they provide, and concerns have been raised about elevated rates of damage. The majority of LED lamps on the market do not produce light of adequate quality—they do not match the quality of quartz halogen lamps or museum grade fluorescent lamps. Some LED lamps can cause up to double the rate of fading of a UV-filtered quartz halogen lamp. Fortunately, there are LED lamps available that produce high-quality light, and more are becoming available. These LED lamps cause less damage, not more, than the best lamps of the past (and much less than daylight). This Bulletin provides a definition of “good” and “excellent” LED lamps, explains the definitions, reviews the evidence on damage by all forms of lighting, and provides a step-by-step guide to LED lamp selection for both small and large institutions.
Authors
Stefan Michalski is a Senior Conservation Scientist at CCI. He earned a B.Sc. (Hons) in Physics and Mathematics (1972), trained as an objects conservator in the Queen's University Master of Art Conservation program and then joined CCI in 1979. He has created many CCI tools to help preserve collections: the Relative Humidity Control Module (1981), the Light Damage Slide Rule (1988), the Framework for Preservation of Museum Collections poster (1994) and the online Light damage calculator (2012). He wrote the temperature and humidity specifications section for the first edition of the museums chapter of ASHRAE – Applications Handbook (1999), and he contributed to its update in 2019. He was an invited contributor to PAS 198:2012, Specification for managing environmental conditions for cultural collections and is the author of CCI’s web pages on climate and lighting. In partnership with ICCROM (International Centre for the Study of the Preservation and Restoration of Cultural Property) and the Cultural Heritage Agency of the Netherlands (RCE; formerly the Netherlands Institute for Cultural Heritage, or ICN), he helped develop an international course on risk and co-authored its manual, The ABC Method: a risk management approach to the preservation of cultural heritage (2016).
Jim Druzik holds a B.S. in Chemistry. He was a Senior Scientist at the Getty Conservation Institute between 1985 and 2016, where he led research on the effect of pollutants and of light on collections. He created a full-scale gallery to study viewers’ responses to lighting. He brought the needs of museum conservation to the LED programs of the U.S. Department of Energy (DOE) and worked closely with their scientists from 2008 until 2016. Prior to his retirement, he was instrumental in the creation of the Managing Collection Environments Initiative. Before joining the Getty, he was at the Los Angeles County Museum of Art for five years and at the Norton Simon Museum from 1974 to 1980. He served in a wide variety of advisory capacities for the National Archives and Records Administration, the Library of Congress and the Smithsonian Institution.
Disclaimer: The information provided here is based on the current understanding of the issues presented. The guidelines given in this Technical Bulletin will not necessarily provide complete protection in all situations or protection against all possible adverse effects that LED lamps can cause in a museum environment.
Table of contents
- List of abbreviations
- Introduction
- What are LED lamps?
- Do LEDs provide good-quality light?
- Summary advice on the quality of light from LED lamps
- The incomplete and bumpy spectrum of many LED lamps
- Colour rendering (CRI, CIE Ra, IES Rf)
- Duv as a criterion for lamp selection
- Duv as a criterion for unacceptable lamp aging
- R9, seeing red
- Correlation of CRI with R9 and Duv
- Quality (CRI) versus energy savings (efficacy)
- Violet versus blue LED lamps
- Colour temperature and lux levels
- Historically accurate lighting, artists’ intent, fluorescent paints and optical brighteners
- Viewer preference versus correct colour
- Do LEDs damage objects and artworks?
- Heat, glare, dimmers and flicker
- A step-by-step outline for purchasing lamps
- Technical details for larger projects
- Warranties
- Lamp forms in transition
- Return on investment
- Lamp labels and markings
- Summary recommendations
- Acknowledgements
- Technical sources of information
- Bibliography
- Endnote
List of abbreviations
- µW/lm/nm
- microwatt per lumen per nanometer
- ANSI
- American National Standards Institute
- CCR
- constant current reduction
- CCT
- correlated colour temperature (or colour temperature)
- CFL
- compact fluorescent lamp
- CIE
- International Commission on Illumination
- CRI
- colour rendering index
- DOE
- U.S. Department of Energy
- Duv
- “Delta u,v” is the deviation from ideal white light (on UV coordinates)
- Hz
- hertz
- IES
- Illuminating Engineering Society
- L70
- LED lifespan
- lm
- lumen
- lm/W
- lumen per watt
- MR
- multifaceted reflector
- NBS
- National Bureau of Standards
- NEMA
- National Electrical Manufacturers Association
- nm
- nanometre
- PAR
- parabolic aluminized reflector
- PWM
- pulse-width modulation
- Ra
- colour rendering average (CIE method)
- R9
- colour rendering of 9th colour sample, red (CIE method)
- RAGB
- red, amber, green, blue
- Rf
- colour rendering fidelity (IES method)
- RGB
- red, green, blue
- SSL
- solid-state lighting
Introduction
Lamps based on LEDs (pronounced el-ee-dees) are gradually replacing all previous lamps (tungsten, halogen, fluorescent, etc.). There is concern in the museum and conservation community about whether the light from LEDs is of good quality, whether it causes extra damage to artworks and whether lamp life is as good as claimed. Many of us have been disappointed with early LED lamps bought for the home, and early adopters in museums were disappointed by LED lamps that died long before predicted. As the strange bumps in LED lamp spectra became widely known, concern mounted.
LED lamp technology is improving very quickly. The selection of directional LED lamps (spots, floods) with good-quality light has increased in just the last five years from a handful to dozens and will eventually become the norm rather than the exception. In order to keep this text relevant for more than a few months, the emphasis is on the why and how of LED lamp selection, rather than on specific models.
The majority of LED lamps on the market in 2018 did not meet the criteria for good or excellent light, but there is a growing minority of such lamps that do meet these criteria and also offer the long life and energy savings that justify switching to LEDs. LED lamps that provide good or excellent light do not cause extra damage to objects. This Bulletin explains the phenomena that distinguish good LEDs from bad ones and provides a step-by-step process for the selection and purchase of good lamps by museum and conservation professionals.
What are LED lamps?
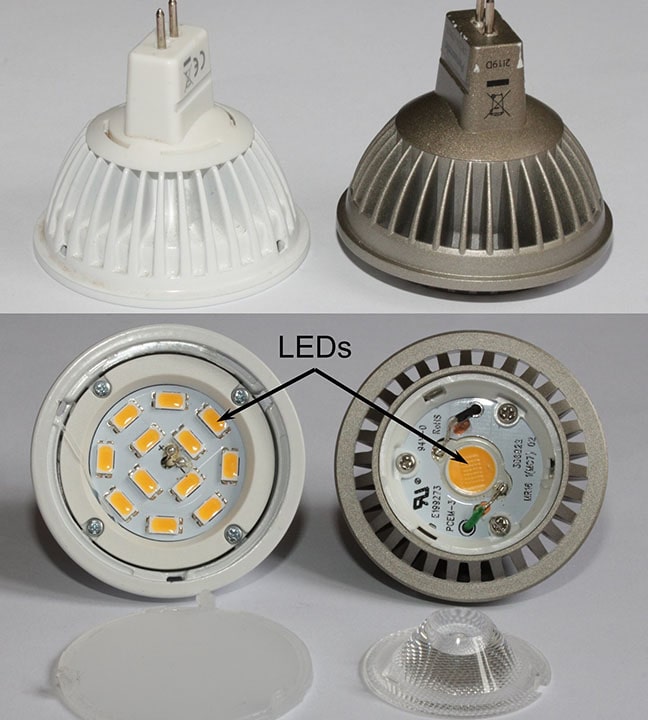
LED lamps are complex assemblies which comprise light-emitting diodes, phosphors, electronics and a housing. Some are designed to be part of a whole new installation of lamps and specially designed fixtures. Others are intended as replacements of older lamps, so the housing is designed to fit in the same fixtures as the older lamps (for example, a round bulb, a parabolic aluminized reflector [PAR] spot lamp, an MR16 [multifaceted reflector] low-voltage lamp or a fluorescent lamp). The most notable and unfamiliar feature of LED lamps is their elaborate cooling fins, as seen in Figure 1.
© Government of Canada, Canadian Conservation Institute. CCI 122894-0001
Figure 1. Top and front views of a pair of directional LED lamps (MR16, 12-V) with their plastic lenses disassembled. The small yellow patches are individual white LEDs; the phosphor layer has a yellow colour when the lamp is off.
LEDs produce coloured light
An LED can only produce strongly coloured light (a narrow band of wavelengths). Making white light with coloured LEDs requires some trickery. It is this fact that remains at the heart of all debates over the quality of LED lighting. The first LEDs were red, only capable of very low light levels and used as indicator lamps. The development of practical white lighting based on LEDs required more colours (green, then blue) as well as much higher light outputs—problems that were not solved until the 1990s.
Different ways to make white LEDs
Strictly speaking, there is no such thing as a “white” LED, but the term is used informally to mean a device that produces white light using LEDs. There are three methods of making white light from coloured LEDs:
- Phosphor-based: A single LED, either blue or violet, shines its light on a layer of phosphors which fluoresce in the green to red region. The LED is called the “pump” because it pumps energy into the phosphors. The principle is identical to that of fluorescent lamps, which use ultraviolet (UV) radiation from excited mercury vapour to pump the phosphors. The phosphor layer in an LED lamp is designed to allow some of the blue or violet light to escape, so that the final mix of light from the LED pump and the phosphors is white (that is, all the colours of the rainbow). Some manufacturers mix warm and cool white LEDs together to produce a neutral white colour. In Figure 1, the small yellow patches in each lamp are the phosphor layers on top of blue LEDs.
- Additive LEDs: These use no phosphors, but only a mix of red, green and blue (RGB) LEDs, which match more or less the three colour receptors of our eyes. This is the same RGB principle that is used in triphosphor fluorescent lamps. Some additive designs add an amber LED to become red, amber, green and blue (RAGB) designs.
- Hybrid: Some LED phosphor-based lamps with a blue pump add a red LED to compensate for weak red output from the phosphors.
The majority of white LED lamps on the market in 2018 were phosphor-based, and of those, most used a blue pump. Consult Do LEDs provide good-quality light? for more details on spectral issues of LEDs.
One LED lamp = one housing + one or more white LEDs + electronics
Each LED lamp (Figure 1) consists of a housing, one or more white LEDs and electronics to feed the correct electrical current to the LEDs. The housing plays an essential role in keeping the LED and the electronics cool, so it is made of metal for good heat conduction and is usually covered with fins to aid heat transfer to the air. The long lifetime of LED lamps depends on keeping both the electronics and the LEDs below a damaging temperature, typically 80°C.
There are only a few manufacturers of LEDs worldwide but many manufacturers of lamps based on LEDs. Whereas the manufacturer of the LED determines the quality of the light produced, the designer and manufacturer of the lamp determine almost all the other practical characteristics, such as lifetime (which depends on the operating temperature as well as the reliability of the electronics), the uniformity and distribution of the light beam, the efficiency of light usage and the control of glare.
As of 2018, most LED lamps consisted of several white LEDs, because the maximum output of each one is small, but this is changing. In Figure 1, both lamps produce similar light output, but the lamp on the left uses 12 individual LEDs, whereas the lamp on the right uses only 1. LED spot lamps in small forms such as an MR16 or PAR20 have only become possible with the advent of high-power LEDs, because the light source must be much smaller than the reflector or lens if one wants to produce a narrow and well-defined beam.
Lamp lifetime
LED lamps “die” in several different ways. Some die suddenly, within a few thousand hours, due to failure of the electronics or the LEDs. Others drift badly away from high-quality white light. (Consult Do LEDs provide good-quality light? for more information.) These are the unacceptable failures one wants covered by a warranty. The majority just fade away (the LEDs lose brightness), thus one must decide what amount of dimming is “the end” and cause for replacement. The convention for defining LED lifetime is 70% of original brightness, abbreviated as L70.
The lifespan (L70) of LED lamps is so much longer than all previous lamps (Table 1) that it changes the way one thinks of bulb replacement. Instead of the twice-a-year replacement needed for halogens, LED lamps will need changing just once a decade. Long lamp lifetime offers several advantages to museums, not just the reduction of labour but also the reduction of the risk to collections due to accidents during lamp changes.
| Lamp type | Average lifetime hours | Lifetime at 12 h per day, every day | Lamp failures per 100 lamps, assuming lamps fully mixed in age (ignoring premature failure) |
|---|---|---|---|
| TungstenTable 1 footnote 1 | 750 to 1500 | About 3 months | About 8 per week |
| Tungsten-halogenTable 1 footnote 1 | 2000 to 2500 | About 6 months | About 4 per week |
| Fluorescent, CFLTable 1 footnote 2 | 6000 to 12,000 | About 2 years | About 1 per week |
| White LEDsTable 1 footnote 3 | (L70) 20,000 to 50,000 | About 8 years | About 1 per month |
Table 1 Notes:
|
|||
Lumen output (brightness of LEDs)
Initially, white LEDs only came in low lumen (lm) ratings, often as low as 50 lm. For the museum situation of low-intensity lighting at close quarters (such as in display cases), this was a boon. For lighting at a distance from high ceilings, it was a problem. Those who considered LED lamps in 2011 faced problems finding ones with sufficient intensity, not to mention good-quality light. Today, most manufacturers provide reliable advice on which LED lamp to use when replacing a particular size of incandescent lamp. More sophisticated users can rely on the lumen and beam intensity data provided by manufacturers.
Why warranties matter
To make good LEDs, manufacturers must select phosphors with the right spectrum, arrange the phosphors and the blue (or violet) LEDs so that the correct portion of the LEDs is absorbed by the phosphors, manufacture them in large quantities that are identical and make sure the mix remains stable as the lamp ages. To make reliable lamps, the manufacturers must source reliable white LEDs, add a reliable driver (the electronics in the base of the lamp), then assemble everything inside an envelope that can keep the LEDs and electronics from overheating (hence the elaborate fins on most LED lamps). Each of these steps is imperfect, and the degree of imperfection varies between manufacturers. This complexity is much greater than that of traditional lamps, and the industry is still learning how to get it right, so warranties are important. To maintain a warranty, the user must install the lamp in a fitting and in a location that both allow proper cooling (that is, in a manner acceptable to the manufacturer).
Do LEDs provide good-quality light?
Yes, the best LED lamps do produce good-quality light, but they are in the minority. The majority produce mediocre light just above legislated minimums. This means, unfortunately, that museums and art galleries must take some care when choosing LED lamps. This is not a new issue for museums. Poor-quality light from LED lamps was preceded by poor-quality light from fluorescent lamps; but, as with fluorescent lamps, there are LED lamps that produce excellent-quality light. This section begins with the summary of our advice on selecting such lamps and then provides the technical details behind that advice.
Summary advice on the quality of light from LED lamps
We define two levels of light quality for museums and art galleries: good and excellent. We consider “good” as a minimum acceptable for viewing objects well in museums and art galleries, and we consider “excellent” as a reasonable aspiration.
First, a brief explanation of the technical parameters. For further details on each, consult the next sections.
- CRI (colour rendering index): measures how correctly a set of eight standard pastels appears under the lamp as compared to under an ideal white light source, where incandescent lamps are considered ideal for warm white sources and daylight is considered ideal for cool white sources. The maximum CRI score is 100. CRI is the most widely used measure of light quality in the industry and the easiest to obtain. Note that some product literature uses the term Ra rather than CRI. Ra and CRI are the same parameter. However, Ra and R9 are not the same parameter.
- R9: measures how correctly a deep red sample appears under the lamp as compared to under ideal white light. Although eight pastels are used to determine the overall CRI score, an additional set of saturated colour samples is also available. Of all the saturated colours used in the test, red (labelled R9) is the most difficult colour for most LED lamps and most fluorescent lamps to show well, even if their CRI score is high. The R9 score has become a practical indicator of the best LED lamps among those already scoring well on the average CRI.
- Duv: measures deviation of the light from ideal white, towards either a pink tone (negative number) or a green tone (positive number).
- CCT (correlated colour temperature of a light source, often shortened to colour temperature): refers to the temperature of a hot object that would emit the same kind of white light. It is measured in degrees Kelvin (K). An unfortunate confusion arises in terminology since “warm” light has a lower colour temperature and “cool” light has a higher colour temperature.
Here are our definitions of good-quality and excellent-quality light. (Energy Star is provided for reference.)
Excellent-quality light: CRI at least 90. R9 at least 90. Duv at purchase within a range between −0.003 and +0.003. Traditional incandescent lamps and halogen lamps meet these criteria.
Good-quality light: CRI at least 90. R9 at least 50. Duv at purchase within a range between −0.003 and +0.003. These CRI and R9 targets were also proposed in the 2012 draft of the Voluntary California Quality LED Lamp Specification (Flamm et al. 2012), but by the time of final ratification in 2016, this specification had dropped to a CRI of 82 and made no mention of R9 (Pasha et al. 2017). The CRI target of 90 has recently been proposed for a new Japanese standard on museum lighting (Yoshizawa et al. 2017).
We have discovered that with current technology, LED lamps with a CRI of 90+ will have a Duv that falls within specification. So a Duv specification becomes an unnecessary complication for most users and has been dropped in our advice in Summary recommendations. The Duv specification remains of value as a failure criterion during lamp aging.
Energy Star 2017: CRI at least 80. R9 over 0. Duv at purchase within a range between −0.006 and +0.006. Duv change over time not to increase or decrease by more than 0.007; Duv uniformity across beam not to exceed −0.006 or +0.006 (DOE 2017). This is the most widely used standard for general-purpose LED lamps in Canada and the U.S. In terms of CRI, R9 and Duv at time of purchase, we do not consider this specification to be adequate for museum and art gallery lighting, but its criteria for lamp stability over time are useful as a minimum acceptable performance under warranty. For museum and art gallery areas not displaying objects, where energy savings may be the priority, lamps below the good category but with Energy Star designation might be acceptable.
Colour temperature is a matter of preference, not quality. Our only recommendation is that one use the same colour temperature for all lamps within a given space. The longstanding belief that at museum lux levels of 50 lux to 200 lux, viewers always prefer warm light (2800 K to 3000 K) has been shown to be false. Colour temperatures as high as 5000 K may be preferred in some situations. Manufacturers have not responded fully to this new information, and the colour temperature of quartz halogen lamps (3000 K) is still the target of many manufacturers producing good and excellent LED lamps for the museum market. For those who do not wish to experiment with colour temperature, 3000 K is still a pleasant all-purpose choice for museum lighting. This issue is discussed further in the section Colour temperature and lux levels.
The incomplete and bumpy spectrum of many LED lamps
The undeniable elegance of incandescent lamps, both traditional and halogen, rests not only on their simplicity but also on the fact that they produce light in the same way as the sun’s surface, by making something hot enough to glow “white hot.” Unfortunately, incandescent lamps convert only a small fraction of the electricity supplied into light; the rest is lost as heat and infrared radiation. In addition, the life of the filament is short, hence the search for more efficacious and longer-lived lamps, such as fluorescents and LEDs. But efficacious lamps too often distorted colours, so they acquired a bad reputation.
© Government of Canada, Canadian Conservation Institute. CCI 122894-0003
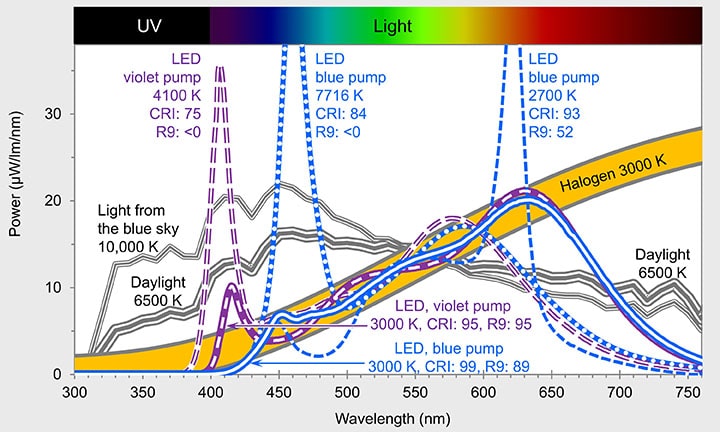
Figure 2. UV and light spectra of five white LED lamps of different quality, compared to the benchmarks of daylight (triple grey lines) and of a halogen lamp (wide orange line).
Description of Figure 2
Figure 2 contains a single graph, which shows the spectra of nine light sources. The x axis is wavelength, from ultraviolet at 300 nanometers to visible light up to 760 nanometers. The y axis is power, microwatts per lumen per nanometer. The spectrum of a quartz halogen lamp is shown as a broad orange line. Two of the spectra are for daylight and light from the blue sky. The remaining five spectra are for LED lamps, three of which have very large spikes that reach or exceed the top of the graph.
Figure 2 plots spectra of five LED lamps of various quality. The “LED, violet pump, 3000 K, CRI: 95, R9: 95” is an excellent lamp, with a small peak at 415 nm due to its violet pump. The “LED, blue pump, 3000 K, CRI: 99, R9: 89” is a good, almost excellent, lamp, with almost no bump due to its blue pump at 450 nm. There are three LED lamps with obvious spikes. Two have very poor R9, less than zero, one with a big violet spike, the other with a big blue spike—both are completely lacking in red output. The lamp “LED, blue pump, 2700 K, CRI: 93, R9: 52” (thin blue dashed line) just passes as a good source with the use of a red LED to boost the anemic phosphor output. It is included as an example for later calculations of possible damage from large red spikes in the spectra of LED lamps.
Spectra of the benchmark sources are provided for comparison: daylight (triple grey lines) and halogen 3000 K (wide orange line). The daylight spectra are published standards, representing outdoor light unfiltered by window glass. The halogen represents an ideal halogen lamp with no glass cover, calculated from tungsten at 3000 K. Actual halogen lamp spectra are slightly reduced in the UV and far red, depending on the thickness and tint of the glass envelope. The LED spectra are measurements of actual lamps or modules sold to luminaire makers. These spectra and more are used to calculate damage in Do LEDs damage objects and artworks?
The complex and still unsettled science of metrics for “good” white light can be broken into two parts: (1) what are the benchmark sources of light and (2) what are the essential characteristics of those benchmark spectra that imperfect sources must match?
- For the first part, one reasonably assumes that daylight is the benchmark, and since daylight varies (triple grey lines in Figure 2), the key must be whatever is invariable in those two spectra. One need only inspect them to note that aside from some minor ripples, they are both complete and smooth.
Our visual system evolved to see things as having constant colour despite changes in light due to time of day or the shade, but simultaneously to know that the light has indeed changed, not from correct to incorrect, but from cool to warm, bright to dim and back again. The only characteristic of these benchmark spectra that does change is their slope, measured in terms of the temperature of a glowing object that creates a spectrum with the same slope, hence “correlated colour temperature.” Incandescent lamps (such as the much-loved halogen lamp at 3000 K, the wide orange line in Figure 2) have also been defined as benchmark sources, an extension of the family of smooth and complete daylight spectra, albeit with a colour temperature that daylight reaches only near sunrise and sunset. - The simplest answer to the very difficult question about essential characteristics of good-quality light is that it must only replicate the benchmarks (be complete and smooth and within the range of colour temperatures that our eye still sees as white, which begins to diminish below 2700 K). One notes in Figure 2 that the best LED lamps in terms of CRI and R9 do come close to replicating the 3000 K benchmark (wide orange line). They are relatively smooth, but not quite complete at each end of the spectrum.
The day someone invents a lamp that is not hot to the touch (high efficacy) but which replicates the benchmark spectra in the visible band and has a competitive price, advice such as this will be unnecessary. Until then, the question remains: what is good enough and how can it be measured with just one or two numbers for consumers?
Colour rendering (CRI, CIE Ra, IES Rf)
The primary measure for the quality of light from a lamp is called colour rendering. To determine colour rendering, colourimetric calculations are made for a set of coloured samples illuminated by the lamp and illuminated by a reference source such as daylight. If there is no difference in the results from the lamp and that from the reference, then the lamp “renders” that sample well and scores 100. Points are lost depending on the size of the colour difference between the lamp and the reference. The final score is an average of the scores across all samples in the set.
Since 1974, the industry standard for calculating colour rendering has been the method developed by the International Commission on Illumination (CIE). This method uses fourteen colour samples. Eight are pastels. Their average colour rendering (Ra) by a light source defines the colour rendering index (CRI) of that light source. The six other colour samples are saturated colours and are used for individual colour rendering calculations. The most important of these is a saturated red, called R9. The CIE method for calculation of CRI remains the worldwide convention for lamp specifications. The CRI score is sometimes on the lamp carton and always available online from the distributor or manufacturer.
In the past, for fluorescent lamps, CCI recommended a minimum CRI of 85 and stated that a CRI of 90 or above was preferable. Acceptance of a CRI below 100 (below what benchmark lighting provides) has always been a compromise between the technology of the time and energy savings, mediated by the imprecise business of what discrepancies are perceptible in what situations with what colours and by whom. Given current LED technology, and the growing availability of very high-quality LED lamps, we have shifted to recommending a CRI of 90 and above.
In 2015, a new method for characterizing colour rendering, known as TM-30-15 (Royer and Houser 2015), was adopted by the Illuminating Engineering Society (IES). The method follows the same approach as the CIE above but uses a much wider selection of samples (99) and more modern colourimetric equations, in addition to other improvements. The score equivalent to the CIE Ra is called “rendering fidelity,” or Rf, and as with Ra, establishes 100 as the score for perfect rendering. The IES method also proposes a second parameter derived from the calculations on the 99 samples called “gamut.” Since the IES method promotes two parameters, not just one, the notion of a single CRI has been dropped, but for museum purposes of high-quality light, we focus on fidelity. For lamps with fidelity approaching Rf = 100, gamut does not vary anyway, so it tells us nothing extra. Gamut does become variable, and of interest to the designer, when fidelity falls substantially below 90. From a positive perspective, it allows one to select lamps of a particular gamut to intensify particular ranges of colour in particular situations, which viewers may prefer (Royer and Houser 2015). From a negative perspective, gamut simply calibrates the colour distortions that become feasible when fidelity is mediocre.
Expectations in the industry, especially in the western hemisphere, are that the IES method will supplant the CIE method in the coming years; however, CIE has stated: “Rf, is…not a replacement of the general colour rendering index, Ra, neither for the purpose of rating and specification of products nor for regulatory or other minimum performance requirements. Replacement of the CRI will be a matter of future study and discussion.” (CIE 2017)
Fortunately, for our purposes, such discussion becomes contentious only for lamps that are far from perfect. It will not change our definitions of good and excellent significantly since CRI and Rf scores converge as they approach 100. Conservatively, we can simply replace CRI by Rf in our definitions of good-quality and excellent-quality lamps. Preliminary studies (Royer and Houser 2015) show that LED lamps that score CRI over 90 tend to score an Rf of 3 to 5 points lower. As expected, Rf is a tougher measure than CRI. Its purpose, in fact, was to reduce the ability of LED manufacturers to design lamps that could do well on the eight colours for CRI but little else. A second CIE measure called “R9” is our current tool to confirm that a high CRI really does mean good rendering for museums and art galleries (consult R9, seeing red).
Duv as a criterion for lamp selection
Duv is a measure of the deviation of a light source from white light, with zero as perfectly white. (Download LED Color Characteristics [PDF format] for further information.) Whereas a difference in the overall slope of a spectrum (that is, a difference of colour temperature) only changes our perception of whether the light is warm white or cool white, waves and missing bits in the spectrum can make the light look slightly green (positive Duv) or slightly pink (negative Duv). If you have ever seen a long office or hallway with a mixed set of mediocre and aging fluorescent lamps, you have seen this range of green and pink tones. While this was never an issue with incandescent lamps, it became one with fluorescent lamps and is now one with LED lamps.
More important than how the lamp looks, a Duv number far from zero means that the colours being illuminated are not seen correctly. Although recent research suggests users may actually prefer a slightly pink output (Duv of −0.003) for LED lamps below 3200 K, our concern here is conservative—simply to specify a maximum deviation (between −0.003 and +0.003) from what is considered the ideal white.
© Government of Canada, Canadian Conservation Institute. CCI 122894-0005
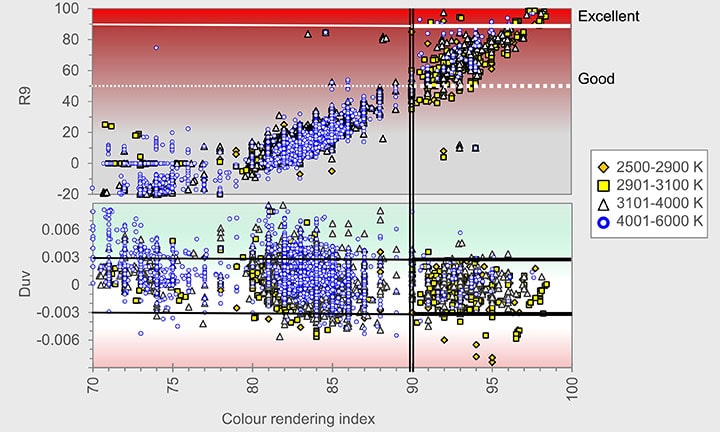
Figure 3. The dependence of R9 and Duv on the CRI of 8818 LED lamps and luminaires meant for indoor use. Data from the LED Lighting FactsEndnote 1 database of June 2018.
Description of Figure 3
Figure 3 contains two graphs, one above the other, sharing the same x axis, which is the CRI. Both graphs contain a single large cloud of many data points representing LED lamps. The data points are identified as one of four ranges of colour temperature. In the upper graph, the y axis is R9. The cloud of data extends from the bottom left corner to the upper right corner and is relatively narrow. In the lower graph, the y axis is Duv, and the data cloud is horizontal, covering most of the graph.
The LED Lighting Facts database (consult endnote 1) collects voluntary information from manufacturers on their products. Figure 3 shows the data from June 2018 for lamps and luminaires meant for indoor use, that have a CRI above 70, that were tested for Duv and for R9 and that have a CCT between 2500 K and 6000 K (8818 LEDs). In the bottom graph of Figure 3, the band of acceptable Duv (between −0.003 and +0.003) is defined by the two black horizontal lines. For CRI greater than 90 (to the right of the vertical double line), there are 872 LEDs, of which 97% fall within this acceptable Duv band. We can conclude, therefore, that with current LED technology, any lamps with CRI above 90 will have a 97% chance of having an acceptable Duv. The few terrible Duv scores, lower than −0.006, only occur in the CCT range of 2500 K to 2900 K, so it is best to avoid this overly warm range of CCT.
The great majority of LED lamps with CCT above 4000 K (blue circles) cluster in the CRI range of 80 to 85. They are designed to just meet the Energy Star standard (CRI = 80), and their Duv range expands from the −0.003 and +0.003 that museums need to the ANSI tolerance of −0.006 and +0.006.
Duv as a criterion for unacceptable lamp aging
The primary purpose of specifying Duv in a museum or art gallery lighting program that wants good or excellent lighting is establishing what is unacceptable aging. Stability is a very important quality for a lamp that is expected to function for the next decade or two, especially a lamp that just fades away rather than dying in the sudden and unambiguous way of incandescent lamps.
A small but significant fraction of LED lamps tested over time have shown a rapid drift of Duv to unacceptable values within 10% of the supposed lifetime of the lamp. Of course, CRI will have probably become unacceptable as well, but a poor Duv is much easier to see than a poor CRI, especially when the lamp is adjacent to lamps with good Duv. With reputable suppliers of reputable lamps, if some lamps fail visibly, one does not expect to need an expert with the tools to confirm the unacceptable Duv. Lamps that claim an Energy Star specification must conform to the following: after 6000 hours of operation, the Duv of 9 out of 10 samples of the lamp will have increased or decreased by less than 0.007.
R9, seeing red
A third measure for quality of light from a lamp is CIE R9, usually stated simply as R9. It is the colour rendering score (hence the “R”) of the ninth colour card in the series of fourteen used in the CIE method for colour rendering measurements. Number 9, a saturated red, has been singled out as an acid test of LED lamps because
- red is the most difficult colour for LED lamps to render well, and
- red is important not only for seeing reddish things well, but also for seeing our own skin well.
Many collections from numerous cultures require that red and brown tones be seen well (for example, artwork with the human figure, textiles, military collections, industrial collections and natural history collections). The same points were made in the staff report for the initial Voluntary California Quality LED Lamp Specification: “…high R9 value indicates improved rendition of important common materials (skin tones, earth tones, woods and vibrant red colors)…. Also…manufacturers wish to distinguish ‘good’ LEDs from ‘bad’ LEDs, and from typical triphosphor T8 lamps, which do not render the R9 color well.” (Flamm et al. 2012)
We consider the minimum acceptable R9 for museums to be at least 50 (good) and recommend that museums and art galleries strive for an R9 of at least 90 (excellent), especially if reds are important to the collections. In technical specifications, R9 is not stated as often as CRI, but manufacturers who go to the effort of making a lamp with high R9 will always make the R9 score a feature of their advertising. Conversely, if they hide it, there may be a reason. R9 values can be found in the LED Lighting Facts database (consult endnote 1) for many, though not all, lamps. Consult the Acknowledgements and Bibliography sections.
In Figure 3, the relationship between CRI and R9 is plotted for all the indoor LED lamps for which R9 measures were available in the LED Lighting Facts database (consult endnote 1). The general trend is clear: CRI and R9 get better together (top right corner) and get worse together (bottom left corner), but excellent CRI (to the right of the double black line) does not guarantee a good R9 (above the dotted white line), let alone an excellent R9 (above the solid white line). However, one can successfully turn the logic around: a good R9 score (above the dotted white line) almost always gives a CRI above 90, and an excellent R9 score (above the solid white line) guarantees that CRI is well above 90. And if CRI is above 90, then Duv is within our recommended values.
Thus, for a very simplified recommendation regarding museum-quality LED lamps, one can drop the reference to CRI and Duv and state the following: choose lamps with an R9 of at least 50 for good lighting and at least 90 for excellent lighting. Note: one should still confirm the Duv and CRI values, just in case the lamp is some new and strange technology for red lamps.
Figure 3 also shows that as of 2018, LEDs with good and excellent R9 tended to be made with a colour temperature below 4000 K, whereas LEDs made with a colour temperature above 4000 K (blue circles) clustered in the CRI range of 80 to 85, with R9 dropping to an average of 20.
Correlation of CRI with R9 and Duv
The fact that there are many variations on mediocre spectra but only one kind of ideal spectrum (smooth, complete and a slope like some kind of daylight) explains the narrowing of the cloud of data points on the Duv plot as it approaches the right-hand side of the graph in Figure 3. If CRI or its eventual replacement, Rf, approaches the ideal of the benchmark light sources (100 at the right-hand side of the graph), then all other parameters that capture some part of the colour vision puzzle must also approach their ideal (Duv must collapse to 0, R9 must approach 100). Since R9 measures only part of the spectrum, and CRI averages all of it, R9 can fall far from 100 even as CRI gets close to 100 (Figure 3). This is true of all other sample colours too, but for lamps dependent on fluorescence, like most LED lamps, far red, R9, is the most difficult. Hence the role of R9 as a top indicator for excellence.
The good news for museums and art galleries is that manufacturers of LED lamps of excellent CRI are well aware of the growing demand for R9, so they are taking the extra steps to add high R9 to their best lamps and to their marketing.
Quality (CRI) versus energy savings (efficacy)
The term for how well lamps turn electricity into light is “efficacy.” (The term “efficiency” has a different use in lighting technology.) LED manufacturers are still looking for the optimal design of both high efficacy and high quality of light. We can expect rapid development in the next few years, but currently, the bulk of LEDs on the market suffer the same compromise as fluorescent lamps and compact fluorescent lamps (CFLs): marketing favours high efficacy and low price. Quality of light comes a distant third.
© Government of Canada, Canadian Conservation Institute. CCI 122894-0007
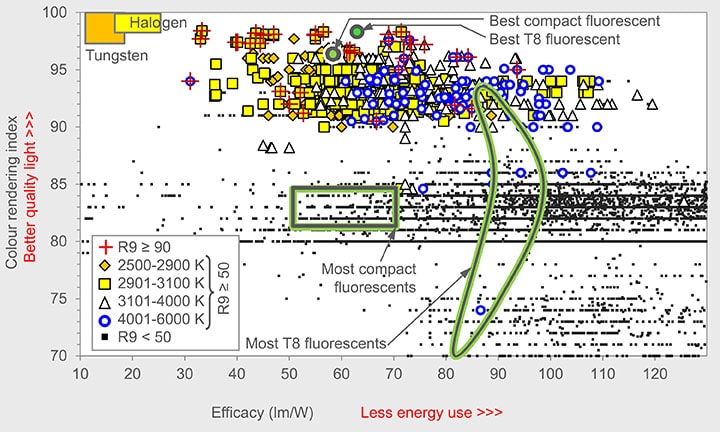
Figure 4. CRI and efficacy of LED lamps and luminaires (indoors) with a CRI over 70 and a measured R9 (10,497) from the LED Lighting Facts database of June 2018 (consult endnote 1). “Most T8 fluorescents” are from a study of 121 lamps (Gribbin and O’Rourke 2006); other fluorescent lamp data comes from manufacturers’ catalogues.
Description of Figure 4
Figure 4 contains a single graph plotting thousands of LED lamps in terms of their efficacy on the x axis, in units of lumens per watt (lm/W), and their CRI on the y axis, between 70 and 100. There are two main clouds of data points: one cloud is near the top third of the graph, with a CRI in the range of 90 to 100 and an efficacy in the range of 30 to 120 lm/W. Four categories of colour temperature are identified within this data cloud. A second cloud of data points, larger and more scattered than the first, covers the lower two-thirds of the graph. These are LED lamps with R9 below 50. The general location of incandescent and fluorescent lamps are also shown.
In Figure 4, in the top left corner, is a yellow box representing quartz halogen lamps: CRI near 100 and an efficacy around 20 lm/W. The black dots plot LEDs with an R9 below 50, the cut-off for good-quality light. These LEDs have high efficacy, starting around 80 lm/W and extending beyond 130 lm/W (data beyond 130 lm/W is not shown), but the CRI is mediocre, in the range of 80 to 85. The large data points without a red cross are good-quality LEDs, R9 between 50 and 89. Most have an efficacy in the range of 50 to 80, and thus require 2 1/2 to 4 times less electricity than a quartz halogen lamp to produce the same light.
The large data points with a red cross inserted are excellent-quality LEDs, R9 above 90; most have an efficacy between 40 and 80, so they use two to four times less electricity. Note that most have a colour temperature in the range of 2901 to 3100 K (yellow squares). Each year, more high-quality and high-efficacy LEDs reach the market, and we can expect it to become easier for museums to find what they need.
It is important to note that there are more excellent LEDs than indicated in Figure 4. Some companies known to supply high-quality LEDs have not entered their data in the LED Lighting Facts database (consult endnote 1).
Looking at Figure 4, one might wonder whether the best LED lamps are any improvement over the best fluorescent lamps. If the situation calls for area or wall wash lighting, and if energy costs are paramount and one is content with the high colour temperature (usually 5000 K) of high CRI fluorescent lamps, then waiting until LED lamps surpass this performance does make sense. The big practical difference between good-quality LED lamps and good-quality fluorescent lamps is that the LED lamps come in the reflector forms and smaller sizes that museums need. And as a big added bonus, LED lamps do not need UV filters and can be dimmed.
Violet versus blue LED lamps
The majority of LED lamps in 2018 used blue LED pumps, resulting in a bump in their spectra at ~450 nm to ~460 nm (for example, the three spectra in Figure 2 for LED lamps that use a blue pump). The “LED, blue pump, 3000 K” lamp in Figure 2 that scores as good, almost excellent, has almost no blue peak left. The manufacturer has carefully balanced the amount of blue light absorbed by the phosphors with the amount escaping.
CRI is not strongly affected by the absence of violet and R9 is not at all affected, so violet has not played a role in the discussion of light quality metrics to date; nevertheless, it has been known since the development of fluorescent lamps that the accurate differentiation of near-white colours requires violet light. For example, the subtle difference in appearance of the white paints used by artists over the centuries—lead white, zinc white and titanium white (warm to cool whites, respectively)—will diminish, maybe disappear, if violet is missing from a light source spectrum (Wei et al. 2014). For the same reason, the perceived change due to treatments such as varnish removal will also diminish if violet light is missing. If such distinctions are important to your collection, a violet pump LED should be included in any comparisons of lamps prior to purchase. As to the issue of UV damage, consult Do LEDs damage objects and artworks?
Colour temperature and lux levels
The CCT of a light source refers to the temperature of a hot object that would emit the same kind of white light. It is measured in degrees Kelvin (K). An unfortunate confusion arises in common terminology since “warm” light has a lower CCT and “cool” light has a higher CCT. For lamps based on a glowing filament, the colour temperature of the light is simply the temperature of the filament, about 2800 K for traditional incandescent lamps and 3000 K for quartz halogen lamps. The sun radiates at about 5900 K, but daylight varies from 3000 K to 10,000 K, depending on the time of day and cloud cover. Our visual system evolved to accommodate this wide range of colour temperatures and to still see the colours of the world as constant, more or less. The question of which CCT is best for museum lighting, and how much it matters, is complicated.
With the advent of fluorescent lamps in the 1950s, manufacturers were no longer restricted by the maximum temperature of an incandescent filament; they could simulate daylight and every other CCT in between it and an incandescent filament. Since then, advice has relied on a graph known as the Kruithof curve. It indicated that people preferred warm light (2800 to 3000 K) when illumination was at the low levels of museums (50 to 200 lux). This was a convenient conclusion for museums since incandescent (2800 K) and quartz halogen (3000 K) lamps operated in this range. The majority of LED lamps still cater to these two traditional temperatures (Figure 3), but since LEDs can be made at any CCT, the question of what is best for museums is once again under examination. Boyce and Cuttle (1990) studied “pleasantness” of the space and the ability to discriminate colours, and they found no significant relation to CCT. A recent literature review simply concluded that the Kruithof diagram had been misunderstood and that no relation at all had been shown between lux level and CCT preference in subsequent studies (Fotios 2017).
Of particular interest to heritage institutions is a rapidly growing group of studies that have examined preferences for the lighting of paintings in a gallery. In terms of lux levels, all authors find that people prefer the brightest light offered during the test, which is not surprising given our ability to see smaller and smaller details as light intensity increases up to full daylight (reviewed in Michalski 1997). The good news is that careful examination of the data shows that almost all the “pleasantness” reported at 600 lux had been achieved by 200 lux (Loe et al. 1982; Szabo 2017; Zhai et al. 2015). Studies that examined the 30 to 200 lux range in detail showed that over half of the pleasantness observed at 200 lux was achieved by 100 lux, and that the big jump in pleasantness occurred between 50 lux and 100 lux (Loe et al. 1982; Szabo 2017). Unfortunately, none of these studies framed preference judgements in terms of the dilemma that museums face: to either preserve artworks or provide access to today’s visitors. That is why the question should be: supposing that some colours in this painting will change noticeably in 200 years at 50 lux, in 100 years at 100 lux, in 50 years at 200 lux, etc., which lux level do you prefer today?
What about colour temperature preference? Unfortunately, the studies do not agree, partly because they asked the question in different ways. Zhai et al. (2015) found that “comfort” of the space was best at 2850 K, whereas the “definition” of the artworks was best at 6500 K. They conclude that “a low CCT around 3500 K would generate a positive perception for the majority of the scales investigated.” Szabo (2017) found that “pleasantness” was highest between 4000 K and 5000 K for all lux levels from 30 lux to 600 lux, although the changes in pleasantness with CCT were insignificant for 30 lux and 50 lux. Nascimento and Masuda (2014) examined 200 lux lighting and found that preferences centred on 5700 K, but the data also showed big differences in preferred CCT between the seven observers and eleven paintings. Pridmore (2017) argues that colourimetric calculations alone support 5000 K as the best balance between warm and cool colours.
In summary, it does appear that our eye is optimized to the intensity and the colour temperature of average sunlight (5000 to 6000 K), as one might expect, but it is also very well established that we like warm lighting and that our eye can adapt to see colours “correctly” in such lighting. The answer to the question of which CCT is best for low-level museum lighting has shifted from “only warm light is successful” to “warm light is pleasant but cooler light (5000 K) may be better for seeing some objects.”
Museums have other considerations besides allowing for paintings to be viewed in a neutral space. In historic buildings, especially for decorative arts, one may want to replicate the warm light of historic lighting. Most people prefer the appearance of human skin tones in warm light.
In conclusion, our current best advice is to test lamps with various colour temperatures in situ and to select the one that you and your colleagues prefer for the type of objects on display. The only fixed advice is to be consistent within each space. Our ability to adapt to a wide range of colour temperatures and see them all as white relies on visual adaptation, which takes many minutes to occur. Select only lamps of good or excellent colour rendering. Currently, the largest selection of good and excellent lamps occurs near 3000 K (yellow squares in Figure 3), and until manufacturers respond to the new evidence supporting higher CCT, 3000 K remains a very successful general-purpose choice for museums that do not wish to face a complex selection process.
Historically accurate lighting, artists’ intent, fluorescent paints and optical brighteners
Long before LED lamps, the issue arose of how to light artworks made by artists under their own preferred or historically unavoidable lighting, whether it was Michelangelo in the Sistine Chapel, the Impressionists outdoors, a modern artist under bank lights of their favourite fluorescent lamps or any sacred objects meant for candlelight. And what about all those objects meant to be seen properly with a healthy dose of UV, such as artwork based on fluorescent paints or the common situation of paper, costumes and textiles dependent on fluorescent whiteners?
There are four separate issues in the listed examples.
- All the situations of variable daylight and incandescent lighting (candles to tungsten lamps) can be addressed through the selection of appropriate colour temperature and intensity. Recommendations for good and excellent would remain unaffected.
- The issue of artists who chose fluorescent lamps with poor CRI is not easily solved with LED lamps, but it is not theoretically impossible. One would have to know the type of fluorescent lamp, check its spectrum and look through LED lamps of similar CRI for a similar spectrum.
- For fluorescent paints, the good news is that most of the green, yellow, orange and red paints can look almost as bright without UV. They are activated by violet through to green, but they do require a high colour temperature source like daylight to look as intended. The bad news is that they fade quickly; rates are equivalent to Blue Wool standards 1 to 3 (Connors-Rowe et al. 2005).
- Optical brightening agents in modern paper and textiles, also called “fluorescent whitening agents,” are designed to emit in the blue band, thereby compensating for yellowing of the material. To emit blue, they need excitation in the UV and violet. Our recommendations for good and excellent concerning the white light part would not change, but adding UV purposely to lighting based on LED lamps that are free of UV is a delicate issue, given the health concerns. Thus, the issue is outside the scope of this text. If one does have this type of object, however, when comparing a selection of LED lamps for consideration, one should certainly consider lamps that use a violet LED pump since the excitation band of many brightening agents does include violet. The bad news is that brightening agents themselves accelerate the rate of yellowing of some materials due to light (for example, the agents make wool look whiter for a while but at the cost of looking yellower later [Millington 2005]).
Viewer preference versus correct colour
At mediocre CRI values, one can observe strong viewer preferences for one kind of distortion over another, and current literature on the subject is concerned with what it all means and how to measure universal preferences amongst imperfect spectra. As noted previously, it is part of the ongoing search for a complete science of colour perception. Are there advantages to some of the colour distortions possible with imperfect light sources? Our approach is conservative: we recommend mimicry of benchmark spectra, and our categories of good and excellent reflect two levels of success.
Do LEDs damage objects and artworks?
In early 2013, newspapers around the world reported that “Van Gogh's masterpiece is slowly turning brown as a result of exposure to LED lighting.” (S. Manning, The Independent, January 13, 2013.) A few months later, a less newsworthy retraction followed: “Why online news reports claiming that LED exposure darkened the artist's colors were mistaken.” (S. Strasnick, ARTnews, March 3, 2013.) This belief that LED lamps might cause more damage per unit exposure than previous lamps was not new: it had appeared in the lighting and conservation communities as soon as the big blue bump in the spectra of LED lamps had become widely known. It was certainly plausible that this blue light might aggravate damage. The questions were by how much and from which LED lamps.
We compiled all the available studies that compared the fading of materials by LED lamps and conventional lamps. We entered all available data on the damage spectra of these materials, and the spectra of the LED lamps used, into the standard model for predicting relative damage (Thomson 1978) and found no surprises. The predicted fading of various LED lamps fits the studies within experimental errors. We then used the model to examine in detail the relative damage due to LED lamps on various materials as compared to traditional light sources.
The first section summarizes our advice and is followed by the presentation of the evidence behind it.
Summary advice about damage from LED lamps
White light from any source will cause discolouration, usually fading, of vulnerable surfaces, and UV from any source will cause gradual disintegration of vulnerable surfaces. If an LED lamp is selected on the basis of good-quality or excellent-quality light (that is, CRI over 90), it will not cause any more light damage to objects or artworks than light from halogens or traditional incandescent lamps or UV-filtered daylight.
In fact, we find the opposite for the most important type of light damage: the discolouration of fugitive colours. When comparing all LED lamps that produce good or excellent light to lamps that have been widely used in the past without UV filters, such as traditional incandescent lamps and halogen lamps, we notice that the good-quality LED lamps are all safer, whether based on blue or violet LEDs.
When comparing LED lamps to the benchmark of a halogen lamp with a perfect UV filter, we see that LED lamps of similar colour temperature and of good-quality light cause either similar rates of discolouration, if using a violet LED pump, or lower rates of discolouration, if using a blue LED pump. The lower rates of discolouration with blue LED lamps are due to the missing violet light (that is, their incomplete spectra). We do not consider this a reason to favour violet-deficient lamps any more than we would have recommended yellow filters for all incandescent lamps in the past.
Is fading by LED lamps ever significantly worse than that associated with traditional lamps? Yes. Early work by Ishi and colleagues (2008) showed some dyes faded up to twice as fast with the worst LED lamp tested compared to a source similar to our benchmark 3000 K halogen with UV filter, but such early LED lamps produced light of very poor quality (very high CCT, poor CRI) and should never be used in a museum or art gallery. In summary, the only evidence of significantly increased fading concerned LED lamps of very poor quality light.
For the other type of lighting damage (disintegration of media, such as chalking or cracking), blue LED lamps that provide good or excellent light are safer than a halogen lamp with a perfect UV filter, but good and excellent violet LED lamps are not. If, however, one compares good and excellent violet LED lamps to sources long considered acceptable in museums (for example, the traditional incandescent lamp without a UV filter and halogen lamps without a UV filter) and to the lighting sought in many architectural mega-projects, namely UV-filtered daylight, violet LED lamps are found to be less damaging. This form of damage is also much slower compared to fading of fugitive colours—millennia versus years, assuming museum intensities. In terms of damage, we consider lamps that use a 415 nm violet LED and which produce good or excellent light not only acceptable, but an improvement on most previous forms of museum lighting.
In terms of lighting decisions, looking for differences between electric lamps that produce good-quality light, of any type, once their UV is removed is splitting hairs; the big preservation impacts are obtained by reduction in intensity and duration of exposure. LED lamps based on blue pumps, which are currently the majority of LED lamps, or based on violet pumps above 415 nm, do have a huge museum advantage, though: one can dispense with UV filters and all their associated costs and maintenance issues.
Damage spectra of museum materials
The damage spectrum of a material, also called the “action spectrum,” plots the relative damage due to each wavelength of light and UV. A damage spectrum must specify the particular kind of damage that was measured and the particular material that was damaged (for example, fading of a particular paint, yellowing of a particular material or loss of strength of a particular fibre). Looking for a generic straight-line damage spectrum that can rank the risk from different lamps, although often attempted, is not meaningful.
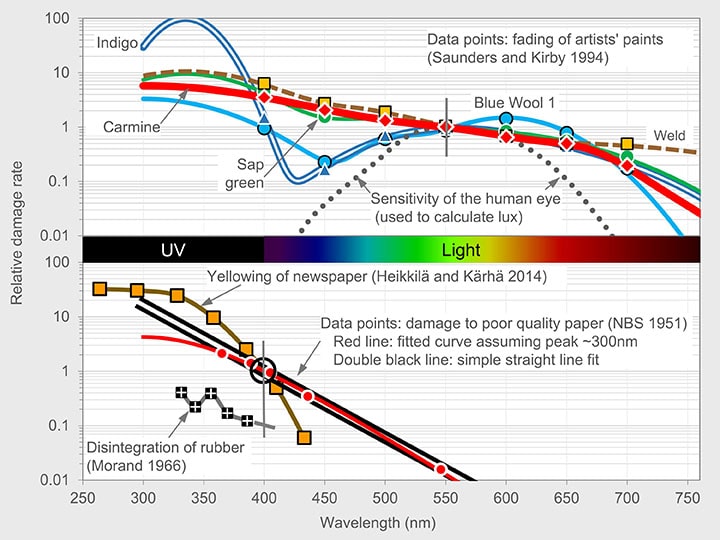
Figure 5 illustrates the two general forms of damage spectra: fading of colourants (upper plots) and disintegration and yellowing of media (lower plots).
© Government of Canada, Canadian Conservation Institute. CCI 122894-0009
Figure 5. Examples of relative damage spectra. The upper graph shows fading of various coloured materials, all adjusted to 1 at 550 nm; the lower graph shows disintegration and yellowing processes, all adjusted to 1 at 400 nm (except rubber, shifted to 0.1 at 400 nm for clarity).
Description of Figure 5
Figure 5 contains two graphs, one above the other, sharing the same x axis. The x axis is wavelength, from ultraviolet at 250 nanometers to visible light up to 760 nanometers. The y axis for both graphs is relative damage rate, shown on a logarithmic scale. The upper graph contains six plots, five of which are the fading of various colourants and tend to slope downwards from left to right. The sixth plot is the relative sensitivity of the human eye, which peaks in the middle of the graph. The lower graph contains four plots, which all slope downwards from left to right.
Within the damage spectra of colour fading (upper part of Figure 5), three groups with key examples are provided, all from the seminal work of Saunders and Kirby (1994). Extrapolation of their data into the UV band was done using known benefits of UV filtering on each colourant.
- Colourants with damage spectra that slope gradually from left to right with little variation. These include a red colourant (carmine), a green colourant (sap green) and a yellow colourant (weld). The damage spectrum is dominated by blue wavelengths. Although UV does contribute, UV filtering of a source such as daylight through glass only reduces fading by perhaps 20%, not 100%. These colourants are also fugitive (Blue Wool ratings 1 and 2).
- A fugitive colourant that has a pronounced trough in its damage spectrum: Blue Wool 1. The damage spectrum is dominated by green to red wavelengths. The rise of the spectrum in the UV is not pronounced, so as in Blue Wool 1, UV filtering light sources will not help much.
- A durable colourant that has a pronounced increase in sensitivity in the UV: indigo. The damage spectrum is dominated by UV and violet wavelengths, so UV filtering is important.
Within the damage spectra of media disintegration (lower part of Figure 5), the examples are as follows:
- The five data points (red dots) presented in an old National Bureau of Standards (NBS 1951) report, which then recommended a yellow filter for lighting of the U.S. Declaration of Independence. The material was “low-quality paper,” and the damage measured was not specified. It might have been loss in mechanical strength in terms of fold endurance, but was more likely a study of yellowing. Harrison (1953), the lighting engineer, subsequently extended these points into a table of damage factors which prevailed for decades (his table was similar to the double black line). Another curve we have fitted to the data (red line) presumes a bend towards a peak in the range of 200 to 300 nm, based on the general shape of damage spectra measured in that range for paper and polymers.
- Disintegration of rubber (Morand 1966). Of all the wavelength studies surveyed in Feller’s last major review (1994), this is the most precise study of strength loss of a material in the key band of 300 to 400 nm. Rubber is known to be particularly vulnerable to UV; hence, the cracking of rubber objects on the surfaces that faced daylight.
- Yellowing of paper (Heikkilä and Kärhä 2014). Yellowing is a difficult phenomenon to measure well due to counterbalancing bleaching processes. The paper industry has studied wavelength dependence for decades, but only recently have definitive results, such as what is shown in Figure 5, emerged.
For purposes of calculating media disintegration in general, the double black line of Figure 5 is used, close in slope to the NBS and rubber data, but also similar in slope to many material disintegration plots reviewed by Feller (1963, 1994) and Michalski (1987).
Damage calculations of various lamps
Also shown in the upper graph of Figure 5 is the sensitivity of the human eye, a plot used in all light meters to calculate lux. If a lamp produces a big spike in a region where our eye is not sensitive but the material is sensitive, such as the blue and violet bands or the UV band, of course, then we can expect the damage per unit lux for that source to jump.
By combining the spectrum of a light source and the damage spectrum of a material, one can calculate the predicted rate of damage. Figure 6 presents the results based on the damage spectra of Figure 5, crossed with 19 light sources, including representative good and bad LED lamps whose spectra were provided in Figure 2 of the section Do LEDs provide good-quality light?
© Government of Canada, Canadian Conservation Institute. CCI 122894-0011
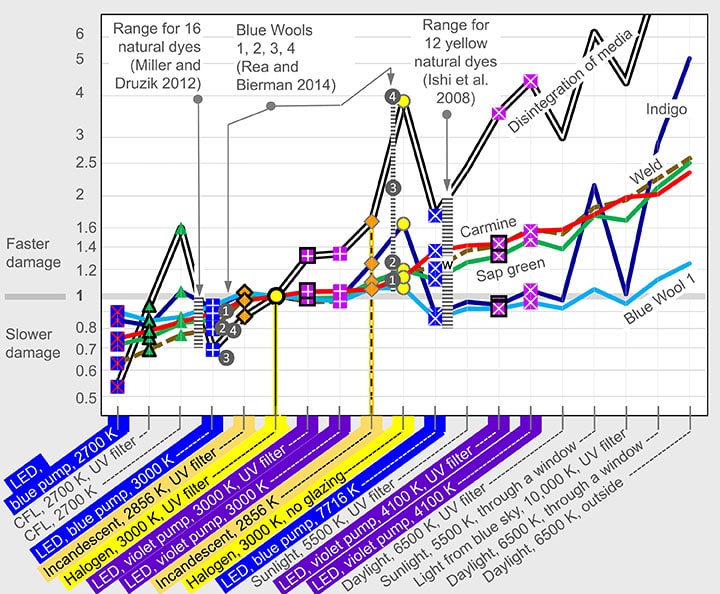
Figure 6. Calculated damage to materials in Figure 5 due to various light sources, relative to a 3000 K halogen lamp with a perfect UV filter. The LED spectra are as in Figure 2. Light sources are sorted left to right by their effect on carmine (red line).
Description of Figure 6
Figure 6 contains a single graph. The x axis lists 19 light sources, mostly electric lamps. The y axis is a relative damage rate, on a logarithmic scale. There are six plots, most of which tend to climb from left to right, but one of which (Blue Wool 1) is almost horizontal, and two of which (Indigo and Disintegration of media) zigzag much more than the others.
Figure 6 is built around the ideal benchmark of a 3000 K halogen lamp with all the UV perfectly removed (large yellow circle with a heavy black boundary). The relative damage plots are all anchored to this benchmark, so the vertical axis gives the relative damage rate, which varies from about 0.5 to beyond 6. The historic benchmark is the traditional incandescent lamp (Figure 6, orange highlight, vertical dashed line), which, ever since Thomson (1978), has been accepted as a suitable lamp to use in museums without a UV filter, other than the glass bulb itself.
The light sources are organized from left to right in terms of damage to carmine, a red paint that is both fugitive and widely used in many cultures, sometimes as simply the dye itself, cochineal. This red paint and other historic fugitive colours likely to have similar damage spectra are often the first to fade in objects such as oil paintings, watercolours, colour photographs and textiles.
The two other colourants with a similar damage spectrum to carmine, sap green and weld, follow carmine closely on this graph.
Damage data for various lamps
There are experimental studies that allow us to confirm the predictions of Figure 6. The first such study of LED lamps by Ishi et al. (2008) rightfully raised concerns about LED lamps because it showed that three out of the four LED lamps with blue pumps could fade some dyes more than twice as fast as a museum-quality fluorescent lamp labelled “NU.” The NU lamp had a colour temperature of 3000 K, negligible UV and a spectrum similar to our benchmark of the “Halogen, 3000 K, UV filter”. The blue LED lamps tested were typical consumer lamps of the time (CRI around 80 and very little red). The worst LED tested by Ishi et al. was the “LED, blue pump, 7716 K” in Figure 6. Its blue spike was more than twice the height of the remainder of the spectrum (Figure 2). After calculating the relative damage rates found by Ishi et al. in terms of the NU lamp, we have plotted the range of relative damage rates for the dyes that gave unambiguous results (12 out of 16 dyes) with a striped bar above “LED, blue pump, 7716 K.” Although a few colourants faded less, most faded more—as much as double in terms of our benchmark source. This is the clearest evidence of an exceptionally large blue bump causing extra damage, but this large bump also meant that the quality of light was awful. Particularly valuable in confirming the model is the datapoint of Ishi et al. for weld, marked by the letter “w” at a factor of 1.2. It agrees very nicely with the prediction for weld when using the damage spectra of Saunders and Kirby.
Miller and Druzik (2012) tested 16 natural dyes, 6 of them identical to those in the Ishi et al. set (including weld). This time the comparison was between excellent LED lamps (3000 K, CRI 95; 2900 K, CRI 96) and an MR16 halogen lamp (3000 K) with only a glass cover, not a complete UV filter. Thus, the maximum reduction of fading derived from their data, shown by the striped bar above the source “LED, blue pump, 3000 K,” is probably slightly exagerrated. Besides, 13 of the 16 dyes, including weld, showed no significant difference between the two lamps for the length of exposure studied.
A third study that provides LED data relative to our benchmark is one done by Rea and Bierman (2014). They compared fading of the blue wool reference samples themselves for LED lamps versus a 3000 K halogen lamp with a museum grade UV filter. The LED lamp was a programmable model, which is becoming more widely available, that uses a mix of a white LED plus other LEDs that shift the colour temperature. The fading study used only the warm white mode of about 3000 K. Unfortunately, the model had a very poor CRI of 52. The derived fading ratios are shown as numbers 1 to 4 adjacent to the source it most resembled, “LED, blue pump, 3000 K.” Within experimental errors, the agreement of prediction and experiment for Blue Wool 1 is good. More durable blue wools are helped even more.
Another set of relative damage rates derived from the Rea and Bierman study informs Figure 6 further: their ratio between the damage due to a halogen lamp with a UV filter and one without a UV filter, shown by the striped bar above “Halogen, 3000 K, no glazing.” Daylight studies of the blue wools done long ago by McLaren (1956) established that Blue Wool 4, unlike Blue Wool 1, is indeed faded primarily by UV rather than visible light, hence the remarkable increase in fading by a factor of four between a halogen lamp with a UV filter and a halogen lamp with no glazing.
At the time of writing, English Heritage had reported preliminary results for tests of a very large variety of paints including inorganic pigments, oil media and watercolours (Richardson 2017). They tested two LEDs that represent widely available models (CRI of 82 and 88, so not good-quality, but within the Energy Star criteria, colour temperature of 3000 K and 4000 K). These had moderate size blue bumps at 450 nm (between the smallest and biggest blue bumps of Figure 2.) They also tested daylight with a UV filter. The rate of damage was compared to that caused by a 3000 K quartz halogen lamp with a good UV filter. Their results are consistent with results shown for the blue pump LEDs of 3000 K and 7716 K in Figure 6: some pigments fade up to 30% faster, some up to 30% slower. Daylight with an imperfect UV filter was much worse (as in Figure 6): some inorganic pigments changed up to three times faster than under the 3000 K quartz halogen lamp with UV filter.
We can make the following judgements about LED lamps, based on Figure 6, where “benchmark” refers to the halogen lamp of 3000 K with a perfect UV filter:
- LED lamps that use a blue pump, that have a similar colour temperature to that of our benchmark and that have good or excellent colour rendering (“LED, blue pump, 3000 K,” blue squares with a white “+”) cause the same amount of damage or a slower rate of damage as our benchmark. On the other hand, LED lamps with large blue spikes (“LED, blue pump, 7716 K,” blue squares with a white “x”) can cause up to twice as much damage as our benchmark. Such large blue spikes cause not only a poor CRI but also colour temperatures far above our benchmark.
- LED lamps that use a blue pump and a red LED to achieve good-quality light at a low colour temperature (“LED, blue pump, 2700 K,” blue squares with a red “x”) do not have elevated damage. Their large red spike does not add significant damage.
- LED lamps that use a violet pump near 415 nm, and which produce good-quality or excellent-quality light (“LED, violet pump, 3000 K” violet squares with a white “+”), do not appear to increase colour fading, but they will cause faster media disintegration compared to the benchmark. Blocking UV only reduces this by a very small amount—as seen when comparing violet squares with and without black borders. The problem is not the trace UV but the presence of a modest violet bump in this lamp combined with a sharp increase in the rate of damage at violet wavelengths. That said, these violet pump LEDs are still less damaging than the traditional incandescent lamp, less damaging than a halogen lamp without a UV filter and much less damaging than daylight even if there is a perfect UV filter.
- LED lamps that use a violet pump near the UV boundary (405 nm for the “LED, violet pump, 4100 K,” violet squares with a white “x”) can cause 40% to 50% faster fading and four times the rate of media disintegration compared to the benchmark. These factors are not reduced much by removal of UV (violet squares with black borders) because the trace UV content is not the problem. The problem is the huge violet peak at 405 nm, which adds greatly to damage but little to lux level. This large violet spike also causes poor scores on quality of light, so we would not consider this lamp in the first place.
In other words, if one only selects LED lamps that have good-quality or excellent-quality light, then damage is not a concern, but if one accepts any LED lamp offered, then both the appearance of the objects and their preservation are at risk. To place the damage from even the worst violet LED in perspective, however, it is no more than, and sometimes less than, the damage by daylight, a source of lighting on which museums and art galleries around the world have expended enormous resources so as to bring it to their artworks because it is “natural.” Figure 6 shows that even if daylight could be filtered perfectly (“Daylight, 6500 K, UV filter”), it would cause damage rates similar to that of the worst violet LED lamps.
Does damage depend on colour temperature?
In Figure 6, the light sources have been sorted left to right according to their effect on the fading of carmine, and one can note that the colour temperature of the light sources does range from 2700 K on the left to 6500 K on the right, but that the progression is not perfect. Damage to the fugitive Blue Wool 1 barely changes across all the lighting sources. Unlike carmine, its damage spectrum (Figure 5) has a trough in the blue band, but unlike indigo, the spectrum does not climb dramatically in the UV. In other words, fugitive blues will fade the same regardless of colour temperature or UV filters.
In Figure 6, it is clear that the disintegration of media depends primarily on UV and violet and that the fading of a durable colour such as indigo also depends primarily on UV and violet. However, for fluorescent and LED lamps, UV and violet do not correlate well with colour temperature. Since any museum worried about lighting damage will have controlled UV, the better question becomes: assuming UV is absent, is colour temperature a useful indicator of relative damage to objects?
Colour fading does depend on colour temperature for most colours other than blues, but only to a modest extent—it is up to 50% faster for daylight at 6500 K compared to halogen at 3000 K. This is consistent with the work by Crewes (1989), showing that the use of an amber filter that removes UV, violet and some blue on a source simulating daylight could reduce fading of natural dyes (cochineal, madder, indigo, fustic, weld and turmeric) by only 35% more than a UV filter alone, which reduced by 15% on average the fading that would have occurred without a filter. The big jumps in Figure 6 do not signal a climb in colour temperature; they signal the presence of UV, such as “CFL, 2700 K” and “Halogen, 3000 K, no glazing,” in combination with the UV sensitivity of media disintegration and indigo fading.
The useful generalization for museum lighting in terms of the spectrum remains the same: if a source has UV, then filter it, and filter it well.
Material sensitivity still dominates lighting decisions
© Government of Canada, Canadian Conservation Institute. CCI 122894-0013
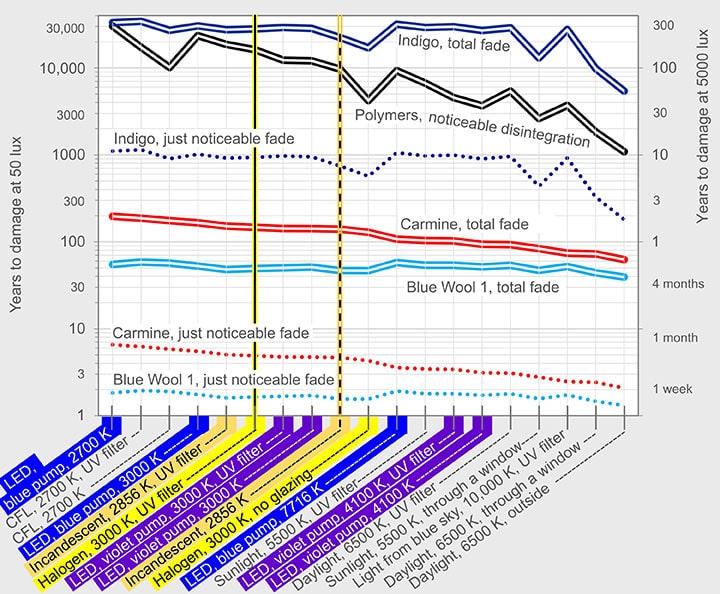
Figure 7. Time for damage to occur to various materials with various light sources.
Description of Figure 7
Figure 7 contains a single graph. The x axis lists 19 light sources, mostly electric lamps. This is the same list as in Figure 6. The y axis is the number of years to reach the specified damage. The left y axis is a scale of years to reach specified damage if the light intensity is 50 lux, while the right y axis is for a light intensity of 5000 lux. There are seven plots, most of which tend to drop slightly from left to right, but two of which (Blue Wool 1, total fade; and Blue Wool 1, just noticeable fade) are almost horizontal, and three of which (Indigo, total fade; Indigo, just noticeable fade; and Polymers, noticeable disintegration) zigzag much more than the others.
In Figure 7, the relative damage rate of Figure 6 has been converted into the time needed to reach various degrees of damage for the various materials. It has been calculated using relative rates from Figure 6, which determine the shape of each plot, combined with estimates from fading studies and outdoor aging of polymers, which determine the vertical position of each plot. The vertical axis gives times for 50 lux on the left-hand scale and for 5000 lux on the right-hand scale. At the bottom is a representative of high sensitivity colourants, Blue Wool 1, and at the top, five hundred times less sensitive, a representative of low sensitivity colourants, indigo on wool. The overwhelming message of Figure 7 is that the time to reach particular levels of damage due to electric lamps is determined primarily by the sensitivity of the material, the intensity of the light and the duration of the exposure, not the spectral details of the light sources. Choose light sources for their quality of light so that one sees things well; preserve things well by knowing which are highly sensitive and reducing their exposure.
Measuring UV from LEDs
Unfortunately, the simple UV meters widely used by museums will not measure correctly the small amount of UV from those LED lamps that do actually emit a trace of UV, and any reading above zero for the majority of LED lamps that use a blue LED pump is simply wrong. We and others in the health research field (Barlier-Salsi 2014) have found that even widely used portable spectrophotometers in the $2,000 to $5,000 range can give false noise signals in the UV band that are unimportant to users doing colourimetry but very important to those of us calculating harm caused by the rapidly climbing UV damage spectra. Published measurements using a sufficiently sensitive instrument (double monochromator, Rea and Biermann 2014) confirm that the output of blue LED pumps drops three orders of magnitude between their blue peak and the UV boundary at 400 nm, then drops another two orders of magnitude by 380 nm. This is a sharper cutoff than the one associated with even the best UV filters.
Heat, glare, dimmers and flicker
LED lamps produce much less heat than incandescent lamps, such as infrared in the light beam (zero with LEDs) and heat from the fixture (1/3 or even less). It is possible now to consider display case designs with the lamps inside without overheating of the case (consult Heat from LED lamps for clarification).
Glare is worse with current LED lamp designs than with previous lamp technologies, due to the placement of the LEDs in the lamp housing. This geometry, driven by early issues of electronics design and cooling design, is slowly being phased out, but it remains an important part of the lamp selection process.
Most LED lamps require special dimmers, as those from old lighting systems may not work properly. Information on dimmers for each LED lamp is widely available on lamp packages and online.
Heat from LED lamps
A 60-watt (W) traditional incandescent lamp, a 35-W halogen lamp and a 9-W LED lamp all produce about the same amount of light, approximately 2 W. That leaves the rest in heat and infrared radiation: about 58, 33 and 7 watts, respectively. There is no infrared radiation from LED lamps, so the light beam is completely “cold.” In general, if LED lighting is used only to attain museum-level intensities, and this is done without heavy filtering of an overly powerful lamp, then LED lamps can even be used inside cases without causing a temperature rise of more than a degree or two. And given the extremely long life of LED lamps, the risk to objects due to such infrequent lamp changes may be acceptable. Mabuchi et al. (2015) measured the temperature rise in very large wall cases lit to 100 lux by four rows of small LEDs at the top and one row at the bottom. The middle of the case rose by only 1°C and the top, by 2°C. Due to case buffering, RH dropped only 2%.
Why do LED lamps produce more glare?
Exhibit designers have commented that LEDs produce more problems of glare than the lamps they replace. Each of the individual white LEDs (white cylinders in Figure 8) is a very small and very intense patch of light, but so was the filament of a tungsten or halogen lamp (white bar in Figure 8). Even the less intense surface of a fluorescent lamp will be a source of glare if it is in the viewer’s line of sight, and therein lies the problem.
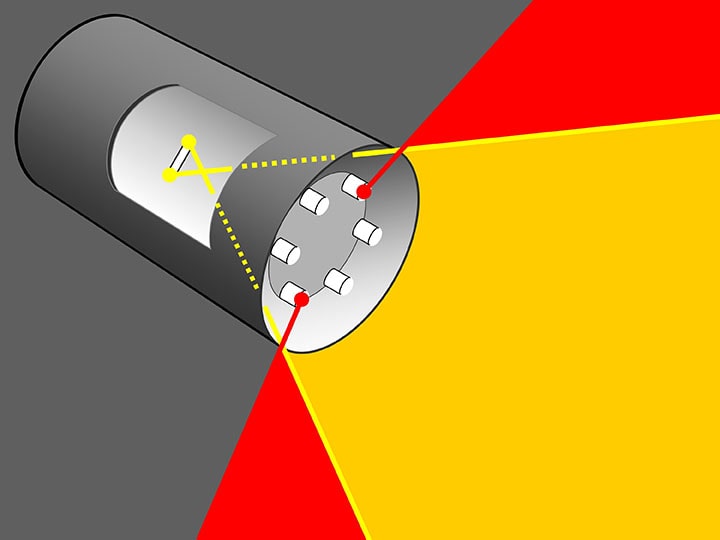
© Government of Canada, Canadian Conservation Institute. CCI 122894-0015
Figure 8. Angle of glare for a traditional incandescent spot lamp with a deeply recessed filament (yellow region) compared to that of an LED lamp with its LEDs near the front of the lamp (red region).
Figure 8 illustrates the role of geometry in determining whether a lamp in a fixture causes glare. In traditional reflector lamps, the filament was recessed well behind the front of the lamp. Many directional LED lamps are designed with the LEDs at the front surface of the lamp, with no reflector at the sides and no diffuser layer. Even if the old track fittings have snoots, their anti-glare geometry assumes that the source is close to the back of the snoot, not out near the front. The control of glare from any light source has always been about the control of geometry (that is, the line of sight between viewer and source), as shown by the red and yellow lines in Figure 8. LED lamps not only are more likely to expose their point sources to the viewer (red lines), they also have many more points per lamp, hence a stronger feeling of visual noise.
Reducing glare by lamp selection
Some directional LED lamps were designed with glare control in mind, and we can expect future designs to follow this trend. Figure 9 shows the front view of an LED PAR30 reflector lamp that places the LEDs deep within the reflector, mimicking the location of the filament in the traditional lamp it replaces (as in Figure 8). In addition, a Fresnel lens (the circular ridges) plus a diffuser soften the edge of the beam and reduce unevenness in beam intensity. Some LED lamps use integrated filament shields, as did many halogen PAR lamps of the past. Fortunately for museums and art galleries, directional LED lamps for the high-end retail market often combine improved glare control with a good quality of light (a high CRI).
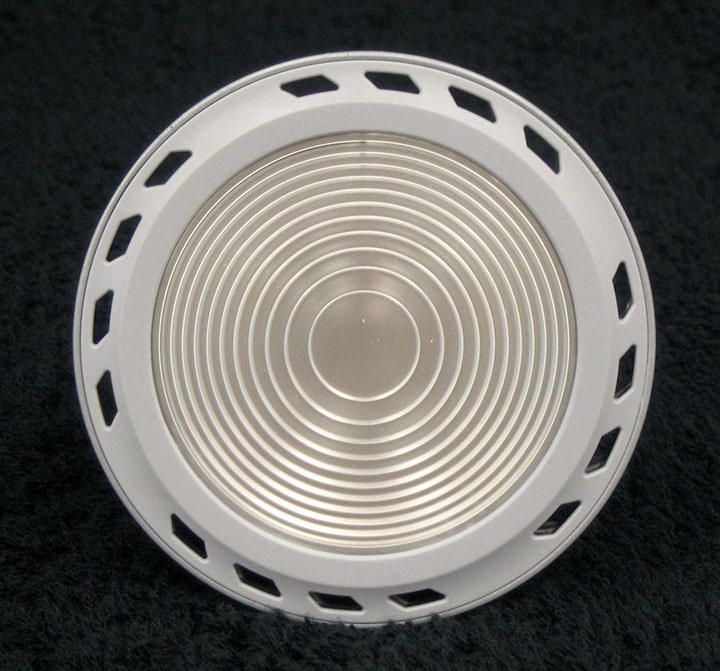
Photo: James R. Druzik. © 2012 J. Paul Getty Trust
Figure 9. Fresnel lens and optical diffuser on the face of a PAR30 LED reflector lamp.
Reducing glare by fittings and accessories (luminaires)
If one cannot find an LED lamp that at least reduces glare to the familiar level of previous reflector lamps, then control by the fixture and accessories becomes even more important than before.
The best method to decrease glare remains the installation of a cutoff that shields the viewer from the light source. The cutoff can be in the form of a simple extension of the tube by a snoot, as in Figure 10, or by cube and hex louvers at the front, often known as “45 degree cutoffs.” For most museum applications, such accessories should be painted matte black to avoid reflection of the blocked light. With LED lamps, amateurs need no longer worry whether the paint is heat-resistant, as they did with incandescent lamps.
© Government of Canada, Canadian Conservation Institute. CCI 122894-0016
Figure 10. Cutoff provided simply by an extension of the housing (a snoot) shown previously in Figure 8. The angle of glare for the LED lamp is reduced to about 90°.
LED lamps are generally retrofits, so most of the time they can be used along with the existing set of accessories such as asymmetric lenses, spread lenses, diffusion filters, baffles and window screens to cut intensity when needed. These tools will come in handy because some LEDs project a more even light pattern, but a few do not.
For those using LED lamps for the first time, it is especially important to purchase a few trial lamps and to place them as close as possible into the intended situation and then to look for glare not just in front of the illuminated objects, but from the paths that a viewer uses to approach the location as well as paths the viewer takes to other objects. The trick for the lighting designer is to locate the light fixture so that it illuminates the object appropriately, while at the same time, to make sure the bright part of the light source is not visible to viewers anywhere in the space.
The designer must also worry about reflected glare from any shiny surfaces, including reflections from shiny oil paint, or protective glass on the artwork or glass case surfaces. The appearance of many tiny lenses at the front surface of an LED lamp, as seen reflected in highly specular paint surfaces, has been called the “pomegranate effect” and can be distracting.
One returns, in the end, to two general principles for reducing glare: very diffuse, very large surface lighting (the office solution) or precise control of many lamp beams (the theatre solution). Museums tend to favour the latter, but both, and hybrids, can be successful.
Dimmers and flicker
Most LED lamps require special dimmers, as those from old lighting systems may not work properly. Information on dimmers for each LED lamp is widely available on lamp packages and online.
Flicker is often reported for LEDs on dimmers. The health effects of flicker are well documented and in some instances can be serious, ranging from headache and eye strain to photosensitive epilepsy, which affects one in every 4000 individuals (Wilkins et al. 2010.)
There are two principal techniques for dimming LEDs: pulse-width modulation (PWM) and constant current reduction (CCR).
PWM dimming takes advantage of the fact that LED lamps can be switched on and off at very high frequencies and that our eye perceives the result as uninterrupted light at the average intensity. PWM drivers generate the high frequency and then vary the on/off ratio. If the frequency is too low, PWM can introduce distracting or problematic light flicker. At up to 120 hertz (Hz), we can perceive flicker (as was the case with many fluorescent lamps or even incandescent lamps at low dimmer levels). Above 120 Hz, flicker will not be directly perceived, but so-called “invisible flicker,” as well as the stroboscopic effect due to the movement of our eyes across a scene, may still contribute to headaches, malaise, distraction and other issues (sensitivity varies from one individual to another). The preferred minimum frequency for dimming is 1250 Hz. A disadvantage of PWM is that it can change the colour of the light; however, it does not usually do so.
With the CCR technique, light output of the LEDs is reduced by reducing the current, but some LEDs may shift in colour, often toward the blue, when dimmed to low levels. A hybrid approach is considered optimal: PWM plus CCR, with each kept within the limits that leave lamp colour unchanged.
The National Electrical Manufacturers Association (NEMA) has provided on its website access to NEMA LSD 49-2010, Solid State Lighting for Incandescent Replacement—Best Practices for Dimming. Although the title does not indicate it, this document specifically targets integrated LED lamps. In addition, Energy Star compliant manufacturers must indicate on the package whether a lamp is dimmable or not. Manufacturers qualifying dimmable products must maintain a web page providing dimmer compatibility information.
The J. Paul Getty Museum tends to avoid dimming and flicker issues by employing screens to reduce intensity. Screens and grey filters should be tested with the LED lamp because some lamps use an active colour management system that can be disrupted with screens.
A step-by-step outline for purchasing lamps
This step-by-step outline is intended for all users, but especially small to medium-size institutions that are only replacing existing lighting, not planning new facilities or a complete renovation of an existing space. Larger institutions, and anyone in the midst of architectural scale planning, may want to consider further details in Technical details for larger projects.
Before purchasing trial lamps
- For lighting museum and art gallery collections, consider only LEDs with at least good-quality lighting (CRI over 90, Duv within a range between −0.003 and +0.003, R9 over 50) and, preferably, excellent-quality lighting (CRI over 90, Duv within a range between −0.003 and +0.003, R9 over 90).
- Do not use lamps that have violet LED pumps at 405 nm unless you wish to consider the inconvenience of UV filters. (Lamps with violet pumps at 415 nm are not a problem.) Since 2016, all such lamps have the syllable “vio” in their trademark, and none meet the quality standards of good or excellent, so this is only a caution for the future if 405 nm violet LED lamps improve in their quality.
- Within the limitations of 1 and 2 above, favour lamps with higher efficacy. Lower than 40 lm/W will result in marginal cost savings.
- To illuminate public spaces and exhibits that do not have collections present, as well as educational areas, food service areas, hallways, etc., lamps with good-quality light are optimal. If energy savings are paramount, lamps meeting the Energy Star rating (CRI above 80) may be good enough. Test.
- If you wish to replace tungsten (2700 to 2800 K), tungsten-halogen (3000 K) or an equivalent fluorescent lighting and you want similarly warm lighting, select an LED of a similar colour temperature.
- If you plan to use dimmers, make sure you can obtain dimmers and LED lamps designed to work together. If you plan to use strip LEDs in display cases where adjustment of intensity is critical, dimmers become especially important. Information on dimmers for each LED lamp is widely available on lamp packages and online.
- Make no assumptions of quality based on brand alone. Most large lighting companies with familiar brands do make museum quality lamps, but the bulk of their LED lamps, intended for home use, are not of such quality. Some smaller companies have emerged that provide good support to special markets such as museums and art galleries.
- Don’t give up if a given supplier or manufacturer does not have the right lamp for you in terms of CRI, CCT, beam angle, lumens and shape. There are many MR16, PAR30, PAR38 and A-lamp shapes available now, but the market for museum-quality LED lamps is small, so they are not available off-the-shelf in an ordinary lighting shop.
- Although it may be easier to simply retrofit existing fixtures with LED lamps made for this purpose, consider the new designs and shapes that work well in museums and art galleries. Some of these only require an adapter to fit an older fixture or track.
Before purchasing trial lamps: more technical information for lighting specialists
- Read the case studies contained in the GATEWAY project reports from the DOE. Contact the museums mentioned in the case studies and ask for their recommendations. Visit them if possible.
- Obtain LM-79 reports (lamp characteristics) from lamp manufacturers.
- Check the DOE CALiPER website for impartial test data.
- Check the EnergyStar Light Bulbs website and the LED Lighting Facts database (consult endnote 1) for characteristics of products currently available on the market.
- Consult Technical details for larger projects.
Purchase trial lamps
- Once you have made preliminary decisions on several candidate lamps, purchase a few and evaluate them in situ, preferably with colleagues. Check the appearance of the lamp from the side for glare. Check the appearance of the light on blank walls. Check the appearance of the objects illuminated by the lamp. Check the appearance of your skin under the lamp (we are especially attuned to how our skin should look under good-quality light).
- If you purchased dimmers, test them with the lamps. Check for flicker across the whole range of intensities.
- Test trial lamps, especially those you are considering for purchase, in the fixtures planned for use for as long as possible, and at least a week, to see if they change colour or overheat and fail.
Before purchasing large numbers of lamps
- Ask for products from companies you know or whom you trust or that have a documented support history.
- Get a written warranty that encompasses light output, colour variation (Duv) over time as well as failure of chips and electronics, and which includes labour. A one-year warranty is common, but for longer periods of time the coverage may be limited to a catastrophic failure of the LED chip alone. Failure of the electronic components inside the lamp, such as the ballasts and drivers, may not be covered at all. Consider the return on investment (ROI) payback period. You may be satisfied if ROI payback is less than the warranty period. Warranties exist that cover major failure, significant loss of luminosity and any visible change in colour temperature for up to 25,000 hours.
Technical details for larger projects
Larger projects may benefit from a more structured evaluation than simply the “evaluate in situ” advice of step 1 in the Purchase trial lamps section. This section briefly reviews the many visual phenomena that are in play and suggests a method for evaluation that has been used successfully in museums and art galleries that were considering LED lamps.
Why do a detailed evaluation?
An in situ evaluation of various lamps selected for trial strengthens an institutional decision by showing how the lamps will actually look in the end. It is not intended to be a rigorous perceptual study, although institutions wanting to invest time to do carefully designed tests and share them with the museum community are welcomed to do so. The following provides ideas about how to conduct your own evaluation of lamps purchased for trial.
There are several colour perception effects that depend on light intensity (lux level). The Bezold–Brücke effect shifts the perception of hue. The Hunt effect increases colourfulness at higher light intensity. The Stevens effect increases colour contrast at higher light levels. For all these reasons, it is essential to keep lux levels constant when comparing lamps, and it is useful to repeat the evaluation at the various lux levels for which the lamps are intended (for example, 50 lux and 150 lux).
The angle of the light falling on the object can dramatically affect seemingly unrelated visual judgements. Mangum (1998) carried out an assessment of a doll dressed in materials that varied in colour, texture and reflective properties at 50 lux. Observers were asked to report their perceptions of the object, selecting descriptors from either a word list of positive impressions or a word list of negative ones. When the lighting was diffuse, the most frequent responses included “unattractive, unpleasant, obscured, veiled, bland, boring, mundane and ordinary.” When key-light, sidelight or back-light techniques were used, the descriptions shifted to “interesting, attractive, eye-catching, clear, pleasant, revealing, dramatic and spectacular.”
Boyce (2014) states that when making these kinds of observations, observers are more consistent (predictable) when there is less opportunity for past experiences and knowledge to come into play. Higher order perceptions using semantic differential rating scales (as used in any evaluation of the quality of light, such as the one in this Bulletin) are vulnerable to this instability and should be interpreted with this understanding.
Setting up the evaluation
Visual evaluation should be carried out with the type of objects that will or could be illuminated, at the lux levels that will be used, with the planned location of the lamps and objects and with any intended diffusers or filters, or in realistic mock-ups if the new building does not exist yet.
Wall colour is important. It is well known that the coloured wall coverings of traditional galleries shifted the perception of colours in objects, for better or worse, but the stark white wall of contemporary galleries is not neutral either. Figure 11 illustrates the phenomenon called “crispening,” the improvement of our ability to see small differences between patches of colour when the background is of a similar luminance to the two patches.
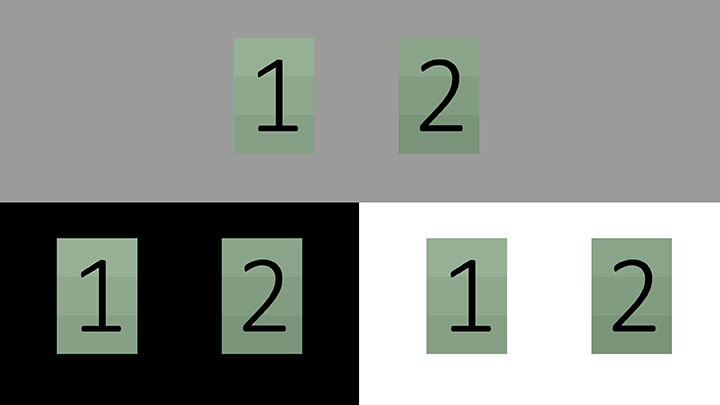
© Government of Canada, Canadian Conservation Institute. CCI 122894-0017
Figure 11. Crispening. Identical pairs of slightly different green patches (1 and 2, each with three green tones) on different backgrounds. The differences within each patch, as well as the differences between patches 1 and 2, are difficult to see against the black or the white backgrounds.
For rigorous psychophysical testing of lamp colours, a neutral grey as specified by the American Society for Testing and Materials is commonly used as background. Most people do find it easier to judge different illuminants side by side knowing that the background colour is neutral (Figure 11). It is also recommended that a white card and a series of colour swatches like the Munsell ColorChecker be included.
The assessments could be:
- without comparison
- with single comparison
- with multiple comparisons
Assessment without comparison would incorporate a single type of lamp on test materials and museum staff responding verbally, or in writing, to a set of survey questions. Complete chromatic adaptation is assumed, and judgements would be influenced by colour memory, colour bias and colour constancy and by discounting the illuminant (Fairchild 2013).
Assessment with single comparison might involve one wall illuminated with a single type of LED lamp and another wall illuminated only with the reference lamp, likely a halogen lamp. Chromatic adaptation is imperfect, and this method allows the assessors to more fully visually estimate how close the two sources of illumination are in colour.
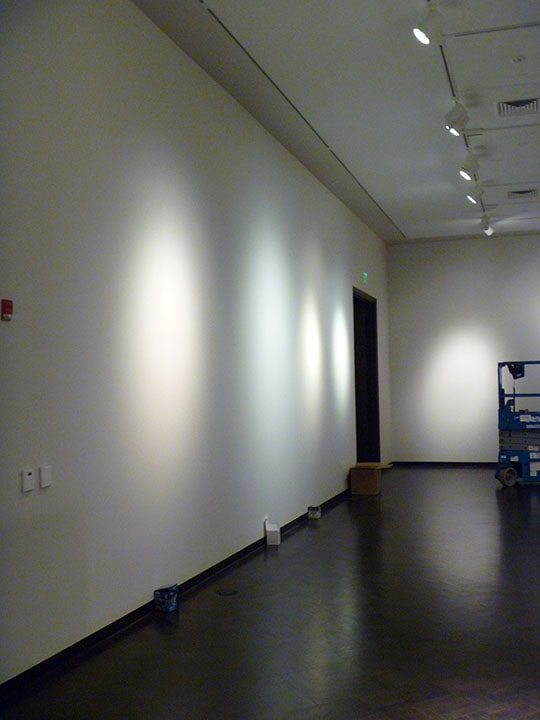
© Pacific Northwest National Laboratory
Figure 12. Comparison of colour and beam spread during assessment of replacement LED lamps at the Jordan Schnitzer Museum of Art in Eugene, Oregon. The tungsten-halogen lamp is shown on the end wall. (Photo courtesy of Naomi Miller, Pacific Northwest National Laboratory.)
Assessment with multiple comparisons might involve up to three test illuminants and one reference condition on a small scale, followed by assessment with a single comparison of the LED that was found most desirable to the largest number of assessors. These assessments can be done with as few or as many individuals as one wants to include. There is no right or wrong answer, and the statistics are not intended to be used to model a larger population. Rather, the function of such an assessment is to derive consensus among the many stakeholders in an institution on switching to a new form of lighting that will nevertheless closely match the lighting scheme it is replacing.
The range of stakeholders should be broad in terms of age and experience. One can form such a group by selecting interns, docents, curators, conservators and registrars. Those who set up the assessment conditions will know the nature of all the lighting; thus, it is preferable to get opinions from assessors with as little knowledge of the assessment as possible, although they will undoubtedly guess, in many instances correctly, which lights are LEDs and which are the halogen comparison lights.
Remember that a gallery may not look the same during the day compared to the evening, and it is important to recreate the overall setting as accurately as possible. Cuttle (2008) notes the importance of having assessors fully adapted to the test source, and of using tools such as the ColorChecker for the naturalness of colour appearance.
An evaluation questionnaire
The following shows a series of test questions that have been adapted from the survey conducted at the Field Museum by staff of the Pacific Northwest National Laboratory under contract to the DOE after a halogen-to-LED swap.
- The uniformity of light across the target is (unacceptable, poor, fair, good, excellent or no response).
- The colour temperature of the lighting in the gallery is (much too high, too high, just right, good, much too low or no response).
- The visible variation in colour temperature among the different luminaries is (not noticeable, barely noticeable, slightly noticeable, noticeable, very noticeable [unacceptable] or no response).
- Glare from the light is (disabling, annoying, noticeable but acceptable, lower than most, non-existent or no response).
- The lighting product shows (none, some, most, all or no response) of the subject colours accurately.
- This product shows (none, some, most, all or no response) of the subject forms clearly.
- Overall, the lighting in the gallery is (too bright, somewhat too bright, just right, somewhat too dim, too dim or no response).
- The object’s colours look (very, somewhat, slightly, not at all or no response) rich/saturated.
- The suitability of the lighting system for this gallery is (superior, good, adequate, marginal, inadequate or no response).
- The overall impression of the gallery under this lighting is (exceptional, favourable, adequate, inadequate in some respects, unacceptable or no response).
One simplifying assumption was made in questions 2 and 3: all visible colour differences in illuminants are to be attributed to colour temperature alone rather than colour temperature and Duv. This distinction is not thought worthy for the purposes of this assessment.
One additional distinction should be made. It is assumed that light sources are to be judged on an equal CCT basis. Some manufacturers supply LEDs both at 2700 K and 3000 K for incandescent replacement. Available field trials have shown that some individuals will have strong opinions about the difference between these two colour temperatures, with preferences going in both directions. Therefore, an evaluation of colour temperature should be made separately from an evaluation of different lamps.
Warranties
A warranty is only one of many pieces of information you will need to make an informed decision, and it may not be the most important for some people. But before purchasing anything, review the written warranty and know what it covers. Warranties may range from as little as 90 days to as long as 10 years. One example specifies a qualified 10-year period with only the LED chip covered between years 5 and 10. If a mechanical or electrical part fails during the latter period, the company may be under no obligation to replace it. A three- or five-year warranty is not uncommon.
These warranties may offer poor consolation if they do not cover loss of good-quality light during aging, arguably the most critical performance parameter for an art museum (consult Duv as a criterion for unacceptable lamp aging). An LED installation may deliver a beautiful white light at the start of its life but shift in only three years to a very noticeable, and unacceptable, shade of magenta. When the client protests, they may learn that their warranty contained no specific qualifier in terms of performance criteria and that as far as the warranty coverage is concerned, as long as the LED produces light, no matter its quality, it is performing fine.
Nevertheless, some manufacturers do take their responsibilities and reputations very seriously, and if a museum has a colour quality performance issue within a three- to five-year period, the manufacturer reserves the right to decide if replacement is justified, even if that is not specified in the warranty.
Specifying performance criteria in warranties is difficult. One would need to specify mean value and acceptable level of variation, how to monitor the criterion and operational limitations. Few institutions are capable of monitoring total lumen output or illuminant colour, and the same retrofit lamp that performs well in a well-ventilated track luminaire may fail from overheating in an enclosed downlight. In addition, some transformers are electronic and some are magnetic. Some have low minimum loading requirements and operate poorly with low-wattage LED replacement lamps. Some may cause colour shift, flickering or unstable output, depending on the circuit design. These potential incompatibilities between the transformer and the retrofit lamp are often difficult to anticipate, so it is important to test out the lamp in situ for more than a week to ensure it will behave as expected.
Some institutions have softened their concerns about warranty by making sure that their ROI payback is shorter than the warranty period.
A suggested outline for a warranty review would be:
- Look for an Energy Star rating first. This ensures that the manufacturer maintains a three-year warranty on craftsmanship and materials.
- What is the stated warranty period, and is it for a specified quality and quantity of light?
- What does the warranty cover? Is it all-inclusive or do you need to read the fine print to discover what it does not cover?
- What are the agreements or pass-through warranties on the main components, such as LED chips, LED packages and drivers, or on other components such as active cooling systems?
- What is the reputation or history of the company? Who do you call if something goes wrong?
- What will be replaced or repaired in the event of a warranty claim? As technology changes rapidly, will an acceptable replacement or an equivalent product be available in five years?
In conclusion, good warranties can be found. The best warranty we have seen when framed in the context of an art museum is one in which LEDs are warranted for 5 years or 25,000 hours, whichever comes first, against manufacturers’ defects for lamps operated on a daily cycle (12 to 14 hours/day). As well, in that case, beyond lamp failure, LEDs are also warranted for 5 years or 25,000 hours if any bulb exceeds 15% lumen depreciation (becomes dimmer) or if a bulb’s CCT value increases or decreases by more than 100 K. To avoid the difficulties in validating performance loss, this manufacturer maintains records on each lamp.
One last piece of advice on warranties applies specifically to LED strip lighting. Ensure that the warranty covers the product as a whole system. Drivers and transformers are not bundled into a single package, like a PAR38 would be. It is possible to mix components that will not perform well together.
Lamp forms in transition
As with any transition in lamp technology, users will continue to think in terms of the old lamps and their forms, and they will look for corresponding forms and properties in the new lamps. LED lamps designed for the home market have followed this approach, but more knowledgeable markets are being provided with LED lamps in new forms that take full advantage of their characteristics. Museums and art galleries bridge these two approaches: retrofit versus dedicated LED design.
Retrofit forms versus dedicated LED design
LED lamps designed for retrofit in existing fittings will necessarily sacrifice some features only possible in LED lamps designed from scratch.
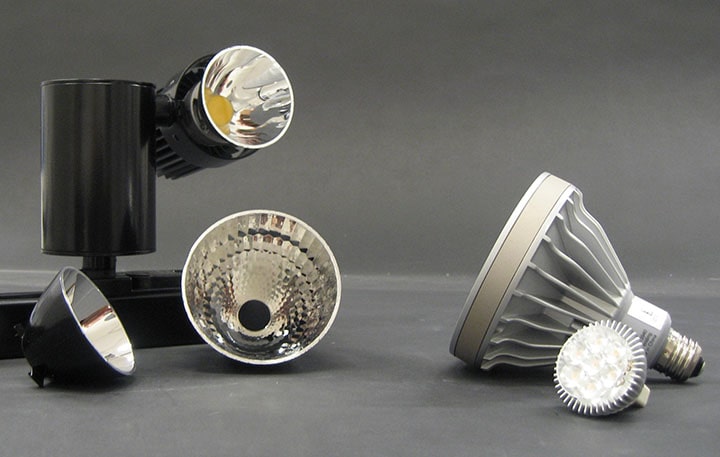
Photo: James R. Druzik. © 2012 J. Paul Getty Trust
Figure 13. Comparison of lamp designs. From left to right: a luminaire with optional MR16 reflectors, a PAR38 lamp and an MR16 lamp.
In Figure 13, the smaller lamp on the right is an MR16 retrofit that will work in many halogen MR16 fixtures requiring the two-pin connection. On the left is a lamp with a dedicated design (not designed as a retrofit) that requires an adapter for a pre-existing track or a custom track.
Be aware that the shape and size of LED MR16 replacement lamps can vary from manufacturer to manufacturer and may or may not fit into a specific luminaire. Also, clips used to hold screens and lenses for halogen lamps may not fit all luminaires equipped with LED retrofits.
Another consideration when comparing retrofit versus dedicated LEDs is heat management. Retrofit lamp products and their integral drivers are electronics, and heat is their Achilles heel. Existing tightly enclosed track heads or luminaires, especially if there is glass blocking airflow, may cause the LED retrofit lamp to overheat and fail prematurely. Dedicated products should be designed with the proper thermal characteristics that will maintain the expected life of the electronics.
Replacing T12 fluorescent lamps
When existing display lighting includes fluorescent lamps, replacement of T12 tubes (1.5 inches in diameter) may be necessary due to failing, the difficulty in finding replacement hardware or concerns about the presence of mercury. While the energy savings for LED replacement lamps can be advertised in the 30 to 40% range, given the individual lamp prices ($50 to $100 each), the cost argument may not be as compelling as for incandescent lamps, since overall cost savings may be difficult to realize. Their lifespans, however, are significantly longer, and they incorporate improved performance such as no warm-up, instant-on status at full light output and stable lamp colour. LED tubes that replace fluorescent lamps may not be available yet in the category of excellent-quality light but can be found in the good-quality category.
The absence of UV from LEDs that use a blue pump (or a violet pump of 415 nm or above) is a great advantage when replacing fluorescent lamps, since UV sleeves are no longer necessary.
Some LED replacements can be installed directly into an existing fluorescent lamp fitting, but others require rewiring of the ballast. Consult the installation guides provided by suppliers online.
Correspondent properties
Existing incandescent lamps encountered in museums range from high-intensity low-voltage pin spots (4 degrees) to wide flood lamps (50 degrees), and from 20-W MR16 to 250-W PAR38 lamps. LED replacements for high wattage lamps and very narrow spots were not always available at the time of writing, and if they were available, they were not necessarily in the good or excellent quality of light categories; however, this situation is changing rapidly.
Some properties that a lighting engineer may want to know when establishing corresponding capabilities between a lamp currently used and a possible replacement LED are centre beam candlepower, beam angle, intensity distribution and illuminance plots, as well as other electrical characteristics. These can be found in IES LM-79 reports (consult the Acknowledgements and Bibliography sections). Others are available directly from the manufacturer.
Return on investment
As with CFLs before them, LED lamps are marketed on the basis of energy savings, and as with CFLs, the more subtle analysis of ROI considers costs of the lamp itself, which has always been higher for newer technologies.
A case study of return on investment
At the time this Bulletin was written, only a few museums could provide detailed data on ROI. Nevertheless, the case of the Brooker Gallery at the Field Museum in Chicago, Illinois, is highly illustrative. The data was provided through the DOE Solid-State Lighting Technology Demonstration GATEWAY Program. Consult the sections Acknowledgements and Bibliography.
Display case illumination ranged from approximately 40 lux to a high of 370 lux. The museum was open 2912 hours per year. This gallery was originally illuminated using 32 halogen track luminaires, but the designer needed only 26 LED track luminaires to light the space. Table 2 shows the simple payback comparing the new and old systems, given the cost of electricity at the time of $0.12 per kWh. We have added a calculation for the common situation where an equal number of luminaires would be used (32).
| Parameter | 32 Halogen | 26 LEDs | Difference for 26 LEDs | 32 LEDs | Difference for 32 LEDs |
|---|---|---|---|---|---|
| Total initial cost | $7,645 | $8,216 | +$571 | $10,112 | +$2467 |
| Annual hours of operation | 2912 | 2912 | 0 | 2912 | 0 |
| Operating power of system | 836 W | 335 W | -501 W | 412 W | -452 W |
| Electricity operating cost | $292.13 | $116.99 | -$175.14 | $143.99 | -$148.14 |
Source: DOE (2010). Demonstration Assessment of Light-emitting Diode (LED) Accent Lighting. Prepared by Pacific Northwest National Laboratory under Contract DE-AC05-76RL01830.
Using the data of Table 2, one obtains a payback time based on electricity costs alone of 3.3 years for the 26 luminaires and 17 years for a one-to-one replacement (32 LEDs). In this project, the DOE estimated a reduction in payback time of about 35% if one included electrical savings due to lower cooling costs plus lower costs for lamp maintenance. This would mean a payback time of about 11 years for one-to-one replacement.
The Field Museum noted that as the LEDs were dimmed by the control system, the illuminance decreased but the measured current did not. This has been noted by others as well and means that although the LEDs save significant energy, any further savings from dimming may be small.
All three sustainability pillars drive decisions to implement lighting conversions as described above. The economic pillar drives the long-term reduction of electrical costs and maintenance costs; the social pillar drives the museum’s goal of heritage preservation; and the environmental pillar drives the selection of lower energy and lower toxicity solutions. A comparison of incandescent, CFL and LED lamps using life-cycle assessment of energy and environmental impacts done by DOE (2013) found LED lamps many times less harmful than incandescent lamps and slightly better than CFLs as long as their aluminum heatsinks can be recycled.
Return on investment in cold climates
In regions with cold climates, ROI calculations that include heating, ventilation and air conditioning costs become less compelling since “waste” heat from lighting does contribute usefully to winter heating, and summer cooling costs are small or non-existent. Relative costs of each form of energy become important. In one ROI scenario that CCI considered for a government building in the far north, it was found that LED lamps would pay back in a few years because the cost of locally generated electricity was much higher than the cost of heating directly with fuel.
Lamp labels and markings
From a museum perspective, two fundamental characteristics of lamps, especially LED lamps, are the CRI and the R9 value. Unfortunately, CRI is often missing and R9 is almost always missing from packaging throughout the world. Regulatory agencies do fix minimum acceptable values for CRI and R9, but their current focus for labelling is energy efficiency. One must look for CRI and R9 specifications in the manufacturers’ catalogues or on technical product sheets.
One can always find the colour temperature, either on the packaging or on the lamp itself.
Lamp labels in Canada and the United States
The agencies responsible for energy efficiency regulations in the U.S. and Canada (the DOE and Natural Resources Canada) have coordinated standards and advice for many years. This coordination was formalized in the joint Regulatory Partnership Statement of the Department of Natural Resources of Canada and the United States Department of Energy (PDF format) in 2015.
The energy efficiency labelling program in Canada and the U.S. is called Energy Star. (For the U.S., consult www.energystar.gov and for Canada, look under the “Energy efficiency” tab on the www.nrcan.gc.ca website.) This program provides consumers with the assurance that electrical products are energy-efficient and will reduce greenhouse gas emissions and other pollutants. For LED lamps and CFLs, it also specifies a minimum CRI of 80, and for LED lamps, it specifies a minimum R9 of 0 (Energy Star 2014). Almost all LED lamps sold for general use in Canada and the U.S. meet Energy Star specifications, hence the large cluster of lamps noted in Figures 3 and 4 where CRI is between 80 and 100. As explained in Summary recommendations, this does not mean that they meet the CRI or R9 values that we consider to represent good-quality or excellent-quality lighting for museums.
A mandatory Lighting Facts label (Canada and U.S.) requires any lamp package to show the light output, the annual energy cost, the life of the lamp, the wattage and the colour temperature, but mentions nothing about the quality of the light. A voluntary label known as LED Lighting Facts is provided by some manufacturers on their LED lamps. It adds CRI to the Lighting Facts list. Unfortunately, even this voluntary label does not provide R9; one must obtain it from a lamp catalogue or a list, such as those provided in the section LED lamps listed by CRI and R9.
Lamp labels in Europe
Standardized labels for lamps in countries of the European Union are simply the same as those used for electrical products in general and only provide energy efficiency information. The label for luminaires does add additional information to alert consumers to the type of lamp that can be installed, so as to reduce fire risk due to overheating by incandescent lamps.
Other characteristics of the lamp such as voltage, wattage and colour temperature will almost always be on the packaging or on the lamp itself, but CRI and R9 are usually absent. In such cases, one needs to examine the markings directly on the lamp for colour temperature and to obtain the manufacturer’s catalogue or specifications sheet for CRI and R9.
Markings directly on the lamps
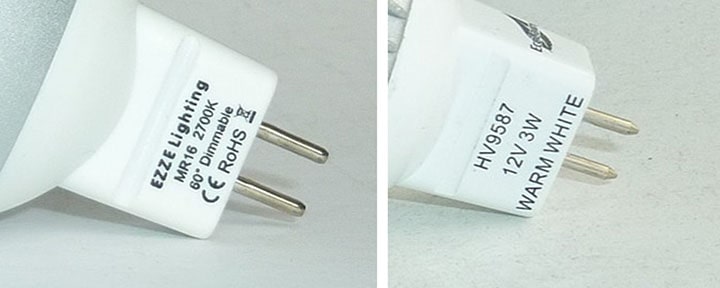
© Government of Canada, Canadian Conservation Institute. CCI 122894-0018
Figure 14. Colour temperature markings on LED lamps, on the left as “2700K” and on the right as “warm white.”
Markings directly on electric lamps, including LED lamps, usually provide voltage, wattage and colour temperature. Colour temperature may be provided as either a number (“2700K” on the lamp on the left side of Figure 14) or an English phrase such as “warm white” (lamp on the right side of Figure 14), a habit developed for fluorescent lamps. Although these phrases are translated in marketing and technical brochures in languages other than English, they do not appear as lamp markings other than in English. Given multinational sales, the common approach is to use colour temperature phrases only on packaging or in marketing texts and to stamp the lamp with the universally understood temperature. Table 3 provides the equivalence between the phrases and the actual colour temperature, based on various online sources.
| Phrases | Colour temperature range |
|---|---|
| Daylight, natural white | 5000 to 6500 K (usually 5000 K) |
| Cool white | 3400 to 5000 K (usually 4000 K) |
| White (not used often) | 3000 K |
| Warm white, soft white | 2700 to 3300 K (usually 2800 K) |
Note: there is no fixed convention; different authorities and manufacturers cite slightly different ranges.
Summary recommendations
For readers looking for a short summary of what to consider when selecting LED lamps in a museum or art gallery, our advice is this:
- Recognize that in terms of the preservation goal, LED lamps do not change the basic rule that light damage is proportional to light intensity (lux) and to exposure time. The fading predictions of the Light damage calculator, found on CCI’s website, for a light source without UV remain the same. LED lamps that provide an adequate quality of light are neither significantly less nor significantly more damaging than other electric lamps that have their UV blocked. LED lamps that produce adequate-quality light do, however, have the practical advantage of not requiring UV filters.
- Decide if you want to retrofit your existing fixtures or to install new fixtures designed around LED lamps.
- Colour temperature is a matter of preference, not quality. Our only recommendation is that one use the same colour temperature for all lamps within a given space. For those who do not wish to experiment with colour temperature, 3000 K is a pleasant all-purpose choice for museum lighting. If you prefer higher colour temperatures, refer to Do LEDs provide good-quality light?
- For good-quality light, select lamps with a CRI of at least 90 and an R9 of at least 50. (These two parameters for light quality are explained in more detail in Do LEDs provide good-quality light?) This information is sometimes available on the lamp packaging; otherwise, it can be found on the manufacturers’ websites. If either CRI or R9 is unavailable, it is safe to assume that the lamp does not meet this specification.
- For excellent-quality light, select lamps with a CRI of at least 90 and an R9 of at least 90. With current technology, this can be simplified to the following: select lamps with an R9 of at least 90. (In 2018, all LED lamps with an R9 over 90 had a CRI over 90.)
- Recognize that the majority of LED lamps sold for the home market and stocked in hardware stores do not meet the above recommendations and that their box does not display information about CRI or R9. The majority meet a standard called “Energy Star” (DOE 2017), which only requires a CRI of 80 and an R9 above 0. This is exactly the same unsatisfactory lighting produced by mediocre CFLs that museums learned to dislike in the past. LED lamps of good and excellent CRI scores are not difficult to find, but you may need to approach lighting specialty suppliers or go online and browse manufacturers’ and suppliers’ catalogues.
- Note that some product literature uses the term Ra rather than CRI. Ra and CRI are the same thing. Ra and R9 are not the same thing.
- Select lamps with written warranties.
- Buy a few test lamps or fixtures and see if you like how everything looks—the objects, the room, the lamps themselves. This is especially important if you decide to look at LED lamps with a lower CRI and R9 than recommended above.
- Get the warranty provided in writing, then buy all the remaining lamps necessary. At the time of publication, we were informed of a large museum installation of LED lamps from a reputable manufacturer that had aged unacceptably after only three years of operation (producing yellow rather than white light). While a three-year replacement cycle may still favour LED lamps in terms of ROI, and even though LEDs will reduce the museum’s carbon footprint compared to that associated with incandescent lamps, the colour stability of LED lamps over many years remains uncertain.
Acknowledgements
Much of the information in this Bulletin about LED lamps is taken from programs created by the DOE, Lighting Research and Development, Building Technologies Program.
For painstaking technical review of various drafts, as well as collegial insights throughout the development of our ideas, we would like to thank:
- Naomi Miller, Senior Lighting Engineer, Pacific Northwest National Laboratory; and
- Tess Perrin, Lighting Scientist, Pacific Northwest National Laboratory.
For valuable practical insights and comments, we would also like to thank:
- Christopher Cuttle, New Zealand, author of Light For Art’s Sake: Lighting for Artworks and Museum Displays;
- Eric Hagan, Senior Conservation Scientist, Canadian Conservation Institute;
- Ken Kane, Lighting Services, Inc.;
- Richard Kerschner, Director of Preservation and Conservation, Shelburne Museum, U.S.; and
- the numerous company representatives in the lighting industry who shared their products with us for laboratory testing.
The first version of this Technical Bulletin was prepared as a guide book for a lighting workshop conducted at CCI in the summer of 2011. Further revisions were made between 2011 and 2016 as numerous designers and conservators requested the guide and reacted to it, and because of the rapid growth of the literature and products. We appreciate the queries, comments and advice of the workshop participants and subsequent readers. The Bulletin was completely revised in 2018, particularly the sections on damage and on preferred colour temperature, the latter based on presentations given at the 1st International Museum Lighting Symposium and Workshops in 2017. Jean Tétreault assisted with technical aspects and terminology in the French version of the Bulletin.
Technical sources of information
LED lamps listed by CRI and R9
One can search for LED lamps of a particular CRI and R9 (as well as bulb type, size, etc.) on the EnergyStar Light Bulbs website and in the LED Lighting Facts database (consult endnote 1).
Product testing (CALiPER)
Solid-state lighting (SSL) technologies are changing and improving rapidly, and products arriving on the market exhibit a wide range of performances. (LED lamps are a subset of SSL.) The DOE Solid-State Lighting Program supports testing of a wide array of LED products available for general illumination and provides detailed test reports.
IES LM-79
These reports are independent laboratory measurements of total flux, electrical power, efficacy and chromaticity of LED lamps. These reports should be available on the manufacturer’s website or upon request. For a description of their content, consult Understanding LM-79 Reports (PDF format).
IES LM-80
The IES LM-80 report measures the luminous flux of LED products under continuous operation. Three temperatures are employed: 55°C, 85°C and a third temperature selected by the manufacturer. Since LED products used in general illumination have not been in existence for as long as their functional lifetime is expected to be, the minimum period of testing was set at 6000 hours, with 10,000 hours preferred, and repeated testing was determined to be needed every 1000 hours. Since the LM-80 only documents lumen maintenance for the period of time it is conducted, a separate estimate method for lifetime (TM-21) is in development. These reports should be available on the manufacturer’s website or upon request.
GATEWAY demonstrations
This program supports demonstration projects of high-performance SSL products. The purpose is to capture empirical data and experience with in-the-field applications that save energy, are cost effective and maintain or improve light levels. These provide a source of independent, third-party data for use in decision making by users and lighting designers. The GATEWAY Program staff suggests that this data be considered in combination with other information relevant to the particular site and application under examination (DOE 2010).
To date, the GATEWAY Program has documented one museum application, at the Field Museum, Chicago, Illinois, in November 2010. Other museums are being considered, including several art museums. Since all GATEWAY Program museum reports can be downloaded online, this is a good place to start examining the issues you are likely to experience. Note that the evaluation questionnaire and the analysis of simple payback from the Field Museum have been adapted and included in the present Bulletin.
Replacements for linear lighting (fluorescent lamps)
Replacing fluorescent lamps with LED lamps raises many specific issues not seen with spot lamp replacement. Individual manufacturers provide detailed installation advice for their products. For an overview of the issues, consult the web page LED Linear Lamps and Troffer Lighting.
Bibliography
Barlier-Salsi, A. “Stray Light Correction on Array Spectroradiometers for Optical Radiation Risk Assessment in the Workplace.” Journal of Radiological Protection 34,4 (2014), pp. 915–930.
Boyce, P.R. Human Factors in Lighting, 3rd ed. Boca Raton, FL: CRC Press, 2014.
Boyce, P.R., and C. Cuttle. “Effect of Correlated Colour Temperature on the Perception of Interiors and Colour Discrimination Performance.” Lighting Research & Technology 22,1 (March 1990), pp. 19–36.
Connors-Rowe, S.A., H.R. Morris and P.M. Whitmore, “Evaluation of Appearance and Fading of Daylight Fluorescent Watercolors.” Journal of the American Institute for Conservation 44,2 (2005), pp. 75–94.
Crews, P.C. “A Comparison of Selected UV Filtering Materials for the Reduction of Fading.” Journal of the American Institute for Conservation 28,2 (1989), pp. 117–125.
Cuttle, C. Lighting by Design, 2nd ed. London, UK: Routledge, 2008.
Fairchild, M.D. Color Appearance Models. 3rd ed. Chichester, UK: John Wiley & Sons, 2013.
Feller, R.L. Accelerated Aging: Photochemical and Thermal Aspects (PDF format). Los Angeles, CA: Getty Publications, 1994.
Flamm, G., O. Howlett, and G. Taylor. Voluntary California Quality Light‐emitting Diode (LED) Lamp Specification, Final Staff Report (PDF format). Los Angeles, CA: California Energy Commission, 2012.
Fotios, S. “A Revised Kruithof Graph Based on Empirical Data.” LEUKOS 13,1 (2017), pp. 3–17.
Gribbin, C., and C. O’Rourke. “T8 Fluorescent Lamps.” NLPIP Lighting Answers 9,1. Troy, NY: Rensselaer Polytechnic Institute, 2006.
Harrison, L.S. Report on the Deteriorating Effects of Modern Light Sources. New York, NY: Metropolitan Museum of Art, 1953.
Heikkilä, A., and P. Kärhä. “Photoyellowing Revisited: Determination of an Action Spectrum of Newspaper.” Polymer Degradation and Stability 99 (2014), pp. 190–195.
International Commission on Illumination. CIE 244:2017, CIE 2017 Colour Fidelity Index for Accurate Scientific Use. Vienna, Austria: International Commission on Illumination, 2017.
Ishii, M., T. Moriyama, M. Toda, K. Kohmoto and M. Saito. “Color Degradation of Textiles with Natural Dyes and of Blue Scale Standards Exposed to White LED Lamps: Evaluation of White LED Lamps for Effectiveness as Museum Lighting.” Journal of Light & Visual Environment 32,4 (2008), pp. 370–378.
Loe, D.L., E. Rowlands and N.F. Watson. “Preferred Lighting Conditions for the Display of Oil and Watercolour Paintings.” Lighting Research & Technology 14,4 (1982), pp. 173–192.
Mabuchi, H., N. Hisaoka, Y. Hayashi and M. Inuzuka. “Study on the Distribution of Temperature and Humidity in Exhibition Cases Equipped with LED Light Devices.” Science for Conservation 54 (2015), pp. 193–203.
Mangum, S.R. “Effective Constrained Illumination of Three-Dimensional, Light-Sensitive Objects.” Journal of the Illuminating Engineering Society 27,2 (1998), pp. 115–131.
McLaren, K. “The Spectral Regions of Daylight Which Cause Fading.” Journal of the Society of Dyers and Colourists 72,3 (1956), pp. 86–99.
Michalski, S. “Damage to Museum Objects by Visible Radiation (Light) and Ultraviolet Radiation (UV).” In Lighting in Museums, Galleries and Historic Houses: A Conference Run by the Museums Association, the United Kingdom Institute for Conservation and the Group of Designers and Interpreters in Museums, at Bristol on 9–10 April 1987. London, UK: The Museums Association, 1987, pp. 3–16.
Michalski, S. “The Lighting Decision.” In Fabric of an Exhibition: An Interdisciplinary Approach – Preprints / L’étoffe d’une exposition : une approche pluridisciplinaire – Prétirages (PDF format). Ottawa, ON: Canadian Conservation Institute, 1997, pp. 97–104.
Miller, C.D. “Kinetics and Mechanism of Alkyl Photooxidation.” Industrial & Engineering Chemistry 50,1 (1958), pp. 125–128.
Miller, N.J., and J.R. Druzik. Demonstration of LED Retrofit Lamps at an Exhibit of 19th Century Photography at the Getty Museum. Richland, WA: Pacific Northwest National Laboratory, 2012.
Millington, K.R. “Photoyellowing of Wool. Part 2: Photoyellowing Mechanisms and Methods of Prevention.” Coloration Technology 122,6 (2006), pp. 301–316.
Morand, J. “Photodegradation of Rubber.” Rubber Chemistry and Technology 39,3 (1966), pp. 537–552.
Nascimento, S.M., and O. Masuda. “Best Lighting for Visual Appreciation of Artistic Paintings – Experiments with Real Paintings and Real Illumination,” Journal of the Optical Society of America A 31,4 (2014), pp. A214–A219.
National Bureau of Standards. Preservation of the Declaration of Independence and the Constitution of the United States (PDF format). NBS Circular 505. Washington, D.C.: National Bureau of Standards, 1951.
Pasha, S., P. Strait and P. Saxton. Voluntary California Quality Light-Emitting Diode (LED) Lamp Specification 3.1 (PDF format). Los Angeles, CA: California Energy Commission. 2017.
Pridmore, R. “Preferred illumination for paintings: Cool–warm balanced colour temperature predicted from radiometry and colorimetry.” Lighting Research & Technology 49,5 (2017), pp. 618–631.
Rea, M.S. and A. Bierman. “Comparison of a Solid-State Luminaire to Tungsten-Halogen Lamps for Displaying Museum Objects.” Journal of the American Institute for Conservation 53,1 (2014), pp. 33–43.
Richardson, E. “Are We Being Too Easily LED? Assessing the Impact of LED Lighting on Pigments and Paints in Heritage Collections.” Talk presented at the 1st International Museum Lighting Symposium and Workshops. London, UK, September 12, 2017.
Royer, M., and K. Houser. “Understanding and Applying TM-30-15.” (PDF format) DOE+IES Webinar, September 15, 2015.
Saunders, D. and J. Kirby. “Wavelength-dependent Fading of Artists’ Pigments.” In Preventive Conservation: Practice, Theory and Research. Preprints of the Contributions to the Ottawa Congress, 12–16 September 1994. London, UK: International Institute for Conservation of Historic and Artistic Works, 1994, pp. 190–194.
Szabo, X. “The Preferred Conditions of LED Lighting for Fine Art Paintings: The Influence of Illuminance Level and Correlated Colour Temperature.” Talk presented at the 1st International Museum Lighting Symposium and Workshops. London, UK, September 12, 2017.
Thomson, G. The Museum Environment. London, UK: Butterworths, 1978.
U.S. Department of Energy. LED Color Characteristics: Solid-State Lighting Technology Fact Sheet (PDF format). Washington, D.C.: U.S. Department of Energy, 2012.
U.S. Department of Energy. Life-Cycle Assessment of Energy and Environmental Impacts of LED Lighting Products (PDF format). Washington, D.C.: U.S. Department of Energy, 2013.
U.S. Department of Energy. ENERGY STAR® Program Requirements for Lamps (Light Bulbs) – Partner Commitments (PDF format). Washington, D.C.: U.S. Department of Energy, 2017.
Wei, M., K.W. Houser, A. David and M.R. Krames. “Perceptual Responses to LED Illumination With Colour Rendering Indices of 85 and 97.” Lighting Research and Technology 47,7 (2014), pp. 810–827.
Wilkins, A., J. Veitch and B. Lehman. "LED Lighting Flicker and Potential Health Concerns: IEEE Standard PAR1789 Update." In 2010 IEEE Energy Conversion Congress and Exposition. [N.p.]: Institute of Electrical and Electronics Engineers, 2010, pp. 171–178.
Yoshizawa, N., Y. Mizokami, C. Sano and N. Yoshida. “A New Standard for Museum Lightings in Japan.” Talk presented at the 1st International Museum Lighting Symposium and Workshops. London, UK, September 12, 2017.
Zhai, Q.Y., M.R. Luo and X.Y. Liu. “The Impact of Illuminance and Colour Temperature on Viewing Fine Art Paintings under LED Lighting.” Lighting Research & Technology 47,7 (2015), pp. 795–809.
© Government of Canada, Canadian Conservation Institute, 2020
Published by:
Canadian Conservation Institute
Department of Canadian Heritage
1030 Innes Road
Ottawa, Ontario K1B 4S7
Canada
Cat. No.: CH57-3/1-36-2020E-PDF
ISSN 2562-0282
ISBN 978-0-660-33905-4