
Briefing binder created for the Minister of Finance and National Revenue on the occasion of his appearance at the House of Commons Committee of the Whole on May 26, 2026 on the Main Estimates 2026-27
Table of contents
- Questions and Answers
- Core Narratives
- Key Issues
- Spring Economic Update 2026:
- Major Measures:
- Affordability (Overview of Government Actions):
- Alto Conflict of Interest Filter
- Auto Sector Support
- Canada-U.S. Trade and Tariffs
- Canada-China New Strategic Partnership
- Climate Policy
- Comprehensive Expenditure Review (CER):
- Combatting Financial Crimes (Anti-Money Laundering Measures)
- Defence Spending
- Major Projects Office
- Major Transfers to Provinces and Territories
- CRA Key Issues
- Main Estimates 2026-27
Top Issues: Questions and Answers
Affordability
Issue
The Conservative Party has raised concerns about gaps between government messaging and Canadians' lived experiences with affordability challenges, citing food bank use, grocery, fuel and shelter costs as evidence of their continued financial strain.
The party consistently links affordability challenges to government spending and argues government policies have failed to reduce, and even exacerbated, cost pressures.
Response:
- Inflation has remained within the Bank of Canada's target control range of 1 to 3 percent for more than two years, and wages have outpaced prices for over three years, improving purchasing power for many Canadians. However, many Canadians still feel their budgets are strained.
- To help Canadians manage persistent cost pressures, the government is pursuing a three-pillar approach that combines immediate relief with longer-term structural reforms by:
- Providing direct support for household budgets through:
- a middle-class tax cut, providing nearly 22 million Canadians with tax relief of up to $420 per person, saving two-income families up to $840 this year;
- the new Canada Groceries and Essentials Benefit, providing $11.7 billion in additional support over six years to over 12 million Canadians; and
- the permanent National School Food Program, providing meals to 400,000 more kids every year.
- Reducing key cost pressures where the federal government can by lowering childcare costs, cellular bills, gasoline costs, and parts of the food supply chain.
- Addressing the structural drivers of affordability with long-term measures focused on boosting productivity, expanding housing supply, and strengthening competition.
- Providing direct support for household budgets through:
Issue
The New Democratic Party has criticized the government for failing to take stronger action to address food price increases, including measures related to excess profits.
Response:
- Recently, food price increases have included specific products such as beef, coffee, cocoa, and lettuce. Global supply chain shocks caused by tariffs, a changing climate, and geopolitical disruptions have caused food prices to rise faster than overall inflation.
- The government has recently announced new measures to make groceries and other essentials more affordable:
- A Canada Groceries and Essentials Benefit that will increase by 25% for five years beginning in July 2026, and a one-time top-up payment to be issued June 5th, equivalent to a 50% increase this year. This will deliver $3.1 billion in immediate assistance to individuals and families who currently get the credit.
- Setting aside $500 million from the Strategic Response Fund to help businesses address the costs of supply chain disruptions.
- $150 million for a Food Security Fund under the existing Regional Tariff Response Initiative.
- Immediate expensing for greenhouse buildings.
- $20 million for food banks through the Local Food Infrastructure Fund.
- Developing a National Food Security Strategy that strengthens domestic food production and improves access to affordable, nutritious food, including measures to encourage unit price labelling and support the work of the Competition Bureau.
- $36 million to address food security and affordability in the North through the Nutrition North Canada Retail Subsidy Program and the Northern Isolated Community Initiatives Fund.
Canada Strong Fund
Issue
The Conservatives have strongly criticized the Canada Strong Fund, characterizing it as "debt-funded" or a "sovereign debt fund" rather than a true wealth fund. Both the Conservatives and Bloc Québécois have asked for details on the Fund regarding costing, borrowing and debt projections, and the estimated return on investment.
Response:
- The Canada Strong Fund will invest in key, strategic Canadian projects and companies, creating jobs, supporting innovation, and helping Canada stay competitive in a rapidly changing world.
- The government will provide $25 billion over 3 years, on a cash basis, to seed the Canada Strong Fund.
- Canadians will have the opportunity to invest in the Fund, giving them a direct stake in our country's growth and the ability to share in its success.
- The returns will be reinvested to grow the Canada Strong Fund, strengthening its capacity over time. As the Fund grows, it will direct capital toward investments with the highest potential return for Canada and Canadians.
Climate Policies
Issue
The Conservative Party opposes federal carbon pricing frameworks and has advocated repealing all taxes on fuel to improve affordability for Canadians.
Response:
- The government's removal of the consumer carbon price has driven gas prices down by about 18 cents per litre across most provinces and territories.
- Temporarily suspending the federal fuel excise tax until Labour Day has already reduced Canadians' bills at the gas station by up to 10 cents per litre on regular gasoline and 4 cents on diesel.
- That said, the government has been clear that a price on pollution for large emitters would continue to be a key component of its plan to build a strong economy and greener future.
- Carbon pricing systems for industry are critical in keeping costs low to protect against competitiveness risks, while driving investment in the technologies that will shape the clean economies of the future and create good jobs.
Issue
The Bloc Québécois opposes Carbon Capture, Utilization, and Storage (CCUS). They have spoken in opposition to the investment tax credit, stating that it disproportionately benefits the oil and gas sector.
Response:
- The Investment Tax Credit (ITC) for Carbon Capture, Utilization, and Storage (CCUS) is crucial because it encourages private sector investments in Canadian clean technology assets.
- The tax credit ensures Canadian businesses remain globally competitive and supports Canada's emission reduction targets and achieving net-zero emissions by 2050.
- The tax credit is not intended to be a support to increase oil production, and applies to heavy industrial sectors (concrete, plastics, fuels) that are otherwise difficult to decarbonize, ensuring these industries remain competitive while lowering emissions.
Comprehensive Expenditure Review
Issue
The Conservative Party has been critical of the government's expenditure review particularly because it has not directly reduced the deficit.
The Bloc Québécois and NDP have expressed concern that spending restraint could impact public services and social programs.
Response:
- The government has made a clear commitment to fiscal discipline and, through Budget 2025, delivered on the Comprehensive Expenditure Review to reduce operational inefficiencies and redirect resources toward priorities.
- The Comprehensive Expenditure Review will amount in $60 billion in savings over five years.
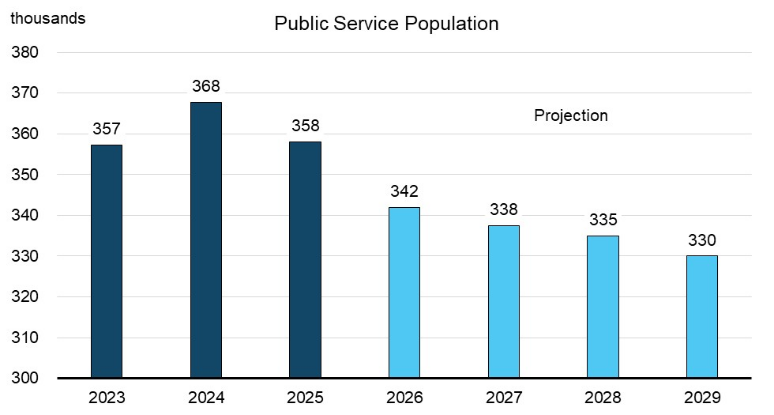
- To support a more sustainable public service, the review represents a total reduction of about 40,000 positions—from the peak of almost 368,000 in 2023-24 to roughly 330,000 by 2028-29.
- Canada's new government will balance Canada's operating budget within three years by making responsible, pragmatic choices—shifting the composition of spending toward capital investments that will grow the economy and prosperity for Canadians. We will make smart, generational investments to build the country we want for ourselves.
- Greater efficiency will allow resources to be directed towards increasing public service productivity and improving how services are delivered to Canadians, particularly through the integration of technology and artificial intelligence (AI).
Debt Management
Issue
The Conservative Party has criticized the deficits projected in Budget 2025 and the Spring Economic Update because they increase debt-servicing costs that are passed on to Canadians.
They have raised concerns that new spending commitments rely heavily on borrowing and optimistic economic assumptions.
Response:
- When looking at the public debt charges as a percentage of GDP, that share is near historical lows (1.7 % for FY 2026-27), and below the historical average of 3.2% over the past 40 years.
- Canada's current public debt charges are sustainable.
- Our deficit is $11.5 billion lower than estimated in Budget 2025 – and lower in each year.
Canada has one of the strongest fiscal positions in the G7—with low deficits and by far the lowest net-debt-to-GDP ratio. Canada is also one of only two G7 economies, alongside Germany, to maintain AAA ratings from major global credit rating agencies.
- While market interest rates are beyond government's direct control, the government continues to monitor public debt charges and is committed to maintaining stable and low debt servicing costs over time.
Issue
The Conservative Party has expressed concern that Canada's public debt charges exceed the Canada Health Transfer.
Response:
- Transfer payments make up approximately 59.8% of expenditures or $300.5 billion. Operating and capital expenditures account for approximately 29.5% of expenditures or $148.6 billion, while public debt charges (excluding interest payments related to capital leases) are approximately 10.7% of expenditures or $53.7 billion.
- Moreover, public debt charges have been and will be lower in 2025-26 and 2026-27 due to lower average effective interest rates, and improvements in the budgetary balance.
- The Canada Health Transfer, Canada Social Transfer, and Equalization grow with their respective legislated escalators.
- The remaining major transfers to provinces, territories, and municipalities grow according to their respective factors, such as nominal GDP, the respective populations, inflation, and current legislation or agreements.
Defence Spending
Issue
The Conservative Party has criticized the government's defence spending as delayed or reactive, questioning whether increases are driven by external pressure or to create actual military capability improvements.
For their part, the Bloc Québécois and NDP have raised concerns about increased defence spending diverting resources from social program priorities.
Response:
- In response to a more challenging and divided world, Canada has strengthened its defence capacities, including with more than $63 billion to rebuild, rearm, and reinvest in the Canadian Armed Forces. This is the single largest year-on-year increase in defence investment in generations.
- In March 2026, NATO confirmed that Canada achieved its 2 per cent of GDP core defence expenditure target. Canada is on a path to meet the NATO's target of investing 5 per cent of GDP in defence by 2035.
- At the same time, the government will continue to protect the essential social programs that give Canadians a fair chance to get ahead—child care, dental care, and pharmacare – as well as delivering new benefits like the Canada Groceries and Essentials Benefit, and the newly permanent National School Food Program.
Financial Crimes
Issue
The Conservative Party has criticized Canada's ability to combat money laundering and financial crime, questioning whether new institutional measures will improve enforcement outcomes.
Similarly, the NDP has emphasized the growing impact of fraud and scams on vulnerable Canadians, calling for stronger consumer protections and measurable enforcement results.
Response:
- The Spring Economic Update 2026 takes action to protect people, crack down on criminals, and keep Canadians' money safe, including by:
- Establishing the Financial Crimes Agency as a best-in-class law enforcement agency with the personnel, resources, mandate, and legislative tools needed to tackle sophisticated financial crimes and recover illicit proceeds.
- Cracking down on the criminal abuse of money services businesses for money laundering, terrorist financing, sanctions evasion, and fraud through stronger regulations, new enforcement powers, and a ban on crypto ATMs.
- Advancing the National Anti‑Fraud Strategy, with a public consultation launched in March 2026, by seeking feedback on the introduction of a multi-sector anti-fraud framework across the financial and telecommunications sectors, and digital platforms, alongside measures to strengthen public awareness of fraud.
Fiscal and Economic Policy
Issue
The Conservative Party and Bloc Québécois have questioned the government's fiscal framing, including its fiscal anchors, debt servicing costs, and debt calculation methods.
The Bloc Québécois has also criticized the government's decision to change its fiscal anchors, arguing that it reduces transparency by obscuring debt increases relative to GDP.
Response:
- Budget 2025 marked a strategic shift in the government's management of public finances, focused on reducing operating expenses while expanding federal capital spending to mobilise investment.
- With significant investments to support infrastructure, innovation, and the development of domestic industrial capabilities, Budget 2025 set out a clear plan to build the strongest economy in the G7.
- Consistent with this approach, decisions in the Spring Economic Update are guided by the government's two fiscal anchors: balancing operating spending with revenues by 2028-29 and maintaining a declining deficit-to-GDP ratio.
- Canada has one of the strongest fiscal positions in the G7—with low deficits and by far the lowest net-debt-to-GDP ratio. The IMF expects Canada to record the second strongest growth in the G7 for the next two years.
- The government's economic plan is fiscally sustainable. Modelling scenarios developed by the Department of Finance Canada show the federal debt-to-GDP ratio on a declining trajectory over the longer term.
Issue
Particularly the Conservative Party has expressed scepticism about the Capital Budgeting Framework, insinuating it is a way to obscure the actual size of the federal deficit.
Response:
- The government is adopting a Capital Budgeting Framework—a new way of budgeting that makes capital investment a national priority.
- This framework helps distinguish day-to-day operational spending from capital investment (broadly defined as spending that supports capital formation), allowing the government to identify and prioritise initiatives that deliver long-term economic returns and increased productivity.
The new framework also increases transparency, allowing Canadians to better understand what funds services today, and what builds future prosperity.
Issue
The Conservative Party has raised concerns about Canada's long-standing productivity gap, arguing the government lacks a coherent plan to generate business investment, growth, and meaningfully improve Canadians' quality of life.
Response:
- Budget 2025 introduces a plan to enable $1 trillion in total investments over the next five years in Canada. Through targeted tax incentives, major infrastructure projects, stronger competition, and a bold new approach to attracting talent, Budget 2025 sets the foundation for long-term prosperity, so we can build the strongest economy in the G7.
- Canada leads the G7 in inward FDI per capita, highlighting the attractiveness of our market for global businesses.
- Canada has the lowest marginal effective tax rate (METR) in the G7, making it the most competitive jurisdiction in the G7 for new business investment and trade.
- The Spring Economic Update 2026 builds on this plan with several measures to support investment, productivity, and growth, including by:
- launching Canada's own sovereign wealth fund, the Canada Strong Fund, to invest in the projects and companies that are driving Canada's economic transformation;
- launching Canada's first Investment Summit in September 2026 to convene the world's largest investors, including top CEOs, entrepreneurs, and prominent global business leaders;
- providing $103.8 million to establish the Defence Investment Agency as a stand-alone entity; and
- by launching a Whole-of-Government Competition Plan to strengthen productivity and affordability.
Issue
The Conservative Party has raised concerns about Canada's unemployment rate, particularly among youth and the skilled trades sector.
Response:
- Young Canadians are gaining opportunities to work and build careers, with 175,000 placements supported in 2026-27 through Canada Summer Jobs, the horizontal Youth Employment and Skills Strategy, and the Student Work Placement Program.
- Team Canada Strong will recruit, train, and hire 80,000 to 100,000 new Red Seal skilled trades workers by 2030-31, providing paid pathways for young Canadians into building housing, major infrastructure, and defence projects at speed and scale.
Housing
Issue
The Conservative Party has raised concern about housing supply, citing declining housing starts and construction. Furthermore, they have raised concerns that Build Canada Homes will add bureaucracy to homebuilding and are skeptical of the program's efficiency.
Response:
- The government launched Build Canada Homes, investing $13 billion to scale up affordable housing and catalyze a new housing industry, and eliminated GST for first-time home buyers on homes up to $1 million and reduced GST on homes priced between $1 million and $1.5 million.
- We also introduced Bill C-26, Improving Housing Supply Act, which will provide $1.7 billion to provinces and territories to boost housing supply, such as by reducing development fees or levies on new home construction.
International Trade and Tariffs
Issue
The Conservative Party has framed tariffs as part of a broader competitiveness issue in Canada, making connections between trade impacts with critiques on excessive regulation and the government's economic management.
Response:
- Budget 2025 signaled the government's intention to double combined goods and services exports to non-U.S. markets over the next decade.
- Since then, non-U.S. goods and services exports increased by $33 billion in 2025 compared to 2024, on the way to meet the target of generating $300 billion more in overseas trade in a decade.
- Approximately 85 per cent of Canada's exports to the U.S. remain tariff-free, with the effective average tariff rate on Canadian exports of 5.2 per cent (compared to the global average of 11 per cent).
- The new Trade Diversification Strategy—backed by signing 20 new deals on four continents— is reinforcing this momentum.
- At the same time, the government is focused on strengthening Canada's competitiveness by reducing internal trade barriers, reducing unnecessary red tape and pairing that with measures like the new Productivity Super-Deduction, broad-based investment tax credits, enhancements to the Scientific Research and Experimental Development Tax Incentives, and faster approvals of major nation-building projects to encourage investment and ensure Canada remains one of the most competitive places to invest.
Issue
The Conservative Party has expressed concern that electric vehicles (EVs) imported to Canada as part of its new strategic partnership with the People's Republic of China will negatively impact domestic auto sector investments and employment.
Response:
- As the world's second-largest economy, China presents enormous opportunities for Canada in our mission to diversify our trade partnerships and catalyse massive new levels of investment, including with the recent arrangement on electric vehicles with China.
- Under a new strategic partnership with China, Canada will allow up to 49,000 EVs into the Canadian market per year at a most-favoured nation tariff rate of 6.1 per cent. This amount corresponds to volumes in the year prior to recent trade frictions (2023-24), representing less than 3 per cent of the Canadian market for new vehicles sold in Canada.
- It is expected that within three years, this new agreement will drive considerable new Chinese joint-venture investment in Canada with trusted partners to protect and create new auto manufacturing careers for Canadian workers and ensure a robust build-out of Canada's EV supply chain.
- At the same time, to strengthen Canada's auto manufacturing sector and protect over 500,000 workers, we are boosting investment, strengthening our climate goals, and protecting Canadian auto workers.
- In response to persisting and unjustified U.S. tariffs on Canadian-made vehicles, we will maintain our reciprocal counter-tariffs and explore ways to leverage Canada's automotive duty remission framework to reinforce domestic production, attract new investment and enhance the sector's long-term competitiveness.
Issue
The Bloc Québécois has emphasized the urgency of addressing U.S. tariffs, seeking support for Quebec's manufacturing and forestry sectors. They have advocated for targeted wage subsidies to support impacted sectors.
Response:
- Budget 2025 set out more than $25 billion to support workers and businesses impacted by U.S. tariffs and trade disruptions.
- This included $5 billion to deliver reskilling and income support to workers, $11.4 billion to ensure access to liquidity for businesses, $6 billion to help companies pivot, grow and diversify markets, $1.7 billion to support domestic agriculture, fish and seafood industries, and $1.2 billion to support our forestry sector.
- The government also established a tariff remission framework to provide timely relief to eligible companies, including pertaining to imports under its China tariffs, U.S. tariffs, steel tariff rate quotas, and steel derivative tariffs.
- Additionally, horizontal relief from counter tariffs against the U.S. is available for aluminum inputs to Canadian manufacturing, processing, agricultural production, and food and beverage packaging, as well as for steel inputs to autos, aerospace, and related parts production.
Transfers to Provinces and Territories
Issue
The Bloc Québécois frequently advocates for increasing federal transfer amounts to Quebec without conditions, emphasizing Quebec's jurisdictional authority to identify and address the needs of its population. They may focus on Canada Health Transfer amounts, having argued that current amounts are insufficient to address current healthcare needs and an aging population.
Response:
- Major transfers to provinces, territories, and municipalities have increased due to higher projected nominal GDP, which results in upward revisions to Equalization and Canada Health Transfer payments in the outer years, partially offset by higher projected recoveries with respect to the Quebec Abatement.
- There is also an increase in 2026-27, as $695 million in future funding for Canada-wide early learning and childcare was moved into that year.
- This follows a consistent, multi-year trend of growth designed to support provincial services, particularly in health care.
Economic and Inflation Narrative
Key Messages
- The Canadian economy has remained resilient even as tariffs increased and trade tensions weighed on activity. Notably, real GDP grew by 1.7 per cent in 2025, the second highest of the G7. While activity softened over the course of 2025, real GDP is expected to expand at a solid pace the first quarter of 2026.
- Business and consumer confidence have improved from the lows seen in 2025. Exports have begun to recover, supported by continued diversification toward non-U.S. markets. Canada also remains a magnet for global investment, with foreign direct investment at its highest level in two decades, and growth in business investment is resuming.
- Since December 2024, Canada has added more jobs per capita (2.8 per 1,000 of population) than the U.S. (1.5 per 1,000).
- The unemployment rate remains elevated. The rise in the unemployment rate largely reflects more people re-entering the labour force, which is a sign of continued confidence in job prospects. And wage growth has outpaced inflation for over three years, supporting continued gains in real incomes.
- As expected, the conflict in the Middle East has pushed gasoline prices higher and is the main driver of the recent rise in inflation, to 2.4 per cent in March 2026. Even with this increase, inflation has remained within the Bank of Canada's 1 to 3 per cent target range for 27 consecutive months.
- Higher energy prices will keep inflation higher over the next few months. These external pressures—largely beyond our control—are adding to affordability challenges for Canadians, particularly for everyday essentials. That is why the government recently announced a temporary suspension of the federal fuel excise tax on gas and diesel, to provide immediate relief at the pump.
- The Middle East conflict is also weighing on the global outlook. Still, the IMF expects Canada to record the second strongest growth in the G7 this year and next year.
Details & Supplementary Information
- After a weak first half of 2025, economic activity resumed in the second half of the year as global conditions stabilized and domestic demand held up better than expected. This momentum has continued so far in 2026. Recent data indicate that the economy likely grew just below 2% in the first quarter of 2026, benefitting from a continued rebound in exports and business investment. The official GDP growth number for the first quarter will be released on May 29.
- The labour market has been soft. The number of jobs has fallen by 112,000 since the start of the year, reflecting declines in full-time work. Still, broad labour market conditions have been resilient given the challenging context for the Canadian economy. The unemployment rate, at 6.9%, is only marginally higher than it was at the start of 2025. Some of the recent increase also largely reflects that more Canadians are returning to the labour force and looking for jobs. Notwithstanding recent volatility, the Canadian economy has added 77,000 jobs since August 2025. On a per-capita basis, Canada has added 2.8 jobs since the start of 2025, compared with 1.5 in the U.S.
- Business sentiment has continued to improve. Firms are adapting to the new trade environment and partly mitigated the impact of tariffs by diversifying export markets and building inventories. Furthermore, 85% of Canada's trade with the U.S. remains tariff-free, and the average tariff rate on Canadian goods is the lowest among major U.S. trading partners. Canada leads the G7 in inward FDI per capita, highlighting the attractiveness of our market for global businesses. Going forward, the impacts of the conflict in the Middle East could reverberate on firm sentiment, with energy prices having risen sharply since late-February.
- The conflict will also push inflation higher over the coming months. Inflation was well contained prior to the conflict, having remained within the Bank of Canada's target range for 27 consecutive months. It has since started to increase due to higher gasoline prices. Headline inflation was 2.4% in March and could have risen to above 3% in April, with the official number released on May 19. Positively, underlying inflation pressures have continued to ease overall.
- Prolonged disruptions would however lead to higher prices for other key items. Food prices would be particularly at risk given the importance of energy supplies from the Middle East for the global fertilizer market and their exposure to transportation costs. This would compound recent pressures, including low crop yields, severe weather, transportation costs and other input costs, which have put upward pressure on food prices.
- To help Canadians manage persistent cost pressures, the government is providing immediate relief and enacting long-term structural reforms. This includes the Canada Groceries and Essentials Benefit, as well as reducing key cost pressures where the government can influence prices, such as child care, cellular bills, gasoline costs and parts of the food supply chain.
- Housing affordability also remains challenging, but policy actions are translating into meaningful results. The supply of homes is expanding, driven by purpose-built rental construction. Meanwhile, the 2026-2028 Immigration Levels Plans is helping return population growth to more sustainable levels. Taken together, this has contributed to narrow the housing supply gap. Asking rents for new leases are down around $300 in Toronto and Vancouver over the last two years.
- Looking ahead, the economy is expected to regain momentum gradually throughout 2026. Private sector economists' expectations remain broadly unchanged since Budget 2025, while the IMF expects Canada to be the second-fastest growing G7 economy.
- The government is making generational investments in housing, infrastructure, defence, productivity and competitiveness. These investments will drive productivity, boost the capacity of Canada's economy and secure a prosperous future for Canadians.
| Quarterly Annualized Growth (2025Q4) |
Year-over-Year Growth (2025Q4/2024Q4) |
|
|---|---|---|
| Italy | 1.3 | 0.9 |
| Japan | 1.3 | 0.5 |
| Germany | 1.0 | 0.4 |
| France | 0.8 | 1.3 |
| U.S. | 0.5 | 2.0 |
| U.K. | 0.2 | 1.0 |
| Canada | -0.6 | 0.7 |
| 2025 | 2026 | 2027 | ||
|---|---|---|---|---|
| Department of Finance – SEU 2026 | 1.7 | 1.1 | 1.9 | |
| IMF World Economic Outlook – April 2026 | 1.7 | 1.5 | 1.9 | |
| OECD Economic Outlook – March 2026 | 1.7 | 1.2 | 1.7 | |
| Bank of Canada Monetary Policy Report – April 2026 | 1.7 | 1.2 | 1.6 | |
| PBO Economic and Fiscal Outlook – September 2025 | 1.2 | 1.3 | 1.8 | |
| Department of Finance – Budget 2025 | 1.6 | 1.2 | 2.0 | |
| 2025 | 2026 | 2027 | ||
|---|---|---|---|---|
| Department of Finance – SEU 2026 | 2.1 | 2.5 | 1.9 | |
| IMF World Economic Outlook – April 2026 | 2.1 | 2.5 | 2.1 | |
| OECD Economic Outlook – March 2026 | 2.1 | 2.4 | 2.0 | |
| Bank of Canada Monetary Policy Report – April 2026 | 2.1 | 2.3 | 2.0 | |
| PBO Economic and Fiscal Outlook – September 2025 | 1.9 | 1.6 | 1.8 | |
| Department of Finance – Budget 2025 | 2.1 | 2.0 | 2.0 | |
| Feb-26 | Mar-26 | Apr-26 | Latest Change | |
|---|---|---|---|---|
| Russia | 5.9% | 5.9% | n.a. | 0.0 p.p. |
| G20 | 3.7% | 4.0% | n.a. | 0.3 p.p. |
| OECD | 3.4% | 4.0% | n.a. | 0.6 p.p. |
| Australia1 | 3.2% | 3.6% | 4.1% | 0.5 p.p. |
| Norway | 2.7% | 3.6% | n.a. | 0.9 p.p. |
| United Kingdom2 | 3.2% | 3.4% | n.a. | 0.2 p.p. |
| United States | 2.4% | 3.3% | n.a. | 0.9 p.p. |
| G7 | 2.1% | 2.8% | n.a. | 0.7 p.p. |
| Germany | 1.9% | 2.7% | 2.9% | 0.2 p.p. |
| Netherlands | 2.4% | 2.7% | 2.8% | 0.1 p.p. |
| Euro area | 1.9% | 2.6% | 3.0% | 0.4 p.p. |
| Canada | 1.8% | 2.4% | n.a. | 0.6 p.p. |
| Italy | 1.5% | 1.7% | 2.8% | 1.1 p.p. |
| France | 0.9% | 1.7% | 2.2% | 0.5 p.p. |
| Japan | 1.3% | 1.4% | n.a. | 0.1 p.p. |
| Denmark | 0.7% | 1.2% | n.a. | 0.5 p.p. |
| China | 1.3% | 1.0% | n.a. | -0.3 p.p. |
| Sweden | 0.5% | 0.5% | -0.1% | -0.6 p.p. |
| Switzerland | 0.1% | 0.3% | 0.6% | 0.3 p.p. |
|
1 Australia reports inflation on a quarterly basis. Inflation data is for 2025Q3, 2025Q4, and 2026Q1.
2 Inflation for the U.K. presented here is HCPI (CPI including owner occupied housing costs) for greater comparability with Canada. The U.K.'s headline inflation (excluding owner occupied housing costs and commonly reported in the media) was 3.3% in March. |
||||
Productivity Narrative
Key Messages
- Canada's productivity growth lags that of other G7 economies with only 0.3 per cent annual growth over 2014-2024. However, in 2025 Canada's business sector productivity picked up, growing more than 1 per cent.
- Perennially weak productivity growth is closely tied to longstanding weakness in business investment. The most immediate way to jumpstart productivity growth is to address structural impediments and increase investment—in machinery, equipment, innovation, and infrastructure that allow workers to build faster and at a more competitive cost.
- Budget 2025 did exactly this with significant investments in infrastructure and emerging technologies, lower taxes on new investment and research and development, cut red tape, and accelerate major projects.
- Building on this momentum, the measures in the Spring Economic Update 2026 will further increase speed and scale of investment. It will mobilize additional capital for nation-building projects through new Canada Strong Fund while expanding skilled trades workforce essential for their construction. It will fund housing infrastructure and improve regulation to support adoption of productivity-enhancing construction technologies.
Details & Supplementary Information
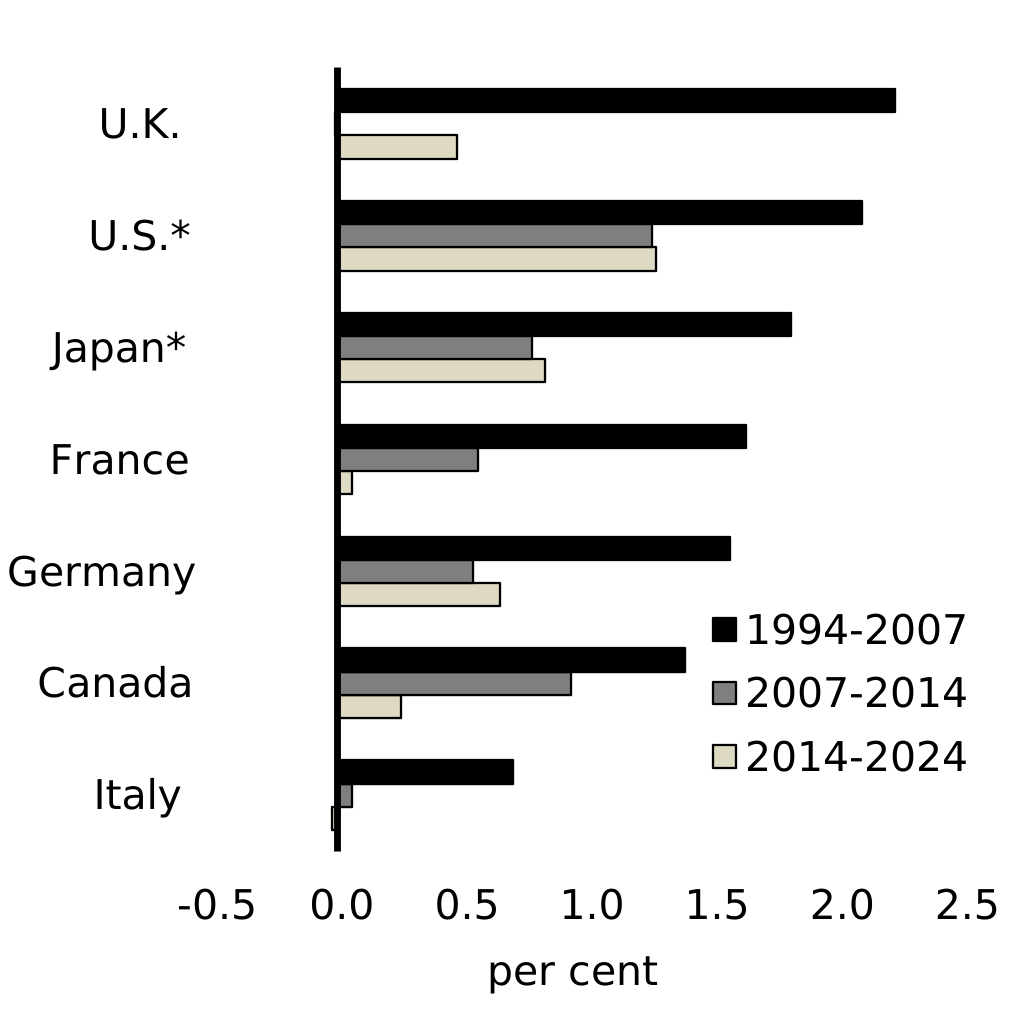
- Canada's productivity growth has been persistently weak and has generally lagged most G7 peers (Chart 1).
- From 2014 to 2024, it slowed to well below its pace over the 1994–2014 period.
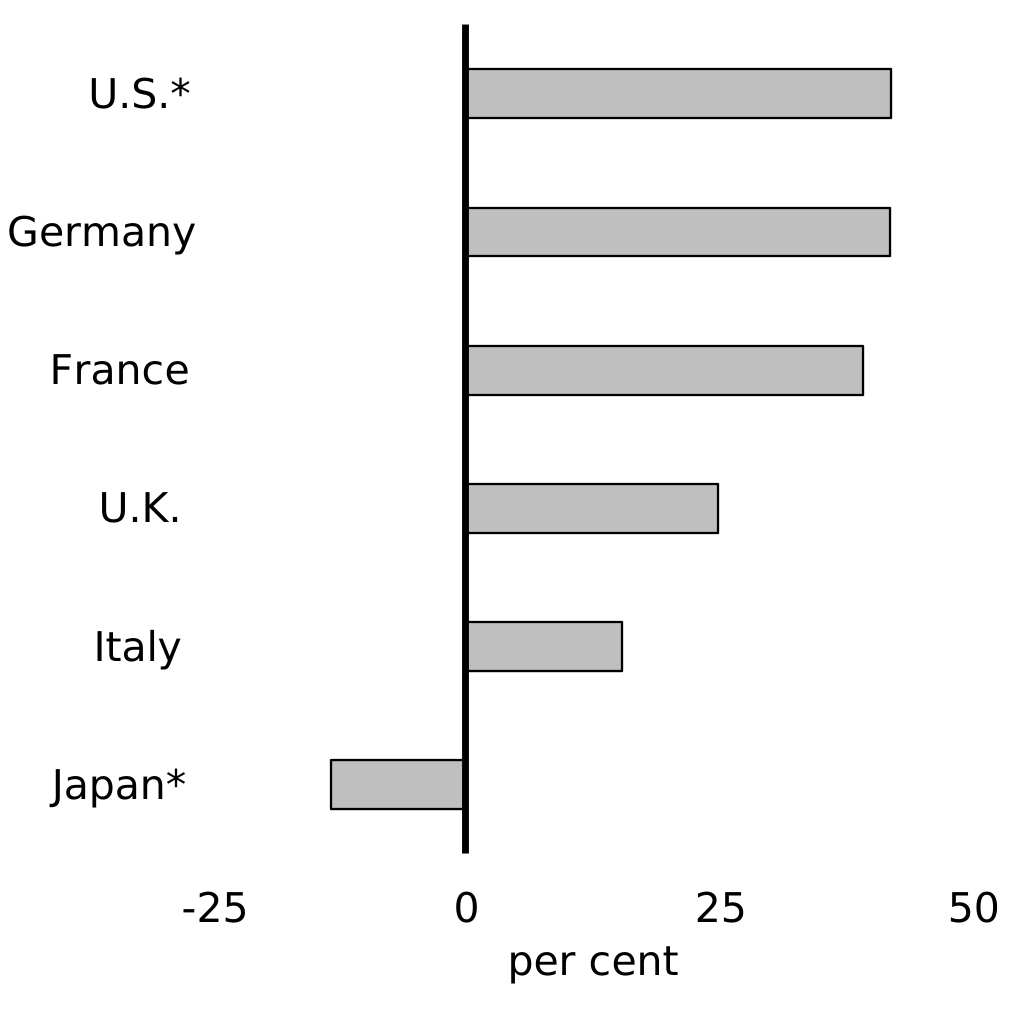
- This has contributed to a substantial productivity level gap between Canada and other G7 economies (Chart 2).
- The economic impact of this gap is significant—if Canada's productivity growth had matched the U.S. from 2017 to 2023, the median income of a family with one child would be nearly $10,000 higher.
Labour Productivity Growth, Total Economy, G7
Labour Productivity Level Relative to Canada, Total Economy, 2024
Enter the chart text version.
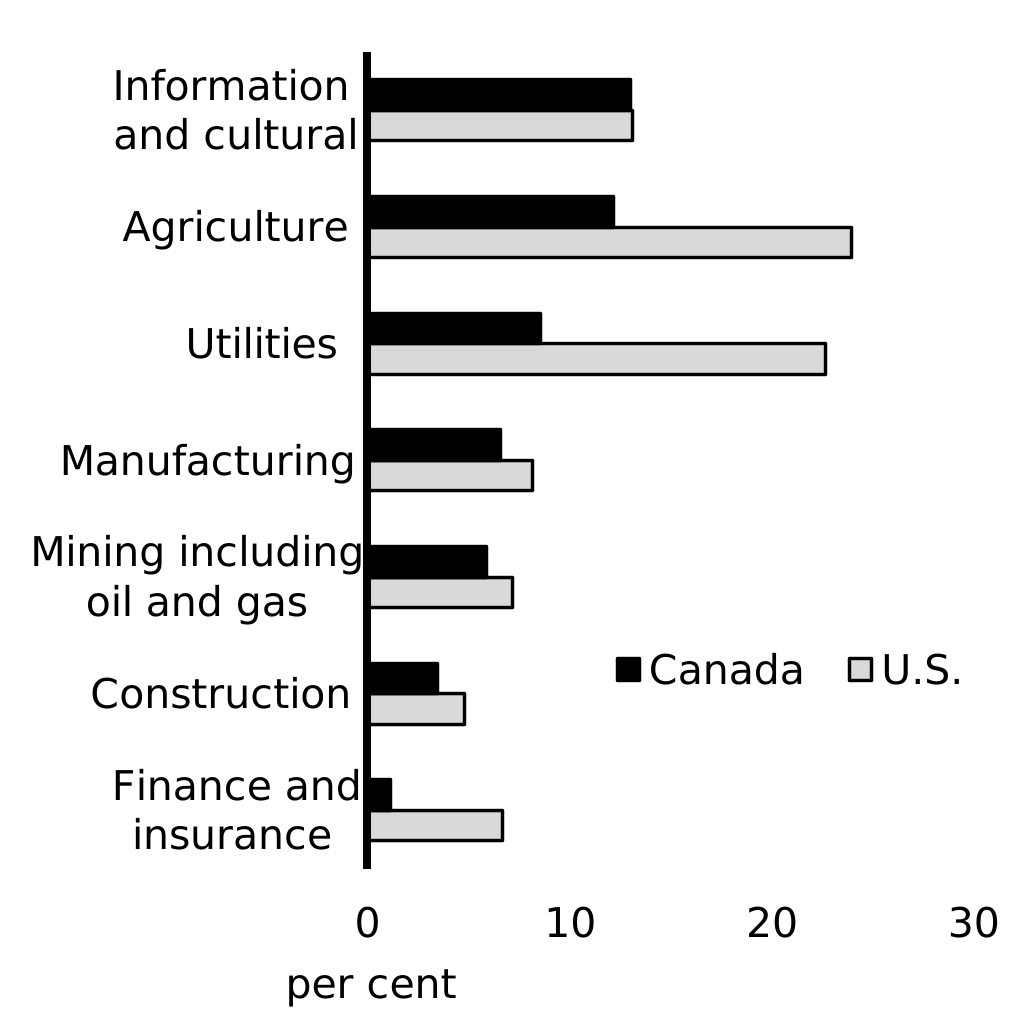
- Low business investment has been an important reason for our low productivity growth. Investment intensity in machinery and equipment and intangible assets, key drivers of productivity, have been lower than in the U.S for decades. As well, this investment gap has been pervasive across sectors (Chart 3).
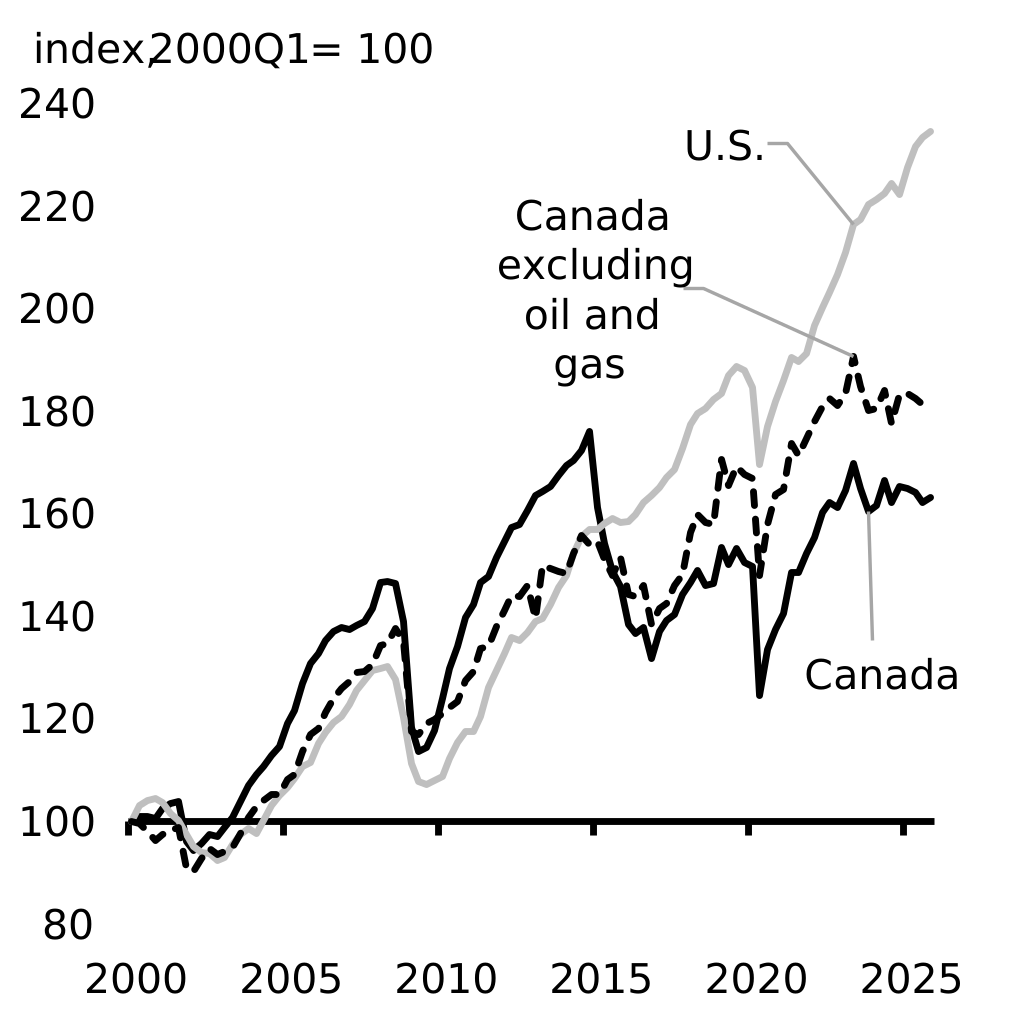
- Since 2015, Canada's relatively poor investment performance has worsened. Business investment in Canada has been flat over the past decade, while business investment in the U.S. has risen sharply (Chart 4).
- Much of this gap has been driven by a retrenchment in capital spending by Canada's energy sector following the sharp decline in global oil prices in 2015, and the contrasting increase in U.S. technology investment in recent years.
Machinery and Equipment Investment as a Share of Value Added by Industry, 2017-2022 Average
Real Business Investment Since 2000, Canada and U.S.
Enter the chart text version.
- Businesses often perceive the risks and costs of investments in high-risk and innovative assets as outweighing the rewards, a mindset reinforced by structural impediments such as the regulatory environment, limited competition, and scale constraints.
- The most immediate way to jumpstart productivity growth is to address structural impediments and increase investment—in machinery, equipment, innovation, and infrastructure that allow workers to build faster and at a more competitive cost.
- Budget 2025 has begun to advance this goal through the comprehensive industrial strategy—investing in trade diversification, housing and infrastructure, and advanced technologies while lowering taxes on new investment and research and development. It also cuts red tape and accelerates major projects to unlock Canada's full economic potential.
- Building on this momentum, the Spring Economic Update 2026 will further increase speed and scale of investment.
- It will mobilize additional capital for nation-building projects through new Canada Strong Fund while expanding skilled trades workforce essential for their construction. It will fund housing infrastructure and improve regulation to support adoption of productivity-enhancing construction technologies.
The following provides further detail about Canada's relative investment performance in productive assets.
| 2000 | 2005 | 2010 | 2015 | 2020 | 2024 | |
|---|---|---|---|---|---|---|
| Canada | 1.1 | 1.1 | 0.9 | 0.9 | 1.1 | 1.1 |
| U.S. | 2.0 | 1.7 | 1.9 | 2.0 | 2.6 | 2.7 |
| OECD | 1.5 | 1.5 | 1.5 | 1.6 | 1.9 | 2.0 |
| Ratio Canada/U.S. | 0.6 | 0.6 | 0.5 | 0.4 | 0.4 | 0.4 |
| Ratio Canada/OECD | 0.8 | 0.8 | 0.6 | 0.6 | 0.6 | 0.5 |
| Software & Database | ICT Hardware | Total | |
|---|---|---|---|
| Japan | 3.1 | 1.3 | 4.4 |
| U.S.* | 2.4 | 1.2 | 3.7 |
| France | 2.7 | 0.4 | 3.1 |
| U.K. | 2.1 | 0.7 | 2.8 |
| Canada (Ratio Canada / U.S.) | 1.6 (0.65) | 0.9 (0.76) | 2.5 (0.69) |
| Italy | 1.5 | 0.8 | 2.3 |
| Germany | 0.8 | 0.7 | 1.4 |
| *Average intensity over 2015-2024. | |||
Fiscal Narrative and Capital Budgeting
Key Messages
- The Spring Economic Update 2026 delivers on the Budget 2025 commitment to spend less on government operations so we can invest more in Canada's future.
- The Update confirms that the government's fiscal anchors are being met:
- The operating budget is on track to be balanced by 2028-29; and
- The federal deficit-to-GDP ratio declines over the medium term, with the deficit projected to decline to $53.2 billion, or 1.4% of GDP by 2030‑31.
- Further, our deficit is $12.6 billion lower over five years than estimated in Budget 2025 – and lower in each year.
- The Spring Economic Update 2026 projects capital investments will increase from $40.5 billion in 2025-26 to $59.3 billion in 2030-31. By 2028-29, capital investments will account for 100 per cent of the deficit.
- Federal debt is firmly under control. As a share of GDP, federal debt is more than a full percentage point lower in every year than projected in Budget 2025 and is on a clear downward trajectory over the long-term, reinforcing Canada's fiscal credibility and resilience.
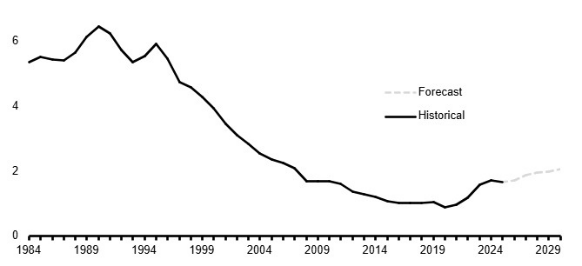
- Public debt charges remain low by historical standards, projected at 2.1 per cent of GDP by 2030-31, far below the peak of 6.5 per cent Canadians faced in the 1990s.
- The government is also strengthening parliamentary oversight. Budget 2025 introduced a fall budgeting cycle, giving Parliament—and builders, investors, and government at every level—clearer, timelier information to make better decisions.
- This plan is working, with 70 per cent of Budget 2025 spending for 2026-27 already reflected in the Main Estimates. These include priority investments to:
- Support our armed forces and defend Canada's sovereignty.
- Help young people find and keep good jobs; and,
- Invest in trade-enabling infrastructure to open new global markets.
Details & Supplementary Information
Key Fiscal Metrics from Spring Economic and Fiscal Update
1. The deficit is $12.6 billion lower over five years than estimated in Budget 2025 – and lower in each year.
| Projection | ||||||
|---|---|---|---|---|---|---|
| 2025-26 | 2026-27 | 2027-28 | 2028-29 | 2029-30 | 2030-31 | |
| Budget 2025 | -78.3 | -65.4 | -63.5 | -57.9 | -56.6 | |
| Spring Economic Update 2026 | -66.9 | -65.3 | -63.1 | -57.7 | -56.2 | -53.2 |
| Difference | 11.5 | 0.0 | 0.4 | 0.2 | 0.4 | |
2. The deficit-to-GDP ratio continues to decline every year, with ratios that are at or better than Budget 2025.
| 2025-26 | 2026-27 | 2027-28 | 2028-29 | 2029-30 | 2030-31 | |
|---|---|---|---|---|---|---|
| Budget 2025 | -2.5 | -2.0 | -1.9 | -1.6 | -1.5 | |
| Spring Economic Update 2026 | -2.1 | -1.9 | -1.8 | -1.6 | -1.5 | -1.4 |
| Difference | 0.4 | 0.1 | 0.1 | 0.0 | 0.0 |
3. The operating budget remains balanced in 2028-29 and beyond.
| Projection | ||||||
|---|---|---|---|---|---|---|
| 2025-26 | 2026-27 | 2027-28 | 2028-29 | 2029-30 | 2030-31 | |
| Day-to-day operating balance | -26.4 | -10.5 | -5.2 | 0.9 | 4.5 | 6.1 |
4. Federal debt as a share of GDP is more than a full percentage point lower each year than what we projected in Budget 2025 and is on a downward trajectory over the long-term.
| 2025-26 | 2026-27 | 2027-28 | 2028-29 | 2029-30 | 2030-31 | |
|---|---|---|---|---|---|---|
| Budget 2025 | 42.4 | 43.1 | 43.3 | 43.3 | 43.1 | |
| Spring Economic Update 2026 | 41.1 | 41.5 | 41.8 | 41.9 | 41.8 | 41.6 |
| Difference | -1.3 | -1.6 | -1.5 | -1.4 | -1.3 |
5. Growth in direct program spending falls from 8% in the past decade (2014-15 to 2024-25) to 2% per cent over the Spring Update horizon (2025-26 to 2030-31) – while major transfers to Canadians and provinces and territories are preserved.
| 2025-26 | 2026-27 | 2027-28 | 2028-29 | 2029-30 | 2030-31 | Average (CAGR) |
|
|---|---|---|---|---|---|---|---|
| Direct program expenses | 7.2% | 4.8% | -0.1% | 0.9% | 3.2% | 2.2% | 2.2% |
| Day-to-day direct program expenses | 6.4% | -0.5% | -1.8% | 1.0% | 2.9% | 2.6% | 0.8% |
- Direct program expenses ($267 billion in 2026-27) covers two main areas: (i) funding that departments provide for specific initiatives—such as clean economy incentives and infrastructure projects—and (ii) the day‑to‑day costs of running programs and organizations, including personnel. Excluded are major transfers to people, major transfers to provinces, and public debt charges.
- Growth in direct program expenses excluding capital investments averages under 1 per cent whereas growth in capital investment expenses averages 9.7 per cent.
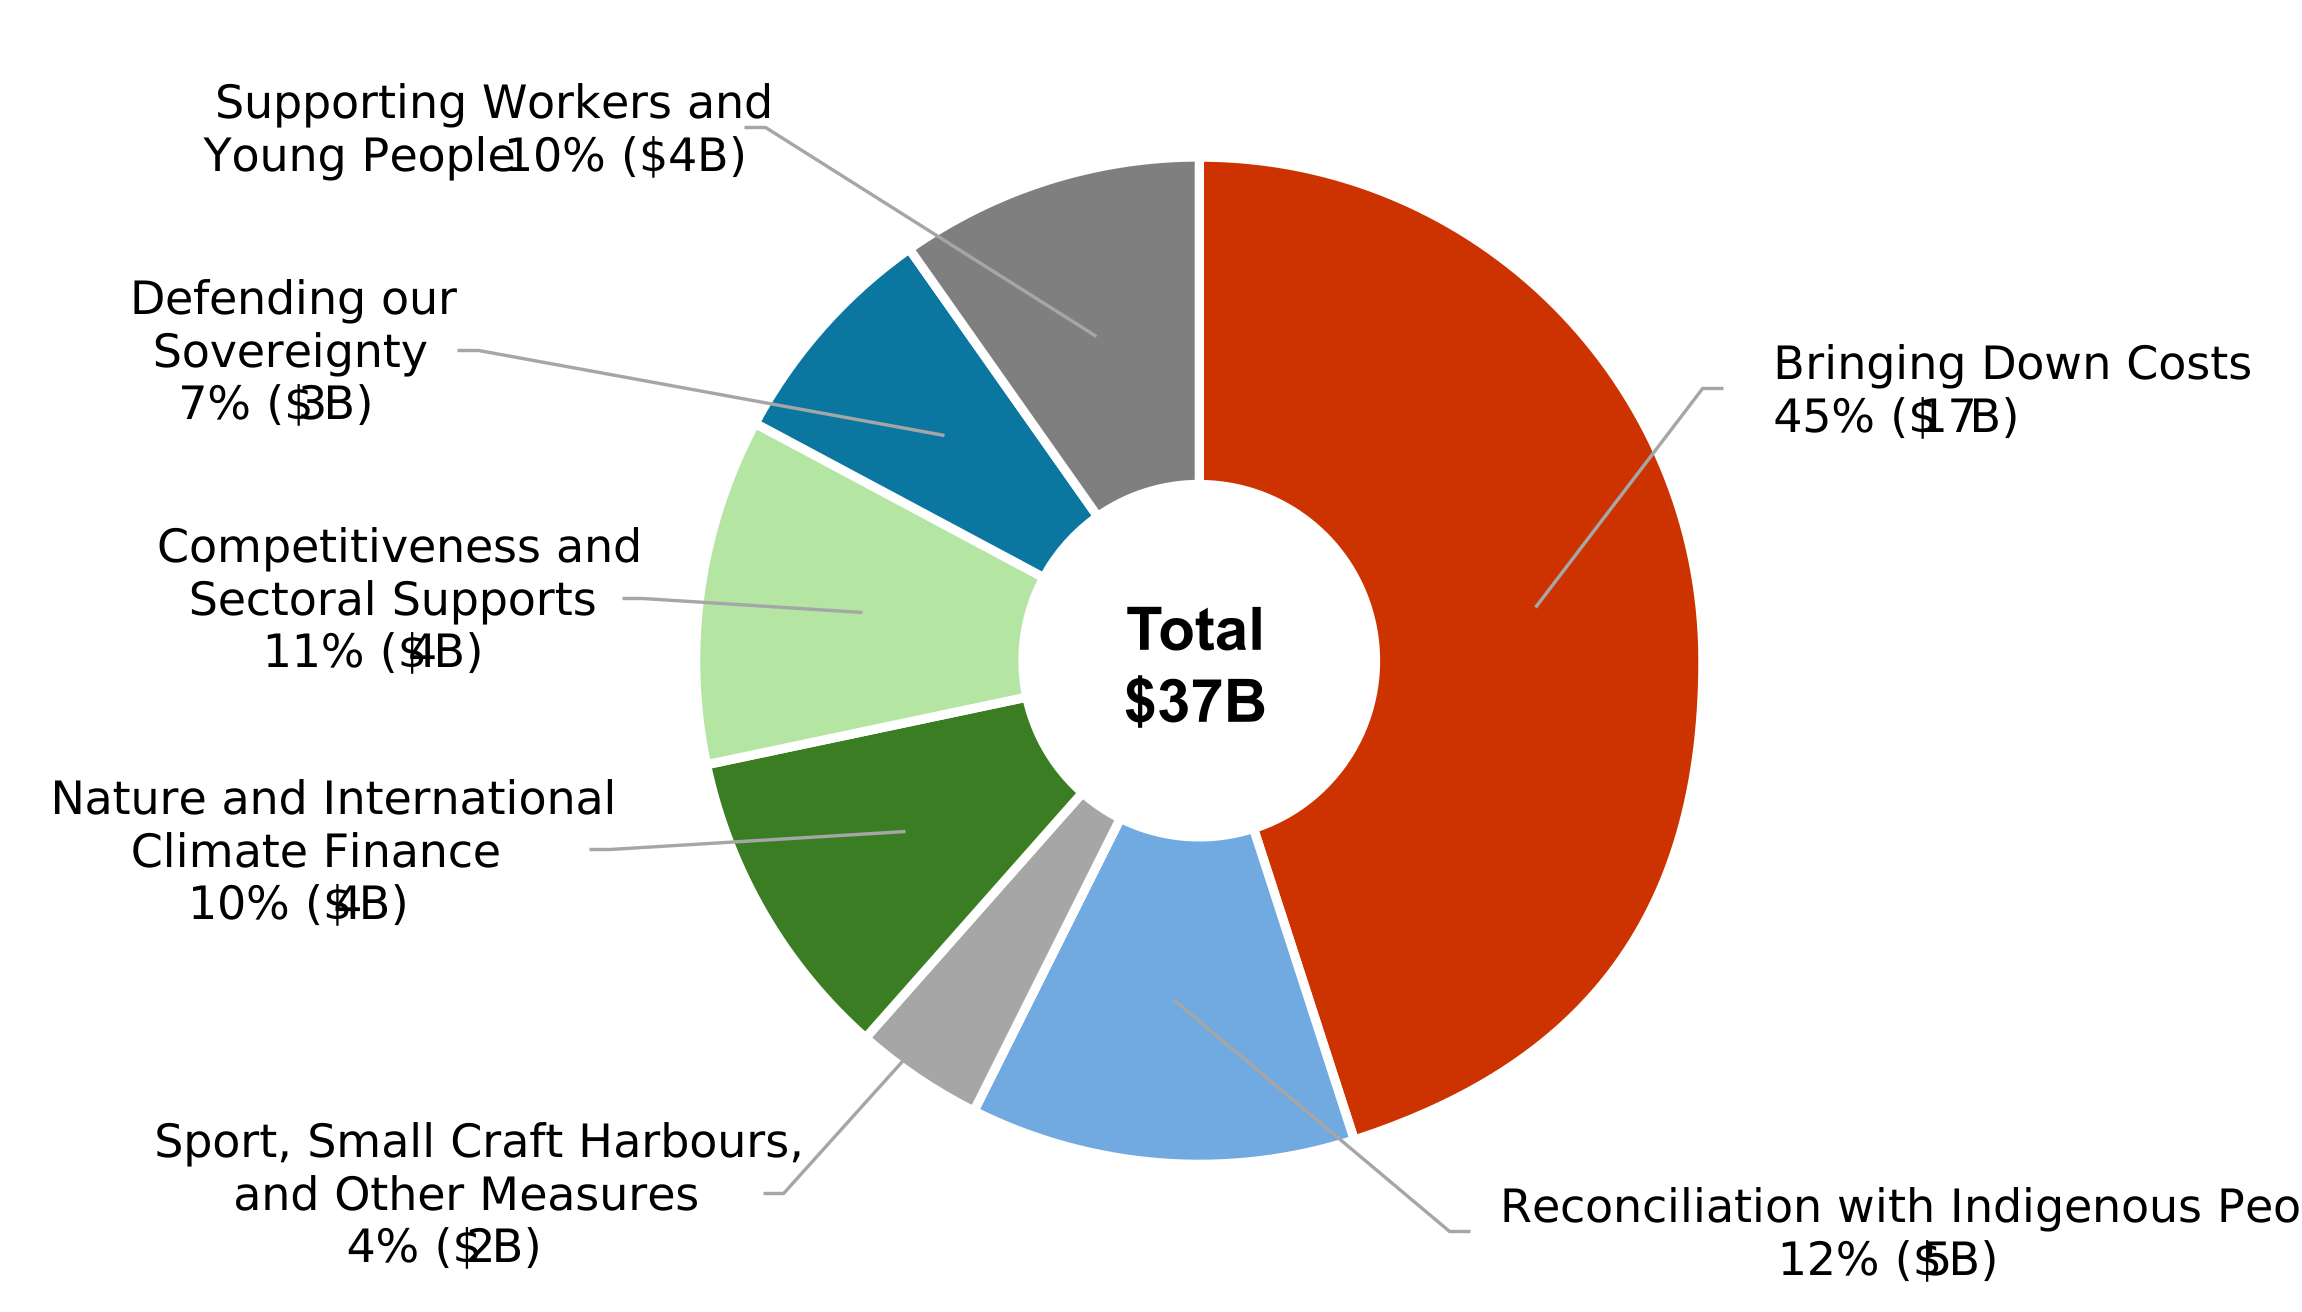
6. Almost half of new measures focused on cost-of-living relief, while continuing to invest for long-term growth.
| 2025-26 | 2026-27 | 2027-28 | 2028-29 | 2029-30 | 2030-31 | 6-yr Total | |
|---|---|---|---|---|---|---|---|
| 1. Spring Economic Update 2026 measures - profiled in chapters | -4.9 | -11.3 | -6.3 | -5.6 | -4.8 | -4.6 | -37.5 |
| 2. Other policy actions since Budget 2025 - profiled in Annex 1 (Table A1.15) | -1.3 | -4.4 | -4.0 | -2.8 | -2.4 | -2.1 | -17.0 |
| 3. Total - Spring Economic Update 2026 measures and policy actions since Budget 2025 | -6.2 | -15.7 | -10.3 | -8.4 | -7.1 | -6.8 | -54.5 |
Composition of Spring Economic Update Measures
7. We are on track to save Canadians $60 billion, reducing operational inefficiencies and changing how government works.
- The government is on track to meet the Budget 2025 commitment to save Canadian taxpayers $60 billion over five years – including through a 20% reduction to the $5 billion of annual spending on external management and consulting services announced in the Spring Economic Update.
- For most organizations, reductions included in Budget 2025 were reflected in the 2026-27 Main Estimates, tabled on February 26th and detailed in Departmental Plans tabled shortly thereafter.
- External management and other consulting services represents about $5 billion of the $23 billion spent on professional services professional services in 2024-25 (table below). The broad category isn't the target of the Update measure because it includes defence-related expenditures (e.g., structural design to deliver on major projects), essential service delivery (e.g. health care of veterans and the Canadian Armed Forces), and internal services within the government (e.g., Department of Justice legal advice).
| 2024-25 | |
|---|---|
| Management and other consulting services | $5.1 billion |
| Engineering and architectural services | $3.9 billion |
| Business services | $3.9 billion |
| Health and welfare services | $3.2 billion |
| Informatics services | $0.8 billion |
| Construction services | $0.7 billion |
| Legal services | $0.7 billion |
| Protection Services | $0.7 billion |
| Training and educational services | $0.5 billion |
| Scientific and research services | $0.4 billion |
| Interpretation and translation services | $0.2 billion |
| Special fees and services | $0.1 billion |
| Temporary help services | $0.1 billion |
| Other services | $2.8 billion |
| Total | $23.1 billion |
|
Note: Management and Other Consulting services is a Department of Finance-generated composite comprising professional services related to advisory and technical services, IT support, engineering and scientific advice, and training. |
|
- We are on track to reduce the size of the federal public service to a more sustainable level aligned with Canadian population growth.
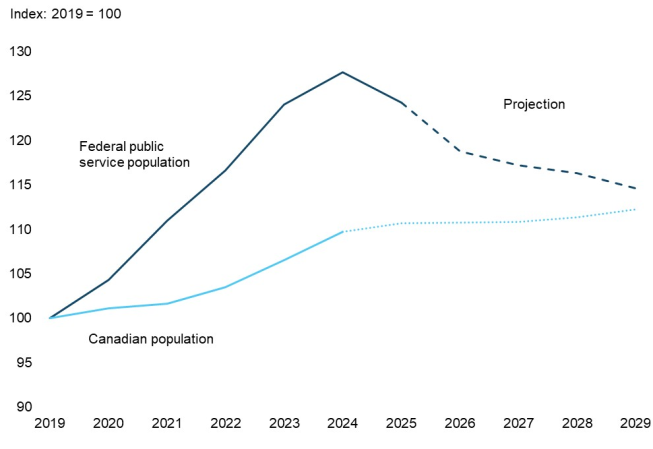
- Between 2019 and 2024 the federal public service population grew at a faster rate than the Canadian population (more than 25% versus 10%). We are reducing the public service from a peak of 368k in 2023-24 to roughly 330k by the end of 2028-29 – a decline of about 40k or 10%, bringing public service growth in line with forecasted Canadian population growth.
Public Service versus Canadian Population Growth 2019 to 2029
Public Service Population
Enter the chart text version.
8. Public debt charges remain low by historical standards—projected at 2.1% of GDP by 2030-31, far below the peak of 6.5% in the 1990s.
Public Debt Charges Since 1984
Responsive:
- In 2024-25, public debt charges were $53.4 billion, higher than both the Canada Health Transfer ($52.1 billion) and GST revenues ($52.5 billion).
- PDC is projected to be higher than GST in 2025-26 and both CHT and GST in 2026-27 to 2030-31.
9. Canada has one of the strongest fiscal positions in the G7—with low deficits and by far the lowest net-debt-to-GDP ratio. Canada has one of the strongest economic performances, with the second-fastest growth and a leading labour market—with the highest labour force participation rate and second-highest employment rate—both above the United States.
| General government deficit outlook, 2026 (% of GDP) | General government net debt outlook, 2026 (% GDP) | IMF Real GDP growth outlook, 2026 | Employment rate (latest) | Labour force participation rate (latest) | |
|---|---|---|---|---|---|
| Japan | 2.0 | 136.5 | 0.7 | 62.5 | 64.0 |
| Canada | 2.7 | 10.2 | 1.5 | 60.7 | 64.9 |
| Italy | 2.8 | 127.7 | 0.5 | 46.8 | 49.9 |
| Germany | 3.8 | 47.2 | 0.8 | 59.6 | 61.9 |
| U.K. | 3.9 | 93.8 | 0.8 | 60.6 | 64.0 |
| France | 4.9 | 108.8 | 0.9 | 52.5 | 57.0 |
| U.S. | 7.5 | 96.7 | 2.3 | 59.3 | 61.9 |
| Sources: IMF April 2026 World Economic Outlook, OECD, Statistics Canada, U.S. Bureau of Labor Statistics Note: Latest data for labour force participation rates are March 2026 for Canada and the United States and 2025Q4 for all other countries. |
|||||
Capital Budgeting
- Cumulative capital investment over the 2025-26 to 2030-31 period, inclusive of planned investments in Budget 2025 and Spring Economic Update 2026, is projected to total $331.9 billion on an accrual basis, or $511.9 billion on a cash basis.
- A summary of definitions and categories of the framework is included below, for ease of reference.
Objective: Classify federal investments that support capital formation in a consistent and transparent manner, to improve decision‑making, comparability across programs, and alignment with long‑term economic objectives.
Focus is on capital investments that meet the following two criteria:
- Conditionality - funding recipient is required to invest in capital formation to receive the benefit.
- Clear linkage - spending encourages or enables capital investment in identifiable sectors or projects.
Six categories of federal measures are classified as capital investment:
- Capital transfers Transfers to other levels of government and organisations expressly intended for the recipient to invest in infrastructure or a productive asset.
- Capital-focused tax incentives Tax expenditures intended to incentivise new capital formation. Amortisation of federal capital assets Expenses recorded to spread the cost of capital assets owned or controlled by the federal government over their useful lives.
- Private sector research and development Direct funding or tax incentives for R&D activities that enable commercialisation or scale-up and raise future productive capacity.
- Support to unlock large-scale private capital investment Contractual agreements with proponents involving exceptional, significant operating subsidies designed to unlock incremental large-scale private capital investments.
- Measures to grow the housing stock Measures that accelerate new housing supply.
Debt Management Strategy 2026-27
Key Messages
- The 2026-27 domestic borrowing program is projected to be $566 billion, $23 billion lower than projected in Budget 2025 ($589 billion), and $37 billion lower than in 2025-26 ($603 billion).
- The decrease in borrowing compared to Budget 2025 projections is due to a decrease in financial requirements ($16 billion), and a reduction in projected Treasury bill maturities ($7 billion).
- The entirety of the change in 2026-27 borrowing needs will be absorbed through lower T-bill issuance.
- The level of total planned outstanding borrowings, $2,073 billion as at March 31, 2027, is well within the current legislated limit of $2,541 billion under Section 4 of the Borrowing Authority Act (BAA).
- The limit was increased from $2,126 billion as proposed in Budget 2025 and was enacted through Bill C‑15, Budget 2025 Implementation Act, No. 1, which received Royal Assent on March 26, 2026.
- Public debt charges for 2026-27 were 1.7% of GDP (which amounts to $58.7 billion) in 2026-27, below the long-term average of 3.2% over the past 40 years.
- Canada has the lowest net debt-to GDP ratio in the G7 (10% for 2026), according to the IMF.
- Canada is rated AAA by S&P, Moody's and DBRS, and AA+ by Fitch.
Details & Supplementary Information
Q: Can you provide a breakdown of the domestic borrowing program?
| 2025-26 Estimated |
2026-27 Budget 2025 |
2026-27 Update |
|
|---|---|---|---|
| Treasury bills | 286 | 291 | 268 |
|
2-year
|
120 | 110 | 110 |
|
5-year
|
84 | 80 | 80 |
|
10-year
|
84 | 80 | 80 |
|
30-year
|
24 | 24 | 24 |
|
Green bond2
|
5 | 4 | 4 |
|
Total bonds
|
317 | 298 | 298 |
| Total domestic issuance | 603 | 589 | 566 |
| Share of long bonds (10-year+) to total bonds | 34% | 35% | 35% |
| Share of treasury bills to total issuance | 47% | 49% | 47% |
|
Sources: Bank of Canada; Department of Finance Canada calculations. Note: Numbers may not add due to rounding. 1 Issuance subject to expenditure availability and market conditions. 2 Green bond issuances may be higher or lower, according to market conditions. |
|||
Q: Will the 2026-27 borrowing program change if circumstances shift?
Yes. This DMS provides an updated borrowing plan for 2026-27 from Budget 2025 based on the latest fiscal and economic assumptions.
Although the government retains full flexibility to adjust issuance, additional debt needs are anticipated to primarily be met through changes in Treasury bills. If needed, bond allocations could also be increased. Advanced market notice would be provided to participants in order to maintain a predictable and well functioning market.
Q: Why were all the changes in the borrowing program since Budget 2025 absorbed by the Tbill sector?
The government manages its borrowing program to preserve flexibility while sustaining benchmark liquidity across all tenors.
As the most liquid part of the curve, Treasury bills have the most flexibility in scaling up or down to meet unanticipated cash needs at minimal cost.
Q: What is the Government's average term to maturity?
The Average Term to Maturity (ATM) of the government's market debt as of April 2026 was 6.4 years.
This is in the range of 6-7 years seen in recent years and represents a prudent balance of cost and risk. It is also within the range of Canada's peers.
| Canada | Australia | Germany | U.S. | U.K. | France | Japan | Italy | |
|---|---|---|---|---|---|---|---|---|
| ATM (Years) | 6.4 | 6.5 | 7.2 | 5.8 | 13.2 | 8.2 | 8.5 | 7.0 |
| Source: Bloomberg, as of April 27, 2026 | ||||||||
Q: What is the amount of outstanding debt stock under the BAA?
The debt stock is projected to be $2,073 billion by the end of March 31, 2027, up from $1,921 billion projected at the end of March 31, 2026. The maximum debt stock under the BAA includes Government of Canada market debt securities, eligible borrowings from agent Crown corporations, and Canada Mortgage Bonds (CMBs) not held by the Government of Canada.
Q: Is the current borrowing program sustainable?
Yes. Canada benefits from excellent market access, competitive borrowing costs by historical standards, and the lowest net government debt-to-GDP ratio in the G7.
Investor demand at auctions remains strong, supporting sustainability in the borrowing program.
Q: Are the current public debt charges sustainable?
Yes. While market interest rates are beyond government's direct control, the government continues to monitor public debt charges and is committed to maintaining stable and low debt servicing costs over time.
When looking at the public debt charges as a percentage of GDP, that share is near historical lows (1.7 per cent for FY 2026-27), and below the historical average of 3.2 per cent over the past 40 years.
Q: When will the government issue a Transition Bond?
The government remains committed to regular green bond issuances and will explore the development of a sustainable bond framework that would allow the issuance of both green and transition bonds.
Work is underway to develop Canada's sustainable investment guidelines (also known as a taxonomy) by the end of 2026. These guidelines will credibly identifying "green" and "transition" investments and are required to support the development of transition bonds.
International Trade and Tariffs
Key Messages
- The government's primary focus is on diversifying our trade partnerships and attracting investment into Canada. Canada has what the world wants, including strong fundamentals, energy, critical minerals, sophisticated investors, and the most educated population in the world.
- Canada is the only G7 country with a comprehensive free trade agreement with all the other G7 countries.
- Canada will continue to quickly and pragmatically open new markets by seeking new free trade agreements and leverage existing agreements to diversify trade with reliable partners.
- Crucially, we are balancing this diversification with principled, pragmatic re-engagement with China and India, two of the world's largest and fastest growing economies.
- The government is at the table and engaged with the U.S. to resolve outstanding tariffs, as well as on the upcoming CUSMA review, to ensure continued predictability and favourable conditions for trade and investment.
- As Canada's Chief Negotiator Janice Charette said recently, there is likely to be ongoing discussion beyond July 1, and we should expect some turbulence. It is important that we stay the course and secure the best possible deal for Canada.
- The government provided updated fiscal estimates of the various surtax and trade-related relief measures in the 2026 Spring Economic Update.
Details & Supplementary Information
Forecasted net revenues for new measures since Budget 2025
The Spring Economic Update 2026 forecasts $3.3 billion in net revenues over six years from new measures, which includes the Order Imposing a Surtax on the Importation of Certain Steel Goods (Steel Tariff-Rate Quotas), the Steel Derivative Goods Surtax Order, and application of the 6.1 per cent Most Favoured Nation (MFN) tariff on imports of EVs from China.
This includes approximately $8.3 billion in gross surtax revenue over six years, consisting:
- $152 million from the steel TRQs (currently slated to expire on June 27, 2026);
- $7.4 billion from the Steel Derivative Goods Surtax Order; and
- $800 million from the application of MFN tariffs on imports of EVs from China (i.e., expected imports following removal of prohibitive 100 per cent surtax).
Of the $8.3 billion amount, approximately $5 billion is expected to be relieved through remissions and other relief (e.g., Duty Deferral Program, Chapter 99), consisting of:
- $109 million from the steel TRQs; and
- $4.9 billion from the Steel Derivative Goods Surtax Order.
Dept. |
2025-2026 | 2026-2027 | 2027-2028 | 2028-2029 | 2029-2030 | 2030-2031 | |
|---|---|---|---|---|---|---|---|
| Surtax Measures and Remission | -142 | -658 | -638 | -638 | -638 | -638 | |
| Order Imposing a Surtax on the Importation of Certain Steel Goods - Steel Tariff-Rate Quotas1 | — | -79 | -73 | - | - | - | - |
|
Expected remission and other duties relief
|
57 | 52 | - | - | - | - | |
| Steel Derivative Goods Surtax Order2 | — | -352 | -1,410 | -1,410 | -1,410 | -1,410 | -1,410 |
|
Expected remission and other duties relief
|
233 | 932 | 932 | 932 | 932 | 932 | |
| Imports of EVs from China3 | — | .... | -160 | -160 | -160 | -160 | -160 |
|
1 Implemented on June 27, 2025, and amended on August 1, 2025 and on December 26, 2025. 2 Announced on November 26, 2025, and implemented on December 26, 2025. 3 Surtaxes on imports of EVs from China were repealed on March 1, 2026. |
|||||||
Spring Economic Update 2026: Broad Key Messages
Key Messages
- The Spring Economic Update 2026 advances the government's plan to build a stronger, more independent, and more resilient Canadian economy.
- The Update continues a decisive shift toward rebuilding Canada's productive capacity, with a focus on increasing investment, accelerating major projects, growing strategic industries, and strengthening Canada's competitive environment
- At the same time, it ensures that all Canadians can participate in building Canada strong and share in its success. It delivers targeted relief to make life more affordable, supports workers and young people, and invests in strong, safe communities across the country.
- Key elements include:
- A new Canada Strong Fund to mobilize large-scale investment
- Team Canada Strong plan to expand the skilled trades workforce
- Reducing development charges and modernising building codes to build more homes faster
- Targeted investments in automotive manufacturing, defence industries, and trade-enabling transportation networks
- A major investment summit to attract global capital
- Pausing the Fuel Excise Tax until Labour Day
- Reducing the base CPP contribution rate from 9.9 to 9.5 per cent
- The government is taking action while maintaining Canada's strong fiscal position. Projected deficits in the Spring Economic Update are lower than those projected in Budget 2025. Canada remains on track to balance day-to-day operating spending against revenues by 2028–29 and to keep the deficit-to-GDP ratio on a steady downward path.
Canada Pension Plan Contribution Reduction
Key Messages
- Bill C-30, Spring Economic Update 2026 Implementation Act, includes amendments to reduce the contribution rate in the base CPP from 9.9 per cent to 9.5 per cent, effective January 1, 2027.
- This reduction will save about $133 per year for an employee earning $70,000 a year, with equivalent savings for their employer. Across roughly 16 million contributors, this measure would lower total contributions by more than $3 billion per year in Canada.
- Benefits are not affected by this change.
- This change maintains a prudent financial buffer to protect the base CPP against future economic shocks or risks and preserves the long-term sustainability of the plan.
- The proposed rate reduction has the unanimous support from provincial and territorial Ministers of Finance.
Details & Supplementary Information
- The latest actuarial report, tabled in the House of Commons in December 2025, showed that the minimum contribution rate in the base CPP—the lowest rate required to financially sustain the plan over the next 75 years—is at least 69 basis points below the legislated rate.
- To ensure that the base CPP is protected from future negative shocks (e.g., an adverse economic downturn or significant repricing in financial markets), the proposed reduction would still retain a nearly 30-basis point buffer between the legislated contribution rate and the minimum contribution rate required to maintain long-term sustainability.
- Maintaining a buffer helps to provide Canadians with certainty, minimizing the probability of having to increase contribution rates or reduce benefits in the future.
- A buffer of roughly 30-basis points exceeds the average buffer of 10 to 15 basis points over the last 25 years. The Chief Actuary will table a report this spring assessing the impact of the proposed rate reduction on the financial state of the base CPP.
- The CPP is an area of shared federal-provincial responsibility. For legislative amendments to the CPP to come into force, they need to receive Royal Assent in Parliament and subsequently, at least seven provinces representing two-thirds of the population need to provide their formal consent through the issuing of Orders in Council.
- As a last step, a federal Order in Council is required that acknowledges that sufficient formal provincial consent has been obtained and fixes the day on which the amendments come into force.
- Before announcing the reduction in the base CPP contribution rate in the Spring Economic Update 2026, the federal Minister of Finance consulted with his provincial and territorial counterparts to ensure there was support for this measure.
- All 13 provincial and territorial Ministers of Finance have expressed their support for the reduction through an exchange of letters and provincial Ministers have committed to provide their Orders in Council in a timely manner once the legislative amendments receive Royal Assent in Parliament.
Canada Strong Fund
Key Messages
- The Spring Economic Update 2026 announced a plan to provide $25 billion in seed funding for the Canada Strong Fund over 3 years, beginning in 2026-27.
- The Spring Economic Update 2026 includes the estimated debt servicing cost associated with the introduction of the Canada Strong Fund.
- The Department of Finance is conducting targeted consultations and will soon release further details on the Canada Strong Fund.
Details & Supplementary Information
- Using the assumptions set out below, the Spring Economic Update embeds a projection of about $967.5 million over three years in public debt charges associated with the anticipated cash outlays from the Canada Strong Fund.
- These assumptions could change as details of how the fund will be operationalized are refined in the coming months.
Table A1.10 (page 129 English, page 147 French): incorporates $25 billion, on a cash basis, for seed funding over 3 years starting in 2026-27. While not disaggregated, the $25 billion seed funding is included the forecast for non-budgetary transactions within Loans, investments and advances, Enterprise Crown corporations.
| Projection | ||||||||
|---|---|---|---|---|---|---|---|---|
| 2024–2025 | 2025–2026 | 2026–2027 | 2027–2028 | 2028–2029 | 2029-2030 | 2030-2031 | ||
| Budgetary balance | -36.3 | -66.9 | -65.3 | -63.1 | -57.7 | -56.2 | -53.2 | |
| Non-budgetary transactions | ||||||||
| Pensions and other accounts | 9.1 | 13.5 | 10.1 | 10.5 | 4.7 | -0.4 | -3.2 | |
| Non-financial assets | -10.5 | -12.0 | -17.7 | -20.2 | -19.3 | -16.9 | -20.2 | |
| Loans, investments, and advances | ||||||||
|
Enterprise Crown corporations
|
-61.1 | -54.9 | -59.5 | -64.6 | -64.7 | -31.4 | -20.9 | |
|
Other
|
-6.6 | -9.4 | -8.3 | -7.3 | -4.2 | -7.9 | -7.8 | |
|
Total
|
-67.7 | -64.3 | -67.8 | -71.8 | -69.0 | -39.3 | -28.7 | |
| Other transactions | ||||||||
|
Accounts payable, receivable, accruals, and allowances
|
-14.6 | 24.0 | 7.3 | 0.8 | -2.5 | -6.4 | -5.8 | |
|
Foreign exchange activities and derivatives
|
-10.0 | 0.3 | 0.0 | -5.1 | -5.3 | -5.4 | -5.4 | |
|
Total
|
-24.6 | 24.3 | 7.3 | -4.3 | -7.8 | -11.9 | -11.2 | |
| Total non-budgetary transactions | -93.7 | -38.5 | -68.1 | -85.9 | -91.3 | -68.4 | -63.2 | |
| Financial source (requirement) | -130.0 | -105.3 | -133.4 | -149.0 | -149.0 | -124.6 | -116.4 | |
Table A1.9 (page 125 English, page 142 French): incorporates projected public debt charges associated with the Fund. While not disaggregated, interest is estimated at about $750 million annually once funding is fully deployed, based on interest rates provided in the March private sector survey.
| Projection | |||||||
|---|---|---|---|---|---|---|---|
| 2024– 2025 | 2025– 2026 | 2026– 2027 | 2027– 2028 | 2028– 2029 | 2029– 2030 | 2030– 2031 | |
| Major transfers to persons | |||||||
| Elderly benefits | 80.3 | 83.0 | 89.3 | 94.3 | 99.0 | 103.8 | 108.5 |
| Employment Insurance benefits | 24.9 | 29.0 | 32.7 | 32.1 | 32.9 | 34.2 | 35.1 |
| Canada Child Benefit | 28.6 | 30.2 | 31.2 | 32.1 | 32.8 | 33.5 | 34.2 |
| COVID-19 income support for workers1 | -2.2 | 0.0 | 0.0 | 0.0 | 0.0 | 0.0 | 0.0 |
| Total | 131.6 | 142.2 | 153.3 | 158.6 | 164.7 | 171.5 | 177.8 |
| Major transfers to provinces, territories, and municipalities | |||||||
| Canada Health Transfer | 52.1 | 54.7 | 57.4 | 60.3 | 62.6 | 65.0 | 67.5 |
| Canada Social Transfer | 16.9 | 17.4 | 17.9 | 18.5 | 19.0 | 19.6 | 20.2 |
| Equalization | 25.3 | 26.2 | 27.2 | 28.2 | 29.3 | 30.4 | 31.6 |
| Territorial Formula Financing | 5.2 | 5.5 | 5.8 | 6.3 | 6.6 | 6.8 | 7.0 |
| Health agreements with provinces and territories | 4.3 | 4.3 | 4.3 | 3.1 | 2.5 | 2.5 | 2.5 |
| Canada-wide early learning and child care | 6.6 | 7.9 | 8.6 | 8.0 | 8.2 | 8.5 | 8.1 |
| Build Communities Strong Fund – Community Stream | 2.4 | 2.5 | 2.5 | 2.6 | 2.6 | 2.7 | 2.8 |
| Other fiscal arrangements2 | -7.6 | -7.6 | -8.2 | -8.5 | -8.9 | -9.3 | -9.7 |
| Total | 105.1 | 110.8 | 115.6 | 118.4 | 122.0 | 126.2 | 130.0 |
| Pollution pricing proceeds returned to Canadians | 15.6 | 4.9 | 0.2 | 0.1 | 0.0 | 0.0 | 0.0 |
| Direct program expenses | |||||||
| Other transfer payments | 107.1 | 113.7 | 121.5 | 122.6 | 120.2 | 124.9 | 126.6 |
| Other direct program expenses | 130.5 | 141.1 | 145.6 | 144.1 | 149.0 | 152.8 | 157.2 |
| Total | 237.6 | 254.7 | 267.1 | 266.7 | 269.2 | 277.7 | 283.8 |
| Total program expenses, excluding net actuarial losses | 489.9 | 512.8 | 536.1 | 543.9 | 555.9 | 575.4 | 591.6 |
| Public debt charges | 53.4 | 54.0 | 58.7 | 65.7 | 71.6 | 75.7 | 80.9 |
| Total expenses, excluding net actuarial losses | 543.3 | 566.8 | 594.8 | 609.6 | 627.5 | 651.1 | 672.5 |
| Net actuarial losses (gains) | 4.0 | 11.6 | 0.1 | 0.4 | -3.9 | -5.2 | -5.6 |
| Total expenses | 547.3 | 578.3 | 595.0 | 609.9 | 623.7 | 645.9 | 666.9 |
| Per cent of GDP | |||||||
| Major transfers to persons | 4.2 | 4.4 | 4.5 | 4.5 | 4.5 | 4.5 | 4.5 |
| Major transfers to provinces, territories, and municipalities | 3.4 | 3.4 | 3.4 | 3.4 | 3.4 | 3.3 | 3.3 |
| Direct program expenses | 7.6 | 7.9 | 7.9 | 7.6 | 7.4 | 7.4 | 7.2 |
| Total program expenses, excluding net actuarial losses | 15.8 | 15.8 | 15.9 | 15.6 | 15.3 | 15.3 | 15.1 |
| Total expenses | 17.6 | 17.8 | 17.6 | 17.4 | 17.2 | 17.1 | 17.0 |
|
Note: Totals may not add due to rounding. 1 COVID -19 income support for workers were provided during the pandemic through the Canada Emergency Response Benefit, Canada Recovery Benefits, and the Canada Worker Lockdown Benefit. These temporary programs are now closed, with nominal projected amounts in 2025-26 of $0.2 billion mainly reflecting redeterminations of benefit overpayments. These are included in other transfer payments, consistent with their expected presentation in Public Accounts 2026. 2 Other fiscal arrangements include the Quebec Abatement (offsetting amounts to reflect the historical transfer of tax points and resulting reduction in federal tax collected for the Youth Allowances Recovery and Alternative Payments for Standing Programs); statutory subsidies; and payments for the transfer of Hibernia Net Profits Interest and Incidental Net Profits Interest net revenues to Newfoundland and Labrador. |
|||||||
Table A1.1 (page 113 English, page 130 French): provides the average private sector forecast for 3-month treasury bills and 10-year government bonds which are used to calculate public debt charges.
| 2025 | 2026 | 2027 | 2028 | 2029 | 2030 | 2025-2029 | |
|---|---|---|---|---|---|---|---|
| Real GDP growth1 | |||||||
| Budget 2025 | 1.6 | 1.2 | 2.0 | 1.9 | 2.0 | – | 1.7 |
| Spring Economic Update 2026 | 1.7 | 1.1 | 1.9 | 1.9 | 1.9 | 1.8 | 1.7 |
| GDP inflation1 | |||||||
| Budget 2025 | 2.3 | 1.8 | 2.0 | 2.0 | 2.0 | – | 2.0 |
| Spring Economic Update 2026 | 2.6 | 2.8 | 1.8 | 1.9 | 2.0 | 2.0 | 2.2 |
| Nominal GDP growth1 | |||||||
| Budget 2025 | 3.9 | 3.0 | 4.1 | 4.0 | 4.0 | – | 3.8 |
| Spring Economic Update 2026 | 4.3 | 4.0 | 3.7 | 3.8 | 3.9 | 3.8 | 3.9 |
| Nominal GDP level (billions of dollars)1 | |||||||
| Budget 2025 | 3,229 | 3,326 | 3,461 | 3,599 | 3,743 | – | |
| Spring Economic Update 2026 | 3,243 | 3,372 | 3,496 | 3,630 | 3,772 | 3,917 | |
|
Difference between Spring Economic Update 2026 and Budget 2025
|
15 | 46 | 34 | 30 | 29 | – | 31 |
| 3-month treasury bill rate | |||||||
| Budget 2025 | 2.6 | 2.3 | 2.5 | 2.6 | 2.6 | – | 2.5 |
| Spring Economic Update 2026 | 2.6 | 2.2 | 2.5 | 2.7 | 2.6 | 2.6 | 2.5 |
| 10-year government bond rate | |||||||
| Budget 2025 | 3.3 | 3.4 | 3.5 | 3.6 | 3.6 | – | 3.4 |
| Spring Economic Update 2026 | 3.2 | 3.4 | 3.6 | 3.7 | 3.7 | 3.7 | 3.5 |
| Exchange rate (US cents/C$) | |||||||
| Budget 2025 | 72.2 | 75.1 | 76.4 | 77.0 | 77.4 | – | 75.6 |
| Spring Economic Update 2026 | 71.5 | 73.7 | 75.4 | 75.5 | 75.8 | 76.0 | 74.4 |
| Unemployment rate | |||||||
| Budget 2025 | 7.0 | 6.8 | 6.4 | 6.1 | 6.0 | – | 6.4 |
| Spring Economic Update 2026 | 6.9 | 6.5 | 6.2 | 6.1 | 6.0 | 5.9 | 6.3 |
| Consumer Price Index inflation | |||||||
| Budget 2025 | 2.1 | 2.0 | 2.0 | 2.0 | 2.0 | – | 2.0 |
| Spring Economic Update 2026 | 2.1 | 2.5 | 1.9 | 2.0 | 2.0 | 2.0 | 2.1 |
| U.S. real GDP growth | |||||||
| Budget 2025 | 1.6 | 1.6 | 2.0 | 2.0 | 2.0 | – | 1.8 |
| Spring Economic Update 2026 | 2.2 | 2.4 | 2.0 | 2.0 | 2.0 | 2.0 | 2.1 |
| West Texas Intermediate crude oil price ($US per barrel) | |||||||
| Budget 2025 | 66 | 65 | 67 | 69 | 71 | – | 68 |
| Spring Economic Update 2026 | 65 | 73 | 66 | 66 | 69 | 70 | 68 |
|
Notes: Forecast averages may not equal average of years due to rounding. Numbers may not add due to rounding. 1 Budget 2025 forecasts have been restated to reflect the historical revisions in the Canadian System of National Accounts published along with the National Accounts for the fourth quarter of 2025 on February 27, 2026. Sources: Statistics Canada; for Budget 2025, Department of Finance Canada August 2025 survey of private sector economists, which has been adjusted to incorporate the actual results of the National Accounts for the second quarter of 2025 released on August 29, 2025; for Spring Economic Update 2026, Department of Finance Canada March 2026 survey of private sector economists; Department of Finance Canada calculations. |
|||||||
Canada Investment Summit – September 2026
Key Messages
- The Government of Canada will host the first-ever Canada Investment Summit from September 14-15, 2026, in Toronto, to attract new international investment and position Canada as a destination of choice for global capital.
- The Summit will convene approximately 200 of the world's leading investors and business leaders, alongside selected federal Ministers, senior officials, and provincial representatives.
- Foreign direct investment brings high‑value, long‑term capital, supporting job creation, productivity growth, supply‑chain integration, and Canada's economic resilience.
- Canada is already emerging as a top global investment destination, with inward direct investment at its highest level in nearly two decades.
- The government has set a target of attracting $500 billion in private investment over five years, building toward a broader ambition to catalyze $1 trillion in total investment.
- The Summit will showcase investment opportunities in priority sectors, including energy and critical minerals, artificial intelligence, defence, and infrastructure.
- The federal government will host the Summit, working in partnership with CPP Investments and PSP Investments, two of Canada's largest and most important institutional investors.
Details & Supplementary Information
Overview and Objectives
The Canada Investment Summit is a flagship economic initiative aimed at strengthening Canada's position as a global destination for foreign direct investment (FDI). The Summit is intended to attract long‑term private capital that supports major projects, accelerates innovation, and creates high‑quality jobs across the country. It also aligns with the government's broader objective of coordinating investment attraction activities across departments in support of priority sectors.
Event Format and Participation
The Summit will take place over two days in Toronto in September 2026, *information redacted*
Financial Considerations
The Spring Economic Update 2026 proposes to provide $10.6 million in 2026–27 for Invest in Canada to deliver the Summit.
Strategic Context
The Summit builds on Canada's recent success in attracting foreign investment, including more than $97 billion in investment commitments and over 20 new economic and defence partnerships secured over the past year.
Team Canada Strong
Key Messages
- Canada is facing a significant skilled trade shortage with too few young Canadians entering the trades sector.
- Retirements and economic growth mean that more than 1.4 million trades workers will be needed by 2033, and the scale of investments in housing and infrastructure projects will add to this demand. If nothing changes, Canada will face a persistent gap of more than 20,000 skilled trades workers per year.
- Through Team Canada Strong, the government is taking action to strengthen and accelerate Canada's skilled trades training and apprenticeship system, mobilise talent earlier, support apprentices through training and in completing their programs, and ensure Canada has the workers it needs to build a secure and sovereign future.
- The flagship measure proposed to invest $6 billion in a nationwide effort to recruit, train, and hire 80,000 to 100,000 new Red Seal trades workers aligned to Canada's housing, infrastructure, resource development and defence needs by 2030-31.
Details & Supplementary Information
- Canada is facing a significant skilled trade shortage. Too few young Canadians are entering the trades—missing out on well-paid jobs and long-term stability.
- Retirements and economic growth mean that more than 1.4 million trades workers will be needed by 2033, and the scale of investments in housing and infrastructure projects will add to this demand. If nothing changes, Canada will face a persistent gap of more than 20,000 skilled trades workers per year.
- The Spring Economic Update announced Team Canada Strong, a new multi-channel effort to recruit, train, and hire 80,000 to 100,000 new skilled trades workers by 2030-31, creating paid, direct pathways for young Canadians to help build housing, major infrastructure, and defence projects at speed and at scale.
- Specifically, the Spring Economic update proposes $6 billion over five years, starting in 2026-27, in the following initiatives:
- Team Canada Strong program: to provide youth aged 15-30 with paid, entry-level, trades-related work experience that leads into apprenticeship.
- Build Canada Apprenticeship Service: to help employers to hire and train apprentices by providing wage subsidies of up to $10,000 for their first-year salary, match apprentices to job opportunities, and offer hands-on navigation and support.
- Red Seal Program Modernization: to reduce certification delays and improve national consistency, including by introducing online exams, digital logbooks, and secure credentials, and by creating a single national registered apprenticeship number.
- Union Training and Innovation Program Expansion: to enable union-run training centres to upgrade facilities, expand capacity, and invest in modern equipment.
- Apprenticeship Training Grant: to remove financial barriers during training, by providing apprentices with a weekly income top-up of $400 per week while they are attending mandatory in class technical training for a total payment of $16,000 per apprentice, paid in addition to Employment Insurance.
- Apprenticeship Completion Bonuses and Continuation Support: to increase apprenticeship completion rates by providing a one-time $5,000 bonus to apprentices obtaining certification in a Red Seal trade, and providing income supports for those between training and work.
- Canadian Armed Forces Trades Pathways: to provide earlier exposure to trades through enhanced Cadets and Junior Canadian Rangers programs and to pilot a new Reserve Trades Experience Pilot Program to offer fully funded trades training and paid experience to Primary Reservists
Affordability Measures Overview
Key Messages
- Direct support for household budgets:
- The government has made the National School Food Program permanent—beyond the initial commitment of $1 billion over five years.
- The new Canada Groceries and Essentials Benefit will provide $11.7 billion in additional support over six years to over 12 million individuals and families.
- Nearly 22 million Canadians will benefit from tax relief of up to $420 per person, saving two-income families up to $840 this year.
- Actions to reduce key cost pressures:
- More than 6.5 million Canadians are covered under the Canadian Dental Care Plan, reducing expenses while providing essential oral health care services.
- As part of the National Pharmacare Program, agreements with British Columbia, Manitoba, Prince Edward Island, and Yukon are making a range of contraception and diabetes medications free.
- The government has temporarily suspended the federal Fuel Excise tax on gasoline, diesel, and aviation fuels providing over $2.4 billion in total tax relief for Canadians.
- Measures that address the structural factors behind affordability:
- The government is improving housing affordability through Build Canada Homes and GST/HST rebates for first-time home buyers for new homes up to $1.5 million and is proposing to immediately provide $1.7 billion to provinces and territories to implement measures to increase Canada's housing supply.
- Other measures include strengthening food supply chains, and launching a Whole-of-Government Competition Plan to ensure that competition is prioritized throughout the federal government's policies.
Details & Supplementary Information
National School Food Program
Originally announced on April 1, 2024 with an investment of $1 billion over five years, the program aims at providing meals to 400,000 more kids every year, beyond those served by existing school food programs. In March 2025, all 13 provinces and territories have signed agreements with the federal government to flow funding until March 2027. The rollout of the program's distinctions-based funding for First Nations on reserve as well as Inuit, Métis, and Modern Treaty and Self-Government agreement holders remains ongoing.
In Budget 2025, the program received permanent funding of $216.6 million per year, starting in 2029-30.
Bill C-15 (Budget Implementation Act, 2025) enacted the National School Food Program Act, which sets out the Government of Canada's vision for the National School Food Program and commits to maintaining long-term funding to provinces, territories, and Indigenous peoples for the ongoing implementation and maintenance of the Program.
Canada Groceries and Essentials Benefit
The Canada Groceries and Essentials Benefit builds on the existing Goods and Services Tax (GST) Credit and will provide $11.7 billion in additional support over six years to over 12 million individuals and families, by:
- providing a one-time top-up payment to be paid as early as possible this spring and no later than June 2026 (based on January 2026 eligibility)—equal to a 50% increase in the annual 2025-26 value of the GST Credit. This will deliver $3.1 billion in immediate assistance to individuals and families who currently get the GST Credit.
- increasing the value of the Canada Groceries and Essentials Benefit by 25% for five years starting in July 2026. This increase will deliver $8.6 billion in additional support over the 2026-27 to 2030-31 period, including to 500,000 new individuals and families.
Recipients will not need to apply for the additional payments, but should file their 2024 tax return if they have not done so already to be able to receive the top-up, and must file their 2025 tax return to receive the increased Canada Groceries and Essentials Benefit payments as of July 2026.
Middle-class Tax Cut
In May 2025, the government announced it would lower the first marginal personal income tax rate from 15 per cent to 14 per cent. The rate reduction applies to the first $58,523 of an individual's taxable income. Nearly 22 million Canadians will benefit from tax relief of up to $420 per person, saving two-income families up to $840 this year.
The majority of tax relief will go to Canadians with incomes in the two lowest tax brackets. Nearly 45 per cent of the tax relief will go to Canadians with income below $58,523 (the first tax bracket) and 40 per cent to Canadians with income approximately between $58,523 and $117,045 (the second tax bracket).
National Pharmacare Program
As part of the National Pharmacare Program, the Government of Canada has signed funding agreements with four provinces and territories – British Columbia, Manitoba, Prince Edward Island, and Yukon – to make a range of contraception and diabetes medications free at the pharmacy counter. Agreements end in 2028-29.
Canadian Dental Care Plan
The Canadian Dental Care Plan is available to uninsured Canadians with a family income of less than $90,000, with no co-pays for families under $70,000. It covers a wide range of services including cleanings, fillings, and dentures. The program first launched in 2023 and limited eligibility to seniors. As of May 2025, all eligible uninsured Canadians of all ages can apply. The program is saving eligible Canadians an average of $800 per year on their oral health services.
Temporary Suspension of Federal Fuel Excise Tax Rates on Gasoline, Diesel, and Aviation Fuels
The federal excise tax currently applies at a rate of 10 cents per litre on gasoline and unleaded aviation gasoline, and 4 cents per litre on diesel fuel and aviation fuel, other than aviation gasoline. The tax is typically payable by the manufacturer or wholesaler at delivery to a retailer and is embedded in the price of fuel, for example at the pump. Heating oil is exempt from this tax and there is no federal excise tax on natural gas or propane. Provincial governments also collect their own gasoline and diesel taxes.
As of April 20, 2026, federal excise tax rates on gasoline, unleaded aviation gasoline, diesel fuel, and aviation fuel have been reduced to 0 cents per litre. This temporary suspension will remain in effect until and including September 7, 2026. It is estimated this will provide over $2.4 billion in total tax relief that will ease the pressure of high fuel prices on Canadians in 2026.
Consumer Fuel Charge
On March 14, 2025, the government announced that it will cease the application of the federal fuel charge, effective April 1, 2025. It also removed the requirement for provinces and territories to maintain a consumer-facing carbon price. These actions have reduced gasoline prices at the pump in most provinces and territories by up to 18 ¢/L compared to 2024–25 levels, thereby contributing to lower headline inflation.
The government is winding down mechanisms used to return direct fuel charge proceeds to Canadians, small and medium-sized businesses, farmers, and Indigenous governments. Eliminating the fuel charge will give Canadian consumers and businesses certainty that the consumer carbon price is being permanently removed from legislation.
Canada-wide Early Learning and Child Care system
As part of Budget 2021, the government committed to build a Canada-wide Early Learning and Child Care system with PTs and Indigenous partners. As of 2025-26, the federal government is providing a minimum of $9.2 billion every year to support these efforts.
The majority of PTs signed agreements that end in 2030-31, while those with Alberta and Ontario end on March 31, 2027. The agreements provide a time-limited 3 per cent top-up to help PTs respond to inflationary pressures on child care operations.
Eight provinces and territories have achieved $10-a-day or less average fees while others have reduced fees by at least 50%. Families of approximately 900,000 children are benefiting from affordable child care across the country thanks to FPT efforts.
Launching Build Canada Homes
The government launched Build Canada Homes in the fall—a new federal agency that will build affordable housing at scale. It is mandated with building and financing more affordable homes and catalyzing a new housing industry. The government also announced the agency's first four investments and initiatives. This includes protecting existing affordable housing by launching the $1.5 billion Canada Rental Protection Fund under Build Canada Homes. Additionally, BCH will provide $1 billion to build transitional and supportive housing for people who are homeless or at risk of homelessness.
First-Time Home Buyers' GST Rebate
The government has eliminated the GST for first-time home buyers on new homes at or under $1 million and reduced the GST for first-time home buyers on new homes between $1 million and $1.5 million by introducing a new First-Time Home Buyers' GST Rebate. As a result of this rebate, first-time home buyers will be able to save up to $50,000 on a new home. This measure is expected to deliver $3.9 billion in tax savings to Canadians over five years, starting in 2025-26.
Whole-of-Government Competition Plan
To strengthen productivity and improve affordability, the Spring Economic Update 2026 launched a new Whole-of-Government Competition Plan that will take a focused and coordinated approach to ensure that competition is prioritized throughout the federal government's policies.
Tackle food insecurity, support producers, and strengthen supply chains
To help keep food affordable for Canadians and strengthen the resilience of Canada's food supply chain, the government has announced targeted measures to support businesses, producers, and local organisations, including:
- The government is setting aside $500 million from the Strategic Response Fund to help businesses address the costs of supply chain disruptions without passing those costs on to Canadians at the checkout line.
- For the same purpose, the government will create a $150 million Food Security Fund under the existing Regional Tariff Response Initiative for small and medium enterprises and the organisations that support them.
- To lower the cost of food production, the government is introducing immediate expensing for greenhouse buildings. This allows producers to fully write off greenhouses acquired on or after November 4, 2025, and that become available for use before 2030. This measure supports increased domestic supply and investment in food production over the medium-term.
- To ease immediate pressures with food banks, the government is providing $20 million to the Local Food Infrastructure Fund. This supports food banks and other national, regional, and local organizations to deliver more nutritious food to families in need.
- To tackle the root causes of food insecurity, the government is developing a National Food Security Strategy – one that strengthens domestic food production and improves access to affordable, nutritious food. This strategy will also include measures to implement unit price labelling and support the work of the Competition Bureau in monitoring and enforcing competition in the market, including food supply chains.
Affordability: Backgrounder Chart Pack
Section 1: Economic Context and Affordability
- Headline inflation has remained within Bank of Canada target range for over two years (Chart 9).
- However, previous price increases above 2% have left price levels 9% above where they would have been had inflation remained at 2%. (Chart 10).
Headline CPI Inflation
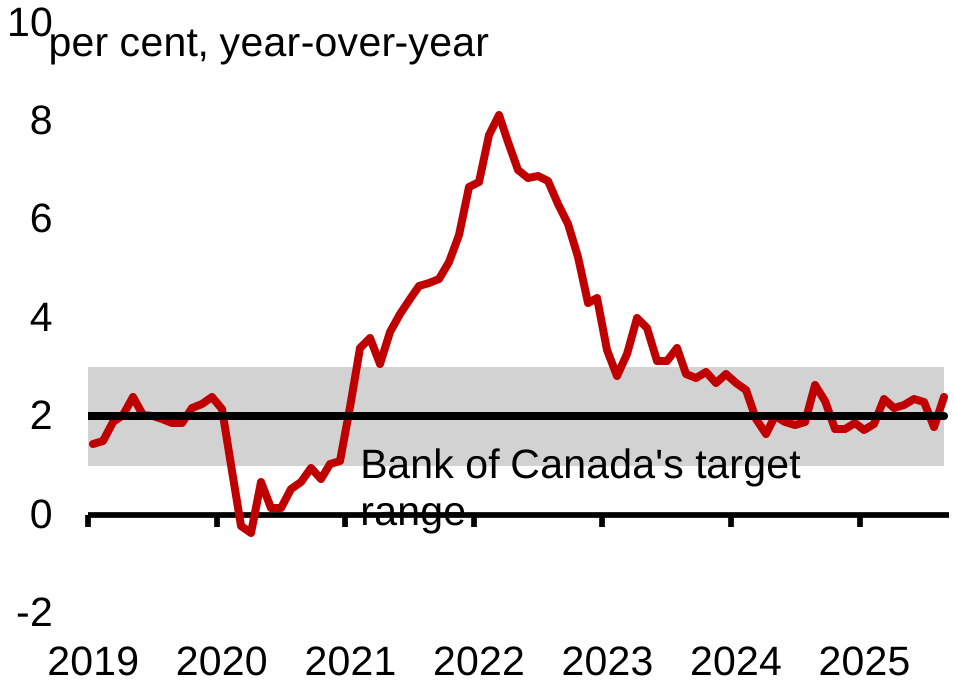
Consumer Price Index
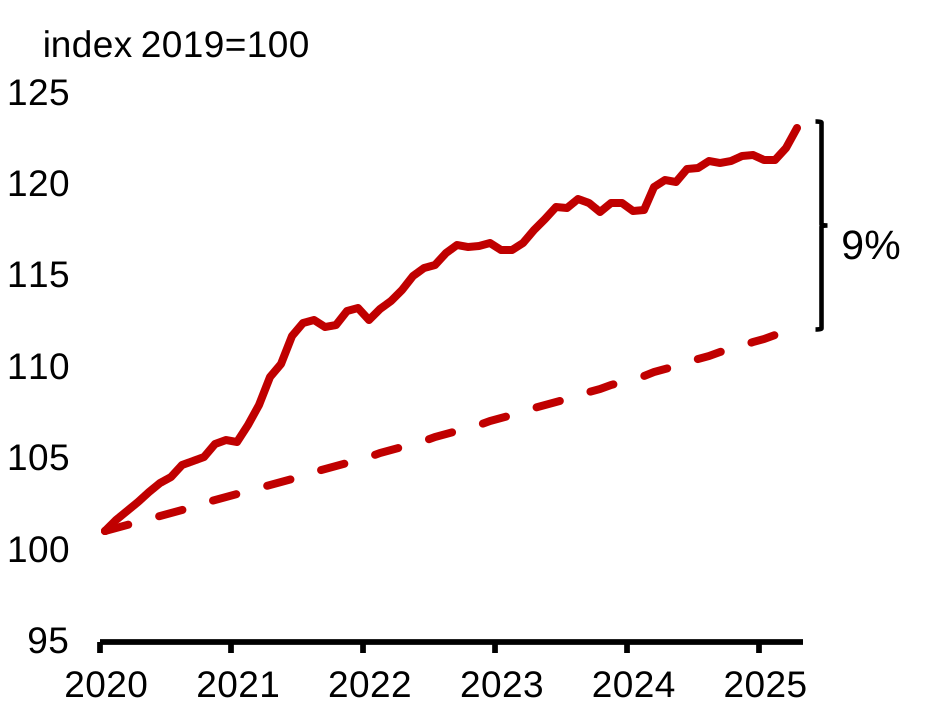
Enter the chart text version.
- The unemployment rate was 6.9% in April, below its recent peak of 7.1% (Chart 11).
- Real wage growth (wage growth less inflation) has been positive for three years, and at 2.2% in March 2026 is well above its pre-pandemic average of 0.7% (Chart 12).
Unemployment Rate by Age Group
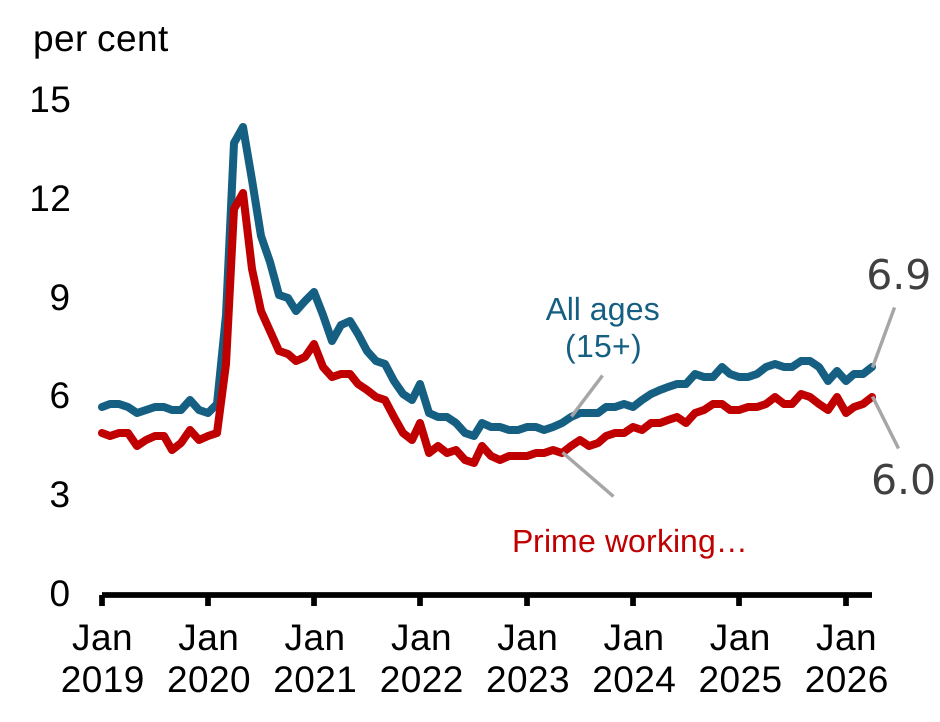
Real Wage Growth
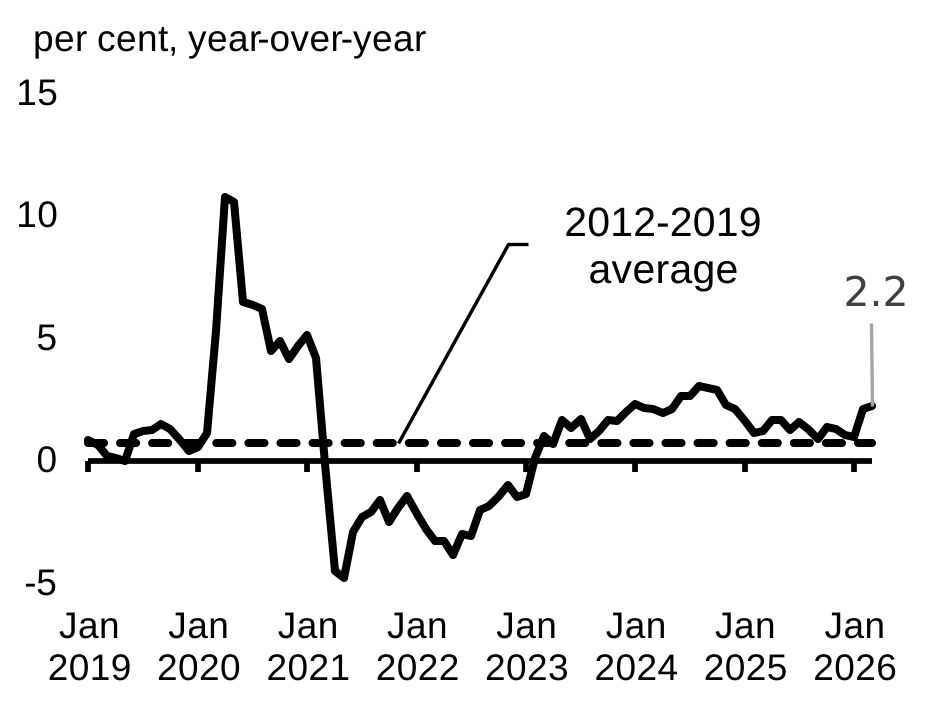
- Consumer confidence remains near historic lows, but has improved since the spring of 2025 (Chart 13).
Consumer Confidence
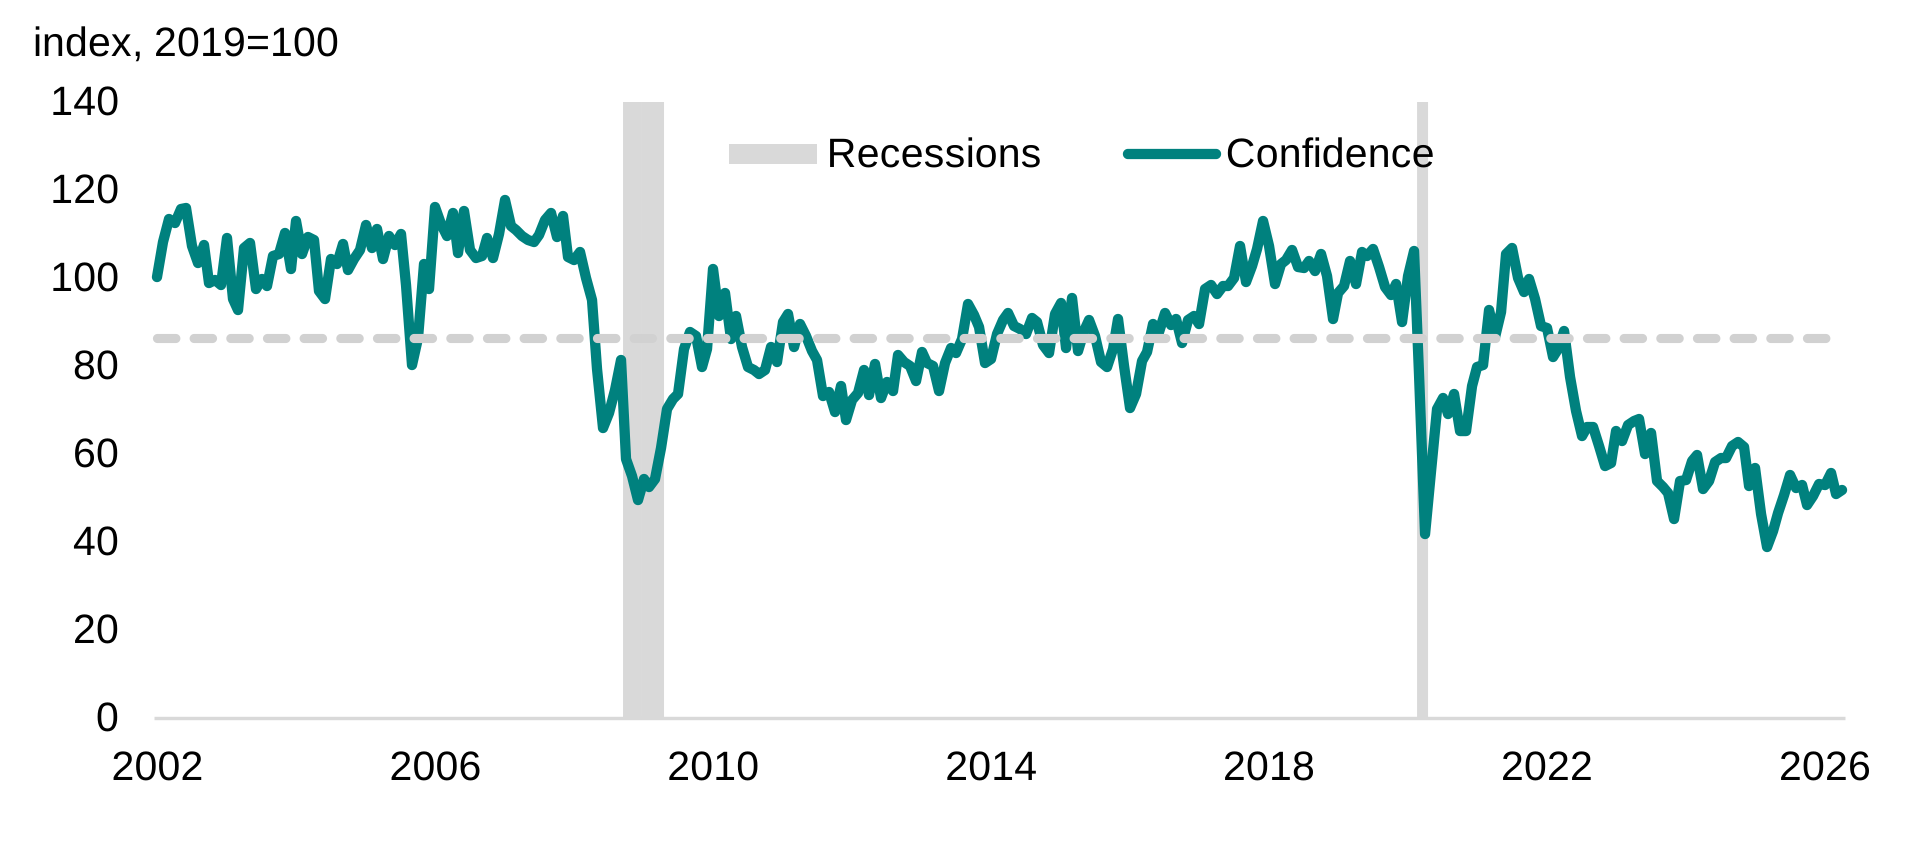
- The increase in food, rent and owned accommodation costs have outpaced overall price inflation since 2019, but wages have risen at a similar pace, meaning rising purchasing power for Canadians (Chart 14).
Change in Key Prices and Nominal Wages Since 2019
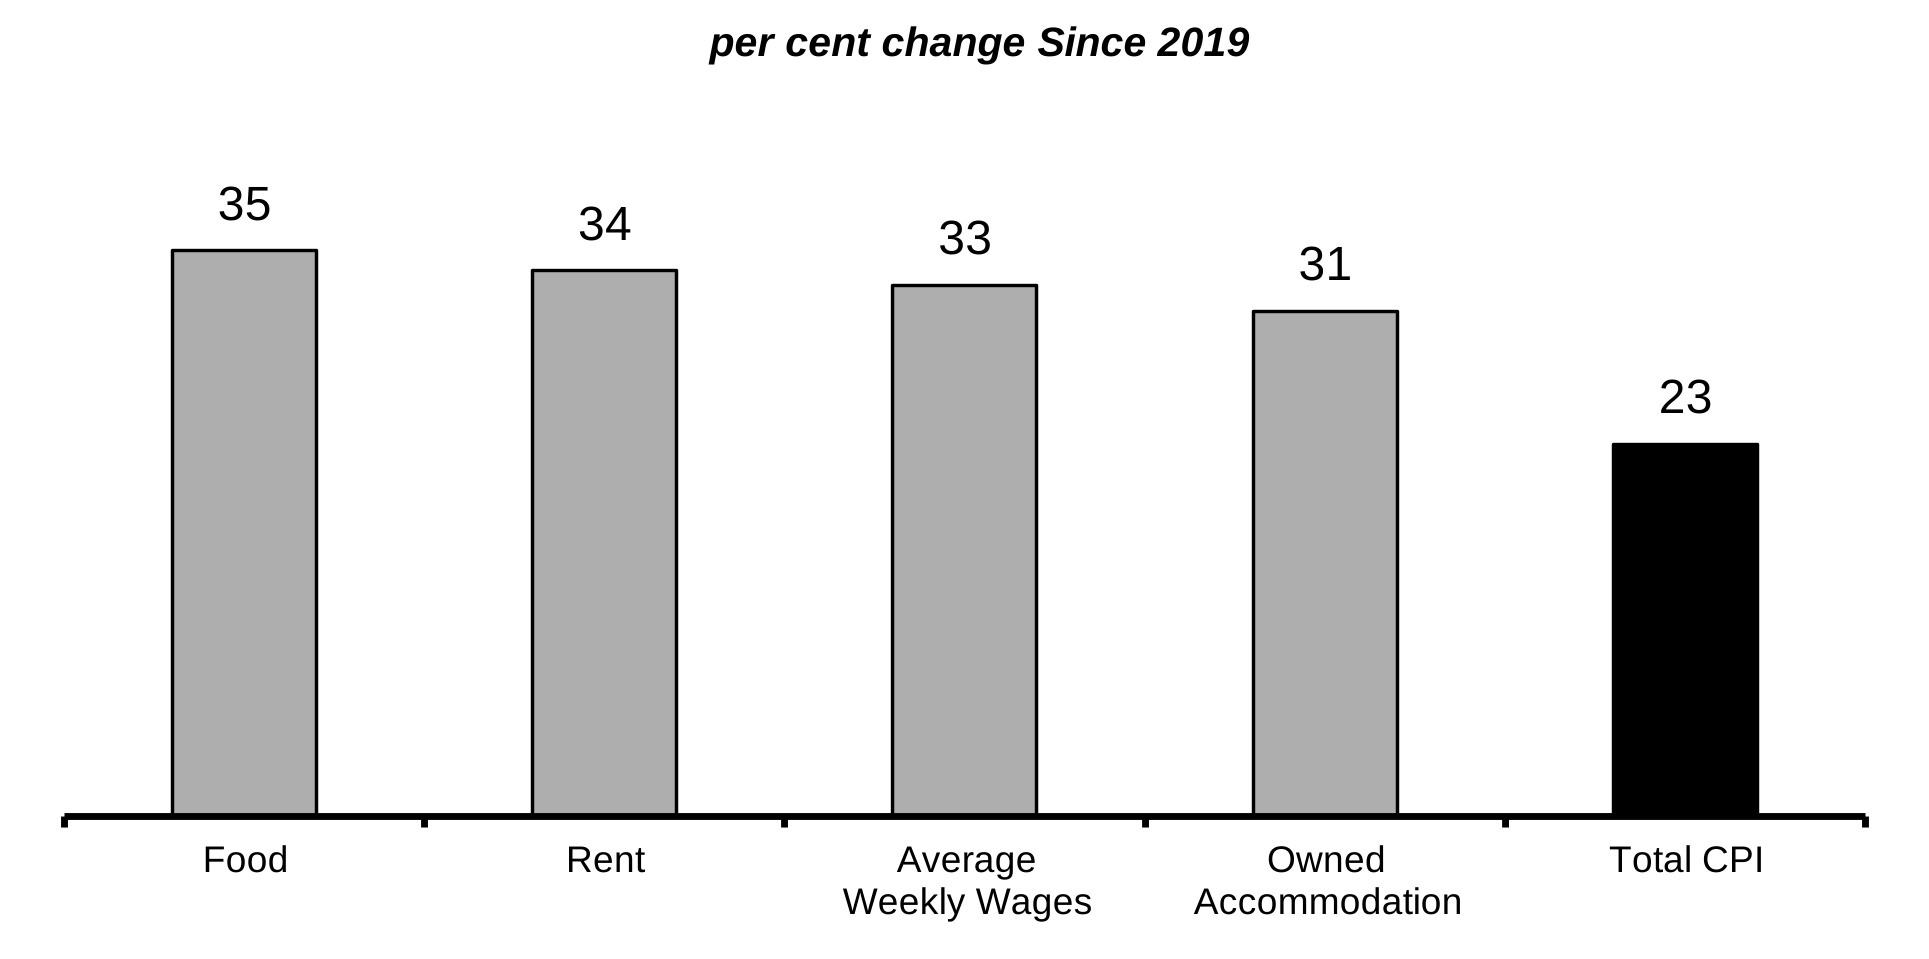
- The lowest income households spend 85 per cent of their disposable income on food and shelter (Chart 15). In contrast, the highest earners spent 22 per cent of their disposable income on food and shelter. The Canada Groceries and Essential Benefit is targeted to those Canadian families needing it most.
Share of Income Spent on Food and Shelter, by Income Quintiles
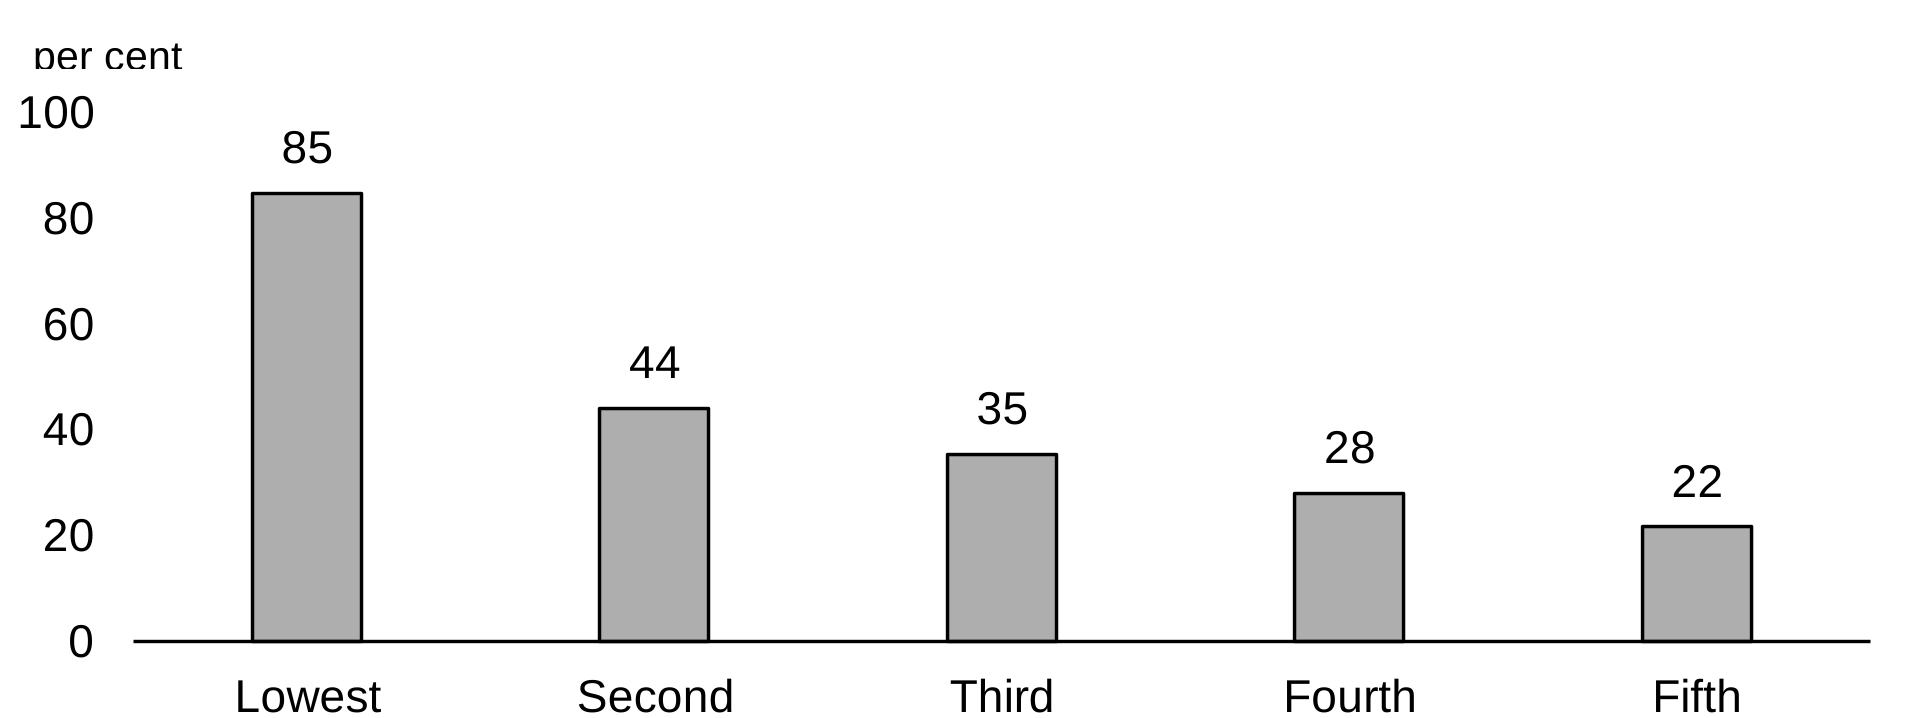
- Real wages are determined by productivity growth (Chart 16). The key to sustaining affordability is to promote productivity growth by investing in Canada.
- If Canada had matched the U.S. rate of productivity growth over the past 20 years the average Canadian family income would be $19,000 dollars higher today (Chart 17)
Labour Productivity and Real Wages
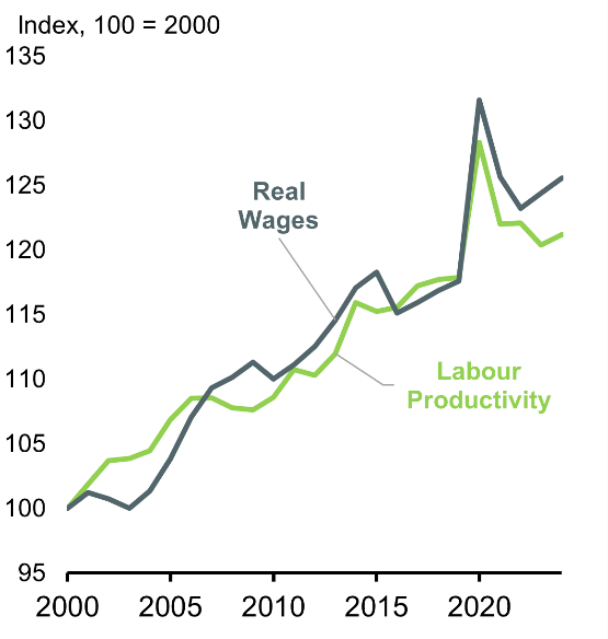
Labour Productivity Level
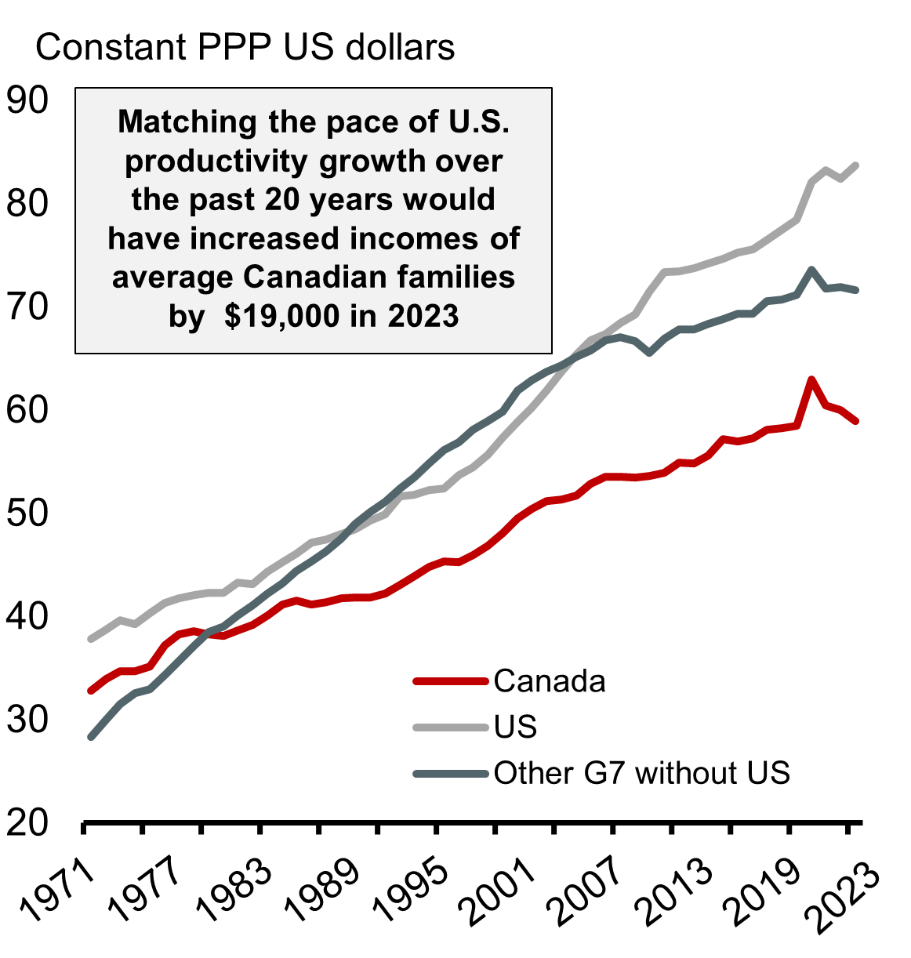
Section 2: Grocery Prices
- Compared to headline inflation, which was 2.4% in March 2026, grocery inflation remains elevated at 4.4%, though it has come down since December 2025 (Chart 18).
Headline and Food from Stores Inflation
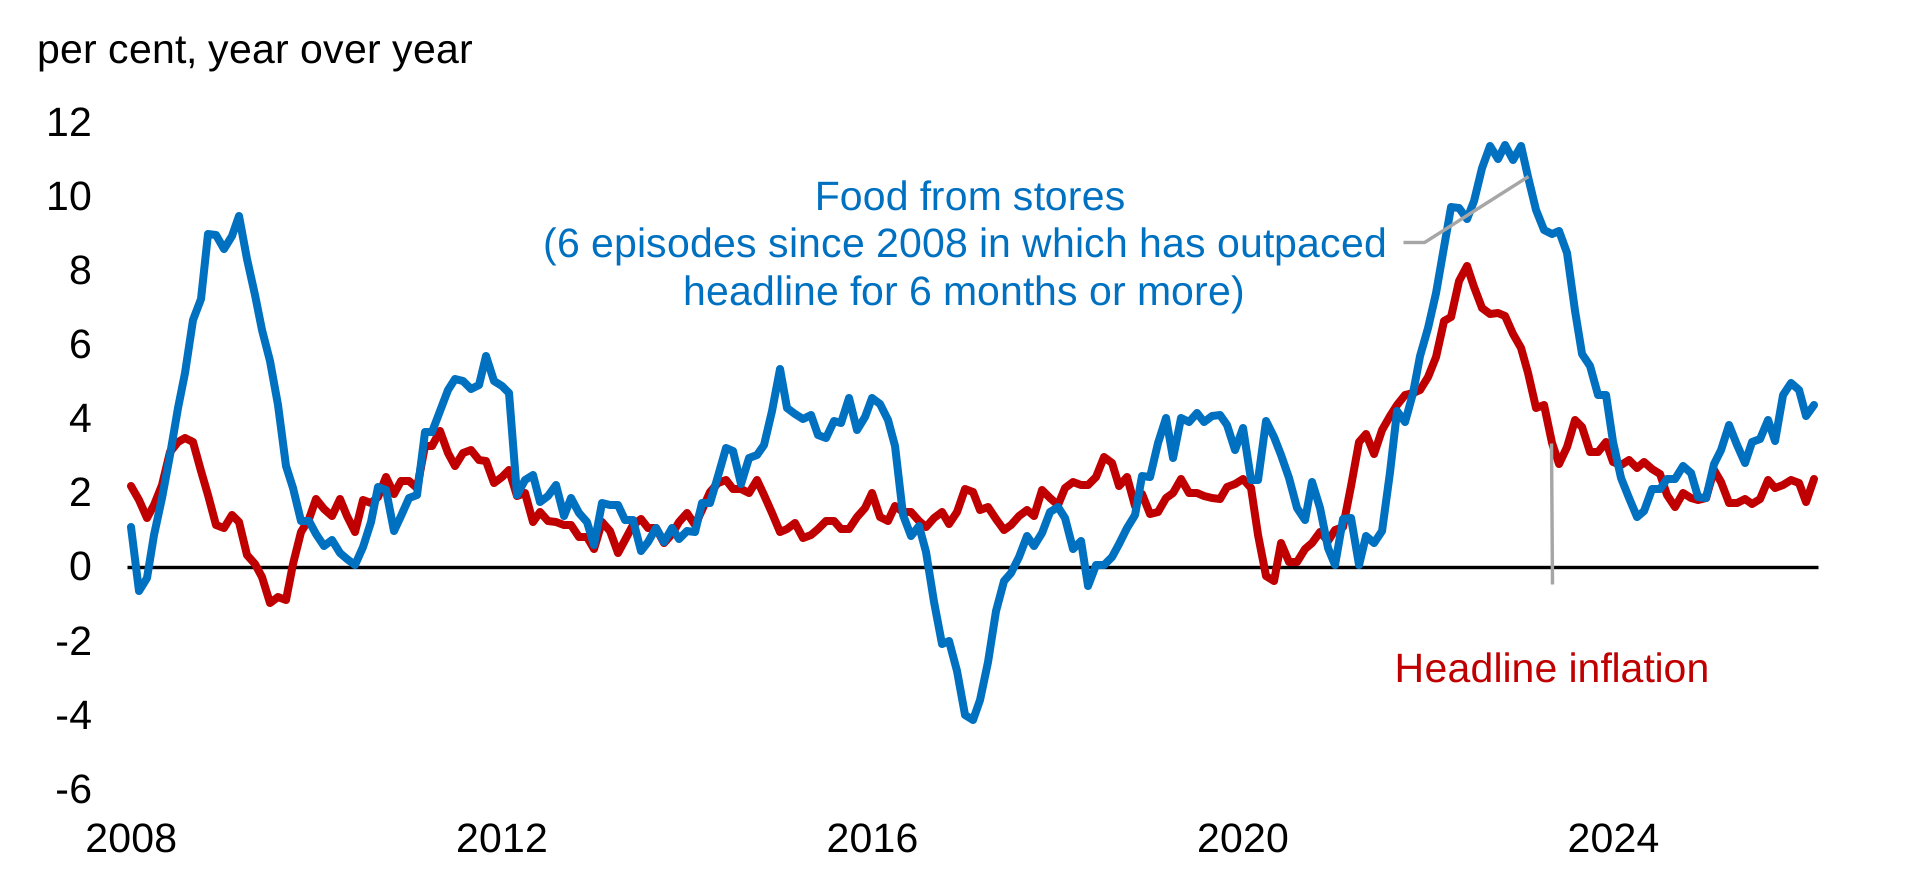
- Higher grocery prices largely reflect global factors. Canada ranked in the middle of its G7 peers for average annual grocery and overall inflation from 2019 to 2025 (Chart 19).
Grocery and Overall Inflation, G7 Countries, 2019 to 2025
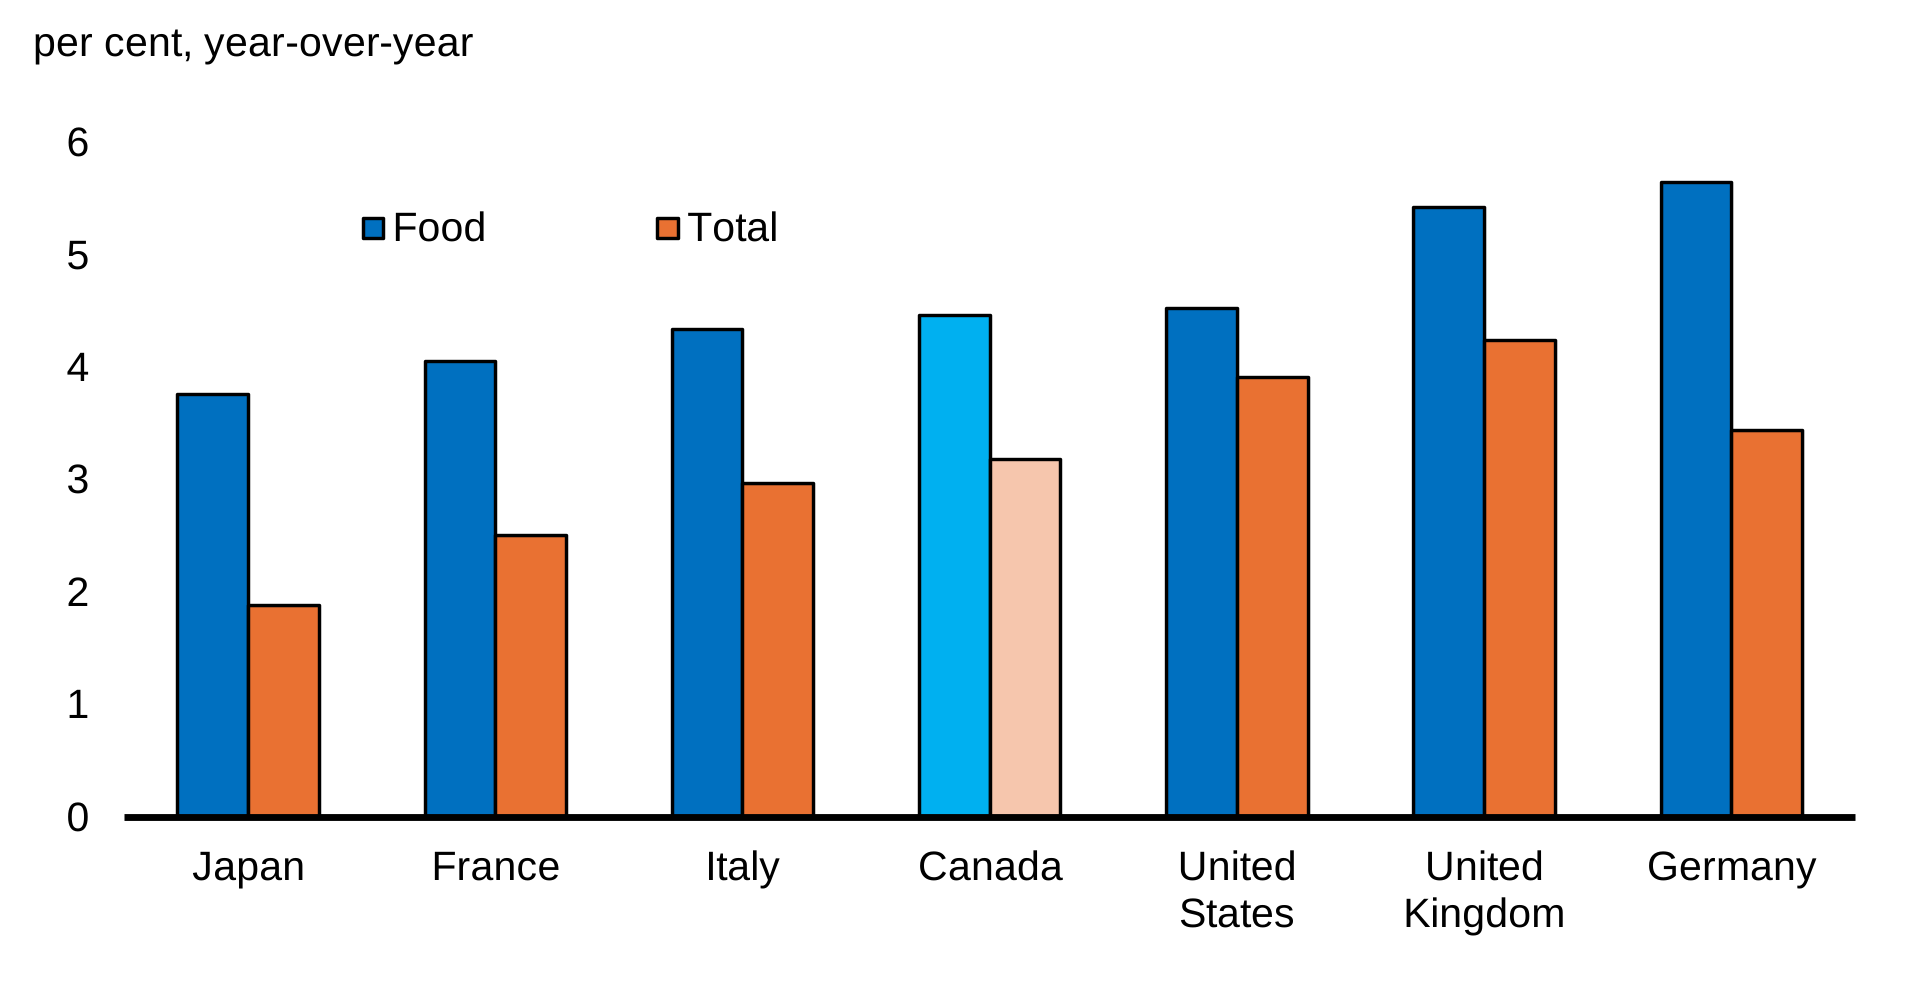
- More recently, as of March 2026, Canada ranked the middle of its peers in terms of overall inflation (Chart 20). However, in terms of food inflation, Canada now ranks among the highest in the G7 (Chart 21).
Overall Inflation, G7 Countries, March 2026
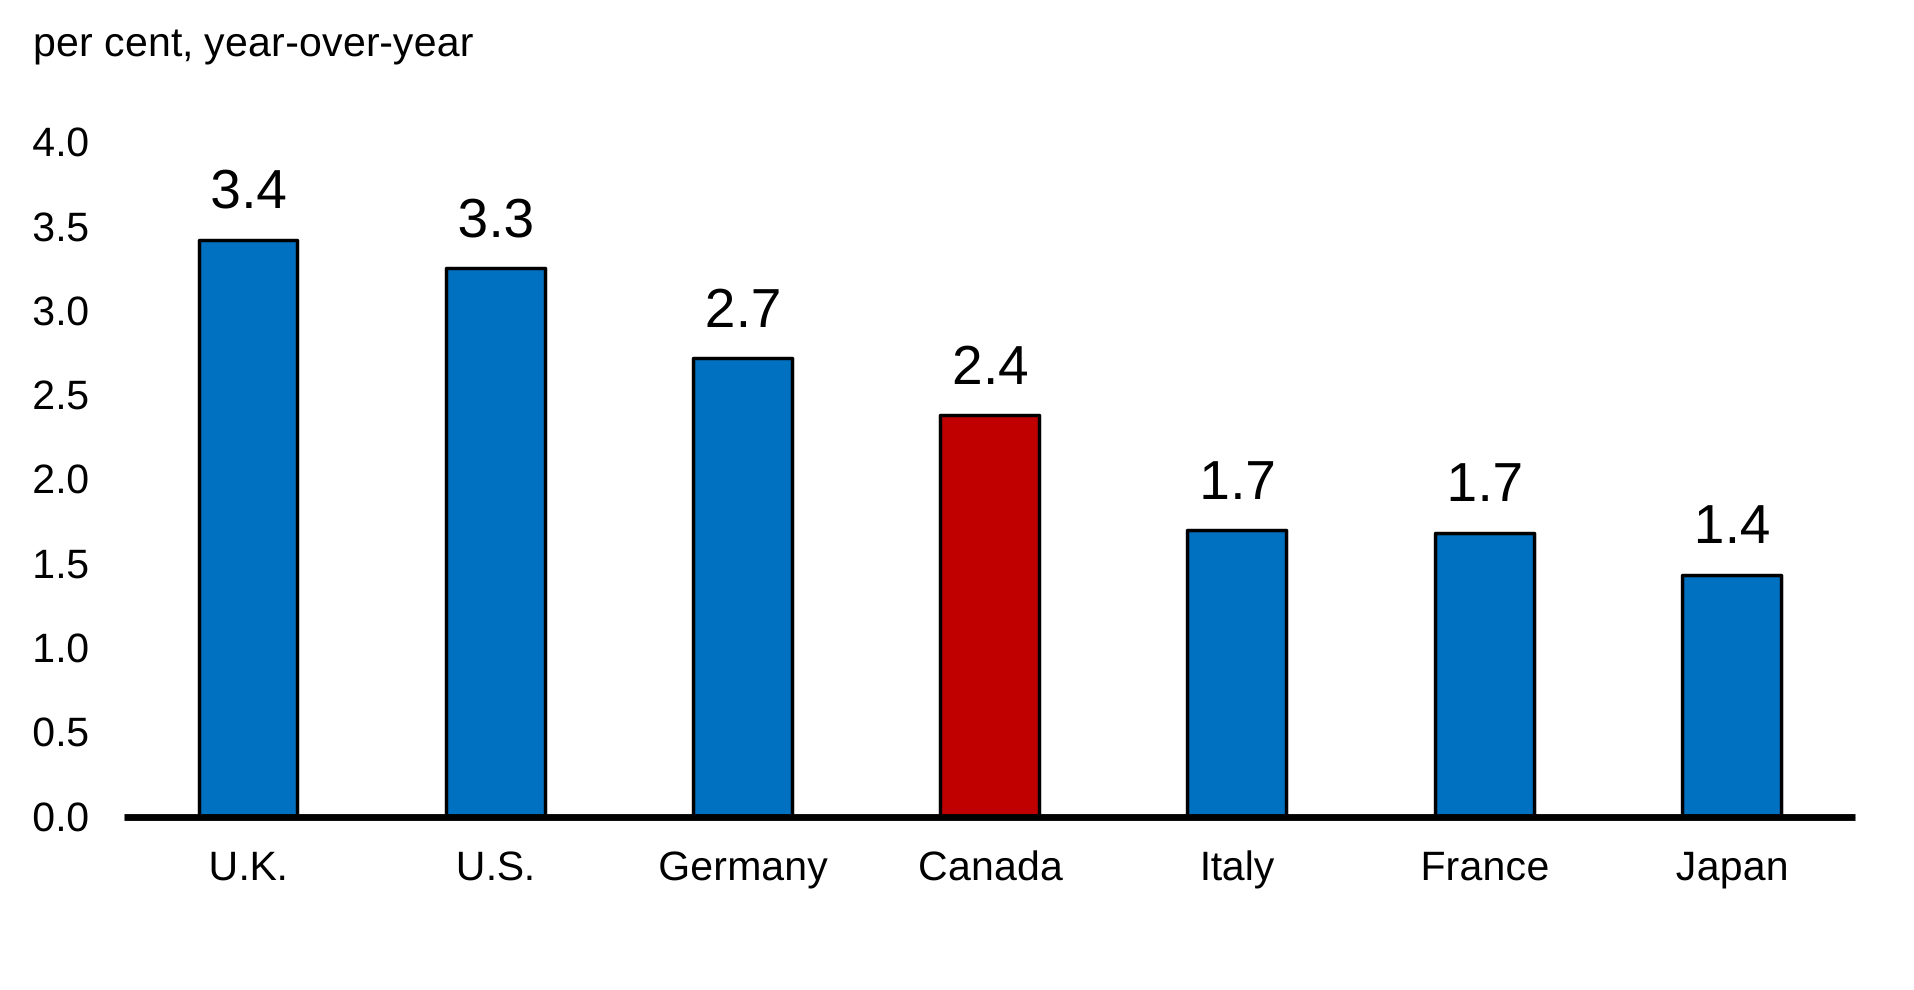
Food Inflation, G7 Countries, March 2026
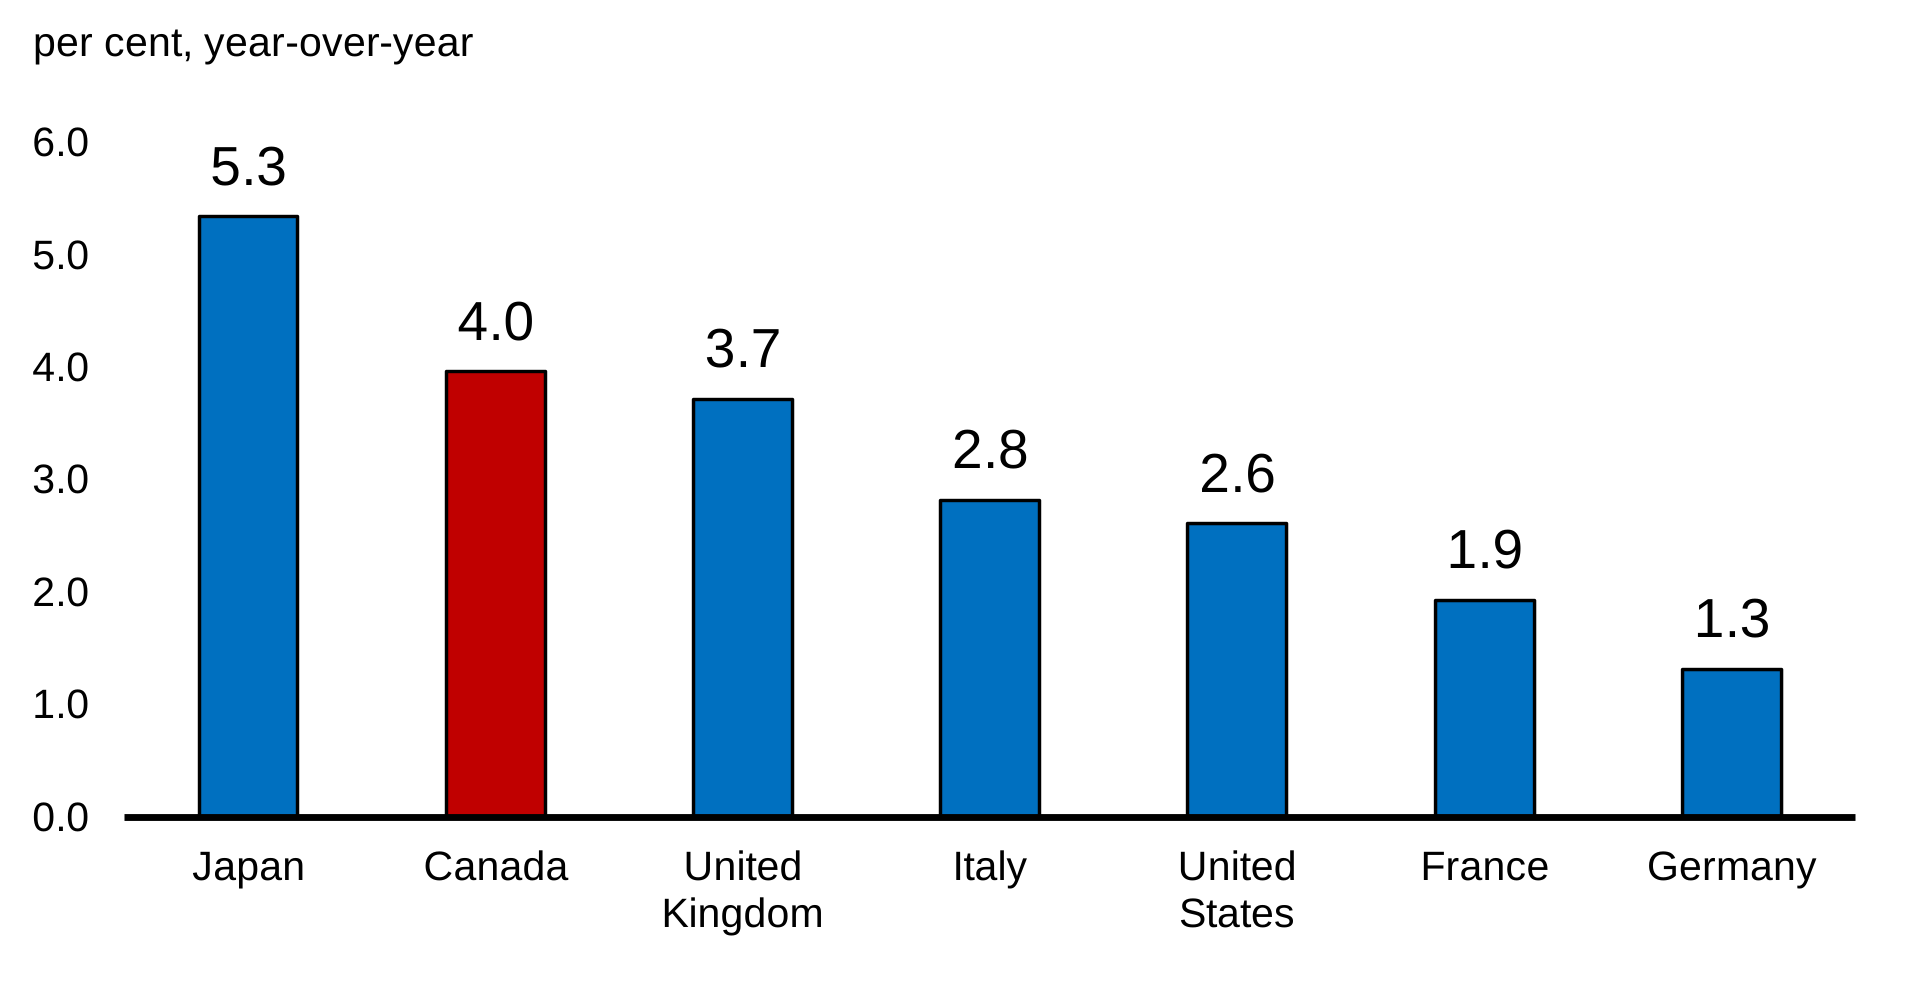
Section 3: Housing, rent and other important prices
- Increased supply and more balanced demand have resulted in a strong improvement in rental housing affordability. Year-over-year asking rents have now declined for 19th straight months and are down year-over-year in most major centres (Chart 22).
Asking Rent
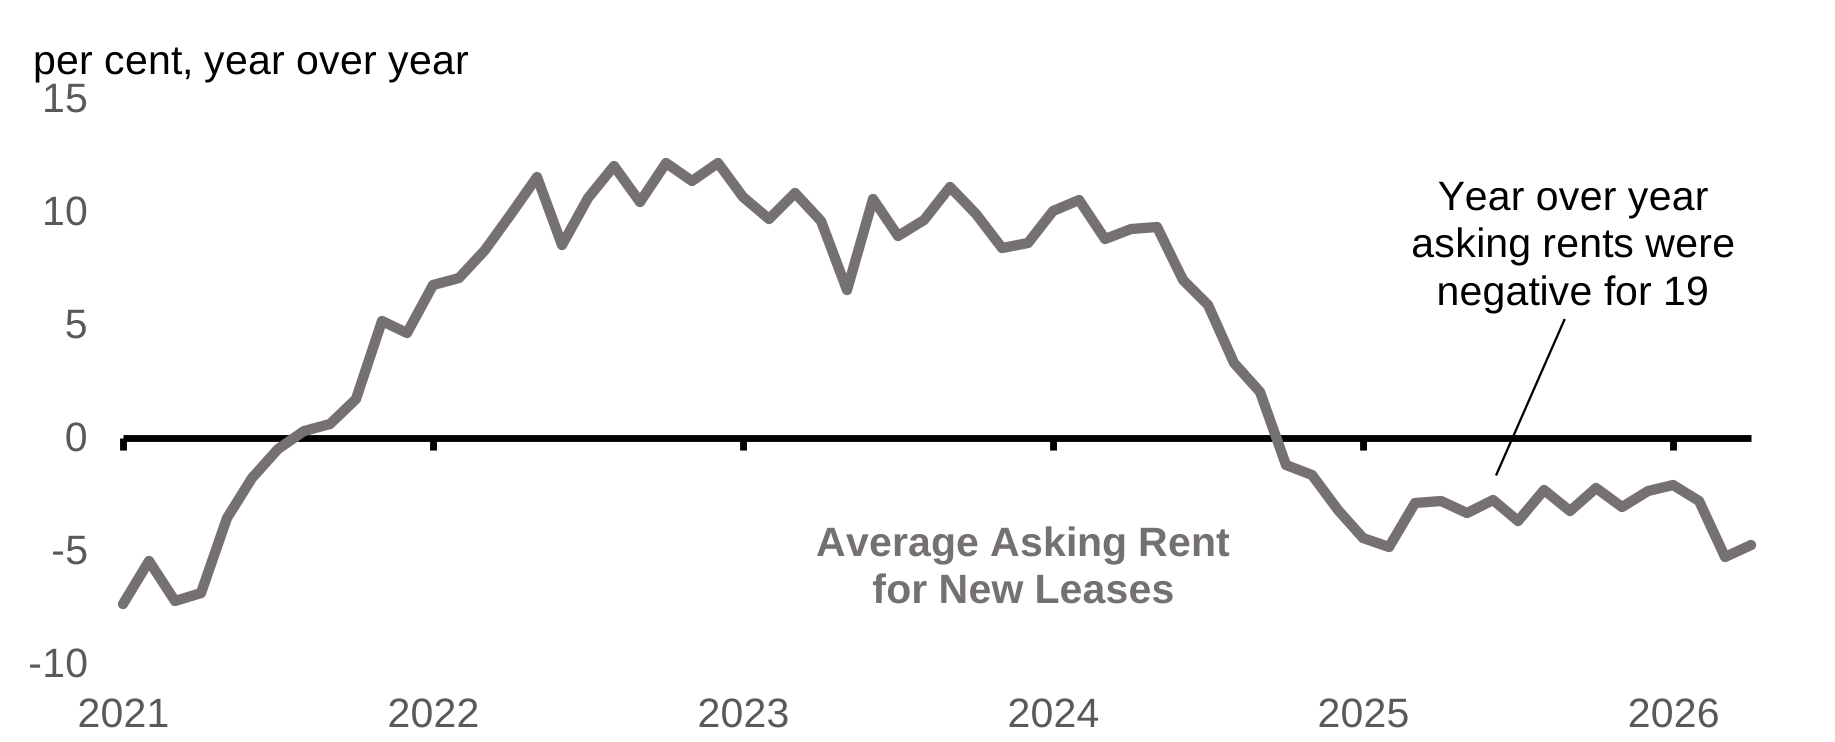
- Rental costs have declined across Canada (Table 18).
| Jurisdiction | Asking rents (2 bedrooms) | Y/Y |
|---|---|---|
| Alberta | $1,743 | -3.0% |
| Calgary | $1,842 | -3.7% |
| Edmonton | $1,637 | -1.0% |
| Nova Scotia | N/A | N/A |
| Halifax | $2,534 | -2.4% |
| British Columbia | $2,614 | -5.0% |
| Vancouver | $3,317 | -2.8% |
| Ontario | $2,420 | -4.0% |
| Toronto | $2,863 | -2.2% |
| Mississauga | $2,440 | -5.4% |
| Ottawa | $2,472 | -4.0% |
| London | $2,055 | -4.6% |
| Windsor | $1,790 | -9.1% |
| Saskatchewan | $1,509 | 1.0% |
| Saskatoon | $1,562 | -0.8% |
| Regina | $1,533 | 1.6% |
| Quebec | $2,204 | 1.0% |
| Montreal | $2,341 | 3.0% |
| Gatineau | $1,895 | -8.0% |
| Quebec City | $1,683 | -3.3% |
|
Source: Rentals.ca. All property types. |
||
- Average national prices for existing homes have declined from over $825,000 in February 2022 to under $660,000 in April 2026, improving affordability for homeowners (Charts 23, 24 and Table 19).
MLS Benchmark Home Price
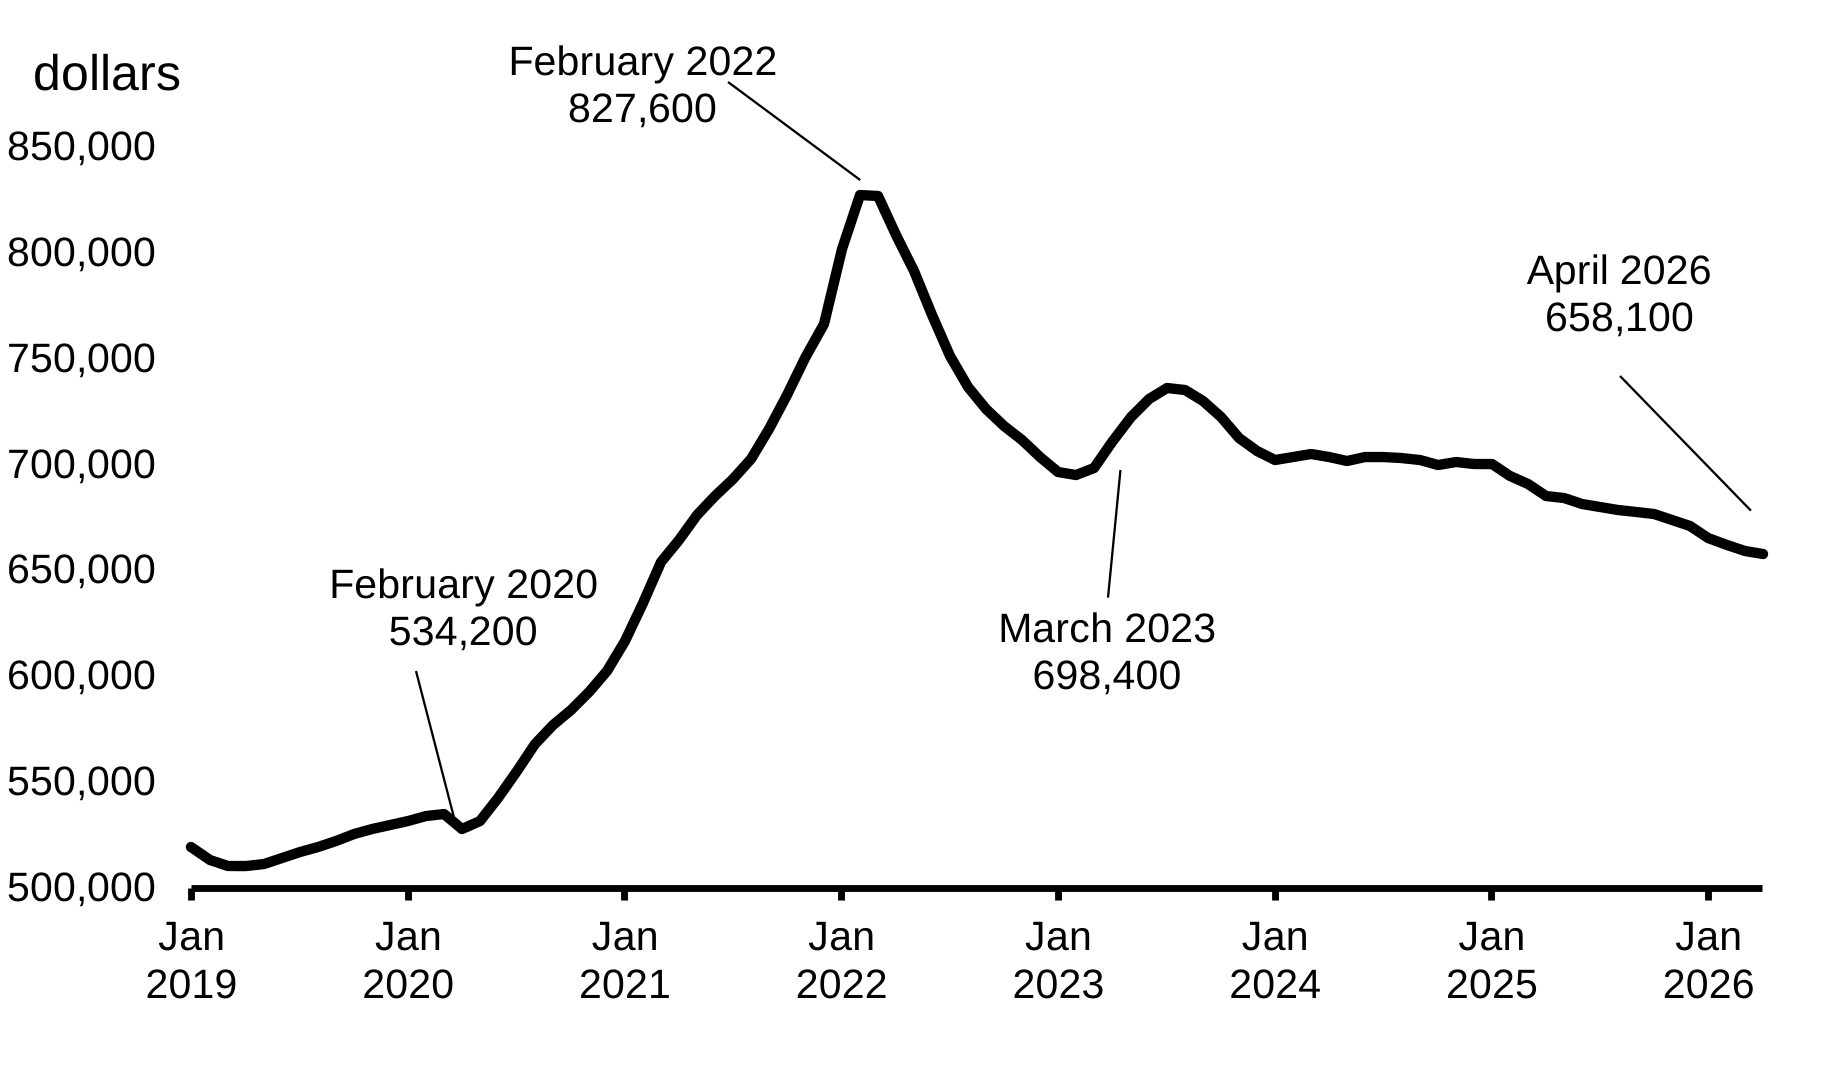
Home Price Changes as of April 2026, Selected Cities
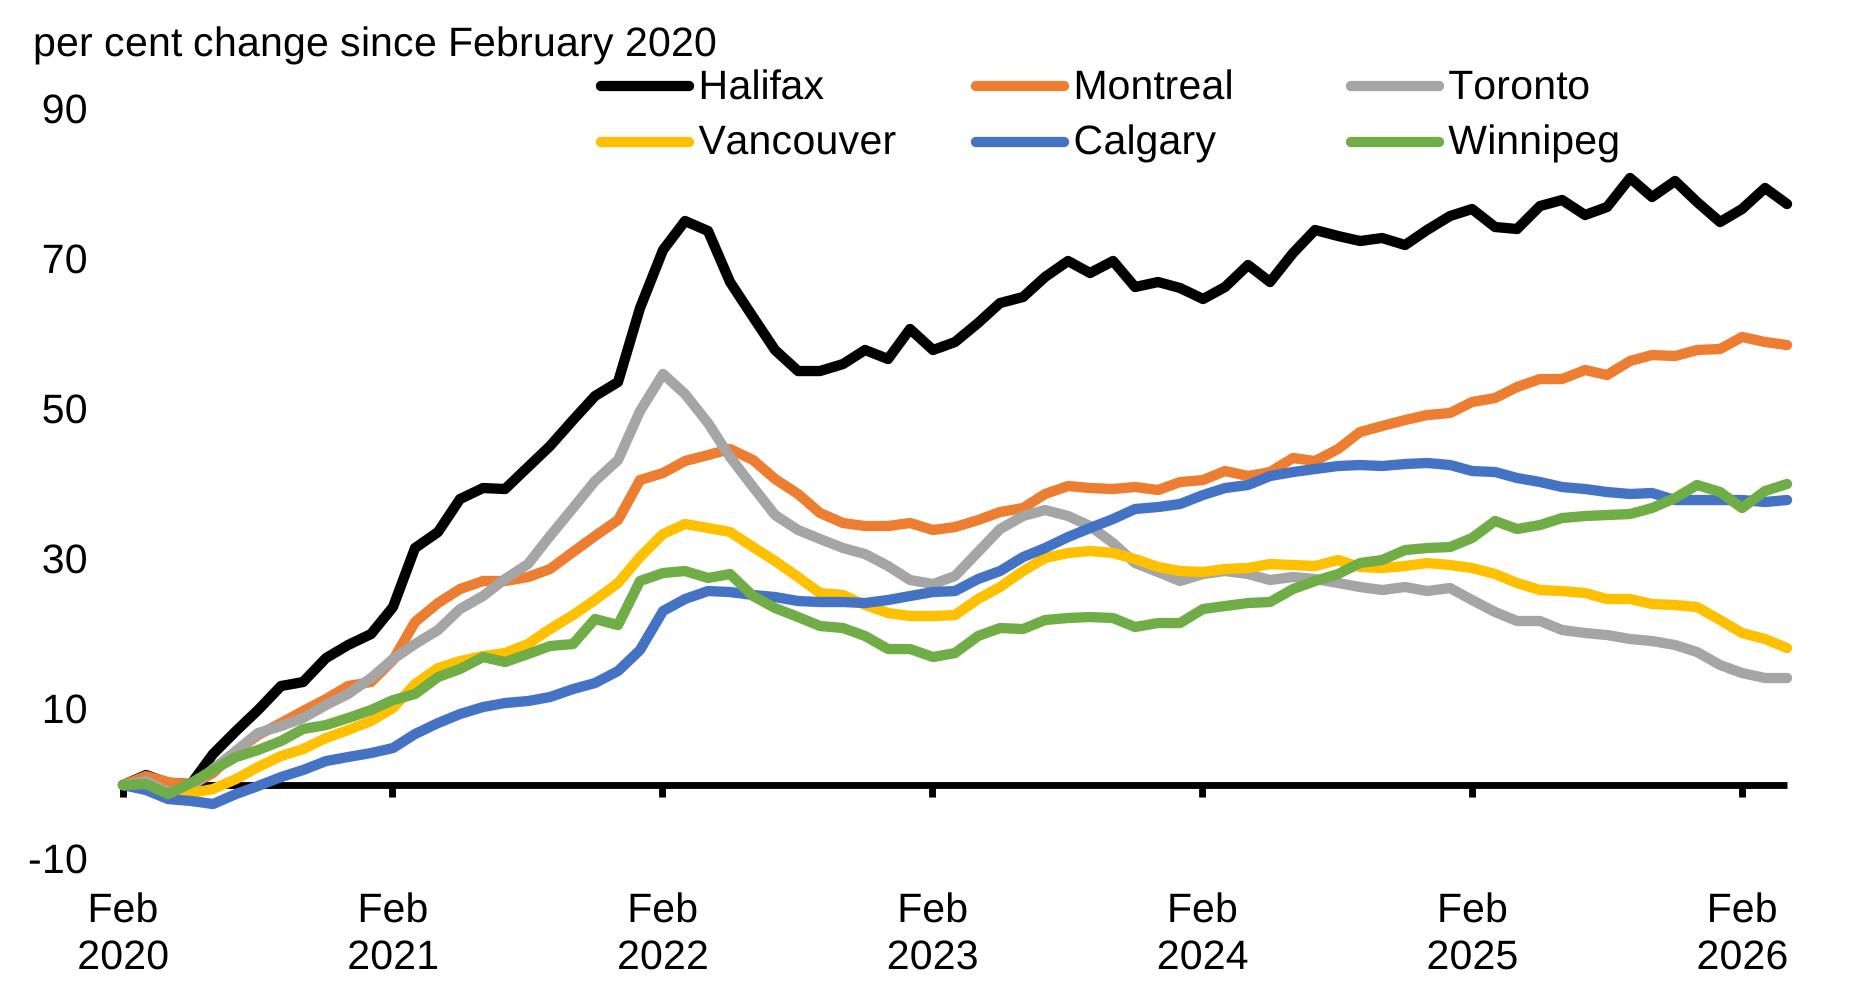
| m/m | y/y (per cent) | vs. city-level peak (per cent) | |
|---|---|---|---|
| Halifax | -1.2 | 2.0 | -1.9 |
| Montreal | -0.3 | 3.7 | -0.7 |
| Quebec | 1.4 | 11.6 | 0.0 |
| Toronto | 0.0 | -6.3 | -26.2 |
| Hamilton | -0.4 | -7.5 | -28.5 |
| Waterloo | 0.3 | -6.5 | -30.7 |
| Ottawa | 0.6 | -0.7 | -9.4 |
| Winnipeg | 0.7 | 4.5 | 0.0 |
| Saskatoon | -0.6 | 3.2 | -0.6 |
| Calgary | 0.3 | -2.1 | -3.4 |
| Edmonton | 0.9 | -1.4 | -1.9 |
| Fraser Valley | -0.4 | -7.2 | -23.4 |
| Vancouver | -1.0 | -6.8 | -12.3 |
| Victoria | -0.1 | -0.5 | -7.6 |
|
Source: Canadian Real Estate Association |
|||
- Lower home prices, along with lower mortgage payments and higher incomes, mean that the share of disposable income needed to pay mortgages and utilities is down from 54.5% in mid-2023 to just 42.7% in late 2025 (Chart 25).
National Housing Affordability Index
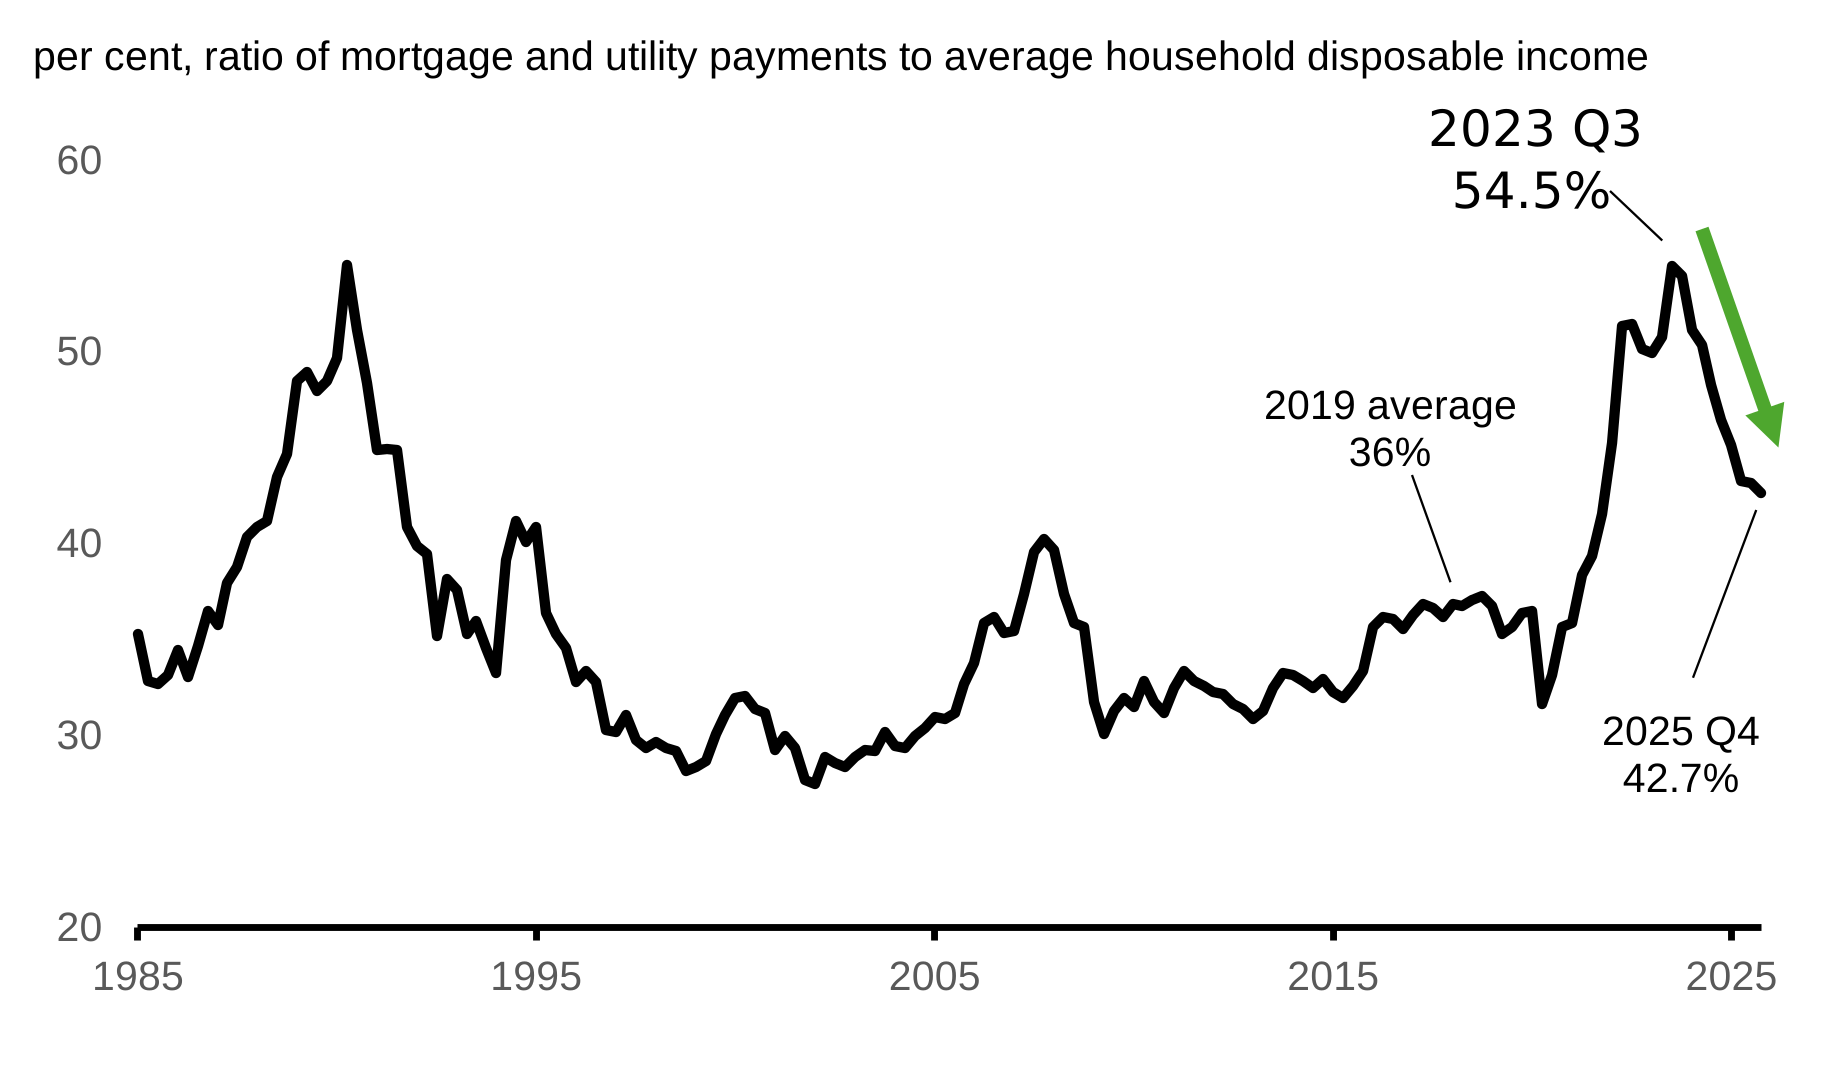
- Canadian average national gasoline price rose to its highest level since 2022 in early May: on May 11 it stood at 190.9¢/l), down slightly from the recent May 6 peak (198.3¢/l) (Chart 26). The fuel excise tax removal on April 20 is giving important and timely relief to consumers.
Canadian Gasoline and Diesel prices
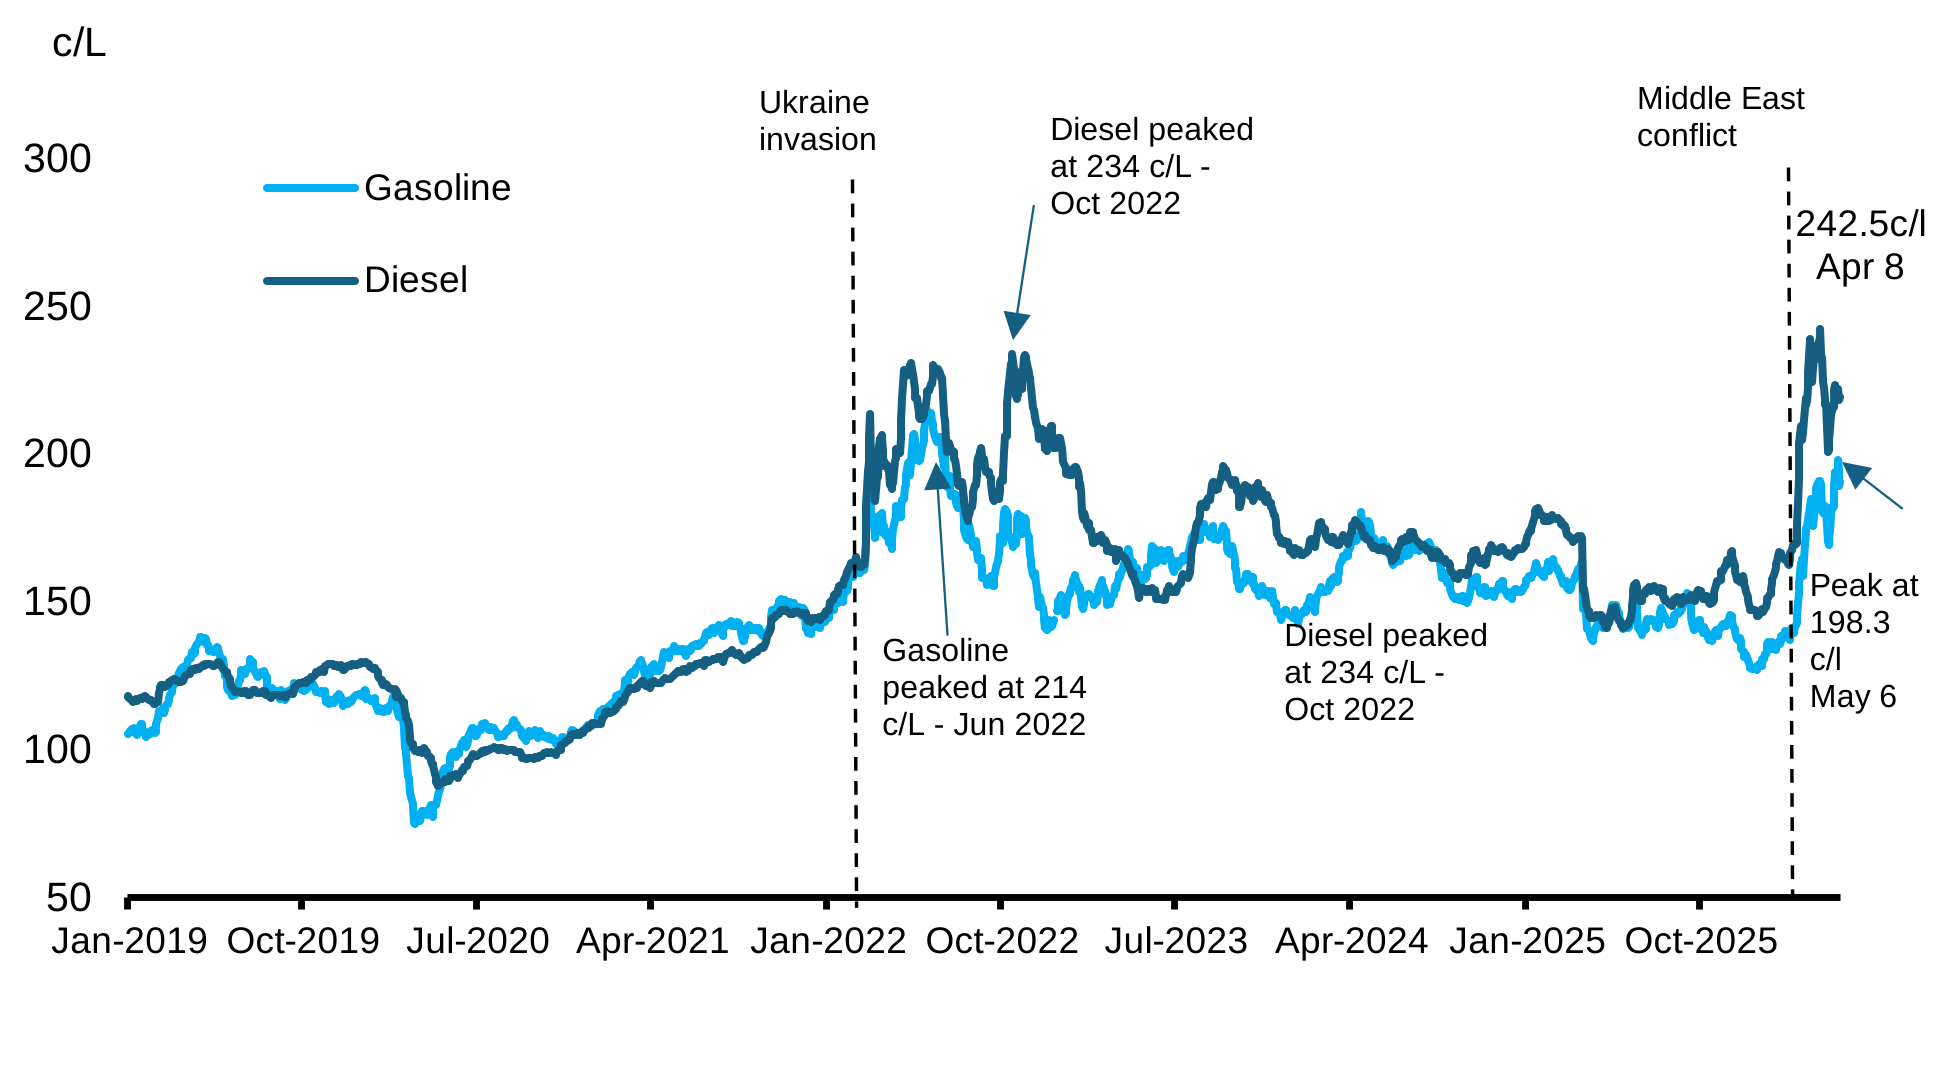
| Change since February 27 (c/l, %) | Change since recent peak (c/l, %) |
Change since April 20 (c/l, %) |
|
|---|---|---|---|
| Canadian Gasoline price (May 11, 2026) |
49.1 (34.6%) | -7.4 (-3.7%) |
20.3 (11.9%) |
|
Note: Last data point is May 11, 2026. Recent peak is May 6, 2026 (198.3 c/l). Source: Kalibrate, Finance calculations. |
|||
- Some provinces have seen gasoline prices rise by 40% or more - Alberta (43%), Ontario (42%), and New-Brunswick (40%). Diesel price increases are relatively smaller, but still up 30% compared to pre-conflict levels.
- In the U.S., early May gasoline prices are 52% higher than end-February. In dollar terms, gasoline price increases are similar across the G7 once tax differences are accounted for, with Canada tending towards the higher end of the spread.
Chart 27
Change in gasoline prices by P/T
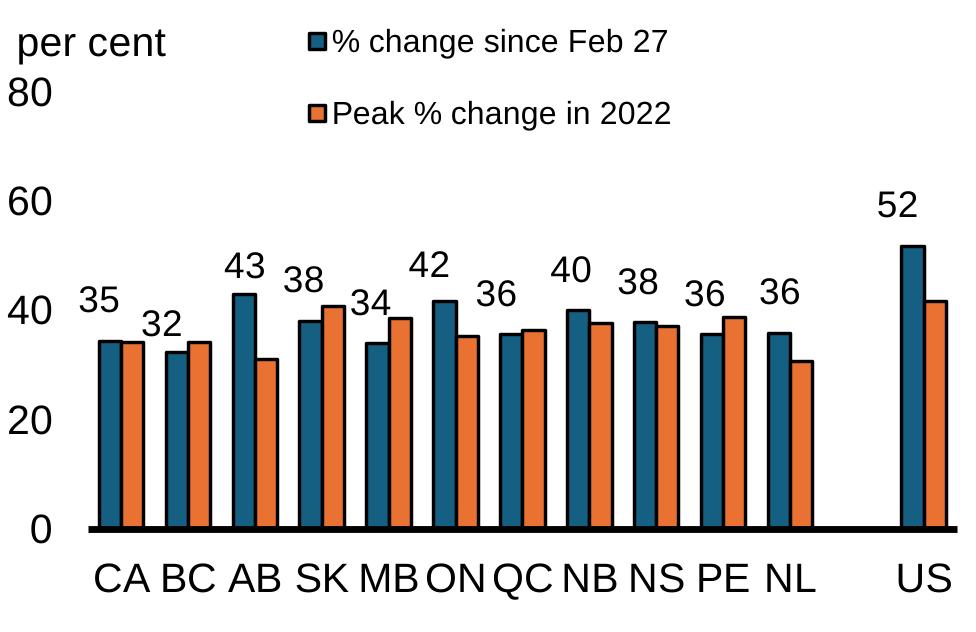
Chart 28
Change in gasoline prices by P/T
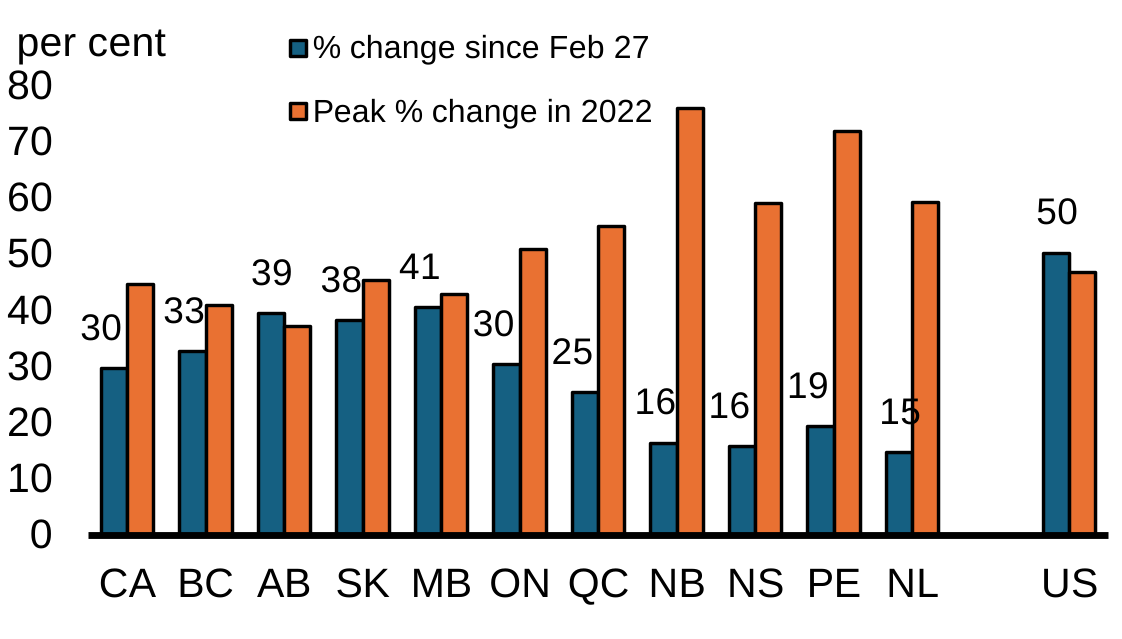
Enter the chart text version.
- Oil prices continue to be volatile and highly reactive to conflict negotiation developments. On May 12, Brent spot prices rose to around US$108 per barrel, with WTI around US$101 per barrel. Oil futures are increasing, with the market now seeing higher oil prices lasting for longer; through to end-year compared to previous futures curves which implied a price normalization mid-year onward.
Chart 29
WTI Crude Oil prices (2026)
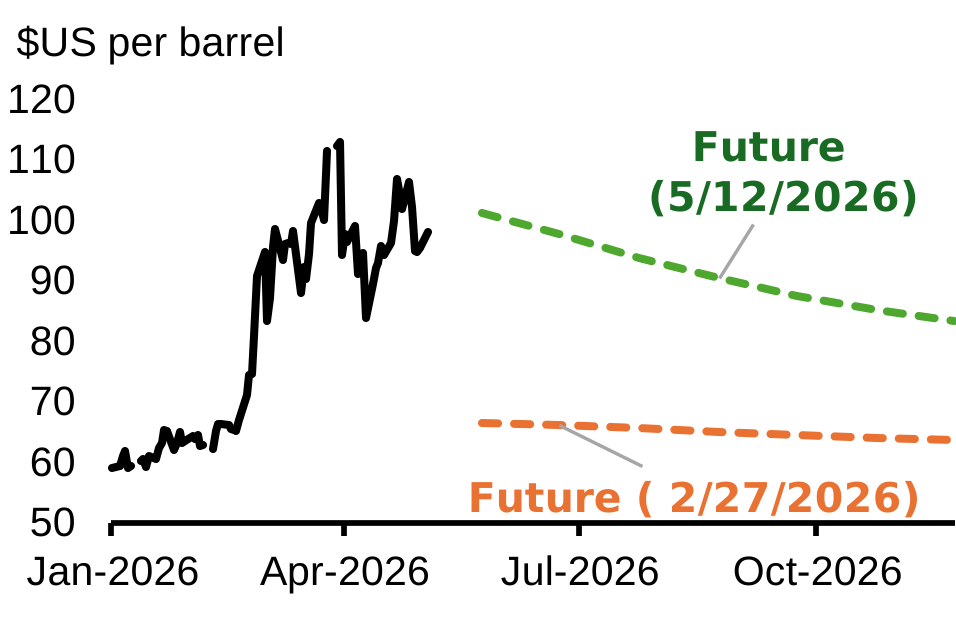
Chart 30
Change in gasoline prices – G7
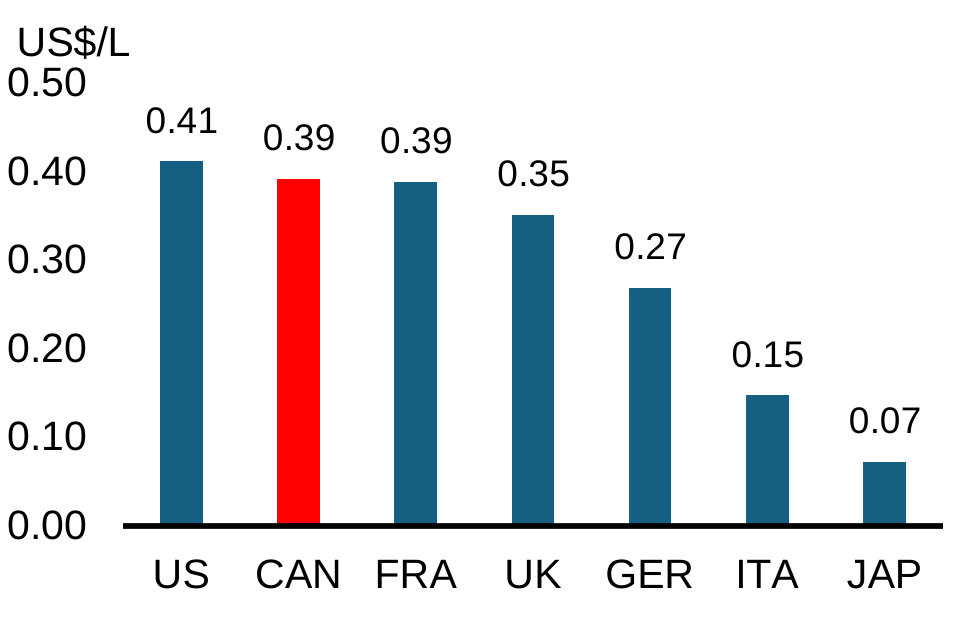
Enter the chart text version.
- Actions taken to improve affordability by this government have produced concrete results (Chart 31). Child care costs are down 23% since 2019. Cellular service prices are down 52% since 2019.
Price of Child Care and Cellular Services
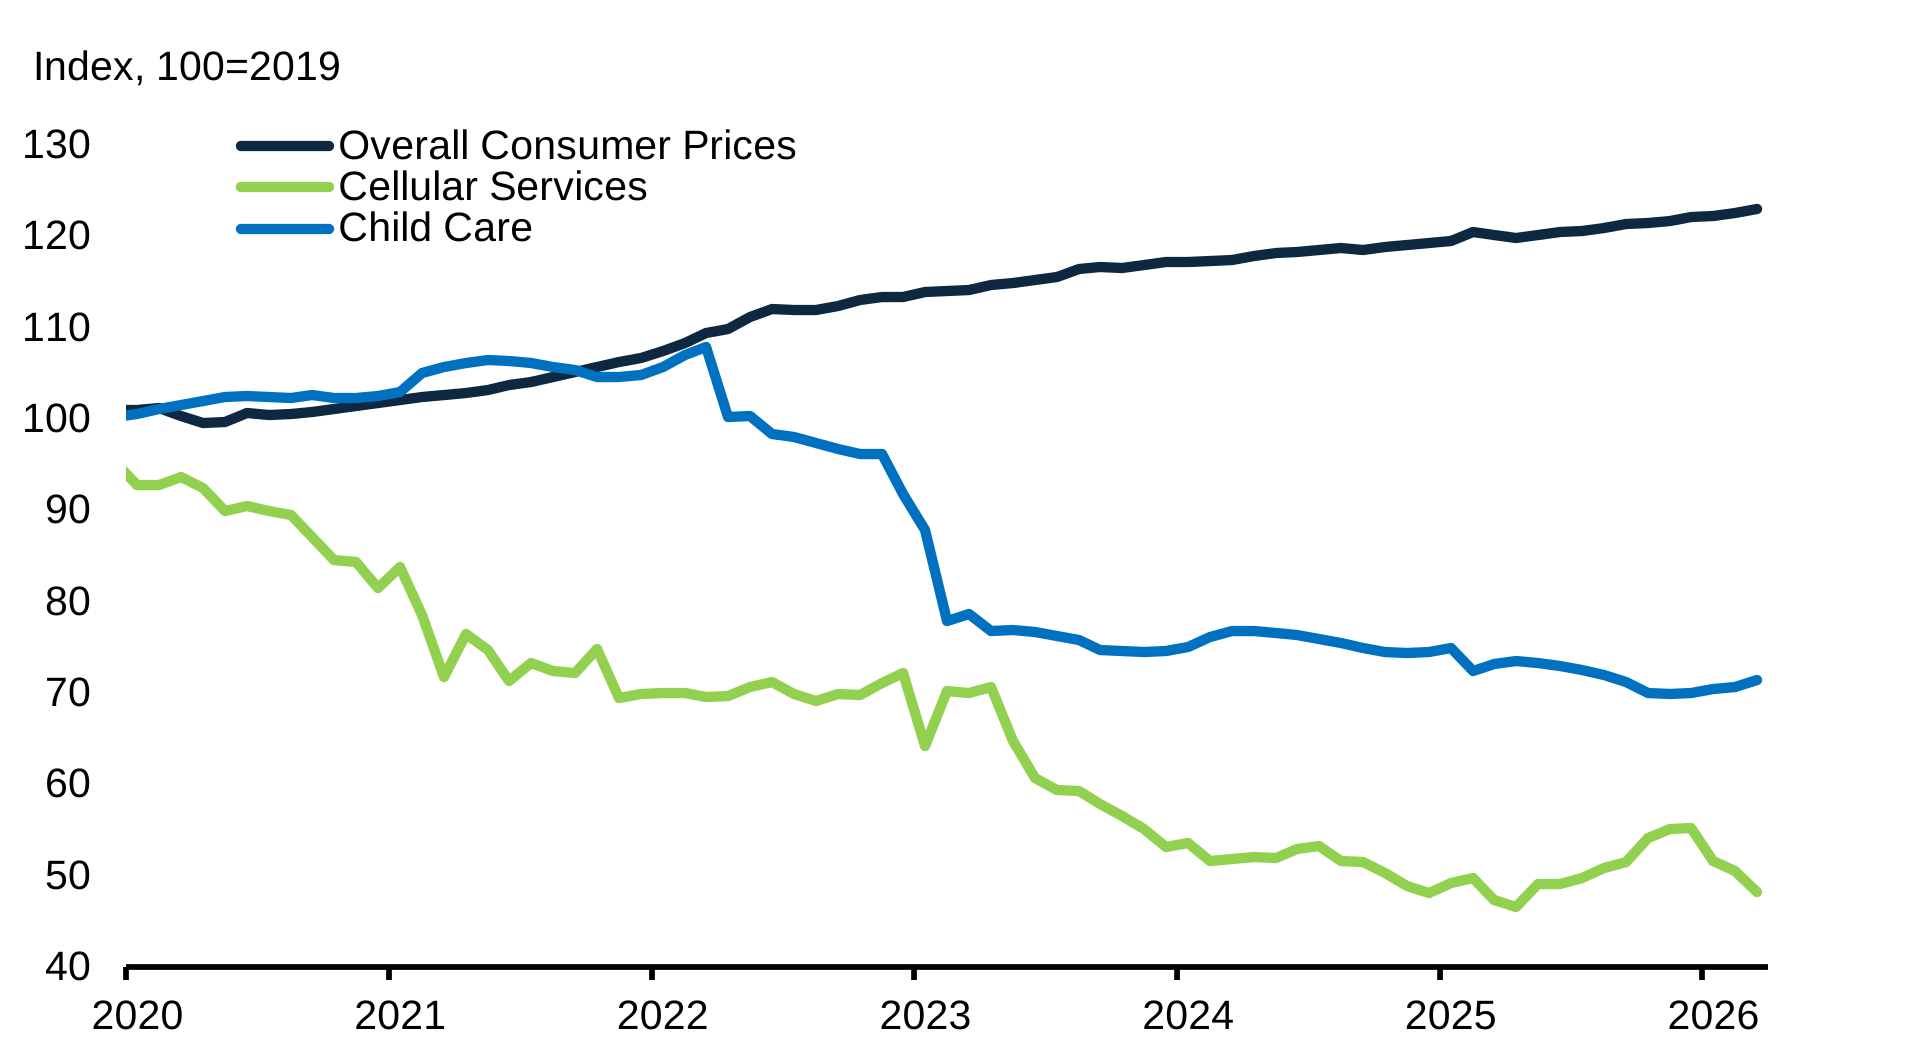
Grocery Affordability and Food Inflation
Key Messages
- Recently, food price increases have included specific products such as beef, coffee, cocoa, and lettuce. Global supply chain shocks caused by tariffs, a changing climate, and geopolitical disruptions have caused food prices to rise faster than overall inflation.
- The government has recently announced new measures to make groceries and other essentials more affordable:
- A Canada Groceries and Essentials Benefit – formerly the Goods and Services Tax (GST) Credit – that will increase by 25% for five years beginning in July 2026, and a one-time top-up payment to be issued June 5th, equivalent to a 50% increase this year.
- Setting aside $500 million from the Strategic Response Fund to help businesses address the costs of supply chain disruptions.
- $150 million for a Food Security Fund under the existing Regional Tariff Response Initiative.
- Immediate expensing for greenhouse buildings.
- $20 million for food banks through the Local Food Infrastructure Fund.
- Developing a National Food Security Strategy that strengthens domestic food production and improves access to affordable, nutritious food, including measures to encourage unit price labelling and support the work of the Competition Bureau.
- $36 million to address food security and affordability in the North through the Nutrition North Canada Retail Subsidy Program and the Northern Isolated Community Initiatives Fund.
Details & Supplementary Information
Grocery price inflation, at 4.4 per cent year-on-year in March 2026, has been running ahead of both overall CPI inflation (currently 2.4 per cent) and its pre-pandemic pace (2010-2019 average of 2.0 per cent) since February 2025.
PM News Release (Jan 26): "To bring down your costs, Canada's new government is:
- Putting more money back in Canadians' pockets
- The government is introducing the new Canada Groceries and Essentials Benefit – formerly the Goods and Services Tax (GST) Credit. We are increasing its amount by 25% for five years beginning in July 2026.
- In addition to that, we are providing a one-time payment, equivalent to a 50% increase this year.
- Combined, this means that a family of four will receive up to $1,890 this year, and about $1,400 a year for the next four years; and a single person will receive up to $950 this year, and about $700 a year for the next four years.
- The new Canada Groceries and Essentials Benefit will provide additional, significant support for more than 12 million Canadians.
- Tackling food insecurity, supporting producers, and strengthening supply chains
- The government is setting aside $500 million from the Strategic Response Fund to help businesses address the costs of supply chain disruptions without passing those costs on to Canadians at the checkout line.
- For the same purpose, the government will create a $150 million Food Security Fund under the existing Regional Tariff Response Initiative for small and medium enterprises and the organisations that support them.
- To lower the cost of food production, we are introducing immediate expensing for greenhouse buildings. This allows producers to fully write off greenhouses acquired on or after November 4, 2025, and that become available for use before 2030. This measure supports increased domestic supply and investment in food production over the medium-term.
- To ease immediate pressures with food banks, the government is providing $20 million to the Local Food Infrastructure Fund. This supports food banks and other national, regional, and local organisations to deliver more nutritious food to families in need.
- To tackle the root causes of food insecurity, we are developing a National Food Security Strategy – one that strengthens domestic food production and improves access to affordable, nutritious food.
- This strategy will also include measures to implement unit price labelling and support the work of the Competition Bureau in monitoring and enforcing competition in the market, including food supply chains."
Minister of Indigenous Services News Release (Feb 19): "Third, we are also addressing food security and affordability in the North through:
- An investment of $30 million to meet the current needs of the Nutrition North Canada subsidy. This funding will help ship food and essential items to 124 isolated northern communities, while Indigenous and northern partners are shaping broader program reforms to better address the high cost of living and affordability challenges.
- An additional $6.3 million for the Northern Isolated Community Initiatives Fund to support businesses, community groups, and innovators working on practical solutions to grow, process, and distribute food locally."
Housing Affordability
Key Messages
- The government is taking decisive actions to improve housing affordability, and conditions have substantially improved. Strong federal measures, combined with lower immigration levels, are helping to rebalance supply and demand, easing pressures in both ownership and rental markets.
- Federal actions are broad and coordinated, including Build Canada Homes, the Improving Housing Supply Act, GST relief for first-time home buyers, supports for factory-built housing and innovation, updated mortgage insurance rules, a temporary extension of repayments under the Home Buyers' Plan, and recalibrated immigration levels to better align with housing capacity.
- Affordability is already improving. Home prices have fallen by 20% from their peak, and combined with rising incomes and lower interest rates, this is improving purchasing power. New buyers are now saving nearly $800 per month on their mortgage payment nationally relative to the peak in October 2023—with savings up to $1,300-$1,400 in Toronto and Vancouver.
- Broader affordability metrics are also moving in the right direction. The Bank of Canada Housing Affordability Index has improved significantly, falling from a peak of 54.5% in 2023 to 42.7% in late 2025, meaning housing costs are taking up a smaller share of household income.
- On the rental side, federal measures are supporting one of the strongest periods of purpose-built rental construction in decades, with rentals expected to make up about half of all new construction. This is already easing pressures, with the national rental vacancy rate rising to 3.1 per cent in 2025 from a historical low of 1.5 per cent in 2023. Average asking rents are down $160 per month nationally from two years ago, with larger declines of $320 in Vancouver and $260 in Toronto.
- As a result, rental affordability is improving. The share of income required for rent has declined meaningfully, with advertised rents now back below 30% of income nationally—a level not seen in over six years—reflecting growing supply and a better balance in rental markets.
Details & Supplementary Information
Supported by a number of measures, the housing supply gap is beginning to narrow, particularly in rental markets, including in Canada's largest cities. National asking rents have declined by $160 per month from two years ago. In Toronto, average monthly asking rents declined by $260 over the same period, while Vancouver saw a decline of $320.
The Bank of Canada Housing Affordability Index represents the share of disposable income that a representative household would put towards housing-related expenses, including mortgage costs and utility payments.
Home prices have declined from recent peaks across a number of major cities. At the national level, home prices have declined 20% from peak, while Toronto saw a 26% decline. Other cities also saw notable declines, like Kitchener-Waterloo (-30%), Ottawa (-9%), Vancouver (-12%), while some cities saw a stabilization in home prices including Halifax & Dartmouth (-2%), Montréal (-1%), Calgary (-3%), and Edmonton (-2%).
Price adjustments are helping to relieve affordability pressures, particularly for prospective buyers who had been priced out in recent years. The reduction in home prices has reduced the monthly mortgage payment that a typical family would need to pay. This decline is especially pronounced in Toronto (-$1,400) and Vancouver (-$1,300), though is also notable in Calgary (-$350) and Halifax (-$200). Mortgage payments have stabilized in Montréal (-$20).
| Cash profile | 5-year Total |
|---|---|
| Housing Programs | |
Reaching Home |
957.7 |
Bilateral Housing Agreements |
2463.8 |
Housing Accelerator Fund |
1222.2 |
Affordable Housing Fund |
3387.5 |
Co-op Housing Development Program |
632.6 |
Federal Lands Initiative |
98.7 |
Federal Community Housing Initiative |
414.9 |
Apartment Construction Loan Program |
26892.0 |
Build Canada Homes |
11500.0 |
ISC Housing Funding |
2797.2 |
CMHC On-Reserve Legacy Housing |
873.1 |
Urban, Rural and Northern Housing Strategy |
3200.0 |
Improving Housing Supply Act payments |
1713.0 |
Sub-total Housing Programs |
56152.6 |
| Tax Measures | |
RRSP Home Buyers' Plan* |
N/A |
Tax-Free First Home Savings Account |
8605.0 |
First-Time Home Buyers' Tax Credit |
1290.0 |
Principal residence exemption |
48535.0 |
First-Time Home Buyers' GST Revate |
4635.0 |
Enhanced (100%) GST rebate on purpose-built rentals |
6940.0 |
36% GST New Housing Rebate |
340.0 |
36% FST Rebate on New Residential Rental Property |
1770.0 |
Exemption from GST for certain residential rent |
15425.0 |
ACCA for purpose-built rentals |
2915.0 |
Sub-total Tax Measures |
90455.0 |
| Total | 146607.6 |
|
*Indissociable from the RRSP tax expenditure. Cannot be evaluated with accuracy. |
|
Alto Conflict of Interest Filter
Key Messages
- In July 2025, I notified the Department of Finance that I was proactively putting in place a filter to safeguard against any real or perceived conflict of interest in relation to Alto. This screen was then formalized in September 2025.
- I am committed to protecting the integrity of government decision-making and maintaining public confidence in government institutions. Conflict of interest screens are a means of achieving that.
- The filter prevents me from participating in any discussion or decision, other than those of a general nature, involving Alto.
- To ensure proper ministerial oversight and involvement, the Secretary of State (Canada Revenue Agency and Financial Institutions) has been delegated to take my place when the filter is engaged.
- I have also undertaken to recuse myself if a matter covered by the conflict-of-interest filter is inadvertently referred to me.
Details & Supplementary Information
The media has reported on potential conflict of interest issues concerning the Minister of Finance and National Revenue and Alto.
On April 7, 2026, Michael Barrett, Conservative Party of Canada Member of Parliament, and critic for Ethics and Accountable Government, wrote to the Conflict of Interest and Ethics Commissioner, asking him to investigate his "concerns that the Minister of Finance and National Revenue, the Honourable Francois-Philippe Champagne, may have breached his obligations under the Conflict of Interest Act in relation to the interests of Anne-Marie Gaudet, Vice-President, Environment of Alto".
Among other things, Mr. Barrett raises the prospect that the Minister may have been in a conflict of interest by debating and voting on the Budget and 2025 Budget Implementation Act (C-15) in Parliament.
Timeline of Key Events Related to Conflict-of-Interest Filter
- July 28, 2025: Finance Deputy Minister's Chief of Staff e-mailed senior departmental management informing them that a screen was being put in place so that the Minister is not involved in issues relating to Alto and asking for their assistance in managing it.
- September 10, 2025: Minister of Finance and National Revenue wrote to the Prime Minister informing him of the implementation of a conflict-of-interest filter related to Bionest Technologies, and Alto "a wholly owned subsidiary of the Government of Canada, with regard to a personal connection with an individual employed by the organization." The letter provides the details of the filter. On September 11, 2025, this letter was forwarded to the Minister's Office staff and departmental officials in the Deputy Minister's Office.
Auto Sector Support
Key Messages
- Canada's automotive sector, and the 500,000 jobs it supports, is on the frontline of global trade shifts, with more than 90 per cent of Canadian-made vehicles and 60 per cent of Canadian-made auto parts are currently exported to the U.S.
- In February 2026, the Government introduced an auto strategy that rewards the production of made-in-Canada vehicles and harnesses Canada's technology expertise to build the cars of the future. Key measures include:
- Maintaining reciprocal counter-tariffs on vehicles imported from the U.S to ensure a level playing field for Canadian manufacturers in the domestic market. To support companies manufacturing vehicles in Canada, we renewed the performance-based remission framework, which allows companies that produce cars in Canada to import a limited number of U.S.-made autos tariff-free, contingent on these companies continuing to produce vehicles in Canada and on completing planned investments.
- Allocating $3 billion from the Strategic Response Fund and $100 million from the Regional Tariff Response Initiative to support investments in automotive manufacturing. These investments will help the industry adapt, grow, and diversify into new markets.
- Developing new emissions regulations to replace the Electric Vehicle Availability Standard. These regulations are expected to put Canada on a path to achieve a goal of 75% EV sales by 2035 and 90% by 2040, while providing Canadian manufacturers flexibility in the technologies used to achieve these emission reductions.
- Making EVs more affordable and reliable for Canadians through launching a new EV Affordability program and a national charging infrastructure strategy.
- Protecting Canadian auto workers through leveraging the Worker Retention Grant to help support eligible work-sharing employees upskill and adapt to changing labour market needs. Also, investing in skills development through a new Workforce Alliance on advanced manufacturing and a Workforce Innovation Fund.
Details & Supplementary Information
- On February 5, 2026, Canada introduced a new auto strategy that rewards the production of made-in-Canada vehicles and harnesses Canada's world-class capabilities in artificial intelligence and technology expertise to build the cars of the future. This is a strategy that positions Canada to become a global leader in EV production.
- Domestic measures to protect Canada's automotive sector include:
- Allocating $3 billion of existing funding from the Strategic Response Fund and $100 million of existing funding from the Regional Tariff Response Initiative to support investments in the automotive sector. In line with the Buy Canadian Policy, the government will look to leverage these investments to maximize opportunities for Canadian suppliers and Canadian-made goods and services, including steel and aluminum.
- Rationalizing emissions reduction policies to focus on outcomes that matter to Canadians. The government will repeal the Electric Vehicle Availability Standard. While doing so, Canada will increase the stringency of greenhouse gas emissions standards for light-duty vehicles. This is expected to drive a 75% EV adoption rate by 2035 and aspires to achieve a 90% EV adoption rate by 2040, while providing manufacturers flexibility in the technologies used to achieve these emission reductions. Considering rapidly evolving technologies, Canada will review these standards after five years to ensure they remain ambitious and aligned with Canada's overall climate objectives.
- Strengthening domestic demand by making EVs more affordable and reliable for Canadians through new, targeted five‑year $2.3 billion EV Affordability program. The EV Affordability program will offer incentives of up to $5000 to consumers and businesses for the purchase or lease of eligible cars with a final transaction value of $50,000 or less. To support the Canadian automotive industry, the transaction value eligibility cap will not apply to Canadian-made EVs.
- Developing a new national charging infrastructure strategy, which will focus on better attracting private equity, reducing barriers, making buildings EV-ready and ensuring skills training. The strategy will include investments of $1.5 billion through the Canada Infrastructure Bank's Charging and Hydrogen Refueling Infrastructure Initiative. It will also seek to identify private sector champions to lead projects of national significance, building out charging infrastructure more quickly across the country.
- Leveraging the Worker Retention Grant launched on February 17, 2026 to help employers support their Work-sharing employees to upskill and adapt to changing labour market needs – enabling eligible workers to receive top-up supplements on their incomes while they train. As well, investing in skills development through a new Workforce Alliance on advanced manufacturing bringing together industry, labour and training institutions to tackle urgent labour market challenges, including in the automotive sector, and a Workforce Innovation Fund to support projects that help businesses in key sectors and regions recruit and retain the workforce they need.
- Continuing to provide assistance through Labour Market Development Agreements with provinces and territories so they can support Canadians with Employment Insurance funded skills training and employment assistance.
- Trade measures to protect Canada's automotive sector include:
- Implementing a performance-based remission framework which allows automakers in Canada to import a certain number of U.S.-assembled, CUSMA-compliant vehicles free of the counter-tariffs that Canada has imposed, provided that the automakers continue to produce vehicles in Canada and complete planned investments. Remission under the current automotive duty remission framework was extended for a second year and new quota volumes have been established for April 9, 2026 to April 8, 2027.
- Separately, public consultations were held from February 27, 2026 to April 13, 2026 on how the remission framework could be leveraged more strategically to reinforce domestic production, attract new investment and enhance the long term competitiveness of Canada's automotive sector. Submissions are being reviewed before determining next steps.
Canada-U.S. Trade and Tariffs
Key Messages
- As Canada diversifies and deepens its trade relationships, the U.S. market remains a top destination for Canadian exports. Canada has the best trade deal of all countries with the United States.
- The government is at the table and engaged with the U.S. to resolve outstanding tariffs, as well as on the upcoming CUSMA review, to ensure continued predictability and favourable trade and investment conditions.
- As Canada's Chief Negotiator Janice Charette said recently, there is likely to be ongoing discussion beyond July 1, and we should expect some turbulence. It is important that we stay the course and secure the best possible deal for Canada.
Trade Relations with the United States
- Approximately 85 per cent of Canada's exports to the U.S. remain tariff-free, with the effective average tariff rate on Canadian exports of 5.2 per cent.
- The government continues to maintain tariffs on imports on $51.4 billion of annual steel, aluminum, and autos imports from the U.S. – sectors directly affected by U.S. actions – to defend our interests.
- As of April 17, 2026, total net revenues for the countermeasures on imports from the U.S. are estimated to be $4.3 billion. Specifically, this reflects $9.7 billion in gross revenues, of which $5.5 billion has been relieved through remissions and other relief.
Details & Supplementary Information
Current U.S. tariffs imposed on Canadian goods
- In aggregate, the current U.S. effective tariff rate against all Canadian exports is estimated to be around 5.2 per cent, with approximately 85 per cent of Canadian exports entering the U.S. tariff-free.
- Universal/Baseline Tariffs (Section 122): On February 20, 2026, the U.S. Supreme Court invalidated tariffs imposed under the International Emergency Economic Powers Act (IEEPA), which had applied U.S. tariffs of 35% (10% for energy, critical minerals and potash) on non‑CUSMA‑compliant Canadian goods, without affecting tariffs imposed under other authorities such as section 232. In response, President Trump rescinded the IEEPA‑based Executive Orders and imposed a global 10% tariff under Section 122 of the Trade Act of 1974, effective February 24, 2026, preserving the carve‑out for CUSMA‑compliant goods and providing broader product exemptions, including for certain critical minerals, energy products, aircraft parts and coffee. On May 7, 2026, the U.S. Court of International Trade ruled that the Section 122 tariffs were unlawful, but limited its injunction to the specific plaintiffs, meaning the tariffs remain in effect for other importers pending appeal. Absent congressional action or a successful appeal, the Section 122 tariffs are set to expire on July 24, 2026. In parallel, the USTR has initiated accelerated Section 301 investigations targeting allegedly "unjustifiable, unreasonable, discriminatory, and burdensome" foreign trade practices, which could support the (re)imposition of broader tariffs once Section 122 authorities expire.
- U.S. Section 232 Tariffs: The U.S. currently maintains Section 232 "national security" tariffs on $150.5 billion of Canadian exports in specific sectors. These include: steel, aluminum, copper, autos and trucks and buses and non-CUSMA-compliant auto and truck parts, lumber and wood products (i.e., upholstered furniture, kitchen cabinets and vanities). The U.S. also maintains tariffs on certain advanced computing chips and derivatives, as well non-CUSMA compliant pharmaceutical products, but the impacts of these are more limited for Canada
- Potential future Section 232 sectoral tariffs: The Section 232 investigation on processed critical minerals and their derivative products (PCMDPs) is completed, with the President directing negotiations on a trade agreement with the threat of tariffs if negotiations to adjust the imports of PCMDPs into the U.S. are unsuccessful. Additional Section 232 investigations are ongoing for the following sectors, which could result in additional tariffs: (1) commercial aircraft and jet engines; (2) polysilicon; (3) unmanned aircraft systems; (4) wind turbines and their components; (5) robotics and industrial machinery; and (6) medical products.
Canadian counter-tariffs on the U.S. and tariff-based mitigation measures
- Canada initially imposed counter-tariffs on the U.S. affecting approximately $95 billion of annual imports from the U.S. Since September 1, 2025, the government has maintained counter-tariffs on $51.4 billion of annual steel, aluminum, and autos imports from the U.S. (sectors directly affected by U.S. actions).
- To minimize the negative effects of the counter-tariffs, the government established a remission framework to provide exceptional tariff relief on a case-by-case basis. More broadly, the government has extended temporary tariff relief (remission), until June 30, 2026, for all goods imported from the U.S. for the manufacturing of motor vehicles, aerospace goods, and their parts, as well as those that support public health, public safety, and national security. Tariff remission is also provided for aluminum goods used in manufacturing, processing, food and beverage packaging, or agricultural production to provide time for Canadian businesses to adjust their supply chains, until June 30, 2026.
- For autos, the government provided a performance-based remission framework that allows automakers to import a certain number of U.S.-assembled, CUSMA-compliant vehicles into Canada, free of the counter-tariffs. This remission is contingent on the automakers continuing to produce vehicles in Canada and on completing planned investments. In this context, on October 23, 2025, the government reduced General Motors' annual remission quota by 24.2 per cent, and Stellantis' annual remission quota by 50 per cent, in response to decreased production from GM, and Stellantis' decision to cancel its production plans for the Brampton assembly plant. The remission framework will remain in force until April 2026. On February 27, 2026, the government launched public consultations on how the remission framework can be leveraged more strategically to reinforce domestic production and enhance the long-term competitiveness of the automotive sector.
Revenues from U.S. counter-tariffs
- As reported in the Spring Economic Update 2026, as of April 17, 2026, the government assessed more than $4.3 billion revenue to date, net of remissions and other relief programs, from Canada's counter-tariffs on U.S. goods, as detailed in the chart below.
Net Revenues Assessed From U.S. Countermeasures
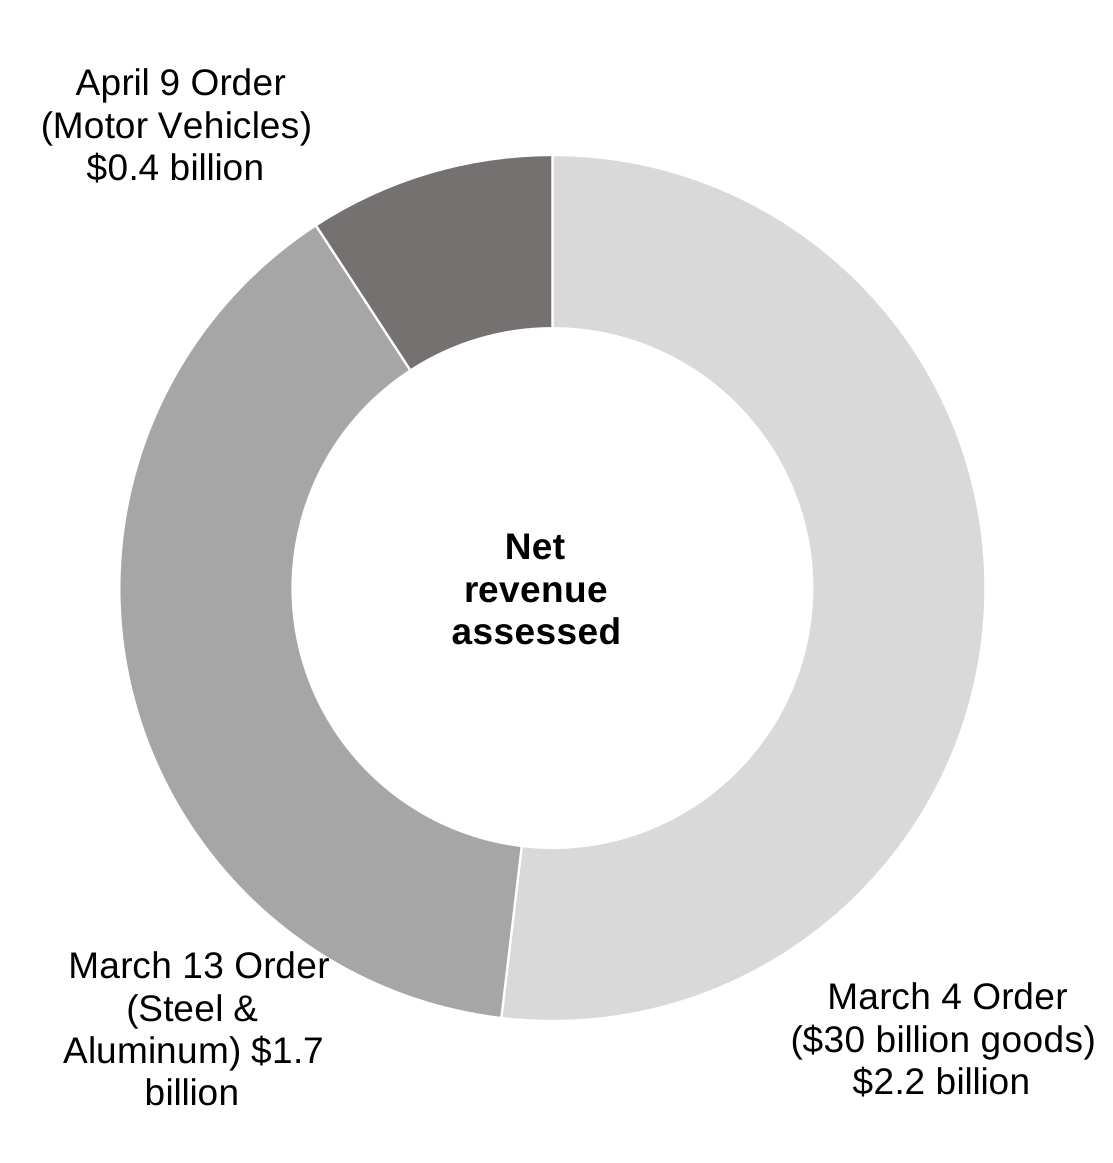
CUSMA review
- The USTR reported to Congress on December 17, 2025, that it intends to raise the following issues with Canada: expanded dairy market access, reforms to online streaming and news acts affecting U.S. digital services, ending provincial boycotts of U.S. alcohol, and addressing provincial procurement and customs issues.
- In March 2026, the U.S. launched technical discussions with Mexico to support the USMCA review. Canadian interlocutors, led by Chief Negotiator Janice Charette, are engaging with U.S. counterparts and hope to launch a formal USMCA review process with the U.S. soon.
Canada-China New Strategic Partnership
Key Messages
- Canada is moving its economy from reliance to resilience. That includes building our strength at home, working to double our non-U.S. exports, and attracting new beneficial investments into Canada.
- To advance these priorities, Prime Minister Mark Carney travelled to China from January 14 to 17, 2026, where he met with President Xi Jinping and forged a new Canada-China Strategic partnership, outlined by a Joint Statement.
- The new Strategic Partnership emphasizes pragmatic and constructive cooperation in key areas of mutual interest, namely in macroeconomic engagement, economic and trade cooperation, energy, finance, public security and safety, people-to-people ties, and multilateralism. Canada also set an ambitious goal to increase exports to China by 50% by 2030.
- To help deliver on the full potential of the partnerships and resolve certain trade irritants, both countries have taken the following actions since January 2026:
- Canada eliminated the 100 per cent surtax and established a quota for 49,000 electric vehicles, as well as extending certain remissions on Chinese imports to the end of 2026. In return, China reduced tariffs on canola seed and eliminated tariffs on canola meal, peas, lobster and crab.
- In April, building on the Prime Minister's visit, I travelled to Beijing, where I met with Vice Premier He Lifeng, Finance Minister Lan Fo'an and other key Chinese officials. Together, we discussed strengthening the bilateral relationship under the Economic and Financial Strategic Dialogue (EFSD) and launched the Financial Working Group.
- I was accompanied by Governor Macklem, Superintendent Routledge and a number of Canadian financial institutions showing the value of two-way trade and investment, including in financial services and advancing economic cooperation.
Details & Supplementary Information
Economic and Financial Strategic Dialogue (EFSD) and Financial Working Group (FWG)
- Canada's government is fostering a pragmatic approach to engagements with our second largest trading partner.
- In April, building on the Prime Minister's visit, Minister Champagne travelled to Beijing, where he met with Vice Premier He Lifeng and discussed strengthening the bilateral relationship under the Economic and Financial Strategic Dialogue (EFSD). He also had a bilateral meeting with Finance Minister Lan Fo'an. Both Canada and China recognized the value of two-way trade and investment, including in financial services and advancing economic cooperation in areas of shared alignment. This shared desire to strengthen economic ties was underscored by a Roundtable with Financial institutions and a Joint Statement he signed with Governor Pan Gongsheng of the People's Bank of China in which Canada and China launched the Financial Working Group (FWG).
- Canada stands ready to work with China to advance economic and financial cooperation. Building on this commitment, both sides have agreed to building progress under the Economic and Financial Strategic Dialogue which will be held in Canada in the second half of this year.
Canada-China bilateral relations
- Canada and China share more than 55 years of diplomatic relations that includes trade and investment, environment and climate change, education and culture.
- With a shifting global context, Canada remains committed to supporting and growing the well-established trade and investment ties with China.
- Our efforts are no different from the approach of other major economies, including the U.S., which engage with China for the purpose of improving the conditions for bilateral trade and investment.
Canada-China commercial relations
- China remains an important commercial market for Canadian businesses with two-way bilateral merchandise trade in 2024 totaling $118.9 billion. China is Canada's second-largest trading partner.
- Canada will continue to pursue constructive dialogue with China on trade because engagement is not only the best way to advance Canadian economic interests but also to find a way forward on our existing trade irritants. Canada and China can deepen and expand commercial relations in sectors such as clean and conventional energy, agriculture and agri-food and consumer goods and services.
- As Canada seeks to diversify trade and pursue commercial opportunities, we will continue to ensure that we have the right tools in place to safeguard Canada's national and economic security interests.
Canada-China Trade Relations
During the visit, Prime Minister Carney and President Xi secured a preliminary agreement-in-principle to address trade issues:
| Canada Outcomes | China Outcomes | |
|---|---|---|
| Electric Vehicles | Potential Chinese joint-venture investments for auto jobs and EV supply chain; 50 per cent quota reserved for affordable EVs ($35,000 CAD or less) by 2030. | Access to Canadian market with 49,000 EV quota/year at reduced 6.1 per cent most-favoured-nation rate (less than 3% of Canadian new vehicle market). |
| Canola Seeds | China lowers tariffs to approximately 15 per cent combined rate by March 1, 2026 (from 84 per cent), improving access for $4 billion in annual exports | |
| Canola Meal, Lobsters, Peas, Crabs & Others | No anti-discrimination tariffs on specified products (valued at $2.6 billion in exports) from March 1-Dec 31, 2026; accelerated resumption of market access for beef, pet food, animal genetics. | |
| Steel and Aluminum | Canada extended previously granted remission to the end of 2026 and expanded the list of produced eligible for remission, reflecting the completion of the domestic remission review process. |
As of March 1, 2026, both countries have implemented their respective commitments as listed above.
Revenues from China Surtax Order (2024)
- As reported in the Spring Economic Update 2026, as of April 17, 2026, the government assessed $171 million in revenue to date, net of remissions and other relief programs, from the China Surtax Order (2024), as detailed in the chart below.
Net Revenues Assessed From China Surtax Order
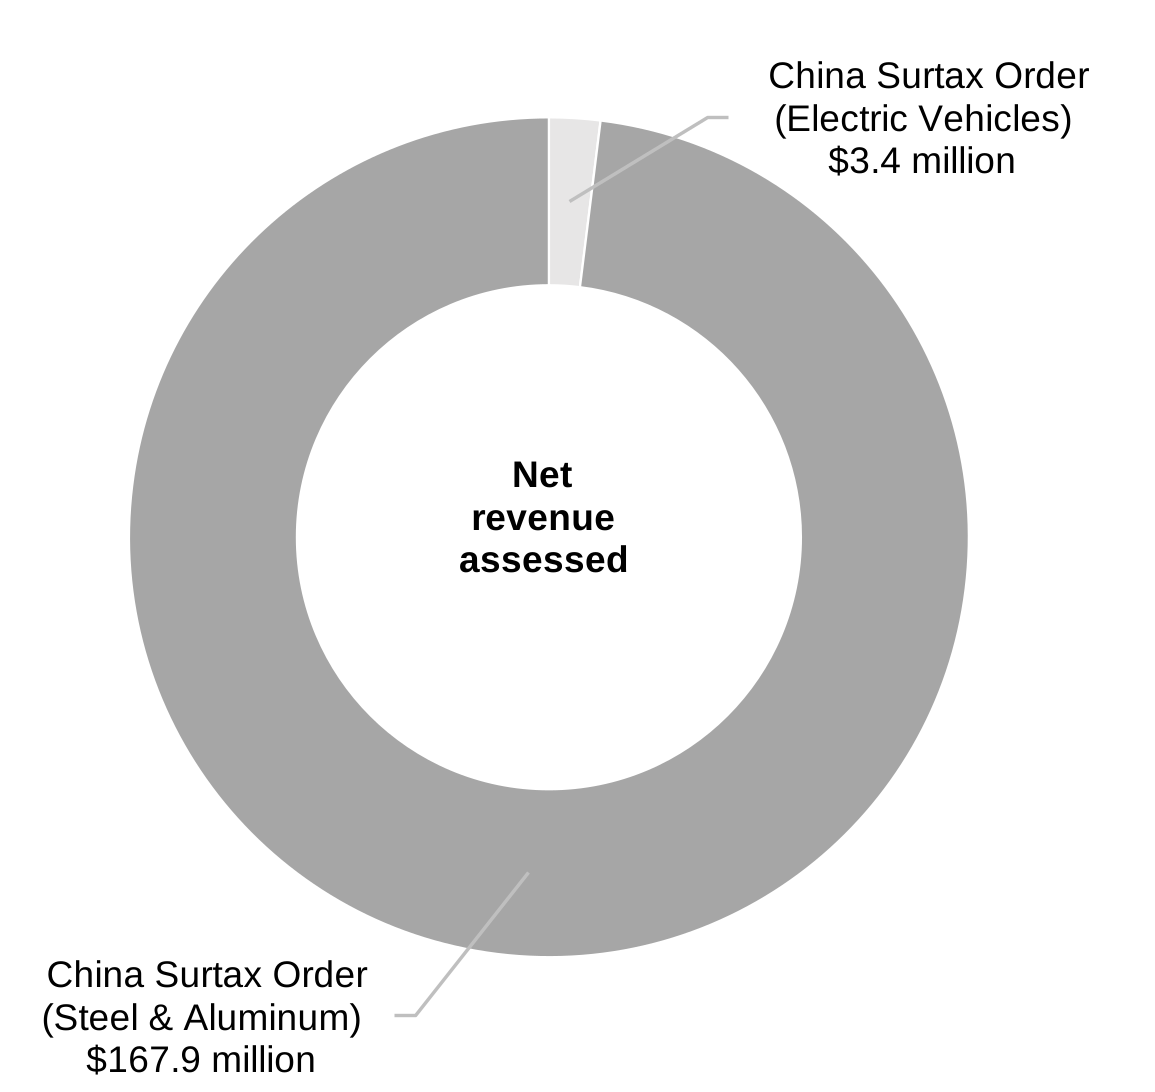
Trade Measures on Steel Products
The government implemented trade measures to mitigate the acute risk of diversion arising from U.S. actions, as well as to facilitate the steel industry's long-term adjustment and to promote domestic opportunities for Canadian producers.
- China Surtax Order (2024): In October 2024, Canada imposed a 25 per cent surtax on certain steel and aluminum products from China.
- U.S. Surtax Order (Steel and Aluminum): In March 2025, in response to U.S. tariffs on Canadian steel and aluminum, the government imposed a 25 per cent surtax on certain steel and aluminum products from the U.S.
- Steel Tariff Rate Quotas (TRQs): Initially imposed in June 2025, this measure currently limit imports from non-CUSMA FTA and non-FTA partners to 75 per cent and 20 per cent, respectively, of 2024 import levels above which a 50 per cent surtax applies.
- Steel Goods and Aluminum Goods Surtax Order: Effective July 30, 2025, Canada imposed a 25 per cent surtax on steel goods containing steel melted and poured in China, and aluminum goods containing aluminum smelted and cast in China.
- Steel Derivative Goods Surtax Order: Effective December 26, 2025, Canada imposed a 25 per cent surtax on imports of steel derivative products from all countries.
Remission remains available for these surtax measures.
Climate and Nature
Key Messages
The government is making investments to safeguard Canada's natural advantage and is driving Canada to be a reliable energy supplier.
With $3.7 billion over five years (cash basis), the new Nature Strategy will:
- Help conserve 30 percent of lands and waters by 2030;
- Invest in new national parks and marine protected areas;
- Protect and recover species at risk; and,
- Advance actions to mobilise capital for nature.
The government's Climate Competitiveness Strategy (Budget 2025, p. 104), will address climate change while positioning Canadian businesses to thrive. Key to this strategy is a suite of clean economy investment tax credits (ITCs):
- Clean Technology ITC: A refundable tax credit of 30% for investments in certain low-emitting electricity generation, electricity storage, low-carbon heating, and non-road zero-emission vehicles and related charging/refuelling.
- Carbon Capture, Utilization and Storage ITC: A refundable tax credit for eligible expenditures, with a 50% credit rate for carbon capture equipment (60% in the case of direct air capture) and 37.5% for transportation, storage and use equipment.
- The Spring Economic Update 2026 announced that enhanced oil recovery would be made eligible, but at half the credit rates.
- Clean Hydrogen ITC: A refundable tax credit for up to 40% of eligible project costs.
- Clean Technology Manufacturing ITC: A refundable tax credit of 30% for investments in certain machinery and equipment used to manufacture or process key clean technologies, or extract, process, or recycle key critical minerals.
- Clean Electricity ITC: A refundable tax credit of 15% for investments in certain low-emitting electricity generation, electricity storage, and transmission of electricity between provinces and territories.
The government's Automotive Strategy, with $6.9 billion over five years (cash basis), will reduce emissions, help make electric vehicles more affordable and reliable, and protect Canadian auto workers. (Spring Update, p.71)
As critical minerals are essential for clean energy technologies and renewable energy infrastructure, the government provided $5 billion over five years (cash basis) through the Critical Minerals Strategy to develop domestic and global value chains for the green and digital economy (Budget 2025, p. 111).
On May 14, 2026, the Government of Canada released a new National Electricity Strategy and announced it was launching consultations with provinces, territories, Indigenous Peoples, utilities, and unions on the best way to support Canada's electricity sector. With electricity demand in Canada set to double by 2050, this is an enormous opportunity for Canada to build a sustainable, affordable future.
Comprehensive Expenditure Review (CER)
Key Messages
- The government is on track to save Canadians $60 billion by 2029-30 as set out in Budget 2025. Three-quarters of this comes from reducing day-to-day spending on government operations and inefficiencies through the Comprehensive Expenditure Review (CER).
| 2026-27 | 2027-28 | 2028-29 | 2029-30 | 4-year Total | Ongoing | |
|---|---|---|---|---|---|---|
| Modernizing Government Operations | 5.5 | 6.2 | 7 | 6.6 | 25.2 | 5.4 |
| Streamlining Program Delivery | 0.2 | 0.3 | 0.5 | 0.5 | 1.5 | 0.5 |
| Recalibrating Government Programs | 2.9 | 3.9 | 5.4 | 5.4 | 17.5 | 5.4 |
| Total - CER Savings | 8.6 | 10.4 | 12.8 | 12.4 | 44.2 | 11.4 |
- For most organizations, reductions included in Budget 2025 were reflected in the 2026-27 Main Estimates (tabled on February 26) and detailed in Departmental Plans tabled shortly thereafter.
- CER represents a 4.9% reduction in projected direct program expenses by 2028-29 (B25, p. 211), with an estimated reduction of 16,000 FTEs, or roughly 4.5% of the March 2025 workforce. Along with attrition and previously savings exercises, this will support a more sustainable public service (B25, p. 212).
Main Estimates Reconciliation
- The Main Estimates provide one-year cash authorities for 2026-27. While $8.6 billion in accrual savings was published in Budget 2025 (B25, p. 293), the Main Estimates in aggregate reflect $5.2 billion in savings across organizations.
- The $3 billion difference is due to an accrual adjustment of $2.7 billion for VAC and the RCMP benefits, and $0.7 billion in additional savings reported in the budget but not yet reflected in the Main Estimates (corresponding to organizations that received revised 2% targets and are developing savings proposals).
| Budget 2025 and Main Estimates | $ billion |
|---|---|
| Budget 2025 – CER Savings in 2026-27 | $8.6 |
Minus Accrual Adjustment |
-$2.7 |
Minus Organizations with revised 2% target that need to develop new savings proposals |
-$0.7 |
| Amounts reflected in Main Estimates 2026-27 | $5.2 |
Sunsetting Programs
- Some organizations have achieved savings by winding down sunsetting programs, such as the 2 Billion Trees program (B25, p. 210), or Net Zero Accelerator (B25, p. 209).
- While future years of time-limited (or sunsetting) funding may not be reflected in Departmental Plans, they are accounted for in various ways in the fiscal forecast.
- As a result, the reduction or winding down of certain programs as part of CER generates savings, which are reflected in the budget and contribute to the sustainability of the government's fiscal track.
- Additional decisions about program funding scheduled to expire in the future will be taken at a later time.
Details & Supplementary Information
- Table A3.1 of Budget 2025 sets out the total savings for CER in Annex 1 (B25, p. 293):
| 2026- 2027 |
2027- 2028 |
2028- 2029 |
2029- 2030 |
Ongoing | |
|---|---|---|---|---|---|
| Modernising Government Operations | 5,530 | 6,179 | 6,950 | 6,554 | 5,441 |
| Streamlining Program Delivery | 161 | 345 | 488 | 530 | 531 |
| Recalibrating Government Programs | 2,863 | 3,856 | 5,404 | 5,358 | 5,391 |
| Total | 8,553 | 10,381 | 12,842 | 12,442 | 11,363 |
| New revenues/lower expenses enabled by efficiencies (CRA) | 655 | 887 | 1,171 | 1,107 | 1,107 |
| Grand Total | 9,208 | 11,268 | 14,012 | 13,550 | 12,471 |
|
Note: planned reductions by organisation that are not broken out by theme in the tables that follow are included in Modernising Government Operations, unless specified otherwise. |
|||||
- The table at the end of Chapter 5 in Budget 2025 outlines how CER and other measures achieve $60 billion in new savings and revenues over five years, starting in 2025-26 (B25, p. 222):
| 2025-2026 | 2026-2027 | 2027-2028 | 2028-2029 | 2029-2030 | Total | |
|---|---|---|---|---|---|---|
| 5.1 Spending Less to Invest More | -219 | -8,773 | -12,639 | -17,669 | -17,363 | -56,663 |
| Comprehensive Expenditure Review* | 0 | -8,553 | -10,381 | -12,842 | -12,442 | -44,217 |
| Comprehensive Expenditure Review – new revenues/lower expenses enabled by efficiencies (CRA) | -165 | -655 | -887 | -1,171 | -1,107 | -3,985 |
| Workforce Renewal | 14 | 772 | 464 | 200 | 61 | 1,511 |
| Optimizing Productivity in Government | 0 | 0 | -1,250 | -3,250 | -3,250 | -7,750 |
| Equitable Public Sector Retirement Benefits | -68 | -84 | -330 | -349 | -365 | -1,196 |
| Improving the Integrity of Student Financial Assistance | 0 | -253 | -255 | -258 | -260 | -1,025 |
| 5.2 Modernising Services | 0 | 52 | 52 | 40 | 40 | 185 |
| Faster Services for Veterans | 0 | 52 | 52 | 40 | 40 | 185 |
| 5.3 A More Efficient Tax System | 31 | -534 | -164 | -199 | -244 | -1,110 |
| Protecting the Integrity of the Tax System | -10 | -590 | -225 | -260 | -310 | -1,395 |
| Improving the Efficiency of the Tax System | 41 | 56 | 61 | 61 | 66 | 285 |
| 5.1 and 5.3: Savings and Revenues Subtotal | -243 | -10,135 | -13,328 | -18,129 | -17,734 | -59,569 |
|
*Measure includes funding classified as a capital investment. Note: Numbers may not add due to rounding. A glossary of abbreviations used in this table can be found at the end of Annex 1. |
||||||
- The $60 billion of savings and revenues are incorporated the Budget 2025 revenue outlook (personal income tax, corporate income tax, non-resident income tax, and goods and services tax revenues) outlined in Table A1.8 (B25, p. 240), and in the Budget 2025 expense outlook (other transfer payments, other direct program expenses) outlined in Table A1.9 (B25, p. 245).
| Projection | ||||||
|---|---|---|---|---|---|---|
| 2024– 2025 |
2025– 2026 |
2026– 2027 |
2027– 2028 |
2028– 2029 |
2029– 2030 |
|
| Income tax revenues | ||||||
| Personal income tax | 234.3 | 237.9 | 244.9 | 257.1 | 268.7 | 278.9 |
| Corporate income tax | 97.0 | 97.1 | 96.7 | 96.7 | 96.8 | 100.6 |
| Non-resident income tax | 13.5 | 13.7 | 14.0 | 14.2 | 14.4 | 14.7 |
| Total | 344.8 | 348.7 | 355.6 | 368.0 | 380.0 | 394.2 |
| Excise tax and duty revenues | ||||||
| Goods and Services Tax | 52.5 | 54.4 | 56.5 | 58.3 | 60.2 | 62.7 |
| Customs import duties | 6.3 | 9.9 | 6.3 | 6.6 | 6.9 | 7.2 |
| Other excise taxes/duties | 13.1 | 13.2 | 13.3 | 13.4 | 13.5 | 13.6 |
| Total | 71.9 | 77.5 | 76.2 | 78.3 | 80.6 | 83.5 |
| Other taxes | 0.0 | 0.0 | 2.7 | 1.9 | 2.1 | 2.1 |
| Total tax revenues | 416.7 | 426.2 | 434.4 | 448.2 | 462.6 | 479.8 |
| Pollution pricing proceeds to be returned to Canadians | 13.6 | 0.0 | 0.0 | 0.0 | 0.0 | 0.0 |
| Employment Insurance premium revenues | 31.5 | 32.2 | 33.3 | 34.3 | 35.5 | 36.8 |
| Other revenues | ||||||
| Enterprise Crown corporations | 8.0 | 11.3 | 14.8 | 16.9 | 19.1 | 21.1 |
| Other programs | 34.3 | 31.8 | 34.0 | 35.0 | 36.0 | 38.4 |
| Net foreign exchange revenues and return on investments | 6.8 | 6.0 | 6.7 | 6.8 | 7.0 | 7.2 |
| Total | 49.2 | 49.1 | 55.5 | 58.8 | 62.1 | 66.6 |
| Total budgetary revenues Per cent of GDP |
511.0 | 507.5 | 523.2 | 541.3 | 560.2 | 583.3 |
| Total tax revenues | 13.6 | 13.4 | 13.3 | 13.1 | 13.1 | 13.0 |
| Employment Insurance premium revenues | 1.0 | 1.0 | 1.0 | 1.0 | 1.0 | 1.0 |
| Other revenues | 1.6 | 1.5 | 1.7 | 1.7 | 1.8 | 1.8 |
| Total budgetary revenues | 16.6 | 16.0 | 16.0 | 15.9 | 15.8 | 15.8 |
|
Note: Totals may not add due to rounding. |
||||||
| Projection | |||||||
|---|---|---|---|---|---|---|---|
| 2024– 2025 |
2025– 2026 |
2026– 2027 |
2027– 2028 |
2028– 2029 |
2029– 2030 |
||
| Major transfers to persons | |||||||
| Elderly benefits | 80.3 | 83.1 | 88.8 | 94.5 | 99.4 | 104.3 | |
| Employment Insurance benefits | 24.9 | 30.5 | 31.9 | 30.4 | 31.3 | 32.6 | |
| Canada Child Benefit | 28.6 | 30.1 | 31.0 | 31.7 | 32.4 | 33.4 | |
| COVID-19 income support for workers | -2.2 | 0.0 | 0.0 | 0.0 | 0.0 | 0.0 | |
| Total | 131.6 | 143.7 | 151.8 | 156.6 | 163.1 | 170.3 | |
| Major transfers to provinces, territories, and municipalities | |||||||
| Canada Health Transfer1 | 52.1 | 54.7 | 57.4 | 60.3 | 62.5 | 65.0 | |
| Canada Social Transfer | 16.9 | 17.4 | 17.9 | 18.5 | 19.0 | 19.6 | |
| Equalization1 | 25.3 | 26.2 | 27.2 | 28.1 | 29.1 | 30.3 | |
| Territorial Formula Financing1 | 5.2 | 5.5 | 5.8 | 6.3 | 6.6 | 6.8 | |
| Health agreements with provinces and territories | 4.3 | 4.3 | 4.3 | 3.1 | 2.5 | 2.5 | |
| Canada-wide early learning and child care | 6.6 | 7.9 | 7.9 | 8.0 | 8.2 | 8.5 | |
| Canada Community-Building Fund | 2.4 | 2.5 | 2.5 | 2.6 | 2.6 | 2.7 | |
| Other fiscal arrangements2 | -7.6 | -7.6 | -8.0 | -8.3 | -8.7 | -9.1 | |
| Total | 105.1 | 110.8 | 115.0 | 118.5 | 121.9 | 126.3 | |
| Pollution pricing proceeds returned to Canadians | 15.6 | 5.0 | 0.2 | 0.1 | 0.1 | 0.0 | |
| Direct program expenses | |||||||
| Other transfer payments | 107.1 | 115.6 | 117.3 | 119.6 | 119.0 | 122.7 | |
| Other direct program expenses | 130.5 | 150.2 | 144.0 | 143.2 | 145.7 | 148.9 | |
| Total | 237.6 | 265.8 | 261.3 | 262.8 | 264.7 | 271.6 | |
| Total program expenses, excluding net actuarial losses | 489.9 | 525.2 | 528.4 | 537.9 | 549.7 | 568.3 | |
| Public debt charges | 53.4 | 55.6 | 60.0 | 66.2 | 71.4 | 76.1 | |
| Total expenses, excluding net actuarial losses | 543.3 | 580.9 | 588.3 | 604.1 | 621.2 | 644.4 | |
| Net actuarial losses (gains) | 4.0 | 5.0 | 0.2 | 0.7 | -3.0 | -4.5 | |
| Total expenses Per cent of GDP |
547.3 | 585.9 | 588.6 | 604.8 | 618.1 | 639.8 | |
| Major transfers to persons | 4.3 | 4.5 | 4.6 | 4.6 | 4.6 | 4.6 | |
| Major transfers to provinces, territories, and municipalities | 3.4 | 3.5 | 3.5 | 3.5 | 3.4 | 3.4 | |
| Direct program expenses | 7.7 | 8.4 | 8.0 | 7.7 | 7.5 | 7.4 | |
| Total program expenses, excluding net actuarial losses | 15.9 | 16.5 | 16.1 | 15.8 | 15.5 | 15.4 | |
| Total expenses | 17.8 | 18.4 | 18.0 | 17.7 | 17.4 | 17.4 | |
|
Note: Totals may not add due to rounding. 1 The Canada Health Transfer, Equalization and Territorial Formula Financing amounts for 2026-27 will be finalised in December 2025, in accordance with the Federal-Provincial Fiscal Arrangements Act. 2 Other fiscal arrangements include the Quebec Abatement (offsetting amounts to reflect the historical transfer of tax points and resulting reduction in federal tax collected for the Youth Allowances Recovery and Alternative Payments for Standing Programs); statutory subsidies; and payments for the transfer of Hibernia Net Profits Interest and Incidental Net Profits Interest net revenues to Newfoundland and Labrador. |
|||||||
Comprehensive Expenditure Review: Budget 2025 Process
Key Messages
- Launched on July 7, 2025, the Comprehensive Expenditure Review (CER) required Ministers to provide savings proposals representing up to 15% of their review base, which was tied to each organization's planned spending in the 2025-26 Main Estimates.
- The review was focused on modernizing government operations to achieve greater efficiency and slow the growth in direct program spending. Statutory transfer payments to provinces, territories and individuals were outside the scope of the review.
- Ministers were tasked with undertaking a thorough review of their organizations, identifying programs and activities that were underperforming, duplicative, or that had strayed away from the core federal mandate.
- Direction was provided to develop savings proposals using Gender-Based Analysis Plus to understand how Canadians, including vulnerable groups, would be affected.
- Central agencies (Finance Canada, the Privy Council Office (PCO) and the Treasury Board Secretariat (TBS)) worked with departments to ensure their proposals were sustainable and did not create program integrity pressures or impact the health, safety and the national security of Canadians.
- Evaluation of the proposals was done thoroughly, with strong governance. Supported by central agency officials, the Cabinet Committee on Government Transformation evaluated all proposals to ensure appropriate oversight and to apply a consistent approach.
- Following the Committee's review, the Minister of Finance, supported by Finance Canada, and the Prime Minister, supported by the Privy Council Office, made decisions for inclusion in Budget 2025.
Details & Supplementary Information
- The CER was not an across-the-board reduction exercise. It was a measured and strategic approach to improve public service productivity. To achieve this objective, federal departments and agencies undertook a thorough review of their organizations, identifying programs and activities that were underperforming, duplicative, or that had strayed away from the core federal mandate.
- The process applied to federally appropriated organizations, with the following exceptions:
- Agents of Parliament and arms-length organizations to preserve their independence, and
- Cost-recovered organizations, because including them would not generate savings.
- Departments were directed to develop proposals using Gender-Based Analysis Plus to understand how Canadians, including vulnerable groups, would be affected.
- Planned savings fall under three themes generally:
- Modernizing Government Operations ($25.2 billion over four years, 2026-27 to 2029-30)
- Streamlining Program Delivery ($1.5 billion over four years)
- Recalibrating Government Programs ($17.5 billion over four years)
- Savings from the CER across departments and programs vary, reflecting the need to protect the important mandates that some organisations have in delivering frontline services, social programs, and priorities such as defence and security. As such, the government set a lower savings target of 2% for the following organizations:
- Canada Border Services Agency (CBSA)
- Canadian Institutes of Health Research (CIHR)
- Canadian Security Intelligence Service (CSIS)
- Communications Security Establishment (CSE)
- Crown-Indigenous Relations and Northern Affairs Canada (CIRNAC)
- Indigenous Services Canada (ISC)
- Department for Women and Gender Equality (WAGE)
- Department of National Defence (DND)
- Natural Sciences and Engineering Research Council (NSERC)
- Royal Canadian Mounted Police (RCMP)
- Social Sciences and Humanities Research Council (SSHRC)
Comprehensive Expenditure Review: Budget 2025 Results
Key Messages
- Over the last decade, from 2015 to 2024, the federal public service grew by more than 40 per cent—double the rate of economic growth. Even after direct program expenses began to fall from their COVID-19 peak in 2020-21, the federal public service continued to expand.
- Recognizing that these increases were straining federal finances, the government launched the Comprehensive Expenditure Review (CER), to identify savings by reducing duplication, inefficiencies and overlap across the federal government. Results were announced in Budget 2025, with total savings of $9 billion in 2026-27, $10 billion in 2027-28 and $13 billion in 2028-29. Combined with other savings and revenues, this amounts to $60 billion over five years, beginning in 2025-26.
- Savings achieved through the CER are supporting the government's fiscal anchor of balancing day-to-day operating spending with revenues by 2028-29, while creating fiscal room to redirect federal spending towards investments that will increase capital formation and enhance productivity.
- Importantly, this is not an across-the-board reduction exercise. It is a measured and strategic approach, that ensures savings do not impact the health, safety and security of Canadians. Accordingly, savings vary across departments and programs, with lower targets applied where necessary to protect the important mandate some organizations have in delivering frontline services, social programs, and priorities such as defence and security.
- As detailed in Budget 2025, Chapter 5, and Annex 3, efficiencies achieved fall under three categories generally:
- Modernizing Government Operations ($25.2 billion over four years, 2026-27 to 2029-30). This includes increasing the efficiency of back-office and administrative functions, leveraging new technology, and limiting spending on discretionary travel and training, and the use of external consultants.
- Streamlining Program Delivery ($1.5 billion over four years). To make programs more accessible for Canadians and improve administrative efficiency, this includes streamlining program delivery to improve services and reduce duplication.
- Recalibrating Government Programs ($17.5 billion over four years). This represents refocusing several programs to prioritize spending that will deliver the greatest impact.
- By 2028-29, it is expected that reductions from CER will represent 4.9 per cent of projected direct program expenses as forecast in Budget 2025, with an estimated reduction of 16,000 full-time equivalents positions to the public service workforce.
- For comparison, the Deficit Reduction Action Plan (DRAP) launched in Budget 2012 announced reductions of 4.5 per cent of direct program expenses at maturity, with an estimated reduction of approximately 19,200 full-time equivalents.
- After factoring in the CER, normal attrition and previous savings exercises, a total decline in the public service population of about 40,000 positions or 10 per cent is projected in Budget 2025, from the peak of almost 368,000 in 2023-24, to roughly 330,000 by the end of 2028-29.
Details & Supplementary Information
Examples of Outcomes
- Adjusting Medical Cannabis Benefits to Reflect Market Price ($4.4 billion over four years): The government is aligning more closely with the current market prices for medical cannabis while providing the same benefits.
- Modernizing Supports for Canadian Industries and Workers ($2.1 billion over four years): Innovation, Science and Economic Development Canada's Net Zero Accelerator has faced declining demand, despite targeted calls. To respond to the significant economic challenges resulting from U.S. tariffs and other geopolitical developments, the government is investing in the Strategic Response Fund to support Canadian industries and workers. This Fund will provide timely and robust supports to those who need it most to help grow our economy.
- Wrapping Up the Tree Planting Program ($0.2 billion over four years): The government is winding down the 2 Billion Tree program. Existing contribution agreements and commitments will be honoured, and uncommitted funds will be returned. The government remains committed to sustainable forest management practices – to date, the program has committed to planting nearly 1 billion trees. A new climate competitiveness strategy will drive investment in clean growth through the Clean Economy Investment Tax Credits.
Workforce Impacts
- The savings identified through CER are contributing to returning the size of the public service to a more sustainable level, with an estimated reduction of 16,000 full-time equivalents, or roughly 4.5% of the workforce as of March 2025. Of these reductions, some 650 will be executive positions, representing about 7% of the executive population. These reductions will support the trend towards a more sustainable public service size of roughly 330,000 by 2028-29.
- As at May 6, 2026, according to Treasury Board Secretariat (TBS), federal departments and agencies in the core public administration of the public service have announced that 17,850 positions would be reduced through CER, with 9,751 of those positions to be reduced through Workforce Adjustment (WFA) directives for employees or Career Transition (CT) processes for executives.
- Savings will involve workforce adjustments and attrition to return the size of the public service to a more sustainable level. To manage these reductions to the greatest extent possible through attrition and voluntary departures, Budget 2025 introduced an Early Retirement Incentive (ERI) program to be delivered through the Public Service Pension Plan. From March 26, 2026, to July 24, 2026, public servants at age 50 or above for Group 1 and age 55 or above for Group 2 who have at least ten years of employment, with at least two years of pensionable service in the Plan may apply to participate under criteria set by Treasury Board and approval by the organizational Deputy Head.
- Deputy Heads must consider the following Treasury Board-approved criteria when assessing ERI applications:
- The organization needs to reduce its workforce;
- Services to Canadians will be maintained; and,
- Current and future operational or business needs will continue to be met.
- Eligible employees will be able to retire with an immediate pension based on years of service with no penalty for early retirement, with a date of retirement being no later than January 20, 2027.
Comparisons with Previous Exercises
| Program Review - Budget 1995 Reference Year: 1997-98 |
Deficit Reduction Action Plan - Budget 2012 Reference Year: 2015-16 |
Refocusing Government Spending - Budget 2023 Reference Year: 2026-27 |
Comprehensive Expenditure Review - Budget 2025 Reference Year: 2028-29 |
|
|---|---|---|---|---|
| Direct Program Expenses (DPE) | 48.4 | 115.1 | 217.7 | 264.7 |
| Reductions | 7.2 | 5.2 | 3.6 | 12.8 |
| Reductions from review as a share of projected direct program expenses in final year (%) | 14.9 | 4.5 | 1.7 | 4.9 |
| FTE Impacts | 45,000 in total | 19,200 in total 12,000 through WFA |
not disclosed | ~16,000 in total |
|
Notes: * Direct program expenses do not include major transfers to individuals or to other levels of government. The Comprehensive Expenditure Review makes no changes to major transfers to individuals or other levels of government. 1) Budget 1995 did not present total direct program expenses for 1997-98. Reductions are calculated as a percentage of the 1997-98 direct program expenses projected in Budget 1996. Above figures from Program Review reflect only the $7.2 billion reduction to direct program expenses by 1997-98. Budget 1995 also announced an additional $4.7 billion in reductions in 1997-98 impacting major transfers, which are not included in this chart for a consistent comparison with other reviews. 2) The figure for Refocusing Government Spending reflects the planned reductions published in the 2024-25 Main Estimates. 3) Direct program expense figures for Refocusing Government Spending and the Comprehensive Expenditure Review do not include actuarial gains or losses. 4) FTE impacts for Program Review are as published in Budget 1995 and include the Canadian Armed Forces. CER reductions via WFA are unknown as the government seeks to minimize involuntary departures through attrition and the Early Retirement Incentive. |
||||
Share of Income Spent on Food and Shelter, by Income Quintiles
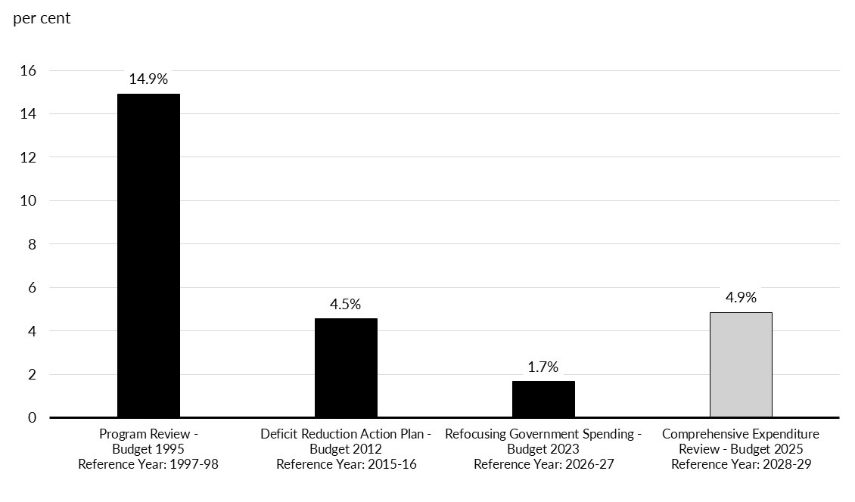
Other Savings and Revenues
- The Comprehensive Expenditure Review (CER) identified savings of $9 billion in 2026-27, $10 billion in 2027-28 and $13 billion in 2028-29; for a total of $44 billion over five- year Budget 2025 forecast horizon.
- Budget 2025 identified other savings and revenue measures, including:
- $4.0 billion over five years in new revenue/lower expenses enabled by efficiencies at the Canada Revenue Agency
- $7.75 billion over three years, starting in 2027-28, for Optimizing Productivity in Government (with further details to be provided in Budget 2026).
- $1.2 billion over five years, starting in 2025-26, for Equitable Public Sector Retirement Benefits.
- $1.0 billion over four years, starting in 2026-27, for Improving the Integrity of Student Financial Assistance.
- $1.4 billion over five years, starting in 2025-26, for Protecting the Integrity of the Tax System.
- Altogether, these measures will save the government $60 billion over five years.
Comprehensive Expenditure Review: Savings from Exchange Fund Account Efficiencies
Key Messages
- As part of the Comprehensive Expenditure Review (CER) exercise, the Department of Finance completed a thorough review of its operations with a view to find efficiencies and reduce costs.
- This involved looking at activities that fall under the purview of the Department even if they are not part of the departmental base budget.
- A review of the risk management practices associated with the Exchange Fund Account (EFA), in collaboration with the Bank of Canada as the government's fiscal agent, identified some areas for optimisation that would reduce redundancies, increase efficiencies, and reduce costs.
- At the time of Budget 2025, ongoing savings were estimated at $5 million. They are expected to materialize through lower public debt charges.
- Should savings end up larger than expected, they would continue to flow through lower public debt charges ensuring the government benefits from every effort to find efficiencies and lower costs, in line with the CER spirit.
Details & Supplementary Information
- The adjustments to risk management practices are expected to result in lower funding costs for the EFA (mostly funded through cross-currency swaps), which on an accounting basis, flow through public debt charges.
- There is limited additional information that can be shared at this stage given the commercially sensitive nature of the adjustments and ongoing negotiations for implementation.
- Once the process is completed, an overview of the changes will be provided in a timely manner (e.g., as part of the Official International Reserves' annual report).
Comprehensive Expenditure Review: Ongoing Horizontal Reviews
Key Messages
- With the completion of the Comprehensive Expenditure Review, the government is now focusing on horizontal opportunities that go beyond individual departments and organizations to improve overall efficiency.
- These ongoing horizontal reviews will include topics such as federal procurement contracts, external management consulting, and thematic reviews of horizontal programming—including a review of skills and youth programming, with an emphasis on improving services.
- The 2026 Spring Economic Update announced that, as a first step, the government is focusing on reducing the use of external management and other consulting services by 20 per cent over the next three years. This is expected to achieve savings of $450 million in 2027-28, and $900 million annually from 2028-29 going forward.
- Savings achieved through these horizontal reviews will count towards the Budget 2025 commitment to save at least $7.75 billion over three years, starting in 2027-28, and $3.25 billion ongoing to optimize productivity in the government.
- Results of the other reviews will be reported in Budget 2026. As stated in the 2026 Spring Economic Update, targeted horizontal reviews will become a permanent and predictable practice to strengthen expenditure management.
Details & Supplementary Information
Budget 2025 announced the government's intention to adopt regular, predictable review schedules to ensure ongoing responsible management of resources. It also announced that future reviews would focus on specific horizontal themes such as consolidating the administration of programs, fostering AI implementation and scale up, and reviewing business subsidies and skills programming.
To demonstrate the government's commitment to such reviews, Budget 2025 included savings of $7.75 billion over three years, starting in 2027-28, and $3.25 billion ongoing, with results to be reported in Budget 2026.
As part of Budget 2025, the government also committed to reduce spending on management and other consulting services by 20 per cent over three years. Separately, the Minister of Finance and the Minister of Government Transformation, Public Works and Procurement launched, in September 2025, a federal contracting review to ensure the government is receiving the lowest price for comparable goods and services.
Professional and Special Services
Total spending on management and other consulting was about $5 billion in 2024-25, while total spending on professional and special services represented $23.1 billion.
Key Components of Professional and Special Services Expenditures, 2024-25
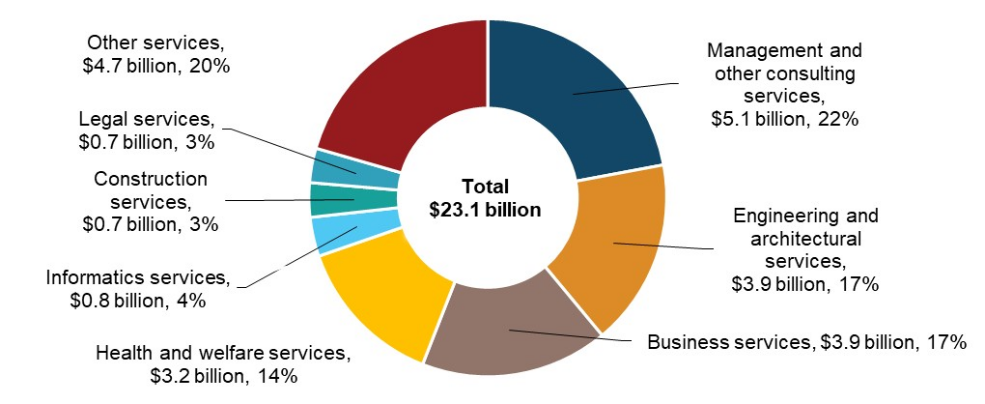
Combatting Financial Crimes (Anti-Money Laundering Measures)
Key Messages
Financial Crimes Agency
- The Government is standing up the Financial Crimes Agency, Canada's first-ever federal law enforcement agency dedicated to investigating sophisticated financial crimes like fraud and money laundering, and to recovering illicit proceeds.
- On April 27, 2026, legislation to enact the new Agency was tabled (Bill C-29, Financial Crimes Agency Act), and the Spring Economic Update proposed funding of over $400 million over 5 years to support the Agency's creation.
- This initiative delivers on the Government's Budget 2025 commitment and is part of the Government's broader efforts to protect Canadians and Canada's economy, crack down on financial crime, and reinforce Canada's credibility as a trusted international partner.
Banning Crypto ATMs
- Crypto ATMs have become a primary method for scammers to extract cash from victims and for criminals to place their proceeds of crime.
- By banning crypto ATMs, the Government is cracking down on scammers and protecting Canadians from financial crimes that support and enable drug trafficking, extortion, and fraud.
- Canadians will continue to be able to purchase cryptocurrency through online and brick-and-mortar exchanges where 'know your client' controls can be better ensured.
Details & Supplementary Information
Financial Crimes Agency
- Budget 2025 announced the Government's commitment to establish the Financial Crimes Agency (FCA) as Canada's as Canada's first-ever federal law enforcement agency dedicated exclusively to investigating sophisticated financial crimes and recovering illicit proceeds.
- On April 27, 2026, Bill C-29, Financial Crimes Agency Act, was introduced in Parliament. The proposed legislation would establish the FCA as an independent agency, reporting to the Minister of Finance, with police powers and civilian leadership. Key features of the Agency include:
- A mandate to investigate serious and complex financial crimes, such as money laundering, serious fraud, and major capital market crimes, and to recover the proceeds of crime;
- The capacity to lead investigations on its own and in close cooperation with provincial, territorial, municipal, and international law enforcement partners;
- The ability to attract, develop, and retain highly specialised personnel to support intelligence-led, follow-the-money investigations, including civilian and police investigators, criminal and financial intelligence personnel, and asset recovery experts, who will be supported by dedicated and specialised prosecutors; and
- Headquarters in the National Capital Region, with authority to establish regional offices.
- The FCA is expected to begin phased implementation following Royal Assent, with full operational capability targeted for 2027.
- To stand up the new Agency, the 2026 Spring Economic Update proposed to provide:
- $352.7 million over five years starting in 2026-27, with $57.8 million in remaining amortisation, and $82.1 million ongoing to the FCA;
- $46.2 million over five years and $11.5 million ongoing to the Public Prosecution Service of Canada; and
- $19.6 million over five years and $1.5 million ongoing to the Department of Finance Canada.
- The Spring Economic Update 2026 also announced the government's intention for the Minister of Justice to explore new criminal justice reforms to support the investigation and prosecution of complex financial crimes.
Crypto ATMs
- Studies from other jurisdictions have found that between 85 and 98 per cent of crypto ATM transactions are linked to illicit activity and the Canadian Anti-Fraud Centre estimates that between 5 and 10 per cent of fraud is reported, meaning that Canadians are estimated to have lost between $142 million and $284 million due to fraud facilitated by crypto ATMs in 2024.
- In Canada, there is no comprehensive data on all the transactions conducted by crypto ATMs or crypto ATM operators.
- Crypto ATMs also charge fees that are 5 to 10 times higher than online and brick-and mortar cryptocurrency exchanges, significantly limiting their legitimate use.
- Singapore and some cities and states in the Unted States have banned crypto ATMs outright, and the United Kingdom has effectively banned them. New Zealand is awaiting approval of legislation to ban them, and Australia has indicated that recently passed legislative powers will be used to ban crypto ATMs.
Restriction on Large Cash Transactions
- Legislation to implement the ban on crypto ATMs is expected to also include a restriction on accepting large cash transactions of $10,000 or more. This measure was included in Bill C-2, and received some criticism from the Conservative Party, who suggested that it could negatively affect legitimate transactions.
Responsive Only – If asked about the restriction on large cash transactions
- Profit-driven crimes such as drug trafficking, extortion, and fraud generate cash proceeds and cash remains a preferred payment method for criminals as it is autonomous and easily transferrable.
- For this reason, many countries maintain restrictions on large cash transactions. Canada is the only country in the G7, other than Japan, without a framework to restrict or regulate large cash transactions across the economy.
- The impact of these measures on Canadians would be minimal. Cash represented only 1% of payment transaction value in Canada in 2024, with an average transaction value of $27.
- Deposit taking institutions are exempted from the restriction on large cash transactions to allow cash to flow to the financial system and enable convenient, secure, and cost-effective electronic payment alternatives for large purchases, such as cheque, debit card, credit card, wire-transfer, e-transfer, etc.
- Every person in Canada has a statutory right to a bank account and Canada has the highest rate of financial inclusion in the G7, with over 99% of working age Canadians having an account at a financial institution.
- 99% of Canadians live within 20kms of an ATM and 97% within 20kms of a branch.
Defence Commitments – Budget 2025 and Spring Economic Statement 2026
Details & Supplementary Information
Budget 2025
- End of Chapter 4 Table (page 199 English, page 229 French): shows $58.8 billion on an accrual basis for defence, which includes: (1) Rebuilding, Rearming and Reinvesting in the Canadian Armed forces; (2) A New Defence Investment Agency; and (3) Operations REASSURANCE and AMARNA.
| 2025-2026 | 2026-2027 | 2027-2028 | 2028-2029 | 2029-2030 | Total | |
|---|---|---|---|---|---|---|
| 4.1 Defending our Sovereignty | 7,235 | 11,029 | 12,423 | 13,971 | 14,125 | 58,784 |
| Rebuilding, Rearming, and Reinvesting in the Canadian Armed Forces1,* | 7,217 | 10,125 | 11,601 | 13,331 | 14,348 | 56,622 |
|
Less: Funds Previously Provisioned
in the Fiscal Framework
|
-18 | -80 | -148 | -214 | -280 | -739 |
| A New Defence Investment Agency2 | 0 | 13 | 19 | 19 | 19 | 71 |
| Strengthening Canada's Presence: Operations REASSURANCE and AMARNA3,* | 57 | 1,018 | 998 | 836 | 40 | 2,949 |
|
Less: Funds Sourced From Existing
Departmental Resources
|
-20 | -47 | -48 | -2 | -2 | -119 |
|
1 Defence investments in 2025-26 under Rebuilding, Rearming, and Reinvesting in the Canadian Armed Forces are equal to over $9 billion on a cash basis, as announced by the Prime Minister on June 9, 2025. The $7.2 billion total in 2025-26 on an accrual basis differs from the original accrual figure of $8.3 billion due to the accounting treatment of investments made under the Defence Industrial Strategy. 2 A New Defence Investment Agency was announced on October 2, 2025. 3 Operation REASSURANCE was announced on August 26, 2025. *Measure includes funding classified as a capital investment. Note: Numbers may not add due to rounding. A glossary of abbreviations used in this table can be found at the end of Annex 1. |
||||||
- Details on these measures, including total funding amounts on a cash-basis, are outlined in Chapter 4 (pages 184-190 English, pages 213-219 French).
Spring Economic Statement 2026
- End of Chapter 1 Table (page 86 English, page 96 French): shows $2.08 billion on an accrual basis for defence, which includes: (1) the Defence Investment Agency; and (2) Operation UNIFIER.
| 2025-2026 | 2026-2027 | 2027-2028 | 2028-2029 | 2029-2030 | 2030-2031 | Total | |
|---|---|---|---|---|---|---|---|
| 1.6 Defending Our Sovereignty | 0 | 519 | 723 | 768 | 35 | 29 | 2,074 |
| Defence Investment Agency | 0 | 30 | 30 | 30 | 30 | 30 | 150 |
|
Less: Funds Previously Provisioned in the Fiscal Framework
|
0 | -8 | -8 | -8 | -8 | -8 | -39 |
|
Less: Funds Sourced From Existing Departmental Resources
|
0 | -3 | -2 | -2 | 0 | 0 | -8 |
| Canada's Support for Ukraine - Operation UNIFIER* | 0 | 499 | 703 | 748 | 13 | 7 | 1,970 |
|
*Measure includes funding classified as a capital investment. Note: Numbers may not add due to rounding. A glossary of abbreviations used in this table can be found at the end of Annex 1. |
|||||||
- Table A1.15 (page 136 English, page 158 French): shows $300 million in 2026-27 on an accrual basis for Military Assistance to Ukraine.
| Dept. | 2025-2026 | 2026-2027 | 2027-2028 | 2028-2029 | 2029-2030 | 2030-2031 | |
|---|---|---|---|---|---|---|---|
| Canada's Support for Ukraine - Military Assistance | DND | .... | 300 | - | - | - | - |
Defence Commitments
Key Messages
- In March, Canada achieved NATO's 2 per cent of GDP defence expenditure target - the first time since the fall of the Berlin Wall.
- NATO Allies, including Canada, have agreed to a new Defence Investment Pledge to spend 5 per cent of GDP on defence by 2035.
- Canada is on a pathway to meet this commitment. Specifically:
- Canada already meets the "defence- and security-related investments" target of 1.5 per cent with currently planned spending by federal, provincial, and territorial governments.
- The government announced $85 billion in Budget 2025 and an additional $2.4 billion in the Spring Economic Statement 2026 towards the "core defence investment" target of 3.5 per cent (see table below).
- In total, the government has provisioned funding to achieve 4 per cent of GDP in total defence spending by the end of this decade.
- The government intends to further increase defence spending to achieve the NATO 5 per cent spending target on or ahead of schedule (i.e., by 2035), with additional funding to be made available as specific defence spending plans and capabilities are defined.
*Bullets redacted*
Details & Supplementary Information
Budget 2025 and Spring Economic Update 2026 defence measures
| Measure | Description | Amount |
|---|---|---|
| Rebuilding, Rearming, and Reinvesting in the Canadian Armed Forces: | $81.8B over 5 years for the following measures: | |
| Recruitment, pay, and health services | Funding to recruit and retain a strong fighting force, including generational pay raises for the CAF, and support CAF health care. | $20.4B (5 years) |
| Infrastructure & equipment sustainment | Funding to repair and sustain CAF capabilities and invest in defence infrastructure, including expanding ammunition and training infrastructure. | $19.0B (5 years) |
| Digital, cyber, and IT modernization | Funding for upgrades to digital infrastructure, including those needed for modern warfare, such as cyber defence. | $10.9B (5 years) |
| New military capabilities | Funding to expand Canada's military capabilities, including investments in additional logistics utility, light utility, and armoured vehicles, counter-drone and long-range precision strike capabilities, and domestic ammunition production, among other investments. | $17.9B (5 years) |
| Defence industrial strategy | Funding to strengthen Canada's defence industry through the Defence Industrial Strategy. | $6.6B (5 years) |
| Defence partnerships & international support | Funding to expand Canada's defence partnerships, including expanded military assistance to Ukraine and increased military training and international policy programming. | $6.2B (5 years) |
| Supporting security organizations | Funding to the Canadian Coast Guard, the Canadian Security Intelligence Service, and Public Services and Procurement Canada for complementary initiatives to support Canada's defence capabilities. | $0.805B (5 years) |
| Defence Investment Agency | Funding to Public Services and Procurement Canada to establish the Defence Investment Agency. | $30.8 million over 4 years |
| Operation REASSURANCE | Funding to the Department of National Defence in support of the renewal of Operation REASSURANCE, the CAF's largest overseas mission | $2.7 billion over 3 years |
| Operation ARMANA | Funding to the Department of National Defence and the Communications Security Establishment to support Operation AMARNA, the CAF's contribution to strengthening peace and security in the Middle East. | $300.1 million over 3 years |
| Measure | Description | Amount |
|---|---|---|
| Defence Investment Agency | Additional funding to establish and operate the Defence Investment Agency as a stand-alone entity. | $103.8M over 5 years, and $22.3 million ongoing |
| Operation UNIFER | Funding to the Department of National Defence, the Communications Security Establishment, Global Affairs Canada, and the Canadian Security Intelligence Service for the renewal of Operation UNIFER for the CAF to continue training members of the Armed Forces of Ukraine | $2.0 billion over 3 years |
| Canada's Support for Ukraine - Military Assistance | Funding for Military Assistance to Ukraine. | $300 million in 2026-27 |
Major Projects Office
Key Messages
- Launched in August 2025, the Major Projects Office (MPO) seeks to accelerate the delivery of nation-building projects in Canada and acts as a single window for project proponents into the federal regulatory process to simplify and accelerate project approvals. It is a key part of the Government's plan to enable $1 trillion in total investment over the next five years through smarter public spending and stronger capital investment.
- The economic impact of achieving this target would be substantial, compounding over time through higher productivity. As an illustration, with $500 billion in additional private investment over 5 years, real GDP could be about 3.5 per cent higher than otherwise by 2030.
- Projects referred to the MPO are the kinds of projects that will expand Canadian exports to new global partners, unleash Canada's considerable resource potential, and fuel economic growth.
- Budget 2025 announced funds to establish the MPO and boost major project financing through the Canada Infrastructure Bank and the Canada Indigenous Loan Guarantee Corporation. It also renewed the Federal Initiative on Consultations at Crown-Indigenous Relations and Northern Affairs Canada and support Indigenous participation in major project assessment at Indigenous Services Canada.
- To date, fifteen projects and six strategies have been referred to the Major Projects Office. Together, they represent over $125 billion in new investment, support over 60,000 jobs, and will build Canada's economic strength for generations to come.
- On May 8, 2026, the Government announced potential changes to ensure federal reviews and decision-making will take no longer than one year once all information from the project proponent has been received. The Government is launching two discussion papers to engage with Indigenous Peoples, provinces and territories, and the Canadian public over a 30-day period on the proposed regulatory reforms.
Details & Supplementary Information
Projects referred to the Major Projects Office represent over $125 billion in capital investment
1 industrial project, 4 electricity projects, 5 mining projects, 2 energy projects, 3 transportation projects
- LNG Canada Phase 2 (Kitimat, BC): This project would double the facility's LNG production, making it the world's second largest LNG terminal and attracting $33 billion in private capital. It will deliver low carbon Canadian LNG to global markets and strengthen local economic growth.
- Darlington New Nuclear Project (Bowmanville, ON): This project will make Canada the first G7 country to operate a grid scale small modular reactor. Its first unit will power 300,000 homes and support 200 permanent and 1,600 construction jobs. Up to $3 billion in equity from the Canada Growth Fund and the Building Ontario Fund is helping de-risk construction.
- Contrecœur Terminal Container Project (Contrecœur, QC): This expansion will increase the Port of Montreal's container capacity by 60%, strengthening supply chains and creating thousands of jobs. On April 9, 2026, the Government of Canada announced the start of construction of this project and the Canada Infrastructure Bank committed $1.16 billion in financing.
- McIlvenna Bay Foran Copper Mine (East Central SK): This project will supply low emission copper and zinc for clean energy and advanced manufacturing while creating hundreds of jobs.
- Red Chris Mine Expansion (Northwestern BC): This expansion will extend the mine's life by more than a decade, increase Canada's copper output by over 15%, and support 1,500 operational and 1,800 construction jobs.
- North Coast Transmission Line (Northwestern BC): This three-phase project will twin major transmission lines from Prince George to Terrace and north to Bob Quinn, bolstering telecommunications and electricity access for remote communities and major industrial projects.
- Ksi Lisims LNG (Pearse Island, Nisg̱a'a Territory, BC): This floating LNG facility will be one of the world's lowest emission LNG operations, attracting nearly $30 billion in investment and creating thousands of skilled careers. The project received coordinated federal and provincial environmental assessment approvals in September 2025.
- Canada Nickel's Crawford Project (Timmins, ON): This project will produce high quality, low carbon nickel for batteries and green steel, drawing $5 billion in investment and creating thousands of jobs.
- Nouveau Monde Graphite – Matawinie Mine (Saint Michel des Saints, QC): This project will support QC's battery hub through an integrated graphite mine and materials plant, creating more than 1,000 jobs and attracting $1.8 billion in investment. Through the MPO, the Government of Canada has coordinated financing-related support to advance the project at speed, including a seven-year, 30,000 tonnes-per-annum offtake agreement with the Government of Canada, $459 million in debt financing commited by the Canada Infrastructure Bank and Export Development Canada, and a $113 million strategic equity investment from the Canada Growth Fund.
- Northcliff Resources' Sisson Mine (Sisson Brook, NB): This project would restore Canada's tungsten production—critical for defence and advanced manufacturing—and produce molybdenum for high strength steel and superalloys. It would reestablish Canada as a secure supplier of tungsten.
- Iqaluit Nukkiksautiit Hydro Project (Iqaluit, NU): This 15–30 MW Inuit-owned hydro project will replace Iqaluit's reliance on 15 million litres of imported diesel each year, eliminating 130,000 tonnes of emissions and delivering affordable, reliable, emissions-free power.
- Taltson Hydro Expansion (Great Slave Lake region, NWT): This project will double the Northwest Territories' hydro capacity by building a new 60-megawatt hydro facility and connecting the North and South Slave Lake electrical grids through a 320-kilometre transmission line.
- Mackenzie Valley Highway (Wrigley to Inuvik, NWT): This 800km-long road will create a new all-season economic corridor up the Mackenzie Valley while providing year-round connectivity to three isolated communities.
- Grays Bay Road and Port (Kitikmeot Region, NU): This project will create critical export links and enable new resource exploration and development through an all-season 230km road from the Nunavut border to a new deepwater port and airfield on the Arctic Ocean.
- Arctic Economic and Security Corridor (Slave Geological Province, NWT): This 400km all-season road will connect Yellowknife to the Grays Bay Road and Port, creating critical export links and enabling new resource exploration and development.
Transformative strategies under development by the mpo
- Alto High-Speed Rail: Canada's first high-speed railway, spanning approximately 1,000 km from Toronto to Québec City and reaching speeds of up to 300 km/hour to cut travel times in half and connect close to half of Canada's population.
- Port of Churchill Plus: This project will upgrade the Port of Churchill and expand trade corridors with an all-weather road, an upgraded rail line, a new energy corridor, and marine ice-breaking capacity.
- Critical Minerals Strategy: A priority for the Major Projects Office will be to get more critical minerals projects to final investment decisions, with a focus on sustainability and regulatory certainty.
- Wind West Atlantic Energy: A project that would leverage over 60 GWs of wind power potential in NS, and more across Atlantic Canada, connecting that renewable, emissions-free energy to Eastern and Atlantic Canada to meet rapidly growing demand.
- Pathways Plus: An Alberta-based carbon capture, utilization, and storage project with additional energy infrastructure that would support a strong conventional energy sector while driving down emissions and emissions intensity from the oil sands. Pathways creates the prospect of facilitating low-carbon oil exports from the Alberta oil sands to a variety of potential markets.
- The Northwest Critical Conservation Corridor (Northwest BC and the Yukon): Canada's northwestern coast is home to the Golden Triangle - one of the world's richest reserves of the minerals and metals that are essential for the energy transition as well as defence supply chains for Canada and our allies.
Major Transfers to Provinces and Territories in 2026-27 – Main Estimates
Key Messages
- As stated in the Spring Economic Update, in 2026-27, transfers to other levels of government grew by $4.8 billion from $110.8 billion to $115.6 billion.
- This growth was driven primarily by the four major federal transfers to provinces and territories (table below).
| 2025-26 | 2026-27 | Change | |
|---|---|---|---|
| CHT | 54,685 | 57,419 | 2,734 (5.0%) |
| CST | 17,416 | 17,939 | 522 (3.0%) |
| Equalization | 26,170 | 27,160 | 991 (3.8%) |
| TFF | 5,489 | 5,844 | 355 (6.5%) |
| Total | 103,759 | 108,362 | 4,602 (4.4%) |
- These are statutory transfers administered by the Department of Finance and are largely unconditional.
Details & Supplementary Information
1. What were the main drivers of the legislated growth in determining the 2026-27 major transfer payments?
- Equalization grows in line with the three-year average growth rate of nominal GDP.
- The 2026-27 growth track is equal to the average nominal GDP growth in 2024, 2025 and 2026: 3.8 per cent.
- The Canada Health Transfer (CHT) grows at the greater of the three-year average growth of nominal GDP and a legislated minimum rate. On February 7, 2023, the minimum rate was set to 5.0 per cent from 2023-24 to 2027-28. In 2028‑29, it will revert to a 3.0 per cent.
- The 2026‑27 growth track is equal to 5.0 per cent, exceeding average GDP growth in 2024, 2025 and 2026 (3.8 per cent).
- The CST is legislated to grow at 3 per cent per year.
- Territorial Formula Financing increases are mainly due to growth in provincial/local government expenditures, which are major components of the formula.
2. Will the federal government renew sunsetting health-care funding?
- Overall federal support for health care will continue to grow each and every year thanks to the 5% growth guarantee for the Canada Health Transfer until 2027-28, with the CHT continuing to grow at the greater of a three-year moving average of nominal GDP growth or 3% beginning in 2028-29.
- If pressed: No decision has been made regarding the renewal of federal funding for Home and Community Care and Mental Health and Addictions, which were time‑limited and are set to expire in 2026–27, or for Long-term Care, which is set to expire in 2027–28.
3. How do public debt charges compare with health transfers?
- Public debt charges are expected to exceed the Canada Health Transfer in 2026-27 and are expected to continue to do so in each year of the forecast projection.
- By 2028-29 the government will balance day-to-day spending with revenues. At that point deficits will be attributable to investments to support long-term prosperity.
- Despite new nominal highs, debt charges remain relatively low as a share of GDP (currently at a ratio of 1.8%) and are projected to remain sustainable over the medium and long-term.
| Projections | ||||||||
|---|---|---|---|---|---|---|---|---|
| 2024-25 | 2025-26 | 2026-27 | 2027-28 | 2028-29 | 2029-30 | 2030-31 | ||
| Canada Health Transfer | 52.1 | 54.7 | 57.4 | 60.3 | 62.6 | 65.0 | 67.5 | |
| Public Debt Charges | 53.4 | 54.0 | 58.7 | 65.7 | 71.6 | 75.7 | 80.9 | |
4. How were the federal transfers allocated by PT in 2025-26 and 2026-27?
| 2025-26 | ||||||||||||||
|---|---|---|---|---|---|---|---|---|---|---|---|---|---|---|
| Level | NL | PE | NS | NB | QC | ON | MB | SK | AB | BC | NU | NT | YT | Total |
CHT |
722 | 240 | 1,435 | 1,142 | 11,893 | 21,346 | 1,982 | 1,663 | 6,603 | 7,480 | 55 | 60 | 63 | 54,685 |
CST |
230 | 76 | 457 | 364 | 3,788 | 6,798 | 631 | 530 | 2,103 | 2,382 | 17 | 19 | 20 | 17,416 |
Equalization |
113 | 666 | 3,465 | 3,123 | 13,567 | 546 | 4,689 | 0 | 0 | 0 | 0 | 0 | 0 | 26,170 |
TFF |
0 | 0 | 0 | 0 | 0 | 0 | 0 | 0 | 0 | 0 | 2,231 | 1,803 | 1,454 | 5,489 |
Total |
1,065 | 982 | 5,357 | 4,629 | 29,248 | 28,690 | 7,302 | 2,193 | 8,706 | 9,863 | 2,304 | 1,883 | 1,538 | 103,759 |
| Change since 2024-25 | ||||||||||||||
CHT |
32 | 13 | 69 | 58 | 539 | 968 | 99 | 88 | 407 | 322 | 3 | 3 | 3 | 2,604 |
CST |
6 | 3 | 13 | 12 | 101 | 182 | 20 | 18 | 91 | 58 | 1 | 1 | 1 | 507 |
Equalization |
-105 | 56 | 180 | 226 | 251 | -29 | 336 | 0 | 0 | 0 | 0 | 0 | 0 | 917 |
TFF |
0 | 0 | 0 | 0 | 0 | 0 | 0 | 0 | 0 | 0 | 122 | 104 | 104 | 330 |
Total |
-67 | 72 | 263 | 297 | 892 | 1,121 | 455 | 107 | 498 | 381 | 125 | 108 | 108 | 4,358 |
| (%) | -5.9% | 7.9% | 5.2% | 6.8% | 3.1% | 4.1% | 6.6% | 5.1% | 6.1% | 4.0% | 5.7% | 6.1% | 7.6% | 4.4% |
| 2026-27 | ||||||||||||||
Level |
NL | PE | NS | NB | QC | ON | MB | SK | AB | BC | NU | NT | YT | Total |
CHT |
755 | 254 | 1,507 | 1,203 | 12,457 | 22,359 | 2,086 | 1,757 | 7,036 | 7,817 | 58 | 64 | 67 | 57,419 |
CST |
236 | 79 | 471 | 376 | 3,892 | 6,985 | 652 | 549 | 2,198 | 2,442 | 18 | 20 | 21 | 17,939 |
Equalization |
182 | 723 | 3,538 | 3,360 | 13,907 | 406 | 5,044 | 0 | 0 | 0 | 0 | 0 | 0 | 27,160 |
TFF |
0 | 0 | 0 | 0 | 0 | 0 | 0 | 0 | 0 | 0 | 2,358 | 1,907 | 1,579 | 5,844 |
Total |
1,173 | 1,055 | 5,517 | 4,939 | 30,256 | 29,750 | 7,781 | 2,305 | 9,235 | 10,259 | 2,434 | 1,991 | 1,667 | 108,362 |
| Change since 2025-26 | ||||||||||||||
CHT |
33 | 14 | 72 | 62 | 564 | 1,013 | 104 | 93 | 433 | 337 | 3 | 3 | 3 | 2,734 |
CST |
6 | 3 | 14 | 12 | 104 | 187 | 20 | 19 | 95 | 60 | 1 | 1 | 1 | 522 |
Equalization |
68 | 57 | 74 | 237 | 340 | -140 | 355 | 0 | 0 | 0 | 0 | 0 | 0 | 991 |
TFF |
0 | 0 | 0 | 0 | 0 | 0 | 0 | 0 | 0 | 0 | 126 | 104 | 125 | 355 |
Total |
108 | 73 | 159 | 311 | 1,008 | 1,060 | 479 | 112 | 529 | 396 | 130 | 108 | 129 | 4,602 |
| (%) | 10.1% | 7.5% | 3.0% | 6.7% | 3.4% | 3.7% | 6.6% | 5.1% | 6.1% | 4.0% | 5.6% | 5.7% | 8.4% | 4.4% |
|
Totals may not add due to rounding. CHT and CST 2025-26 represents the second estimate and 2026-27 represents the first estimate. This table excludes other fiscal arrangements: Deductions and Reimbursements to the CHT, Health Agreements with Provinces and Territories, Canada-Wide Early Learning and Child Care, Canada's Cities and Communities Fund, Statutory Subsidies, Quebec Abatement, Fiscal Stabilization, Hibernia Dividend Backed Annuity Agreement with Newfoundland and Labrador, Transfer of Hibernia Net Profits Interest and Incidental Net Profits Interest Net Revenues to Newfoundland and Labrador and repayment of funding for orphan wells to Alberta. |
||||||||||||||
5. Equalization and Territorial Formula Financing
General messages
- Equalization is financed by the Government of Canada from general revenues, which are largely raised through federal taxes. All Canadians are subject to the same federal income tax system and its progressive rate structure, regardless of where they live. Provincial governments make no contributions to the Equalization program.
- The broad parameters of the formula are contained in the Federal-Provincial Fiscal Arrangements Act (FPFAA). The Minister of Finance is authorized under the FPFAA to make Equalization payments. This authority is typically renewed every five years to ensure the program is meeting its objectives and using the most up-to-date and accurate measures in the determination of provincial entitlements.
- The federal government consults regularly with provincial governments in support of renewal. We have initiated consultations with provinces and territories for the next renewal, which must take place before March 31, 2029.
5A. Newfoundland and Labrador has filed a constitutional challenge of Equalization claiming that it is unfairly treated regarding Equalization floor payments/the fiscal capacity cap/the cost of delivering services. What is the government's response?
- The Government of Canada is committed to the principle of making Equalization payments to ensure that provincial governments have sufficient revenues to provide reasonably comparable levels of public services at reasonably comparable levels of taxation. The government will make made Equalization payments totaling $27.2 billion in 2026–27.
If pressed on details of the litigation:
- I cannot comment on matters that are before the courts.
5B. Why does the Equalization program pay out more than is required under its own formula?
- Under the current formula, total Equalization payments grow in line with the economy.
- The current formula has provided stable and predictable funding since 2009-10.
- Equalization does not raise the fiscal capacity of recipient provinces above that of non‑recipient provinces. Despite the GDP growth track generating a higher total payout than the formula it superseded, non‑recipient provinces still have greater fiscal capacity than recipient provinces.
5C. Is the fiscal capacity cap unfair in respect of natural resources?
- The Equalization program's treatment of natural resources represents a compromise position from the 2006 Expert Panel that sought to balance the interests of resource-rich provinces with those of resource-poor provinces. The Panel recommended a 50% inclusion rate for resource revenues, with a fiscal capacity cap to prevent Equalization from raising the fiscal capacity of a recipient province above that of a non-recipient province.
5D. Are revenues from hydroelectricity excluded from the calculation of Equalization? Does hydro receive more favourable treatment?
- All natural resource revenues collected by provincial governments are treated in the same way in Equalization, whether they are from hydroelectricity, oil and gas royalties, or any other resources. The current treatment of natural resources reflects the recommendations of the O'Brien Expert Panel in 2006, which balanced the interests of resource-rich and resource-poor provinces.
- If pressed: I am aware of the concerns about how provinces endowed with hydro resources may forego revenues by having low electricity rates. This is an issue that my officials have been working on in past renewals. They have initiated consultations with their provincial and territorial counterparts for the next renewal cycle.
5E. Newfoundland and Labrador and others have requested that Equalization be updated to reflect expenditure need. If it is part of the Constitution, why is it not measured?
- The program has never included a measure of the cost of delivering public services.
- If pressed: The 2006 Expert Panel reported that most provinces supported the current approach focused on fiscal capacity and expressed concern that addressing expenditure need would add further complexity to an already complex program and could also result in indirect intrusions by Canada into decisions that are the responsibility of provinces.
5F. How do you explain Alberta's net fiscal contribution to Canada? Is it fair?
- All Canadians are subject to the same federal income tax system and its progressive income tax rate structure, regardless of where they live. The tax and transfer system takes into account individuals' and businesses' ability to pay and provides support to those who are most in need.
- Canadians in some regions are net fiscal contributors in aggregate while others are net recipients. This is normal in a federation. It reflects the different economies of our regions.
- Through the tax system, the federal government collects proportionately more revenues in regions whose citizens are more prosperous.
- In contrast, the residents of regions whose populations are less prosperous on average generally need more support, therefore federal expenditures will be proportionately larger among those citizens through programs such as Employment Insurance, the Canada Child Benefit, the Guaranteed Income Supplement and Equalization in response to those needs.
- Canada is more than a balance sheet. The federal system benefits all Canadians, regardless of whether their province is a net fiscal recipient or a net fiscal contributor.
5G. There have been requests for discussions on Equalization and TFF renewals to begin soon. When do you plan on resuming those discussions?
- Federal officials have initiated consultations with their provincial and territorial counterparts for the next renewal cycle.
- The federal government consults regularly with provincial and territorial governments in support of renewal. The next renewal must take place before March 31, 2029.
5H. Does Equalization reduce economic growth incentives?
- It is doubtful that a provincial government would prefer to rely on Equalization payments rather than on its own fiscal revenues from economic growth. Economic growth provides greater overall benefits to both the provincial government and the province's residents.
5I. Should there be a permanent independent body advising on the allocation of Equalization?
- The Expert Panel reported that the majority of provinces indicated there was no need for such a body. While there is room for improvement in the current intergovernmental process, most preferred that process to an arms-length body.
6. What is the Quebec Abatement and how does it work?
- The Quebec Abatement consists of a reduction of 16.5 percentage points of federal personal income tax for all tax filers in Quebec, representing approximately $8.4 billion in 2026-27.
- During the 1960s and 1970s, provinces were given the option to accept federal tax points (i.e., "abatement") in lieu of cash federal support for certain social programs such as hospital insurance, social welfare or youth allowances. Abatement would allow a province to increase its provincial tax rate by an equivalent amount with no impact on its taxpayers. Quebec was the only province that took up the federal offer.
- Since major federal transfers to Quebec are calculated on the same basis as those to other provinces, the abated amounts must be recovered. This has no net impact on Quebec's total federal transfers.
Automatic Tax Filing
Key Messages
Pre-filled tax returns
- Budget 2025 announced that the CRA will prepare a pre-filled income tax return for individuals with lower income and a simple tax situation.
- This will help about 1 million individuals starting in 2027 for the 2026 tax year, scaling up to about 5.5 million individuals by 2029 for the 2028 tax year.
- Individuals will be able to access the service, verify personal details, review a pre-filled summary and submit a tax return online in their CRA account.
- This will ensure individuals receive their entitled benefits, like the Canada Groceries and Essentials Benefit (CGEB) (replacing the GST/HST credit in July 2026), the Canada child benefit, and more.
Deemed filing
- Budget 2025 also proposes to amend the Income Tax Act to allow the CRA to file a tax return on behalf of certain eligible individuals with lower incomes in simple tax situations who do not owe tax and do not file themselves.
SimpleFile Services
- SimpleFile services are simplified tax filing methods offered by the CRA to eligible individuals with a lower income and a simple tax situation.
- For the 2026 filing season, the CRA's SimpleFile services offered close to 3M eligible individuals the option to file a tax return quickly, easily, and for free by phone, paper, or digitally.
Details & Supplementary Information
Pre-filled tax returns
- The individual's consent/acceptance is still required for the CRA to file the pre-filled return. Unlike traditional filing methods (e.g., paper, NETFILE, etc.), eligible individuals will not need to enter data and transmit the return themselves. Once the individual reviews and confirms/accepts the information on their pre-filled return, the CRA will automatically file the return for them.
- This will ensure individuals receive their entitled benefits, like the Canada Groceries and Essentials Benefit (CGEB) (replacing the GST/HST credit in July 2026), the Canada child benefit, and more.
- For some benefits, such as the Canada child benefit, individuals need to complete an application to start receiving them.
Deemed filing
- Proposed legislative conditions for deemed filing:
- the individual has not notified the Minister not to file a return of income for the year on the individual's behalf;
- the individual has not filed a return of income for at least one of the three immediately preceding taxation years;
- the individual has not filed a return of income for the year on or before the day that is 45 days after the filing-due date for the year;
- all of the individual's income for the year, if any, was reported in an information return filed with the Minister for the year;
- the individual's taxable income for the taxation year is below the lower of either the federal basic personal amount or provincial equivalent (plus the age amount and/or disability amount, where applicable);
- the Minister has notified the individual of the information on file with the Minister for the year and the individual has not, within 90 days after the day on which the notice is mailed or sent electronically by the Minister,
- otherwise filed a return of income for the year, or
- notified the Minister of corrections to be made to the information on file with the Minister that would cause any of the other conditions in this subsection not to be satisfied;
- the individual has not become bankrupt in the year; and
- the individual meets such other conditions as designated by the Minister, if any.
Charitable Status for Religious Organizations
Key Messages
- Registration and monitoring of the charitable status of organizations is a non-partisan regulatory process falling within the mandate of the Canada Revenue Agency (CRA).
- The CRA applies the relevant legislation and policies consistently and fairly to all organizations, regardless of their religious affiliations.
- Audits are conducted impartially and are a key part of the compliance program. They help the CRA maintain public confidence in the fairness and integrity of the charities registration system.
- The CRA does not select registered charities for audit based on faith or denomination, nor would such factors influence the outcome of an audit. All steps in this process are carried out within a clear regulatory and risk management framework designed to prevent bias in decision-making.
- The CRA's decision to revoke an organization's charitable registration is not taken lightly. Every organization facing revocation has the right to seek recourse.
If pressed on specific organizations:
- The confidentiality provisions of the Income Tax Act prevent the CRA from disclosing taxpayer information and commenting on specific cases. Furthermore, it can neither confirm nor deny whether an organization is currently under audit, has been selected for audit, or has been audited.
- The CRA's actions can only be made public when they result in a charity being revoked or sanctioned.
Details & Supplementary Information
Registering for charitable status
In order to be registered as a charity, an organization must be constituted exclusively for charitable purposes and devote all of its resources to activities that further those purposes. Charitable purposes fall into one or more of the following categories: the relief of poverty, the advancement of education, the advancement of religion, and other purposes beneficial to the community.
The term charitable is not defined in the Income Tax Act, so the common law (court decisions) is used to determine what is charitable.
A registered charity's purposes must also provide a tangible benefit to the public as a whole, or a significant section of it. In addition, purposes and activities that are illegal in Canada or contrary to Canadian public policy are prohibited.
The CRA applies the same standard whether the applicant organization intends to operate a religious organization, or carry on any other type of charitable purpose.
Regarding organizations that intend to carry on religious programming, they must demonstrate to the CRA that their activities advance religion in the charitable sense. Generally, this means manifesting, promoting, sustaining, or increasing belief in a religion's three key attributes: faith in a higher unseen power such as a God, Supreme Being, or Entity; worship or reverence; and a particular and comprehensive system of doctrines and observance. This can be achieved through a variety of activities, including by establishing, maintaining, and supporting a house of worship with services held in accordance with the tenets and doctrines of a particular faith or religion.
Audit selection
Charities are selected for audit based on a variety of factors intended to minimize the risk of non-compliance. Self reported information on a charity's T3010 information return and non-compliance identified in previous audits are two factors used in identifying risk.
Information obtained by the CRA about a charity's potential non-compliance (e.g., from public sources or complaints) can, when combined with other information available, also inform risk assessments and whether an audit is warranted. When assessing for risk, only new information contained in these sources is considered, not the volume of submissions received about a single charity. In all cases, the relevance and credibility of any information collected is weighed accordingly based on a variety of factors.
The risk assessment conducted as part of the audit selection process is subject to an internal review and approval process that considers all information available. Over the course of an audit and upon its conclusion, the CRA's actions and decisions are determined by the relevant facts of each case.
Objections and appeals
In every case where an audit identifies serious non-compliance, the CRA will send the charity an administrative fairness letter that provides a detailed summary of the audit findings and the CRA's proposed course of action. The charity is then invited to respond in writing to the audit findings. The CRA will review and consider these representations prior to reaching a final decision on its proposed remedy.
If the CRA decides to revoke a charity's registration, or impose a sanction, a letter will be sent informing the charity before it is revoked or sanctioned. If the charity disagrees with the CRA's decision, it can challenge it by filing an objection with the CRA's Appeals Branch. If a registered charity disagrees with a decision resulting from the CRA objection process, it can appeal to the Federal Court of Appeal or the Tax Court of Canada, depending on the issue being appealed.
Public disclosure and revocations
When the CRA revokes a charity's registration, or imposes a sanction, it posts this information in the List of charities and certain other qualified donees. Under the Income Tax Act, the CRA can release a copy of the letter(s) it sent to the charity outlining the reasons for its decision. This is to make sure the CRA's decision about the charity is transparent.
Public disclosure and T3010, Registered Charity Information Return
Under the Income Tax Act, all registered charities must file Form T3010, Registered Charity Information Return, along with the required attachments and financial statements, no later than six months after the end of their fiscal year. In their annual information return, charities are generally required to disclose, among other information, all of their income, expenses, assets, and liabilities for the fiscal year in question.
Form T3010 serves two main purposes. First, it provides the CRA with the required information to make sure that the registered charity remains compliant. Second, it promotes accountability and provides transparency for the public who want accurate and up-to-date information about registered charities.
The public information of Form T3010, for the most recent five fiscal periods, is published on the CRA's List of charities and certain other qualified donees. Also, all public data from registered and revoked charities' annual information returns for the fiscal periods 1990 to 2024, can be found on the Government of Canada's Open Government Portal.
The public may also request a copy of a registered charity's information returns and financial statements through informal information request and formal access to information request.
Main Estimates - Overview
- The 2026–27 Main Estimates present a total of $502.8 billion in budgetary spending, which reflects:
- $230.4 billion to be voted—the government's own operating and capital expenditures for some 130 organizations; transfer payments to other levels of government, organizations or individuals; and payments to Crown corporations.
- $272.4 billion in forecast statutory expenditures—including major transfer payments to other levels of government and individuals, most notably elderly benefits, the Canada Health Transfer and Equalization; and public debt charges.
- A further $2.9 billion in non-budgetary expenditures are included—mainly net outlays and receipts related to loans, investments and advances, on a statutory basis.
- The Main Estimates, presented on a cash basis, broadly comprise:
- Transfer payments: 59.8% of expenditures or $300.5 billion
- Operating and capital expenditures: 29.5% of expenditures or $148.6 billion
- Public debt charges: 10.7% of expenditures or $53.7 billion.
- Key Budget 2025 measures included in the Main Estimates:
- Rebuilding, Rearming, and Reinvesting in the Canadian Armed Forces ($10.4 billion)
- Helping Youth Find and Keep Jobs ($0.8 billion)
- Strengthening First Nations Infrastructure Financing and Access to Clean Water ($0.8 billion)
- A New Trade Infrastructure Strategy ($0.7 billion)
- Strengthening Federal Law Enforcement ($0.3 billion)
Estimates by Organization – Top 10
Department of Finance – Total: $158 billion (budgetary) / $1.3 billion (non-budgetary)
- Voted: $148 million
- Statutory: $158 billion
- Non-budgetary $1.3 billion
Department of Employment and Social Development – Total: $110 billion (budgetary) / $1.8 billion (non-budgetary)
- Voted: $13.6 billion
- Statutory: $97 billion
- Non-budgetary: $1.8 billion
Department of National Defence – Total: $50.7 billion
- Voted: $48.4 billion
- Statutory: $2.3 billion
Department of Indigenous Services – Total: $24.1 billion
- Voted: $24.0 billion
- Statutory: $170 million
Department of Crown-Indigenous Relations and Northern Affairs – Total: $11.9 billion (budgetary) / $25.9 million (non-budgetary)
- Voted: $11.8 billion
- Statutory: $33.7 million
- Non-budgetary: $25.9 million
Treasury Board Secretariat – Total: $11.8 billion
- Voted: $11.8 billion
- Statutory: $42.0 million
Department of Health – Total: $11 billion
- Voted: $10.4 billion
- Statutory: $552.1 million
Department of Housing, Infrastructure and Communities – Total: $10.5 billion
- Voted: $8.0 billion
- Statutory: $2.5 billion
Department of Industry – Total: $8.8 billion (budgetary) / $800,000 (non-budgetary)
- Voted: $8.7 billion
- Statutory: $180 million
- Non-budgetary: $800,000
Department of Veterans Affairs – Total: $8.2 billion
- Voted: $8.1 billion
- Statutory: $50.4 million
| Organization | 2024–25 Expenditures | 2025–26 Main Estimates | 2025–26 Estimates To Date | 2026–27 Main Estimates |
|---|---|---|---|---|
| Budgetary | ||||
| Administrative Tribunals Support Service of Canada | 85,959,301 | 82,470,273 | 87,229,416 | 79,351,598 |
| Atlantic Canada Opportunities Agency | 400,468,299 | 362,024,356 | 416,594,564 | 389,405,777 |
| Atomic Energy of Canada Limited | 1,433,600,000 | 1,945,655,529 | 1,947,025,222 | 1,704,470,844 |
| Canada Border Services Agency | 3,008,932,959 | 2,992,971,949 | 3,010,144,240 | 3,069,895,577 |
| Canada Council for the Arts | 364,283,160 | 360,142,160 | 360,312,160 | 357,666,546 |
| Canada Mortgage and Housing Corporation | 5,443,589,624 | 6,367,704,082 | 6,468,812,197 | 6,128,083,371 |
| Canada Post Corporation | 22,210,000 | 1,056,210,000 | 2,064,210,000 | 22,210,000 |
| Canada Revenue Agency | 22,179,323,307 | 10,375,216,596 | 10,622,929,278 | 6,273,543,680 |
| Canada School of Public Service | 98,781,330 | 94,053,264 | 96,253,932 | 88,055,308 |
| Canada Water Agency | 43,218,773 | 84,831,831 | 84,781,231 | 81,026,925 |
| Canadian Accessibility Standards Development Organization | 21,379,095 | 21,294,509 | 21,294,509 | 21,366,957 |
| Canadian Air Transport Security Authority | 1,079,165,190 | 1,201,924,450 | 1,215,468,950 | 562,129,853 |
| Canadian Broadcasting Corporation | 1,425,237,411 | 1,425,237,411 | 1,575,237,411 | 1,383,252,311 |
| Canadian Centre for Occupational Health and Safety | 14,879,172 | 13,680,957 | 13,680,957 | 15,508,377 |
| Canadian Commercial Corporation | 13,792,138 | 13,792,138 | 13,792,138 | 13,772,022 |
| Canadian Dairy Commission | 5,148,853 | 5,088,203 | 5,088,203 | 4,808,231 |
| Canadian Energy Regulator | 130,962,833 | 116,971,846 | 124,842,043 | 119,372,758 |
| Canadian Food Inspection Agency | 1,039,748,970 | 916,844,964 | 925,927,687 | 839,092,362 |
| Canadian Grain Commission | 16,884,985 | 28,289,764 | 28,536,573 | 24,283,185 |
| Canadian High Arctic Research Station | 36,467,311 | 35,033,359 | 36,043,283 | 37,518,933 |
| Canadian Human Rights Commission | 41,564,092 | 39,491,498 | 40,292,916 | 38,268,771 |
| Canadian Institutes of Health Research | 1,424,372,236 | 1,374,978,697 | 1,376,931,655 | 1,487,399,731 |
| Canadian Intergovernmental Conference Secretariat | 8,124,909 | 7,901,183 | 7,901,183 | 6,419,139 |
| Canadian Museum for Human Rights | 28,589,790 | 26,906,790 | 28,755,883 | 25,407,184 |
| Canadian Museum of History | 83,226,822 | 78,060,568 | 81,953,458 | 76,855,199 |
| Canadian Museum of Immigration at Pier 21 | 10,024,370 | 8,799,370 | 9,916,370 | 8,080,571 |
| Canadian Museum of Nature | 36,378,308 | 29,288,223 | 35,148,045 | 30,041,517 |
| Canadian Northern Economic Development Agency | 80,976,370 | 77,835,040 | 111,318,462 | 134,263,076 |
| Canadian Nuclear Safety Commission | 202,442,088 | 185,065,842 | 185,051,942 | 190,308,129 |
| Canadian Race Relations Foundation | 12,092,410 | 12,000,000 | 11,990,800 | 12,000,000 |
| Canadian Radio-television and Telecommunications Commission | 21,268,519 | 21,866,254 | 21,866,254 | 17,565,107 |
| Canadian Security Intelligence Service | 813,017,414 | 980,139,971 | 992,372,336 | 1,012,856,183 |
| Canadian Space Agency | 634,726,541 | 834,080,831 | 1,356,460,647 | 913,938,318 |
| Canadian Tourism Commission | 115,967,712 | 125,027,800 | 125,027,800 | 93,365,772 |
| Canadian Transportation Accident Investigation and Safety Board | 42,977,085 | 41,123,756 | 41,123,756 | 41,516,756 |
| Canadian Transportation Agency | 58,705,513 | 57,088,618 | 57,056,418 | 35,702,168 |
| Civilian Review and Complaints Commission for the Royal Canadian Mounted Police | 16,206,050 | 16,864,282 | 17,301,457 | 29,229,106 |
| Communications Security Establishment | 1,088,532,260 | 1,220,576,186 | 1,660,204,059 | 2,007,168,706 |
| Copyright Board | 5,073,306 | 4,730,579 | 4,730,579 | 4,774,176 |
| Correctional Service of Canada | 3,600,517,417 | 3,862,529,485 | 4,017,752,500 | 4,000,574,185 |
| Courts Administration Service | 135,721,307 | 208,740,525 | 214,883,067 | 188,741,693 |
| Department for Women and Gender Equality | 368,962,160 | 407,142,146 | 407,142,146 | 414,566,238 |
| Department of Agriculture and Agri-Food | 4,030,500,570 | 3,935,670,445 | 4,086,922,485 | 3,677,569,159 |
| Department of Canadian Heritage | 2,140,649,974 | 2,095,587,968 | 2,219,457,260 | 1,857,662,321 |
| Department of Citizenship and Immigration | 6,508,539,896 | 5,174,027,652 | 5,972,887,724 | 4,416,881,617 |
| Department of Crown-Indigenous Relations and Northern Affairs | 14,249,650,919 | 13,040,301,182 | 14,564,543,859 | 11,868,639,770 |
| Department of Employment and Social Development | 98,907,619,766 | 105,733,389,940 | 104,509,368,452 | 110,178,197,947 |
| Department of Finance | 143,259,846,686 | 149,839,931,447 | 149,738,991,225 | 158,271,364,374 |
| Department of Fisheries and Oceans | 5,215,031,054 | 6,052,547,178 | 6,206,618,825 | 1,885,760,141 |
| Department of Foreign Affairs, Trade and Development | 9,044,090,743 | 8,437,090,075 | 9,371,708,678 | 7,224,120,822 |
| Department of Health | 8,749,465,180 | 10,625,357,753 | 12,318,353,257 | 10,978,991,599 |
| Department of Housing, Infrastructure and Communities | 7,351,328,354 | 9,084,332,795 | 9,096,924,311 | 10,452,471,061 |
| Department of Indigenous Services | 26,482,739,882 | 25,321,435,316 | 27,132,497,570 | 24,095,181,910 |
| Department of Industry | 4,843,459,888 | 8,591,437,915 | 8,769,398,937 | 8,843,046,848 |
| Department of Justice | 1,350,941,125 | 1,170,109,298 | 1,272,408,472 | 1,173,735,531 |
| Department of National Defence | 33,924,795,251 | 35,665,011,698 | 45,429,911,426 | 50,689,069,701 |
| Department of Natural Resources | 4,419,629,198 | 5,132,577,391 | 5,157,575,815 | 4,878,808,102 |
| Department of Public Safety and Emergency Preparedness | 1,340,817,593 | 2,162,988,694 | 2,210,797,655 | 2,252,844,028 |
| Department of Public Works and Government Services | 5,451,590,462 | 7,262,901,604 | 7,316,956,319 | 5,929,171,521 |
| Department of the Environment | 2,965,768,499 | 3,127,271,128 | 3,134,059,661 | 1,711,705,773 |
| Department of Transport | 3,621,009,429 | 3,176,936,463 | 3,288,456,562 | 3,940,442,707 |
| Department of Veterans Affairs | 7,630,043,185 | 7,830,735,401 | 8,145,362,279 | 8,171,287,460 |
| Department of Western Economic Diversification | 362,694,148 | 278,535,562 | 431,763,581 | 334,683,876 |
| Economic Development Agency of Canada for the Regions of Quebec | 337,630,440 | 331,229,323 | 422,697,101 | 415,837,510 |
| Federal Economic Development Agency for Northern Ontario | 64,063,131 | 71,804,491 | 101,437,368 | 83,686,329 |
| Federal Economic Development Agency for Southern Ontario | 258,595,785 | 267,831,501 | 405,123,893 | 389,707,534 |
| Financial Transactions and Reports Analysis Centre of Canada | 101,439,027 | 108,984,518 | 125,890,847 | 135,396,626 |
| House of Commons | 644,102,282 | 656,529,409 | 684,269,575 | 669,014,684 |
| Immigration and Refugee Board | 352,875,031 | 345,397,322 | 345,207,822 | 344,133,766 |
| Impact Assessment Agency of Canada | 104,787,243 | 115,435,790 | 115,435,790 | 109,484,984 |
| International Development Research Centre | 160,270,169 | 159,359,769 | 167,359,769 | 139,273,031 |
| International Joint Commission (Canadian Section) | 8,874,904 | 7,464,493 | 11,314,483 | 8,395,715 |
| Invest in Canada Hub | 32,743,554 | 32,755,156 | 32,755,156 | 29,860,156 |
| Law Commission of Canada | 4,040,229 | 3,894,054 | 3,894,054 | 3,419,602 |
| Leaders' Debates Commission | 669,229 | 3,522,889 | 3,522,889 | 3,030,623 |
| Library and Archives of Canada | 212,373,163 | 208,150,119 | 208,125,066 | 184,597,263 |
| Library of Parliament | 62,079,434 | 67,634,346 | 67,634,346 | 69,487,195 |
| Marine Atlantic Inc. | 194,973,753 | 182,531,084 | 221,111,587 | 133,391,174 |
| Military Grievances External Review Committee | 8,403,193 | 8,511,433 | 8,511,433 | 8,414,821 |
| Military Police Complaints Commission | 5,776,668 | 5,877,270 | 6,127,270 | 6,242,645 |
| Miscarriage of Justice Review Commission | 0 | 0 | 139,789 | 9,349,976 |
| National Arts Centre Corporation | 59,524,537 | 57,122,713 | 57,772,713 | 56,681,299 |
| National Capital Commission | 150,820,480 | 179,777,651 | 198,692,651 | 161,956,281 |
| National Film Board | 82,474,995 | 73,272,888 | 78,139,888 | 72,476,403 |
| National Gallery of Canada | 50,020,493 | 48,424,493 | 50,580,493 | 48,831,313 |
| National Museum of Science and Technology | 38,440,940 | 40,472,693 | 41,242,693 | 41,029,594 |
| National Research Council of Canada | 1,708,014,071 | 1,762,178,965 | 1,957,826,192 | 1,915,140,152 |
| National Security and Intelligence Review Agency Secretariat | 18,839,499 | 19,604,782 | 19,591,882 | 18,438,436 |
| Natural Sciences and Engineering Research Council | 1,468,578,249 | 1,506,621,011 | 1,512,929,242 | 1,616,770,624 |
| Northern Pipeline Agency | 400,246 | 567,540 | 567,540 | 569,520 |
| Office of Infrastructure of Canada | 617,549,899 | 0 | 0 | 0 |
| Office of the Auditor General | 132,403,257 | 136,240,285 | 134,231,056 | 136,428,682 |
| Office of the Chief Electoral Officer | 313,279,692 | 691,627,656 | 691,627,656 | 274,171,951 |
| Office of the Commissioner for Federal Judicial Affairs | 804,198,460 | 846,957,744 | 846,957,744 | 930,623,440 |
| Office of the Commissioner of Lobbying | 6,090,124 | 6,081,241 | 6,081,241 | 6,146,261 |
| Office of the Commissioner of Official Languages | 26,148,095 | 26,701,150 | 26,687,450 | 27,033,917 |
| Office of the Conflict of Interest and Ethics Commissioner | 8,532,829 | 9,164,919 | 9,164,919 | 9,391,804 |
| Office of the Correctional Investigator of Canada | 6,919,489 | 8,063,518 | 8,063,518 | 7,682,095 |
| Office of the Director of Public Prosecutions | 254,250,062 | 227,301,597 | 234,529,599 | 229,440,707 |
| Office of the Governor General's Secretary | 29,630,609 | 25,960,068 | 25,960,068 | 26,276,025 |
| Office of the Intelligence Commissioner | 2,059,410 | 2,635,580 | 2,635,580 | 2,650,617 |
| Office of the Parliamentary Budget Officer | 6,650,298 | 8,491,923 | 8,491,923 | 8,160,981 |
| Office of the Public Sector Integrity Commissioner | 6,764,763 | 7,928,224 | 7,928,224 | 8,077,875 |
| Office of the Senate Ethics Officer | 1,104,690 | 1,652,182 | 1,652,182 | 1,689,890 |
| Office of the Superintendent of Financial Institutions | 312,927,229 | 358,248,892 | 358,248,892 | 382,073,124 |
| Offices of the Information and Privacy Commissioners of Canada | 55,017,129 | 56,175,110 | 56,175,110 | 55,531,104 |
| Pacific Economic Development Agency of Canada | 136,548,632 | 140,291,293 | 214,553,162 | 180,582,915 |
| Parc Downsview Park Inc. | 0 | 1 | 1 | 0 |
| Parks Canada Agency | 1,368,745,848 | 1,267,895,970 | 1,375,855,371 | 1,293,436,573 |
| Parliamentary Protective Service | 107,824,767 | 119,637,312 | 119,637,312 | 120,950,801 |
| Parole Board of Canada | 76,929,830 | 72,447,663 | 72,447,663 | 71,571,278 |
| Patented Medicine Prices Review Board | 13,687,100 | 18,128,932 | 18,128,932 | 17,212,192 |
| Privy Council Office | 251,744,189 | 278,201,513 | 285,155,618 | 252,265,293 |
| Public Health Agency of Canada | 1,534,914,270 | 1,826,491,705 | 1,895,022,524 | 1,527,423,768 |
| Public Service Commission | 100,126,006 | 103,213,573 | 103,351,973 | 100,257,842 |
| Registrar of the Supreme Court of Canada | 51,321,994 | 50,015,522 | 50,015,522 | 52,430,167 |
| Royal Canadian Mounted Police | 5,744,371,891 | 6,076,417,678 | 6,319,123,465 | 6,286,720,991 |
| Royal Canadian Mounted Police External Review Committee | 6,688,499 | 6,774,073 | 6,774,073 | 6,835,690 |
| Secretariat of the National Security and Intelligence Committee of Parliamentarians | 3,093,354 | 3,760,374 | 3,760,374 | 3,543,816 |
| Senate | 129,939,835 | 139,258,436 | 139,258,436 | 141,409,806 |
| Shared Services Canada | 2,617,013,300 | 2,490,133,957 | 2,550,112,827 | 2,361,524,776 |
| Social Sciences and Humanities Research Council | 1,297,267,958 | 1,328,398,028 | 1,328,508,183 | 1,408,418,670 |
| Standards Council of Canada | 25,591,119 | 26,059,253 | 26,184,253 | 18,912,125 |
| Statistics Canada | 734,272,654 | 827,908,530 | 827,042,672 | 1,056,027,729 |
| Telefilm Canada | 158,302,331 | 162,955,591 | 165,055,591 | 111,632,291 |
| The Federal Bridge Corporation Limited | 17,863,915 | 0 | 1,000,000 | 0 |
| The Jacques-Cartier and Champlain Bridges Inc. | 189,641,990 | 295,761,948 | 292,032,157 | 263,313,989 |
| The National Battlefields Commission | 18,928,380 | 19,243,354 | 27,632,094 | 16,662,344 |
| Treasury Board Secretariat | 11,036,272,973 | 9,801,539,394 | 11,912,923,273 | 11,835,071,239 |
| Veterans Review and Appeal Board | 21,260,607 | 23,073,258 | 23,073,258 | 23,079,330 |
| VIA HFR - VIA TGF Inc. | 69,825,000 | 597,022,518 | 597,022,518 | 710,159,448 |
| VIA Rail Canada Inc. | 878,574,403 | 1,337,761,231 | 2,315,124,045 | 1,152,590,245 |
| Windsor-Detroit Bridge Authority | 944,189,291 | 343,086,058 | 450,116,619 | 223,215,674 |
| Total Budgetary | 473,792,988,107 | 486,891,515,147 | 510,683,598,690 | 502,830,737,329 |
| Non-budgetary | ||||
| Canada Mortgage and Housing Corporation | -194,777,830 | -158,996,869 | -158,996,869 | -135,400,563 |
| Canadian Dairy Commission | 98,989,758 | 0 | 0 | 0 |
| Correctional Service of Canada | -220 | 0 | 0 | 0 |
| Department of Citizenship and Immigration | 70,892,642 | 0 | 0 | 0 |
| Department of Crown-Indigenous Relations and Northern Affairs | 16,589,642 | 25,903,000 | 25,903,000 | 25,903,000 |
| Department of Employment and Social Development | 2,853,061,454 | 1,227,916,527 | 2,960,361,456 | 1,756,185,666 |
| Department of Finance | 109,093,075,367 | 0 | 2,500,000,001 | 1,287,438,749 |
| Department of Foreign Affairs, Trade and Development | 215,542,256 | 78,000,000 | 98,000,000 | 0 |
| Department of Industry | -1,400,000,000 | 800,000 | 800,000 | 800,000 |
| Department of National Defence | -3,510,233 | 0 | 0 | 0 |
| Department of Public Works and Government Services | 2,880,526 | 0 | 0 | 0 |
| Total Non-budgetary | 110,752,743,362 | 1,173,622,658 | 5,426,067,588 | 2,934,926,852 |
Page Proofs
Raison d'etre
The Department of Finance Canada (the Department) is responsible for the overall stewardship of the Canadian economy. This includes preparing the annual federal budget, as well as advising the Government on economic and fiscal matters, tax and tariff policy, social measures, security issues, financial stability and Canada's international commitments.
Additional information can be found in the organization's Departmental Plan.
| 2024-25 | 2025-26 | 2026-27 | |||
|---|---|---|---|---|---|
| Expenditures | Main Estimates | Estimates to date | Main Estimates | ||
| Budgetary Voted | |||||
| 1 | Program expenditures | 146,869,835 | 354,793,866 | 521,289,733 | 147,847,710 |
| 5 | Authority for amount by way of direct payments to the International Development Association under the Bretton Woods and Related Agreements Act | 1 | 1 | 1 | |
| 10 | Authority for amount of financial assistance by way of grants to the International Bank for Reconstruction and Development's Financial Intermediary Fund pursuant to the Bretton Woods and Related Agreements Act | 1 | 1 | ||
| 15 | Authority for amount of financial assistance by way of grants to the International Bank for Reconstruction and Development for the purpose of the G7 initiative on Crisis-Resilient Financing and Debt Transparency pursuant to the Bretton Woods and Related Agreements Act | 1 | |||
| Total Voted | 146,869,835 | 354,793,868 | 521,289,736 | 147,847,711 | |
| Total Statutory | 143,112,976,851 | 149,485,137,579 | 149,217,701,489 | 158,123,516,663 | |
| Total Budgetary | 143,259,846,686 | 149,839,931,447 | 149,738,991,225 | 158,271,364,374 | |
| Non-budgetary Voted | |||||
| L20 | Authority for amount of financial assistance to the International Bank for Reconstruction and Development's Financial Intermediary Fund pursuant to the Bretton Woods and Related Agreements Act, which will be repaid by the G7 Extraordinary Revenue Acceleration (ERA) Loan Initiative | 1 | |||
| L25 | Authority to set the maximum amount payable to the International Development Association to provide financial assistance (Bretton Woods and Related Agreements Act, Section 8) | 1 | |||
| L30 | Authority for setting the maximum amount to be paid under guarantees to be issued to the European Bank for Reconstrnction and Development to provide financial assistance (European Bank for Reconstruction and Development Act, section 6) | 1 | |||
| L35 | Authority for setting the maximum amount to be paid under guarantees to be issued to the International Bank for Reconstruction and Development to provide financial assistance by way of the issuance of guarantees (Bretton Woods and Related Agreements Act, section 8) | 1 | |||
| Total Voted | 1 | 3 | |||
| Total Statutory | 109,093,075,367 | 2,500,000,000 | 1,287,438,746 | ||
| Total non-budgetary | 109.093,075,367 | 2,500,000,001 | 1,287,438,749 | ||
| Operating | Capital | Transfer Payments | Revenues and other reductions | Total | |
|---|---|---|---|---|---|
| Budgetary | |||||
Economic and Fiscal Policy |
57,410,451,489 | 100,804,921,265 | 158,215,372,754 | ||
Internal Services |
56,141,620 | (150,000) | 55,991,620 | ||
Total |
57,466,593,109 | 100,804,921,265 | (150,000) | 158,271,364,374 | |
| Non-Budgetary | |||||
Economic and Fiscal Policy |
1,287,438,749 | ||||
| Total | 1,287,438,749 | ||||
| 2024-25 Expenditures | 2025-26 Main Estimates | 2026-27 Main Estimates | |
|---|---|---|---|
| Contributions | |||
|
Indigenous Participant Funding Program
|
400,000 | 11,000,000 | 8,450,000 |
|
Contribution for made-in-Canada sustainable investment guidelines
|
4,727,000 | 2,421,843 | |
| Other Transfer Payments | |||
|
Total Statutory
|
92,617,828,792 | 96,645,549,559 | 100,794,049,422 |
| 2024-25 Expenditures | 2025-26 Estimates To Date | 2026-27 Main Estimates | |
|---|---|---|---|
| Budgetary | |||
|
Canada Health Transfer (Part V.1 - Federal-Provincial Fiscal Arrangements Act)
|
52,070,383,303 | 54,684,720,000 | 57,418,956,000 |
|
Interest on Unmatured Debt (Financial Administration Act)
|
42,185,287,373 | 43,866,000,000 | 48,586,000,000 |
|
Fiscal Equalization (Part I - Federal-Provincial Fiscal Arrangements Act)
|
25,252,833,000 | 26,169,704,000 | 27,160,323,000 |
|
Canada Social Transfer (Part V.l - Federal-Provincial Fiscal Arrangements Act)
|
16,908,791,000 | 17,416,055,000 | 17,938,537,000 |
|
Territorial Financing (Part I. l - Federal-Provincial Fiscal Arrangements Act)
|
5,158,964,752 | 5,488,889,341 | 5,843,699,311 |
|
Other Interest Costs
|
5,809,858,769 | 5,194,000,000 | 5,149,000,000 |
|
Payments to the Canada Infrastructure Bank pursuant to section 23 of the Canada Infrastructure Bank Act
|
2,363,429,306 | 3,480,230,000 | 3,495,629,000 |
|
Payments to international Development Association (Bretton Woods and Related Agreements Act)
|
486,916,000 | 486,916,000 | 304,042,000 |
|
Payment to Newfoundland and Labrador related to the Hibernia Dividend Backed Annuity Agreement (Section 200 - Budget Implementation Act, 2021, No. 1)
|
184,903,516 | 232,872,000 | 218,414,000 |
|
Debt payments on behalf of poor countries to International Organizations pursuant to section 18( I) of the Economic Recovery Act
|
51,535,479 | 88,222,012 | 99,261,166 |
|
Purchase of Domestic Coinage (Royal Canadian Mint Act)
|
80,608,672 | 78,000,000 | 80,000,000 |
|
Statutory Subsidies (Constitution Acts, 1867-1982, and Other Statutory Authorities)
|
44,920,116 | 44,920,116 | 44,933,125 |
|
Contributions to employee benefit plans
|
17,465,775 | 18,255,720 | 18,732,241 |
|
Payments to the International Bank for Reconstruction and Development for the G7 initiative on Crisis-Resilient Financing and Debt Transparency (Bretton Woods and Related Agreements Act, subsection 8( I))
|
5,000,000 | 5,000,000 | |
|
Minister's salary and motor vehicle allowance (Salaries Act and Parliament of Canada Act)
|
97,738 | 102,300 | 106,000 |
|
Youth Allowances Recovery (Federal-Provincial Fiscal Revision Act, 1964)
|
(1,358,486,622) | (1,453,305,000) | (1,488,675,180) |
|
Alternative Payments for Standing Programs (Part VI - Federal-Provincial Fiscal Arrangements Act)
|
(6,183,144,000) | (6,582,880,000) | (6,750,441,000) |
| Non-budgetary | |||
|
Financial assistance to the International Development Association (Breton Woods and Related Agreements Act, Section 8)
|
1,287,438,746 | ||
2026-27 Estimates Annex
Items for inclusion in the Proposed Schedule 1 to the Appropriation Bill (for the financial year ending March 31, 2027)
Unless specifically identified under the Changes in 2026-27 Main Estimates section, all vote wordings have been provided in earlier appropriation acts.
| Vote No. | Items | Amount |
|---|---|---|
| 1 | Program expenditures
|
147,847,710 |
| 5 |
|
1 |
| L25 |
|
1 |
| L30 |
|
1 |
| L35 |
|
1 |
| Total | 147,847,714 |
Budgetary Expenditures by Standard Object
This table shows the forecast of total expenditures by Standard Object, which includes the types of goods or services to be acquired, or the transfer payments to be made and the revenues to be credited to the vote.
Definitions of standard objects available.
Interest payments relating to capital leases are included under "Public debt charges". These payments are voted expenditures and are not included under the "Public Debt11 heading on the Composition of Estimates and Expenditures table.
| Personnel | Transportation and communications | Information | Professional and special services | Rentals | Purchased repair and maintenance | Utilities, materials and supplies | Acquisition of land, buildings and works | Acquisition of machinery and equipment | Transfer payments | Public debt charges | Other subsidies and payments | Less: Revenues and other reductions | Total | |
|---|---|---|---|---|---|---|---|---|---|---|---|---|---|---|
| 1 | 2 | 3 | 4 | 5 | 6 | 7 | 8 | 9 | 10 | 11 | 12 | |||
| Department of Finance | 133,059,221 | 2,110,658 | 2,650,096 | 14,617,900 | 1,743,170 | 305,807 | 80,114,524 | … | 1,321,504 | 100,804,921,265 | 53,735,000,000 | 3,495,670,229 | 150,000 | 158,271,364,374 |
| Total | 133,059,221 | 2,110,658 | 2,650,096 | 14,617,900 | 1,743,170 | 305,807 | 80,114,524 | … | 1,321,504 | 100,804,921,265 | 53,735,000,000 | 3,495,670,229 | 150,000 | 158,271,364,374 |
| 2024-25 Expenditures | 2025-26 Estimates To Date | 2026-27 Main Estimates | |
|---|---|---|---|
| Budgetary - Department of Finance | |||
|
Canada Health Transfer (Part V.l - Federal-Provincial Fiscal Arrangements Act)
|
52,070,383,303 | 54,684,720,000 | 57,418,956,000 |
|
Interest on Unmatured Debt (Financial Administration Act)
|
42,185,287,373 | 43,866,000,000 | 48,586,000,000 |
|
Fiscal Equalization (Part I - Federal-Provincial Fiscal Arrangements Act)
|
25,252,833,000 | 26,169,704,000 | 27,160,323,000 |
|
Canada Social Transfer (Part V. l - Federal-Provincial Fiscal Arrangements Act)
|
16,908,791,000 | 17,416,055,000 | 17,938,537,000 |
|
Territorial Financing (Part 1.1 - Federal-Provincial Fiscal Arrangements Act)
|
5,158,964,752 | 5,488,889,341 | 5,843,699,311 |
|
Other Interest Costs
|
5,809,858,769 | 5,194,000,000 | 5,149,000,000 |
|
Payments to the Canada Infrastructure Bank pursuant to section 23 of the Canada Infrastructure Bank Act
|
2,363,429,306 | 3,480,230,000 | 3,495,629,000 |
|
Payments to International Development Association (Bretton Woods and Related Agreements Act)
|
486,916,000 | 486,916,000 | 304,042,000 |
|
Payment to Newfoundland and Labrador related to the Hibernia Dividend
|
184,903,516 | 232,872,000 | 218,414,000 |
|
Backed Annuity Agreement (Section 200 - Budget Implementation Act, 202 I, No. 1)
|
|||
|
Debt payments on behalf of poor countries to International Organizations pursuant to section 18(1) of the Economic Recovery Act
|
51,535,479 | 88,222,012 | 99,261,166 |
|
Purchase of Domestic Coinage (Royal Canadian Mint Act)
|
80,608,672 | 78,000,000 | 80,000,000 |
|
Statutory Subsidies (Constitution Acts, 1867-1982, and Other Statutory Authorities)
|
44,920,116 | 44,920,116 | 44,933,125 |
|
Contributions to employee benefit plans
|
17,465,775 | 18,255,720 | 18,732,241 |
|
Payments to the International Bank for Reconstruction and Development for the G7 initiative on Crisis-Resilient Financing and Debt Transparency (Bretton Woods and Related Agreements Act, subsection 8(1))
|
5,000,000 | 5,000,000 | |
|
Minister's salary and motor vehicle allowance (Salaries Act and Parliament of Canada Act)
|
97,738 | 102,300 | 106,000 |
|
Payments to International Bank for Reconstruction and Development - Financial Intermediary Fund for Ukraine (Bretton Woods and Related Agreements Act, subsection 8(1))
|
|||
|
Other Statutory items Iisled in the Public Accounts of Canada
|
38,612,674 | ||
|
Youth Allowances Recovery (Federal-Provincial Fiscal Revision Act, 1964)
|
(1,358,486,622) | (1,453,305,000) | (1,488,675,180) |
|
Alternative Payments for Standing Programs (Part VI - Federal-Provincial Fiscal Arrangements Act)
|
(6,183,144,000) | (6,582,880,000) | (6,750,441,000) |
|
Total budgetary
|
143,112,976,851 | 149,217,701,489 | 158,123,516,663 |
| Non-budgetary - Department of Finance | |||
|
Financial assistance to the International Development Association (Bretton Woods and Related Agreements Act, Section 8)
|
1,287,438,746 | ||
|
Other Statutory items listed in the Public Accounts of Canada
|
104,108,828,071 | ||
|
Financial Assistance to Ukraine through IMF Administered Account (Bretton Woods and Related Agreements Act, Section 8.3)
|
400,000,000 | 2,300,000,000 | |
|
Payment for the acquisition of shares in the Canada Growth Fund pursuant to 3,000,000,000 the Fall Economic Statement Implementation Act, 2022 as amended by Budget Implementation Act, 2023, No. I
|
3,000,000,000 | ||
|
Loan to the International Monetary Fund's Poverty Reduction and Growth Trust (Bretton Woods and Related Agreements Act, Section 8.1(1))
|
1,299,445,896 | ||
|
Investment in Hybrid Capital issued by the International Bank for Reconstruction and Development (Bretton Woods and Related Agreements Act, Section 8)
|
284,801,400 | ||
|
Payments to International Bank for Reconstruction and Development - Financial Intermediary Fund for Ukraine (Bretton Woods and Related Agreements Act, subsection 8(1))
|
200,000,000 | ||
|
Total non-budgetary
|
109,093,075,367 | 2,500,000,000 | 1,287,438,746 |
| 2026-27 Main Estimates | ||||||||
|---|---|---|---|---|---|---|---|---|
| 2024-25 Expenditures | 2025-26 Main Estimates | 2026-27 Main Estimates | Operating | Capital | Transfer Payments | Revenues and other reductions | Total | |
| Budgetary | ||||||||
Economic and Fiscal Policy |
143,202,516,447 | 149,785,347,525 | … | 57,410,451,489 | … | 100,804,921,265 | … | 158,215,372,754 |
Internal Services |
57,330,239 | 54,583,922 | … | 56,141,620 | … | … | (150,000) | 55,991,620 |
Total |
143,259,846,686 | 149,839,931,447 | … | 57,466,593,109 | … | 100,804,921,265 | (150,000) | 158,271,364,374 |
| Non-Budgetary | ||||||||
Economic and Fiscal Policy |
109,093,075,367 | … | 1,287,438,749 | … | … | … | … | … |
Total |
109,093,075,367 | … | 1,287,438,749 | … | … | … | … | … |
Interim Supply Requirements (Department of Finance)
| Vote No. | Vote wording and explanation(s) of Additional Twelfths | Total Main Estimates | Amount Granted |
|---|---|---|---|
| 1 | Program expenditures
An additional one twelfth is required beyond the normal three-twelfths Reason: Reason: The additional twelfth is also required because the department's professional services costs are not incurred evenly throughout the year. In accordance with the MOU with Justice Canada, the department needs to pay 50% of the legal services costs at the beginning of the fiscal year. |
147,847,710 | 49,282,570 |
| 5 | Under subsection 8(2) of the Bretton Woods and Related Agreements Act, the amount of financial assistance provided by the Minister of Finance by way of direct payments to the International Development Association is not to exceed $304,042,000 in Canadian dollars in the fiscal year 2026--27 No additional twelfths beyond the normal three-twelfths |
1 | 1 |
| L25 | Pursuant to subsection 8(2) of the Bretton Woods and Related Agreements Act, the amount of financial assistance provided by the Minister of Finance by way of loans to the International Development Association is not to exceed $916,073,000 in United States dollars in the fiscal year 2026-27 No additional twelfths beyond the normal three-twelfths |
1 | 1 |
| L30 | Under subsection 6(3) of the European Bank for Reconstruction and Development Agreement Act, the amount of financial assistance provided by the Minister of Finance to the European Bank for Reconstruction and Development by way of the issuance of guarantees for loans by the Bank to Naftogaz, a Ukrainian state-owned company, is not to exceed €200,000,000 over the period of the fiscal years 2026-27 to 2030-31 No additional twelfths beyond the normal three-twelfths |
1 | 1 |
| L35 | For the purposes of subsection 8(2) of the Bretton Woods and Related Agreements Act, the amount of financial assistance provided by the Minister of Finance to the International Bank for Reconstruction and Development by way of the issuance of guarantees for loans by that Bank to the Government of Ukraine is not to exceed US$1,000,000,000 in respect of the period of the fiscal years 2026-27 to 2051-52 No additional twelfths beyond the normal three-twelfths |
1 | 1 |
Explanation of Changes Main Estimates 2026-27
1. Voted – Budgetary Expenditures
Voted budgetary expenditures include the department's program expenditures and one-dollar votes.
| (A) | (B) | (C) | (D = C - A) | (E = C - B) | ||
|---|---|---|---|---|---|---|
| 2025-26 Main Estimates |
2025-26 Estimates to Date |
2026-27 Main Estimates |
2026-27 to 2025-26 Main Estimates |
2026-27 Main Estimates to 2025-26 Estimates to Date |
||
| 1 | Program Expenditures | 354,793,866 | 521,289,733 | 147,847,710 | (206,946,156) | (373,442,023) |
| 5 | Authority for amount by way of direct payments to the International Development Association pursuant to Bretton Woods and Related Agreements Act | 1 | 1 | 1 | - | - |
| 10 | Authority for amount of financial assistance by way of grants to the International Bank for Reconstruction and Development's Financial Intermediary Fund pursuant to the Bretton Woods and Related Agreements Act | 1 | 1 | - | (1) | (1) |
| 15 | Authority for amount of financial assistance by way of grants to the International Bank for Reconstruction and Development for the purpose of the G7 initiative on Crisis-Reslient Financing and Debt Transparency pusruant to the Bretton Woods and Related Agreements Act | 1 | - | - | (1) | |
| Total Voted - Program Expenditures | 354,793,868 | 521,289,736 | 147,847,711 | (206,946,157) | (373,442,024) |
Program Expenditures
The 2025-26 Main Estimates included $161.0 million in authorities for personnel, operating and contribution expenditures. They also included $193.8 million for the planned payment for the Nonrecurring conditional transfer of the 2023 Hibernia Net Profits Interest and Incidental Net Profits Interest (NPI) to Newfoundland and Labrador.
The 2025-26 Supplementary Estimates (B) added $166.6 million in authorities for the planned 2024 NPI payment and a transfer of $0.1 million to the Treasury Board Secretariat for the Inclusion, Diversity, Equity and Anti-Racism Secretariat.
The 2026-27 Main Estimates include $147.8 million in authorities for personnel, operating and contribution expenditures.
Explanations of variances compared to 2025-26 authorities are provided in Tables 31 and 32.
One-dollar Votes
The one-dollar vote is a mechanism used in the Estimates process to obtain Parliament's approval for changes to existing spending authorities, rather than to seek additional funding. The nominal amount of $1 is included solely to secure parliamentary authority, as no actual expenditure will be charged to the voted appropriation. Details of these changes are explained in the payment variance explanation in the statutory section below (Items H, N, and O).
The following tables outline the year-over-year changes since the 2025-26 Main Estimates.
Increases in voted items are generally a result of additional funding received for initiatives or programs that were approved via a Treasury Board submission. Decreases in voted items are generally a result of the expiration of time limited funding for specific initiatives or programs.
| Items | Amount |
|---|---|
| Sustaining the Major Projects Office and Supporting Indigenous Consultation and Participation | 1.4 |
| Collective bargaining | 0.9 |
| Funding to improve the ability to address aggressive tax planning schemes | 0.1 |
| Nonrecurring conditional transfer of the 2023 Hibernia Net Profits Interest and Incidental Net Profits Interest to Newfoundland and Labrador | (193.8) |
| Comprehensive Expenditure Review | (4.1) |
| Funding for Indigenous engagement on Trans Mountain | (2.6) |
| Funding for Canada's G7 Presidency | (2.6) |
| Contribution for made-in-Canada sustainable investment guidelines | (2.3) |
| Refocusing Government Spending | (0.9) |
| Funding for the design and development of the Canada Financial Crimes Agency | (0.6) |
| Funding for the development of the Consumer-Driven Banking Framework | (0.5) |
| Reprofile - Funding for the national security components of the Retail Payment Activities Act | (0.5) |
| Funding for the Climate Lens initiative | (0.5) |
| Funding for agreements on Indigenous economic participation in the Trans Mountain Expansion project | (0.3) |
| Funding to support tax competitiveness monitoring | (0.3) |
| Funding to implement clean economy investment tax credits | (0.2) |
| Reprofile - Natural Disaster Protection Gaps | (0.1) |
| Variance 2026-27 Main Estimates to 2025-26 Main Estimates | (206.9) |
| Items (Included in the 2025-26 Supplementary Estimates B) |
Amount |
|---|---|
| Variance from Main Estimates as per Table 30 | (206.9) |
| Transfer from Finance to the Treasury Board Secretariat for the Inclusion, Diversity, Equity and Anti-Racism Secretariat | 0.1 |
| Nonrecurring conditional transfer of the 2024 Hibernia Net Profits Interest and Incidental Net Profits Interest to Newfoundland and Labrador | (166.6) |
| Variance Mains to Estimates to Date | (373.4) |
2. Budgetary – Statutory
| (A) | (B) | ('C) | (D = C - A) | (E = C - B) | ||
|---|---|---|---|---|---|---|
| 2025-26 Main Estimates |
2025-26 Estimates to Date |
2026-27 Main Estimates |
2026-27 to 2025-26 Main Estimates |
2026-27 Main Estimates to 2025-26 Estimates to Date |
||
| Budgetary Statutory | ||||||
| A | Interest on Unmatured Debt | 43,866.0 | 43,866.0 | 48,586.0 | 4,720.0 | 4,720.0 |
| B | Canada Health Transfer | 54,684.7 | 54,684.7 | 57,419.0 | 2,734.3 | 2,734.3 |
| C | Fiscal Equalization | 26,169.7 | 26,169.7 | 27,160.3 | 990.6 | 990.6 |
| D | Canada Social Transfer | 17,416.1 | 17,416.1 | 17,938.5 | 522.4 | 522.4 |
| E | Territorial Financing | 5,488.9 | 5,488.9 | 5,843.7 | 354.8 | 354.8 |
| F | Payments to the Canada Infrastructure Bank | 3,480.2 | 3,480.2 | 3,495.6 | 15.4 | 15.4 |
| G | Debt payments on behalf of poor countries to International Organizations | 88.2 | 88.2 | 99.3 | 11.1 | 11.1 |
| H | Payments to International Bank for Reconstruction and Development for the G7 initiative on Crisis-Resilient Financing and Debt Transparency | - | 5.0 | 5.0 | 5.0 | - |
| I | Contributions to employee benefit plans | 18.3 | 18.3 | 18.8 | 0.5 | 0.5 |
| Statutory Subsidies | 44.9 | 44.9 | 44.9 | - | - | |
| Minister of Finance and Intergovernmental Affairs – Salary and motor car allowance | 0.1 | 0.1 | 0.1 | - | - | |
| J | Purchase of Domestic Coinage | 81.0 | 78.0 | 80.0 | (1.0) | 2.0 |
| K | Hibernia Dividend Backed Annuity Agreement | 232.9 | 232.9 | 218.4 | (14.5) | (14.5) |
| L | Other Interest Costs | 5,194.0 | 5,194.0 | 5,149.0 | (45.0) | (45.0) |
| M | Youth Allowances Recovery | (1,442.4) | (1,453.3) | (1,488.7) | (46.3) | (35.4) |
| N | Payments to International Development Association | 486.9 | 486.9 | 304.0 | (182.9) | (182.9) |
| O | Payments to International Bank for Reconstruction and Development Financial Intermediairies Fund for Ukraine | 200.0 | - | - | (200.0) | - |
| P | Alternative Payments for Standing Programs | (6,524.3) | (6,582.9) | (6,750.4) | (226.1) | (167.5) |
| Total Budgetary Statutory | 149,485.2 | 149,217.7 | 158,123.5 | 8,638.3 | 8,905.8 | |
Totals may not add due to rounding |
||||||
The increase in budgetary statutory estimates from the 2025-26 Main Estimates to the 2026-27 Main Estimates is due to the following factors:
A. Interest on Unmatured Debt – an increase of $4,720 million
- Interest on Unmatured Debt are payments that will be made over the course of the year on the Government's market debt (i.e., Government of Canada bonds, Treasury Bills and retail debt). The interest recorded is dependent upon the level and composition of unmatured debt, the effective interest rates applicable and the cost of servicing the debt.
- An increase of $4,720.0 million, reflecting the revised projections as noted in Budget 2025 compared to the 2024 Fall Economic Statement.
B. Canada Health Transfer – an increase of $2,734.3 million
- The Canada Health Transfer is a federal transfer provided to provinces and territories in support of health care and increases year-to-year based on a three-year moving average of nominal gross domestic product growth, with funding guaranteed to increase by at least 3 per cent per year.
- The increase of $2,734.3 million represents the 5 per cent minimum growth rate guaranteed by the federal government in February 2023.
C. Fiscal Equalization – an increase of $990.6 million
- The Fiscal Equalization program ensures that less prosperous provinces have sufficient revenue to provide reasonably comparable levels of public services at comparable levels of taxation, thereby reducing fiscal disparities among provinces. Equalization payments increase from year-to-year based on a three-year moving average of nominal GDP growth.
- The increase of $990.6 million reflects the 3.8 per cent gross domestic product-based escalator being applied to the 2025-26 level.
D. Canada Social Transfer – an increase of $522.4 million
- The Canada Social Transfer is the federal transfer provided to provinces and territories in support of social assistance and social services, post-secondary education, and programs for children.
- The $522.4 million increase is a result of the legislated 3 per cent annual growth rate.
E. Territorial Financing – an increase of $354.8 million
- The Territorial Formula Financing program enables territorial governments to provide their residents with programs and services that are comparable to those provided in the rest of Canada, at comparable levels of taxation, taking into account the higher costs of services and unique circumstances of the North.
- The $354.8 million increase reflects the incorporation of new and updated data into the program's legislated formula.
F. Canada Infrastructure Bank – an increase of $15.4 million
- Through the Canada Infrastructure Bank (CIB), the federal government has committed $45 billion to support infrastructure projects across the country. The CIB will focus on priority investment sectors including transit, green infrastructure, clean power, broadband access, and trade and transportation.
- The $15.4 million increase reflects payments to the CIB to carry out approved activities as outlined in their 2024-25 to 2028-29 Corporate Plan.
G. Debt Payments on behalf of poor countries to International Organizations – an increase of $11.1 million
- At the G8 Summit in Gleneagles in 2005, donors, including Canada, agreed to have international financial institutions cancel 100 per cent of the debts owed to them by eligible poor countries to free up resources to help such countries achieve Millennium Development Goals. To cover its share of the costs, Canada committed a total of $2.5 billion over the 50-year lifespan of this initiative. Canada's first payment for this initiative was made in fiscal year 2005-06. Annual payments will continue until 2054.
- The increase of $11.1 million is in line with the revised payment schedule agreed to by the Government of Canada and the World Bank.
H. Payments to the International Bank for Reconstruction and Development for the G7 initiative on crisis-resilient financing and debt transparency – an increase of $5 million
- As part of the G7 Finance track, the funds will support a new, time-limited initiative to help increase adoption of crisis-resilient financing instrument, and a complementary measure to improve debt transparency and more consistent disclosure of debt data through capacity building both implemented through World Bank trust funds.
- The inclusion in the 2025-26 Supplementary Estimates (B) of the one-dollar vote item was to seek parliamentary approval as per subsection 8(2) of the Bretton Woods and Related Agreement Act.
- The total commitment is $14 million over three years. Of this amount, $5 million was included in the 2025–26 Supplementary Estimates (B); $5 million is included in the 2026–27 Main Estimates; and the remaining $4 million is committed for 2027–28.
I. Contribution to Employee Benefit Plans – an increase of $0.5 million
- The amount for Contribution to Employee Benefit Plans is set by the Treasury Board Secretariat. The 2026-27 percentage is 16.4 per cent of salary funding and represents the government's contribution to various employee benefit plans.
- The increase of $0.5 million is due to a higher percentage being applied than the prior year and increases in salary funding included in the 2026-27 Main Estimates.
J. Purchase of Domestic Coinage – a decrease of $1 million
- The Department of Finance and the Royal Canadian Mint have a Memorandum of Understanding for the Mint to produce and manage the distribution of domestic coinage on behalf of the Department. The Department of Finance reimburses the Royal Canadian Mint for the cost of coinage production and distribution.
- The decrease of $1 million reflects the Mint's revised forecast for domestic coin sales.
- Forecasted expenditures are refined through Supplementary Estimates as funding requirements and projections are updated.
K. Hibernia Dividend Backed Annuity Agreement – a decrease of $14.5 million
- The Hibernia Dividend Backed Annuity Agreement is an agreement between Canada and Newfoundland and Labrador entered into in 2019 that will provide defined, annual payments to the province between 2019 and 2056 totaling $3.3 billion. The payments were based on projected free cash flows of the Canada Hibernia Holding Corporation (CHHC), a Crown corporation that administers Canada's working interest in the Hibernia oil project, over the remaining life of the project. The province will also pay $800 million to Canada between 2045 and 2052, resulting in a net benefit of $2.5 billion to the province.
- The amount for 2026-27 agrees to the schedule of annuity payments in the Hibernia Dividend Backed Annuity Agreement.
L. Other Interest Costs – a decrease of $45 million
- Other Interest Costs represent the interest on liabilities for federal public service pension plans, deposit and trust accounts and other specified purpose accounts.
- The interest recorded is a statutory requirement and is dependent upon the level and composition of pensions and other liabilities, as well as the applicable effective interest rates.
- The decrease of $45 million reflects revised projections as provided in Budget 2025 compared to the previous amounts based on Fall Economic Statement 2024 due to updated modelling and revised interest rate assumptions of certain other specified purpose accounts.
M. Youth Allowances Recovery – an increase in recovery of $46.3 million
- The Youth Allowances Recovery is a recovery from the province of Quebec related to the discontinued Youth Allowances Program.
- Recoveries from the province of Quebec are based on personal income tax data. The $46.3 million increase in the recovery is a result of the forecasted growth of national Basic Federal Tax as calculated in October 2025.
- These amounts are estimates based on the latest available tax data and are revised during the year as updated information becomes available over time.
N. Payments to International Development Association – Decrease of $182.9 million
- The International Development Association (IDA) is the concessional financing arm of the World Bank. It provides 35–40-year interest free loans and grants to countries at risk of debt distress.
- The decrease of $182.9 million reflects an updated payment schedule agreed to by donor countries upon signing the 21st replenishment in December 2025. The contribution will be complemented by a concessional loan.
O. Payments to International Bank for Reconstruction and Development Financial Intermediaries Fund for Ukraine – a decrease of $200 million
- There was a one-time $200 million payment included in the 2025-26 Main Estimates. In the Supplementary Estimates (B), it was reclassified as a loan in the non-budgetary section of the estimates, as this contribution to the Financial Intermediary Fund for Ukraine will be repaid by the G7 Extraordinary revenue Acceleration (ERA) Loan Initiative.
- A one-dollar vote item was included in the 2025-26 Main Estimates to request parliamentary approval as per section 8(2) of the Bretton Woods and Related Agreements Act. There is no such amount for 2026-27.
P. Alternative Payments for Standing Programs – an increase in recovery of $226.1 million
- The Alternative Payments for Standing Programs is a recovery from the province of Quebec of an additional tax point transfer (13.5 points) above and beyond the tax point transfer that used to be part of the Canada Health Transfer and the Canada Social Transfer.
- In the 1960s, Quebec chose to use the federal government's contracting-out arrangements for certain federal–provincial programs. Since Quebec, like other provinces, receives its full cash entitlement under the Canada Health Transfer and Canada Social Transfer, the value of these tax points is reimbursed to the Government of Canada each year.
- The increased recovery of $226.1 million is a result of the forecasted growth of national Basic Federal Tax as calculated in October 2025.
- These amounts are estimates based on the latest available tax data and are revised during the year as updated information becomes available over time.
3 - Non-budgetary
| (A) | (B) | ('C) | (D = C - A) | (E = C - B) | |
|---|---|---|---|---|---|
| 2025-26 Main Estimates |
2025-26 Estimates to Date |
2026-27 Main Estimates |
2026-27 to 2025-26 Main Estimates |
2026-27 Main Estimates to 2025-26 Estimates to Date |
|
| Non-budgetary Voted | |||||
| Authority for amount of financial assistance to the International Bank for Reconstruction and Development's Financial Intermediary Fund pursuant to the Bretton Woods and Related Agreeements Act, which will be repaid by the G7 Extraordinary Revenue Acceleration (ERA) Loan Initiative | - | 1 | - | - | (1) |
| Auhtority to set the maximum amount payabe to the International Development Association to provide financial assistance (Bretton Woods and Related Agreements Act, Section 8) | - | - | 1 | 1 | 1 |
| Authority for setting the maximum amount to be paid under guarantees to be issued to the European Bank for Reconstruction and Development to provide financial assistance (European Bank for Reconstuction and Development Act, section 6) | - | - | 1 | 1 | 1 |
| Authority for setting the maximum amount to be paid under guarantees to be issued to the International Bank for Reconstruction and Development to provide assistance by way of the issuance of guarantees (Bretton Woods and Related Agreements Act, section 8) | - | - | 1 | 1 | 1 |
| Non-budgetary Statutory | |||||
| Financial Assistance to Ukraine through IMF Administered Account | - | 2,300,000,000 | - | - | (2,300,000,000) |
| Payments to International Bank for Reconstruction and Development Financial Intermediairies Fund for Ukraine | - | 200,000,000 | - | - | (200,000,000) |
| Financial assistance to the International Development Association | - | - | 1,287,438,746 | 1,287,438,746 | 1,287,438,746 |
| Total Non-budgetary Statutory | - | 2,500,000,000 | 1,287,438,746 | 1,287,438,746 | (1,212,561,254) |
The one-dollar vote is a mechanism used in the government's estimates process to allow the government to seek changes to spending authorities already approved by Parliament.
The 2026–27 Main Estimates include three non-budgetary one-dollar items. One relates to a payment described under item S. The remaining two items do not involve direct payments in the Estimates, as they are intended to provide financial assistance through the issuance of loan guarantees rather than through cash disbursements.
- European Bank for Reconstruction and Development (EBRD): Authorizes the Minister of Finance to issue loan guarantees of up to €200 million to support EBRD loans to Naftogaz (Ukraine) from 2026–27 to 2030–31.
- International Bank for Reconstruction and Development (IBRD): Authorizes the Minister of Finance to issue loan guarantees of up to US$1 billion to support IBRD loans to the Government of Ukraine from 2026–27 to 2051–52.
The variances in the non budgetary statutory estimates are due to the following:
Q. Financial Assistance to Ukraine through the International Monetary Fund Administered Account – Decrease of $2,300 million from Estimates to date
- This payment made in 2025-26 and presented in the Supplementary Estimates (B) for information, represents a loan contribution through the International Monetary Fund Administered Account for Ukraine and will be repaid through the G7 Extraordinary Revenue Acceleration (ERA) Loan Initiative. There is no such amount for 2026-27.
R. Payments to International Bank for Reconstruction and Development Financial Intermediaries Fund for Ukraine – Decrease of $200 million from Estimates to date
- This item relates to item N and is the reclassification of the payment to the International Bank for Reconstruction and Development's Financial Intermediary Fund for Ukraine included in the 2025-26 Supplementary Estimates (B). There is no such amount for 2026-27.
S. Financial Assistance to the International Development Association – an increase of $1,287.4 million
- As part of the 21st replenishment of the World Bank Group's International Development Association (IDA), the Government of Canada will complement its contribution to IDA with a concessional loan of up to US$916.1 million.
Program Expenditures Variance with Description
| Initiatives | Description | |||
|---|---|---|---|---|
| 2026-27 Main Estimates |
2025-26 Main Estimates |
Variance | ||
| Sustaining the Major Projects Office and Supporting Indigenous Consultation and Participation and facilitating financing Branches: Economic, Fiscal and Intergovernmental Policy, and Economic Development and Social Policy |
1,378,880 | - | 1,378,880 |
|
| Funding for collective bargaining adjustments All branches |
12,117,005 | 11,189,568 | 927,437 |
|
| Funding to improve the ability to address aggressive tax planning schemes Branch: Tax Policy |
3,014,858 | 2,926,988 | 87,870 |
|
| Transfer to the Treasury Board Secretariat for the Digital Community Management initiative Branch: Corporate Services |
(16,588) | (16,324) | (264) |
|
| Transfer to TBS re: Communications Community Office Branch: Communications and Public Affairs |
(22,500) | - | (22,500) |
|
| Permanent budget transfer from personnel to operating All branches |
243,425 | 270,000 | (26,575) |
|
| Natural Disaster Protection Gaps Branch: Financial Sector Policy |
466,693 | 531,417 | (64,724) |
|
| Funding to implement clean economy investment tax credits Branch: Tax Policy |
1,329,581 | 1,532,818 | (203,237) |
|
| Funding to support tax policy analysis and development Branch: Tax Policy |
571,698 | 893,899 | (322,201) |
|
| Funding for agreements on Indigenous economic participation in the Trans Mountain Expansion project Branch: Economic Development and Social Policy |
- | 355,017 | (355,017) |
|
| Funding for the national security components of the Retail Payment Activities Act (RPAA) Branch: Financial Sector Policy |
- | 486,000 | (486,000) |
|
| Funding for the Climate Lens initiative Branch: Economic, Fiscal and Intergovernmental Policy |
- | 487,009 | (487,009) |
|
| Funding for the development of the Consumer-Driven Banking Framework Branch: Financial Sector Policy |
1,000,060 | 1,523,970 | (523,910) |
|
| Funding for the design and development of the Canada Financial Crimes Agency Branch: Financial Sector Policy |
- | 619,809 | (619,809) |
|
| Refocusing of Government Spending All Branches |
(3,530,716) | (2,604,846) | (925,870) |
|
| Contribution for made-in-Canada sustainable investment guidelines (Contribution funding) Branch: Financial Sector Policy |
2,421,843 | 4,727,000 | (2,305,157) |
|
| Funding for Indigenous engagement on Trans Mountain (Contribution funding) Branch: Economic Development and Social Policy |
8,450,000 | 11,000,000 | (2,550,000) |
|
| Funding for Canada's G7 Presidency Branches: Communications and Public Affairs and International Affairs |
- | 2,557,067 | (2,557,067) |
|
| Comprehensive Expenditure Review All Branches |
(4,105,285) | - | (4,105,285) |
|
| Nonrecurring conditional transfer of Hibernia Net Profits Interest and Incidental Net Profits Interest to Newfoundland and Labrador (Contribution funding) Branch: Economic Development and Social Policy |
- | 193,785,718 | (193,785,718) |
|
| Total Vote 1 - Program Expenditures | 23,318,954 | 230,265,110 | (206,946,156) |
$1 Votes
- Mechanism used in the Estimates process to obtain Parliament's approval for changes to existing spending authorities, rather than to seek additional funding.
- The nominal amount of $1 is included solely to secure parliamentary authority, as no actual expenditure will be charged to the voted appropriation
| Initiatives | 2026-27 Main Estimates |
2025-26 Main Estimates |
2025-26 Supplementary Estimates (B) |
Description |
|---|---|---|---|---|
| Vote 5 - Authority for amount by way of direct payments to the International Development Association under the Bretton Woods and Related Agreements Act Branch: International Affairs |
1 | 1 | - |
|
| Vote 10 - Authority for amount of financial assistance by way of grants to the International Bank for Reconstruction and Development's Financial Intermediary Fund pursuant to the Bretton Woods and Related Agreements Act Branch: International Affairs |
- | 1 | - |
|
| Vote 15 - IN SUPPS B Authority for amount of financial assistance by way of grants to the International Bank for Reconstruction and Development for the purpose of the G7 initiative on Crisis-Resilient Financing and Debt Transparency pursuant to the Bretton Woods and Related Agreements Act Branch: International Affairs |
- | - | 1 |
|
| Non-budgetary - Voted | ||||
| L20 - International Bank for Reconstruction and Development's Financial Intermediary Fund pursuant to Authority for amount of financial assistance to the the Bretton Woods and Related Agreements Act, which will be repaid by the G7 Extraordinary Revenue Acceleration (ERA) Loan Initiative Branch: International Affairs |
- | - | 1 |
|
| L25 - Authority to set the maximum amount payable to the International Development Association to provide financial assistance (Bretton Woods and Related Agreements Act, Section 8) Branch: International Affairs |
1 | - | - |
|
| L30 - Authority for setting the maximum amount to be paid under guarantees to be issued to the European Bank for Reconstruction and Development to provide financial assistance (European Bank for Reconstruction and Development Act, section 6) Branch: International Affairs |
1 | - | - |
|
| L35 - Authority for setting the maximum amount to be paid under guarantees to be issued to the International Bank for Reconstruction and Development to provide financial assistance by way of the issuance of guarantees (Bretton Woods and Related Agreements Act, section 8) Branch: International Affairs |
1 | - | - |
|
Budgetary Statutory Expenditures with Description
| Initiatives | Branch | 2026-27 Main Estimates |
2025-26 Main Estimates |
Variance | Variation | Cost Driver |
|---|---|---|---|---|---|---|
| Interest on Unmatured Debt | Economic, Fiscal and Intergovernmental Policy Evelyn Dancer / Julie Turcotte |
48,586.00 | 43,866.00 | 4,720.00 | Increase due to revised projections noted in Budget 2025. | Private sector economists' expectations of forecasted interest rates and debt levels of the Government of Canada. |
| Canada Health Transfer | Economic, Fiscal and Intergovernmental Policy Galen Countryman |
57,419.00 | 54,684.70 | 2,734.30 | Increase reflects the 5 per cent minimum growth rate. | Payments increase year-to-year based on a three-year moving average of nominal GDP growth, with funding guaranteed to increase by at least 3 per cent per year. In February 2023, the government guaranteed a 5% increase in the CHT. |
| Fiscal Equalization | Economic, Fiscal and Intergovernmental Policy Galen Countryman |
27,160.30 | 26,169.70 | 990.60 | Increase reflects the 3.8 per cent GDP-based escalator being applied to the 2025–26 amount. | Payments increase year-to-year based on a three-year moving average of nominal GDP growth. |
| Canada Social Transfer | Economic, Fiscal and Intergovernmental Policy Galen Countryman |
17,938.50 | 17,416.10 | 522.40 | Increase reflects the 3 per cent annual increase as indicated in the Federal-Provincial Fiscal Arrangements Act. | 3 per cent escalator as legislated in the Federal-Provincial Fiscal Arrangements Act. |
| Territorial Financing | Economic, Fiscal and Intergovernmental Policy Galen Countryman |
5,843.70 | 5,488.90 | 354.80 | Increase reflects the incorporation of new and updated data for territorial expenditure requirements and revenue capacities into the program's legislated formula. | The grant paid to each territory is based on the difference between the territory's approximate expenditure needs and its ability to generate revenues (examples of eligible revenues include personal and business income, tobacco, gasoline, alcoholic beverages, miscellaneous sales taxes, property tax). |
| Payment to the Canada Infrastructure Bank | Economic Development and Social Policy Jeremy Weil |
3,495.60 | 3,480.20 | 15.40 | The increase reflects payments to the Canada Infrastructure Bank (CIB) to carry out approved activities as outlined in their 2024-25 to 2028-29 Corporate Plan. | Through the CIB, the federal government has committed $45 billion to support infrastructure projects across the country. The CIB will focus on priority investment sectors including transit, green infrastructure, clean power, broadband access, and trade and transportation. |
| Debt payments on behalf of poor countries to International Organizations | International Affairs Julie Trépanier |
99.30 | 88.20 | 11.10 | The amount for fiscal year 2026-27 is in line with the revised payment schedule agreed to by the Government of Canada and the World Bank. | Based on the payment schedule previously agreed upon between the Government of Canada and the World Bank. |
| Payments to International Bank for Reconstruction and Development for the G7 initiative on Crisis-Resilient Financing and Debt Transparency | International Affairs Julie Trépanier |
5.00 | 0.00 | 5.00 | Although no funding was included in the 2025–26 Main Estimates, $5 million was committed in the 2025–26 Supplementary Estimates (B). | Based on the payment schedule previously agreed upon: $5 million in 2025-26 and 2026-27, $4 million in 2026-27. |
| Contributions to employee benefit plans | Corporate Services | 18.80 | 18.30 | 0.50 | Increase is due to a higher percentage being applied than the prior year and increases in salary funding included in the 2026-27 Main Estimates. | Based on a percentage of salary budgets. For 2026-27 the TBS percentage is 16.4% of salary budgets for employee benefit plans compared to 15.3% in 2025-26. |
| Statutory Subsidies | Economic, Fiscal and Intergovernmental Policy Galen Countryman |
44.90 | 44.90 | 0.00 | When rounded in millions of dollars there is no apparent variance. In fact, there was an increase of $13K due to updated population data used in the calculation of the payment estimates. | Statutory Subsidies are annual grants paid to the provinces as a result of agreements entered into upon their joining Canada. While about a third of the payment amounts are fixed and set out in the British North America Acts(BNA Acts), the remainder are a function of population size. The population data that is to be used to calculate payment amounts is specified in the BNA Acts. |
| Minister of Finance - Salary and motor car allowance | Corporate Services | 0.11 | 0.10 | 0.00 | Slight statutory increase compared to previous year, though it is not apparent when the information is presented rounded in millions of dollars. This represents the allowances provided by Parliament to ministers. A car allowance is intended to cover expenses related to the work-related use of a personal vehicle. | The amount is specified in the Salaries Act and the Parliament of Canada Act and is updated annually. |
| Purchase of Domestic Coinage | Financial Sector Policy Julien Brazeau |
80.00 | 81.00 | -1.00 | Slight decrease in the Royal Canadian Mint's revised forecast for coin demand. | Quarterly updated costs from the Royal Canadian Mint, as domestic coins are produced by them. The Department of Finance is responsible for these costs as per a cost sharing MOU with the Royal Canadian Mint. |
| Hibernia Dividend Backed Annuity Agreement | Economic Development and Social Policy Jeremy Weil |
218.40 | 232.90 | -14.50 | The amount for fiscal year 2026-27 is in line with the payment schedule. | Based on payment schedule of annuity payments. |
| Other Interest Costs | Economic, Fiscal and Intergovernmental Policy Evelyn Dancey / Julie Turcotte |
5,149.00 | 5,194.00 | -45.00 | Decrease reflecting updated modelling and revised interest rate assumptions of certain other specified purpose accounts. | Interest calculated on the public sector pension obligations pertaining to service pre-April 2000 based on the 20-year average Government of Canada long-term bond rate. |
| Youth Allowances Recovery | Economic, Fiscal and Intergovernmental Policy Galen Countryman |
-1,488.70 | -1,442.40 | -46.30 | Recoveries from the province of Quebec are based on personal income tax data. The increase in the recovery is a result of the forecasted growth of national Basic Federal Tax as calculated in October 2025. | The value of income tax points is linked to economic growth and as income rises, the value of the share of the transferred tax points rises. |
| Payments to International Development Association | International Affairs Julie Trépanier |
304.00 | 486.90 | -182.90 | Revised annual installments as per the schedule of payments upon signing the 21st replenishment in December 2025. | Based on the schedule of payments agreed upon between the Government of Canada and the International Development Association. |
| Payments to the International Bank for Reconstructions and Development Financial Intermediaries Fund for Ukraine | International Affairs Julie Trépanier |
0.00 | 200.00 | -200.00 | New item in Main Estimates 2025-26, was subsequently reclassified as a loan in Supplementary Estimates (B). | Canada's contribution through the G7 Leaders Extraordinary Revenue Acceleration Loan Mechanism to be used to support projects, programs, and activities that address Ukraine's budget, recovery, and reconstruction needs. |
| Alternative Payment for Standing Programs | Economic, Fiscal and Intergovernmental Policy Galen Countryman |
-6,750.40 | -6,524.30 | -226.10 | Recoveries from the province of Quebec are based on personal income tax data. The increase in the recovery is a result of the forecasted growth of national Basic Federal Tax as calculated in October 2025. | The recovery is based solely on estimates of the Basic Federal Tax. |
| Total | 158,123.506 | 149,485.202 | 8,638.3037 |
Financial Transactions and Reports Analysis Centre of Canada Overview Main Estimates 2026-27
Key Messages
- Financial Transactions and Reports Analysis Centre of Canada's (FINTRAC) total funding sought in the 2026-27 Main Estimates is $135,396,626.
- Statutory authorities include revenues of $85.3 million following the implementation of the new assessment of expenses funding model following amendments to the Proceeds of Crime (Money Laundering) and Terrorist Financing Act. Prescribed Reporting Entities (RE) regulated under the Act pay an annual assessment to cover the costs of the Supervision function of the Centre.
- The balance of statutory authorities relates to the Employee Benefits Plan (EBP).
Details & Supplementary Information
| 2026-27 Main Estimates | |
|---|---|
| Voted - Program Expenditures | $45,505,984 |
| Statutory | $89,890,642 |
| Total 2026-27 | $135,396,626 |
- The $135.4 million in funding for 2026-27 is an increase of $26.4 million compared to the 2025-26 Main Estimates ($109.0M). This increase in funding is primarily attributable to:
- An increase of $24.8 million in funding due to in-flight modernization initiatives and planned growth in the Supervision program aimed at addressing emerging financial crime threats and aligning with both domestic and international priorities;
- An increase of $2.9 million in funding from Budget 2022, to strengthen Canada's Anti-Money Laundering and Anti-Terrorist Financing Regime;
- An increase of $1.9 million based on the funding profile of Budget 2024 to enhance FINTRAC's cyber resiliency and ensure the implementation of additional data security safeguards;
- An increase of $0.6 million related to statutory items; offset by:
- A decrease of $3.3 million as announced in Budget 2025 due to the Comprehensive Expenditure Review; and
- A decrease of $0.4 million as announced in Budget 2023 due to the refocusing of government spending.
| Program | 2025-26 | 2026-27 | Variance |
|---|---|---|---|
| Compliance with Anti-Money Laundering and Anti-Terrorism Financing Legislation and Regulations | $60,507,431 | $85,318,027 | $24,810,596 |
| Production and Dissemination of Financial Intelligence | $33,613,348 | $34,713,448 | $1,100,100 |
| Internal Services | $14,863,739 | $15,365,151 | $501,412 |
| Total | $108,984,518 | $135,396,626 | $26,412,108 |
| All Standard Objects | 2026-27 Main Estimates | |
|---|---|---|
| 1 | Personnel | $87,790,496 |
| Personnel – Statutory EBP | $4,572,615 | |
| Subtotal Personnel | $92,363,111 | |
| 2 | Transportation and communication | $1,670,953 |
| 3 | Information | $754,241 |
| 4 | Professional and special services | $22,717,365 |
| 5 | Rentals | $12,782,432 |
| 6 | Purchased repair and maintenance | $631,666 |
| 7 | Utilities, materials and supplies | $138,927 |
| 8 | Acquisition of land, buildings and works | $0 |
| 9 | Acquisition of machinery and equipment | $4,307,280 |
| 10 | Transfer Payments | $0 |
| 11 | Public debt charges | $2,355 |
| 12 | Other subsidies and payments | $28,296 |
| Total 2026-27 Main Estimates | $135,396,626 | |
- Personnel is the largest standard object. Including statutory authorities for EBP, personnel accounts for 68% of FINTRAC's budget.
- The remaining 32% is operation and maintenance (O&M) ($43M). In the O&M budget, 93% consists of:
- professional and special services ($22.7M or 53%);
- rentals ($12.8M or 30%); and
- acquisition of machinery and equipment ($4.3M or 10%).
- Professional and special services: This broad category includes, but is not limited to legal service fees, consulting fees, security services, professional services, training, and other types of services. A large portion of the professional and special services is linked to TB Sub funding.
- Rentals: FINTRAC is a fully reimbursing client of PSPC. FINTRAC pays for the accommodations costs for the headquarters in Ottawa and the three regional offices in Vancouver, Toronto and Montreal directly out of the operating budget.
- Acquisition of machinery and equipment: This category includes but is not limited to purchases of office furniture furnishing (e.g. desks), computer equipment (e.g. keyboards, mobile phones), and application software purchases.
Office of the Superintendent of Financial Institutions Overview Main Estimates 2026-27
Key Messages
- The Office of the Superintendent of Financial Institutions (OSFI) is seeking $1,224,899 in the 2026-27 Estimates to support operational needs of the Office of the Chief Actuary of Canada (OCA).
- The work OSFI does is almost entirely funded through assessments on the regulated financial institutions and pension plans, a user-pay program for selected services, and revenues from cost-recovered services primarily from other government entities (mainly OCA related). Together they fund over 99% of OSFI's costs.
- A small portion of OSFI's revenue—less than 1%—is derived from a parliamentary appropriation for actuarial valuation and advisory services provided by the OCA. Additional funding for the OCA is derived from direct billing of partner departments for the services provided, and from dedicated funds via established pension plans and funds.
- The $1.2 million voted budgetary amount for OSFI reflects reductions approved as part of the Comprehensive Expenditure Review. OSFI's forthcoming 2026-27 Departmental Plan will provide additional details on how OSFI's predominantly industry funded financial resources will be used to achieve planned results.
Details & Supplementary Information
- The Office of the Superintendent of Financial Institutions (OSFI) is an independent federal government agency that regulates and supervises more than 400 federally regulated financial institutions and 1,200 pension plans to determine whether they are in sound financial condition and meeting their requirements.
- OSFI's regulation and supervision activities play a key role in contributing to public confidence in the Canadian financial system.
- The Office of the Chief Actuary is an independent unit housed within OSFI that provides a range of actuarial valuation and advisory services to the federal government. This includes actuarial reports on the Canada Pension Plan (CPP), Old Age Security Program and the Canada Student Financial Assistance Program. Although the Chief Actuary reports to the Superintendent, they are solely responsible for the content and actuarial opinions in the reports.
- The OSFI Act stipulates that OSFI must recover its costs. Under section 17 of the OSFI Act, the Minister of Finance may spend any revenues collected under the Act to cover the expenses associated with the operation of OSFI. This means that any increase in OSFI's costs of regulation and supervision is funded by industry and similarly, any decrease results in a lower charge to industry.
- OSFI is accountable to ensure its operating expenses and capital investments are managed prudently. Each spring, OSFI meets with industry associations to discuss and validate its most recent plans.