
Archived - Debt Management Report 2018–2019
Table of Contents
Foreword by the Minister of Finance
Introduction
Highlights for 2017–18
Part I – 2017–18 Debt Management Context
Composition of Federal Debt
Sources and Uses of Borrowing
Borrowing Authorities
Government of Canada Credit Rating Profile
Part II – Report on Objectives and Principles
Objectives and Principles
Raising Stable, Low-Cost Funding
Maintaining a Well-Functioning Government Securities Market
Part III – Report on the 2017–18 Debt Program
Domestic Marketable Bonds
Treasury Bills and Cash Management Bills
Foreign Currency Debt
Retail Debt
Cash Management
Investment of Receiver General Cash Balances
Cash Management Bond Buyback Program
Annex 1 – Completed Treasury Evaluation Reports
Annex 2 – Debt Management Policy Measures Taken Since 1997

2018-19 Debt Management Report
(PDF, 2.63 MB)
Foreword by the Minister of Finance
In 2015, the Government of Canada made a commitment to Canadians: to invest in people and communities, with a plan that is targeted, measured, and fiscally responsible. Four years later, the results of that plan – a million new jobs and a strong economy – continue to show the importance of moving forward with investments that will strengthen and grow the middle class, and give every person a real and fair chance at success.
The government's debt management strategy plays an important part of this plan. Meeting the financial needs of the Government of Canada with stable and low-cost funding, combined with maintaining a well-functioning market for Government of Canada securities to help keep debt costs low, continues to drive strong results.
As part of this process, I am very pleased to table before Parliament the Government of Canada's Debt Management Report for the 2018–19 fiscal year.
As in previous years, the Government consulted dealers and investors as part of the process of developing the debt management strategy, the execution of which is guided by the key principles of transparency, regularity, prudence and liquidity.
This year's Debt Management Report demonstrates yet again that Canada continues to follow a prudent debt management strategy, raising stable and low-cost funding to meet borrowing requirements.
Moving forward, the Government will continue to invest in people and in the things that give people a better quality of life, while ensuring that Canada's federal debt-to-GDP ratio remains low. This low-debt advantage supports economic growth, gives the opportunity to invest in long-term growth and provides the Government the flexibility to respond to changing economic circumstances.
The Honourable Bill Morneau, P.C., M.P.
Minister of Finance
Ottawa, 2020
Purpose of This Publication
This edition of the Debt Management Report provides a detailed account of the Government of Canada's borrowing and debt management activities for the fiscal year ending March 31, 2019.
As required under Part IV (Public Debt) of the Financial Administration Act, this publication provides transparency and accountability regarding these activities. It reports on actual borrowing and uses of funds compared to those forecast in the Debt Management Strategy for 2018–19, published on February 27, 2018, in Budget 2018. It also discusses the environment in which the debt was managed, the composition of the debt, changes in the debt during the year, strategic policy initiatives and performance outcomes.
Other Information
The Public Accounts of Canada is tabled annually in Parliament and is available on the Public Services and Procurement Canada website. The Debt Management Strategy and the Report on the Management of Canada's Official International Reserves, which are also tabled annually in Parliament, are available on the Department of Finance Canada website. Additionally, monthly updates on cash balances and foreign exchange assets are available through The Fiscal Monitor, which is also available on the Department of Finance Canada website.
Executive Summary
Introduction
This publication reports on two major activities: (i) the management of federal market debt (the portion of the debt that is borrowed in financial markets); and (ii) the investment of cash balances in liquid assets for operational purposes and contingency planning.
The Government's market debt, including marketable bonds, treasury bills, retail debt and foreign currency debt, stood at $721.1 billion at the end of fiscal year 2018–19 (see boxed area of Chart 1). In addition to market and other types of unmatured debt, other liabilities, including pensions and accounts payable, brought the total liabilities of the Government of Canada to $1,185.2 billion at that time. When financial and non-financial assets[1] are subtracted from total liabilities, the federal debt or accumulated deficit of the Government of Canada was $685.5 billion as at March 31, 2019 (see Chart 1).
Domestic funding is conducted through the issuance of marketable securities, which consist of nominal bonds, Real Return Bonds and treasury bills, including cash management bills. These securities are sold predominately via auction but occasionally through syndication at the Government's discretion. Cross-currency swaps of domestic obligations and issuance of foreign currency debt are used to fund foreign reserve assets held in the Exchange Fund Account (see the section entitled "Foreign Currency Debt").
Chart 1
Snapshot of the Federal Balance Sheet, as at March 31, 2019
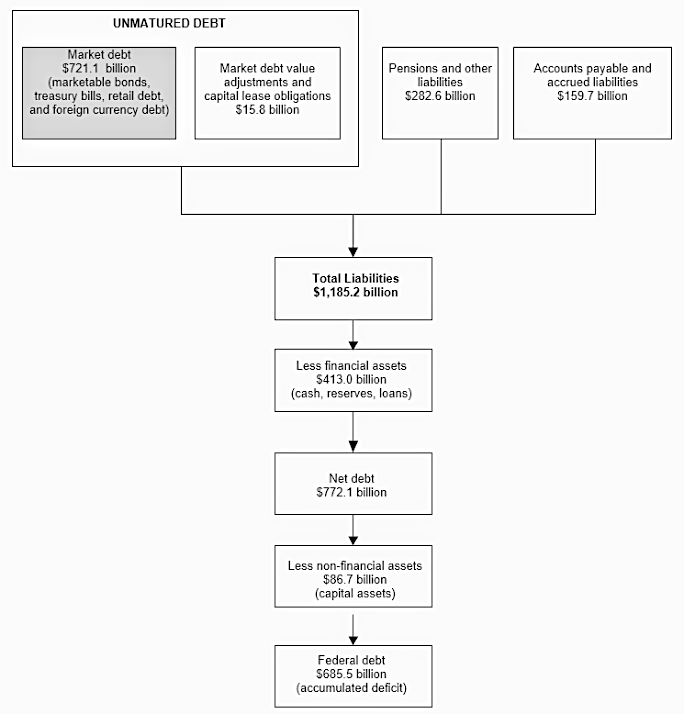
Note: Numbers may not add due to rounding.
Source: Public Accounts of Canada.
Highlights for 2018–19
The Debt Management Report consists of three parts covering the main aspects of the Government of Canada's debt program. "Part I – 2018–19 Debt Management Context" focuses on the state of the federal debt, the year's funding requirements and the sources of borrowings used to raise funds, the federal government's credit ratings and the authorities required to borrow. "Part II – Report on Objectives and Principles" reports on debt management objectives to raise stable and low-cost funding to meet the financial needs of the Government of Canada and to maintain a well-functioning market for Government of Canada securities, and associated principles."Part III – Report on the 2018–19 Debt Program" reports on the operational aspects of the debt program. This year's debt management operations continue to support the effective execution of the debt management program. The main highlights are as follows:
Strong Demand for Government of Canada Debt Securities
In 2018–19, the relative strength of the Canadian economy and its capital markets continued to support demand for Government of Canada securities in primary and secondary markets. Accordingly, treasury bill and bond auctions remained well-covered and competitively bid, providing an efficient manner for the Government to raise funding. The publication of the Quarterly Bond Schedule before each quarter and the Call for Tenders before each auction helped maintain transparency. This promoted well-functioning markets for the Government's securities to the benefit of a wide array of domestic market participants, contributing to the objective of raising stable and low-cost funding.
Stock of Market Debt
The stock of market debt increased by $16.8 billion in 2018–19, bringing the total stock to $721.1 billion. The change in the stock was mainly comprised of a $23.6 billion increase in treasury and cash management bills, a $5.4 billion decrease in marketable bonds, and a $1.3 billion decrease in retail debt outstanding. Notwithstanding the modest increase in its debt stock, Canada's total government net debt-to-GDP (gross domestic product) ratio remains the lowest among the Group of Seven (G7) nations, according to the International Monetary Fund (IMF).
Consistent with a broad increase in interest rate levels in 2018–19, the weighted average rate of interest on market debt increased to 2.18 per cent, up from 2.01 per cent in 2017–18.
Financial Requirements Lower Than Expected
In 2018–19, a confluence of factors led to financial requirements that were $22 billion lower than planned in the Debt Management Strategy for 2018–19. In response to decreased financial requirements, the bond program was adjusted lower, including the cancellation of two 3-year bond auctions that were planned in the Debt Management Strategy for 2018–19, in order to maintain the treasury bill stock at a healthy level. Bond issuance and the treasury bill stock ended the year $13 billion and $17 billion below the planned levels, respectively. This approach balanced liquidity requirements in both the treasury bill and core benchmark bond sectors necessary to support a well-functioning market for Canadian federal government securities, while also satisfying the Government's objective of achieving stable, low-cost funding.
Part I
2018–19 Debt Management Context
Composition of Federal Debt
In 2018–19, total market debt increased by $16.8 billion (or about 2.4 per cent) to $721.1 billion (see Table 1). For additional information on the financial position of the Government, see the 2018–19 Annual Financial Report of the Government of Canada.
| 2019 | 2018 (restated) |
Change | |
|---|---|---|---|
| Payable in Canadian currency | |||
| Marketable bonds | 569.5 | 575.0 | -5.4 |
| Treasury and cash management bills | 134.3 | 110.7 | 23.6 |
| Retail debt | 1.2 | 2.6 | -1.3 |
| Total payable in Canadian currency | 705.1 | 688.3 | 16.8 |
| Payable in foreign currencies | 16.0 | 16.0 | 0.0 |
| Total market debt | 721.1 | 704.3 | 16.8 |
| Market debt value adjustment, capital lease obligations and other unmatured debt |
15.8 | 16.9 | -1.1 |
| Total unmatured debt | 736.9 | 721.2 | 15.7 |
| Pension and other accounts | 282.6 | 281.4 | 7.2 |
| Total interest-bearing debt | 1,025.5 | 1,002.6 | 22.9 |
| Accounts payable, accruals and allowances | 159.7 | 147.8 | 11.9 |
| Total liabilities | 1,185.2 | 1,150.4 | 34.8 |
| Total financial assets | 413.0 | 397.5 | 15.6 |
| Total non-financial assets | 86.7 | 81.6 | 5.0 |
| Federal debt (accumulated deficit) | 685.5 | 671.3 | 14.2 |
| Note: Numbers may not add due to rounding.
Source: Public Accounts of Canada. |
|||
Sources and Uses of Borrowing
The key reference point for debt management is the financial requirement or source, which represents net cash needs or surplus for the fiscal year. This measure differs from the budgetary balance (i.e., the deficit or surplus on an accrual basis) by the amount of non-budgetary transactions and the timing of payments on a cash basis, which can be significant. Non-budgetary transactions include changes in federal employee pension accounts; changes in non-financial assets; loans, investments and advances; changes in other financial assets and liabilities; and foreign exchange activities, which do not affect cash needs or surplus. Anticipated borrowing and planned uses of funds are set out in the Debt Management Strategy, while actual borrowing and uses of funds compared to those forecast are reported in this publication (see Table 2).
There was a financial requirement of $12.7 billion in 2018–19 as a result of $14.0 billion in outflow due to a budgetary deficit and an inflow of $1.3 billion due to non-budgetary transactions. The financial requirement was approximately $22 billion lower than the projection in the Debt Management Strategy for 2018–19. For comparison, the financial requirement in 2017–18 was $9.4 billion.
In 2018–19, loans to the Business Development Bank of Canada, Canada Mortgage and Housing Corporation and Farm Credit Canada under the Crown Borrowing Program were $2.8 billion lower than the planned $6 billion. Since the inception of the program in 2007–08, the consolidated borrowings of these Crown corporations have grown to account for $59 billion of federal market debt.
| Planned1 | Actual | Difference | |
|---|---|---|---|
| Sources of borrowings | |||
| Payable in Canadian currency | |||
| Treasury bills | 138 | 134 | -4 |
| Bonds | 113 | 100 | -13 |
| Retail debt | 0 | 0 | 0 |
| Total payable in Canadian currency | 251 | 234 | -17 |
| Payable in foreign currencies | 7 | 7 | 0 |
| Total cash raised through borrowing activities | 258 | 241 | -17 |
| Uses of borrowings2 | |||
| Refinancing needs | |||
| Payable in Canadian currency | |||
| Treasury bills | 125 | 111 | -14 |
| Bonds | 94 | 107 | 13 |
| Of which: | |||
| Switch bond buybacks | 1 | 1 | 0 |
| Cash management bond buybacks | 35 | 48 | 13 |
| Retail debt | 1 | 1 | 0 |
| Total payable in Canadian currency | 220 | 219 | -1 |
| Payable in foreign currencies | 7 | 7 | 0 |
| Total refinancing needs | 227 | 226 | -1 |
| Financial source/requirement | |||
| Budgetary balance | 18 | 14 | -4 |
| Non-budgetary transactions | |||
| Pension and other accounts | -2 | -7 | -5 |
| Non-financial assets | 3 | 5 | 2 |
| Loans, investments and advances | 6 | 8 | 2 |
| Of which: | |||
| Loans to enterprise Crown corporations | 6 | 3 | -3 |
| Other | 1 | 5 | 4 |
| Other transactions3 | 9 | -7 | -16 |
| Total non-budgetary transactions | 17 | -1 | -18 |
| Total financial source/requirement | 35 | 13 | -22 |
| Adjustment for risk4 | -3 | 0 | 3 |
| Total uses of borrowings | 258 | 239 | -20 |
| Change in other unmatured debt transactions5 | 0 | -2 | -2 |
| Net increase or decrease (-) in cash | 0 | 3 | 3 |
| Note: Numbers may not add due to rounding.
1 Planned numbers are from Budget 2018 and the Debt Management Strategy for 2018–19. 2 A negative sign denotes a financial source. 3 Primarily includes the conversion of accrual adjustments into cash, such as tax and other account receivables; provincial and territorial tax collection agreements; and tax payables and other liabilities. 4 The adjustment included in the planned budgetary deficit for prudent fiscal planning purposes is removed to increase the accuracy of borrowing needs. Debt issuance can be altered during the year to adjust for unexpected changes in financial requirements. 5 Includes cross-currency swap revaluation, unamortized discounts on debt issues, obligations related to capital leases and other unmatured debt. |
|||
Borrowing Authorities
In order to undertake market borrowing activities, the Minister of Finance (the "Minister") needs authority from Parliament as well as the Governor in Council (the "GIC").
Under the Parliamentary borrowing authority framework enacted in 2017–18, Parliamentary authority is granted through the Borrowing Authority Act (the "BAA") and Part IV of the Financial Administration Act (the "FAA"), which together allow the Minister to borrow money up to a maximum overall amount as approved by Parliament. The FAA also authorizes the Minister to borrow in excess of the approved maximum amount under limited circumstances for the specific purposes of refinancing outstanding debt, extinguishing or reducing liabilities, and making payments in extraordinary circumstances, such as natural disasters. The borrowing authority framework came into force on November 23, 2017.
Subject to the noted limited exceptions, Parliament approved in the BAA a maximum stock of borrowings of $1,168,000 million, which also includes amounts borrowed by agent Crown corporations, and Canada Mortgage Bonds guaranteed by Canada Mortgage and Housing Corporation. As of March 31, 2019, $1,015,813 million of the Parliamentary-approved borrowing authority was used.
In addition to the new Parliamentary approval, Part IV of the FAA also requires the Minister to receive annual approval from the GIC to carry out borrowing that has been authorized by Parliament, including issuing securities in financial markets and undertaking related activities subject to a maximum aggregate amount. On the recommendation of the Minister of Finance, the GIC approved $300 billion to be the maximum aggregate principal amount of money that may be borrowed by the Minister in 2018–19.[2] The maximum aggregate principal amount is the sum of the following sub-components: (i) the maximum stock of treasury bills anticipated to be outstanding during the year; (ii) the total value of refinanced and anticipated new issuances of marketable bonds; and (iii) amounts to facilitate intra-year management of the debt and foreign exchange accounts.
During 2018–19, $241 billion of the GIC-approved borrowing authority was used, $59 billion below the authorized borrowing authority limit and $17 billion lower than the plan set out in the Debt Management Strategy for 2018–19 (see Table A3.1 in the Debt Management Strategy).
Government of Canada Credit Rating Profile
The Government of Canada continued to receive the highest possible credit ratings, with a stable outlook, on Canadian-dollar and foreign-currency-denominated short- and long-term debt from the five rating agencies that evaluate Canada's debt (see Table 3).
Rating agencies indicated that Canada's effective, stable and predictable policymaking and political institutions, economic resilience and diversity, well-regulated financial markets, and the strength of monetary and fiscal flexibility supported the country's ongoing triple-A credit rating. The rating agencies indicated that Canada's debt position would remain favourable, which provides investors of Canadian debt with a sense of security.
| Rating agency | Term | Domestic currency |
Foreign currency |
Outlook | Last rating action |
|---|---|---|---|---|---|
| Moody's Investors Service | Long-term Short-term |
Aaa P-1 | Aaa P-1 |
Stable | May 2002 |
| Standard & Poor's | Long-term Short-term |
AAA A-1+ | AAA A-1+ | Stable | July 2002 |
| Fitch Ratings | Long-term Short-term |
AAA F1+ | AAA F1+ | Stable | August 2004 |
| Dominion Bond Rating Service | Long-term Short-term |
AAA R-1 (High) | AAA R-1 (High) | Stable | n/a |
| Japan Credit Rating Agency | Long-term | AAA | AAA | Stable | n/a |
Part II
Report on Objectives and Principles
Objectives and Principles
The fundamental objectives of debt management are to raise stable and low-cost funding to meet the financial needs of the Government of Canada and to maintain a well-functioning market for Government of Canada securities. In support of these objectives, the design and implementation of the domestic debt program are guided by the key principles of transparency, regularity, prudence and liquidity. Towards this end, the Government publishes strategies and plans, and consults regularly with market participants to ensure the integrity and attractiveness of the market for dealers and investors. The structure of the debt is managed conservatively in a cost-risk framework, preserving access to diversified sources of funding and supporting a broad investor base.
Raising Stable, Low-Cost Funding
In general, achieving stable, low-cost funding involves striking a balance between debt costs and various risks in the debt structure. This selected balance between cost and risk is mostly achieved through the deliberate allocation of issuance among various debt instruments.
Composition of Market Debt
The composition of the stock of market debt is a reflection of past debt issuance choices. The effects of changes in the issuance patterns of short-term instruments become visible relatively quickly, while the full effect of issuance changes in longer-term maturities will take their entire maturity periods to be fully appreciated. A well-distributed maturity profile ensures a diversified exposure to changes in interest rates over time and provides liquidity across different maturity sectors to promote well-functioning markets.
Composition by Remaining Term to Maturity
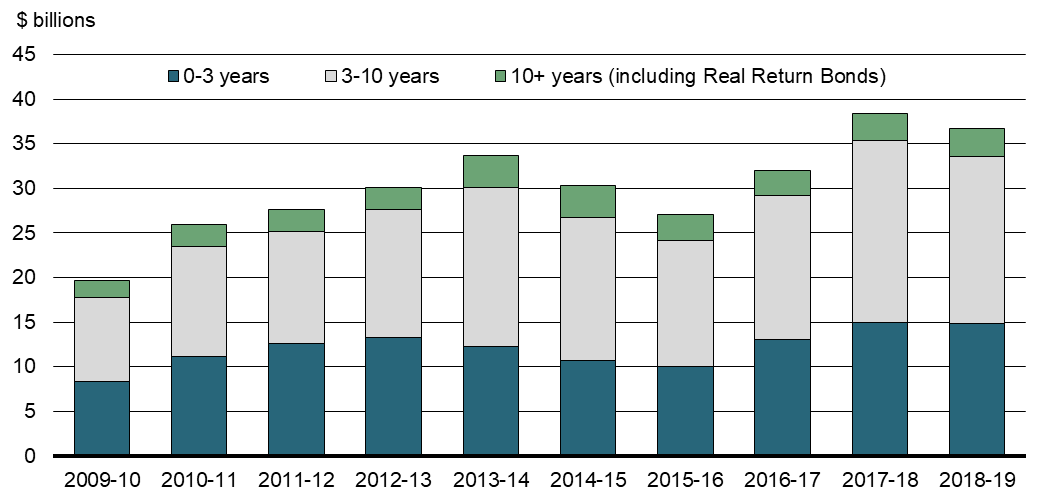
As a result of lower financial requirements than projected in the Debt Management Strategy for 2018–19, the Government reduced its issuance of bonds in all sectors except the 30-year sector compared to 2017–18. Reflecting this, bonds with remaining terms to maturity greater than or equal to 10 years increased slightly (see Chart 2). The size of bi-weekly treasury bill auctions rose slightly in order to maintain a treasury bill stock that was large enough to support a liquid and well-functioning market.
Chart 2
Composition of Market Debt by Remaining Term to Maturity, as at March 31
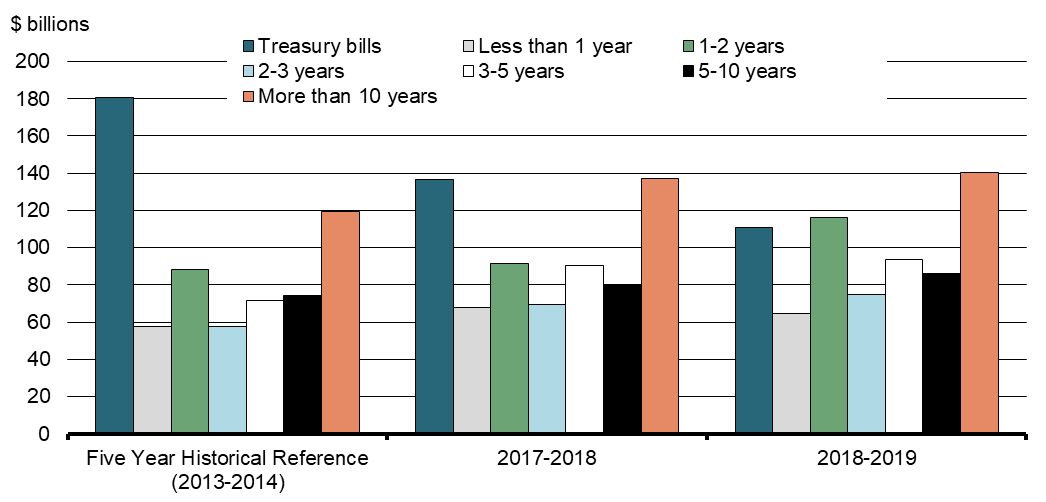
Data includes Consumer Price Index adjustment.
Sources: Public Accounts of Canada and Bank of Canada.
Composition by Original Term of Issuance
In 2018–19, the Government increased issuance of treasury bills relative to 2017–18. As a result, the share of bonds with original terms to maturity of 2 to 5 years decreased by 2.3 percentage points to 38.3 per cent of the stock of market debt outstanding (see Chart 3), driven mainly by decreased 2-, 3- and 5-year issuance in 2018–19. Bonds with original terms to maturity of 10 years or more represent 42.6 per cent of the total stock of market debt.
Chart 3
Composition of Market Debt by Original Terms of Issuance, as at March 31
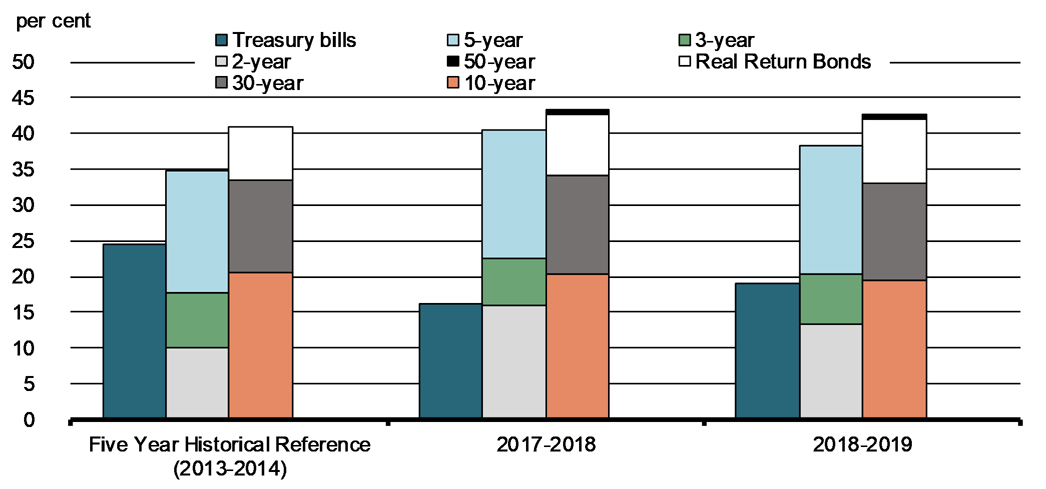
Source: Bank of Canada.
Cost of Market Debt
Market debt costs are the largest component of public debt charges (public debt charges also include interest expenses on non-market liabilities).[3] Consistent with a broad increase in interest rate levels in 2018–19, the weighted average rate of interest on outstanding market debt was 2.18 per cent in 2018–19, up from 2.01 per cent in 2017–18. As a result, the interest cost of market debt as a share of total expenses increased from 4.29 per cent in 2017–18 to 4.54 per cent in 2018–19, reflecting the higher weighted average rate of interest on market debt and a larger stock of market debt (see Chart 4).
Chart 4
Market Debt Costs and Average Effective Interest Rate
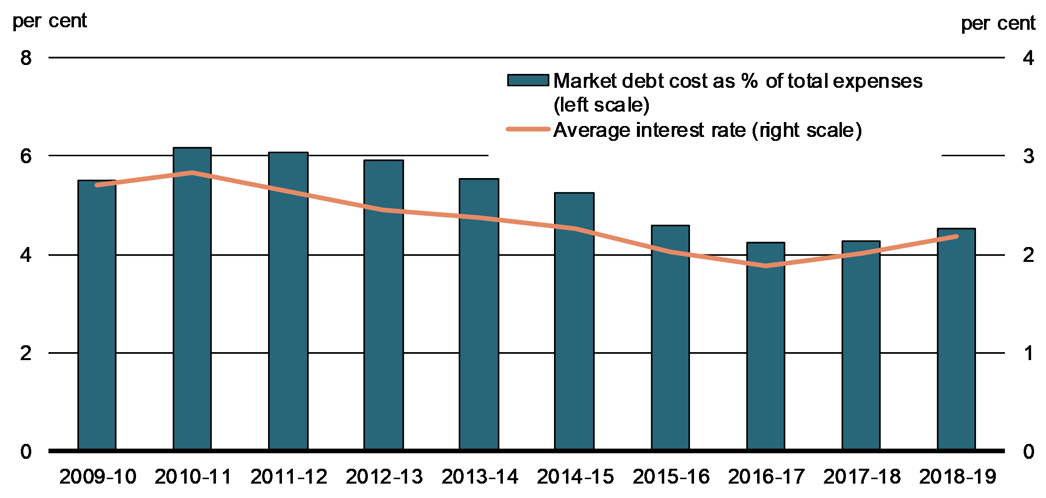
Source: Public Accounts of Canada.
Average Term to Maturity and Refixing Share of Market Debt, Net of Financial Assets
The average term to maturity (ATM) of market debt (net of financial assets) declined between 2008–09 and 2011–12, primarily due to a large increase in the issuance of treasury bills and 2-, 3- and 5-year bonds, relative to longer-term bonds following the financial crisis of 2008-2009. In 2014–15, as the Canadian and global financial markets recovered from the crisis and the Insured Mortgage Purchase Program was wound down, the ATM increased to 8.1 years. In 2018–19, the ATM rose slightly to 8.4 years, the highest level in over 10 years. This is due to the relatively low amount of treasury bills outstanding as a share of total market debt and higher issuance of long-dated bonds in recent years.
Chart 5
Average Term to Maturity of Government of Canada Market Debt, Net of Financial Assets
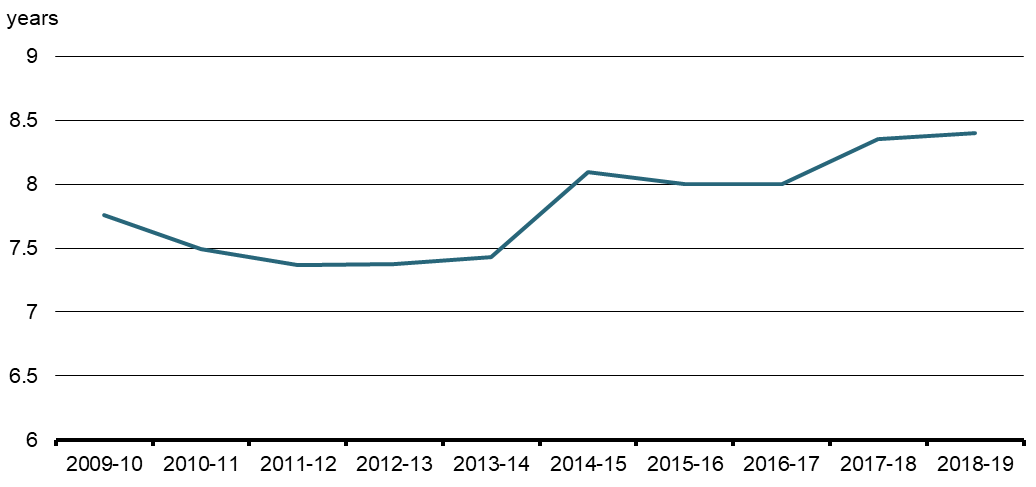
Source: Bank of Canada.
Maintaining debt rollover within acceptable parameters: Prudent management of debt refinancing needs promotes investor confidence and strives to minimize the impact of market volatility or disruptions on the funding program. According to a number of measures of rollover (e.g., quarterly maturities as a percentage of GDP, single day bond maturities plus coupon payments net of buyback operations, net refixing share of market debt and net refixing share of market debt to GDP), risk in the Government's debt program has been trending down over recent years.
The amount of debt maturing per quarter as a percentage of GDP rose to an average of 7.7 per cent during 2009–10 due to a higher stock of treasury bills, but has since declined to an average of 4.2 per cent in 2018–19 (see Chart 6). This mainly reflects the declining stock of treasury bills over the last five years due to lower-than-projected financial requirements.
Chart 6
Quarterly Maturities of Domestic Market Debt as a percentage of GDP
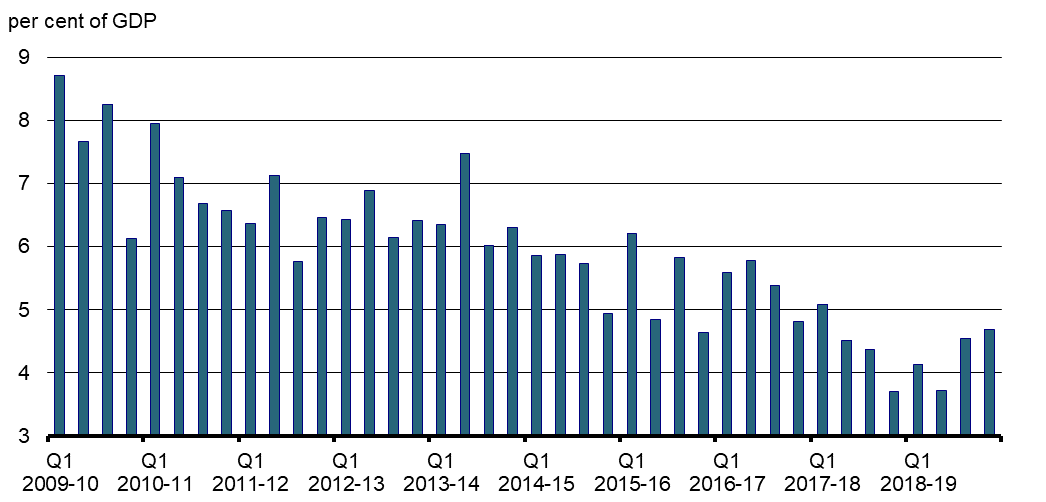
Source: Bank of Canada.
Single-day cash flow maturities had increased as a result of higher debt issuance since the financial crisis of 2008-2009, but have generally been trending downwards since 2012 as a result of the introduction of four new maturity dates—February 1, May 1, August 1 and November 1—in 2011–12. The four additional maturity dates have allowed the debt program to absorb increases in funding requirements and helped smooth the cash flow profile of upcoming maturities over the medium term. Most large single-day maturity dates are now due to principal and coupon payments on bonds that were issued prior to 2011–12 as well as the fungibility between 3- and 5-year bonds; the smoothing effect of these additional maturity dates on the cash profile will become even more apparent over time.
The benchmark maturity date profile is as follows:
- 2-year sector: February 1, May 1, August 1, November 1
- 3-year sector: March 1, September 1
- 5-year sector: March 1, September 1
- 10-year sector: June 1
- 30-year sector: December 1, alternating years with Real Return Bond maturities
The refixing share of market debt (net of financial assets) measures the proportion of all market debt that matures or needs to be repriced within one year. The refixing share net of financial assets is used rather than the gross refixing share because the net-of-assets measure better reflects the risk exposure to the Government. In 2018–19, the net refixing share of market debt increased by 5.7 percentage points to 29.5 per cent (see Chart 7). The net refixing share of market debt to GDP measures the amount of market debt that matures or needs to be repriced within one year relative to nominal GDP for that year. The net refixing share of market debt to GDP increased to 5.9 per cent in 2018–19, up 1.0 percentage point from 2017–18. The increase in both refixing measures reflects the increase in treasury bill levels in 2018–19, relative to 2017–18.
Chart 7
Net Refixing Share of Market Debt and Market Debt to GDP
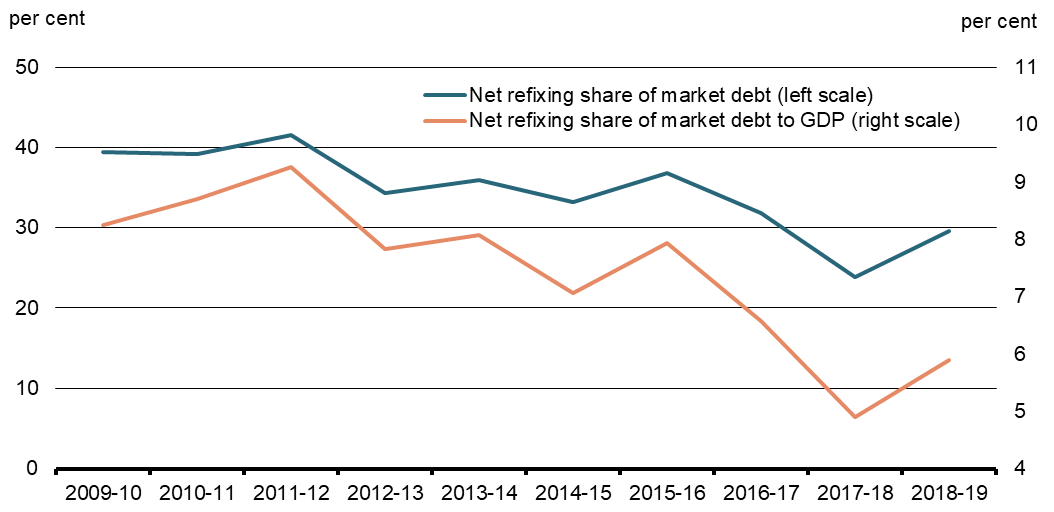
Source: Bank of Canada.
Maintaining a Well-Functioning Government Securities Market
A well-functioning market in Government of Canada securities is important as it benefits the Government as a borrower as well as a wide range of market participants. A well-functioning market helps the Government to have more certain access to funding markets over time, contributes to lower and less volatile pricing for the Government, and provides flexibility to meet changing financial requirements. For market participants, a liquid and transparent secondary market in government debt provides risk-free assets for investment portfolios, stability to other domestic fixed-income markets for which Government of Canada securities serve as benchmarks (e.g. provinces, municipalities and corporations), and a useful tool for hedging interest rate risk. The following actions promoted a well-functioning Government of Canada securities market in 2018–19.
Providing regular and transparent issuance: The Government of Canada conducted treasury bill auctions on a bi-weekly basis, announced the bond auction schedule prior to the start of each quarter and provided details for each operation in a Call for Tenders in the week leading up to the auction.[4] In 2018–19, there were regular auctions for 2-, 3-, 5-, 10- and 30-year nominal and Real Return Bonds. Bond issuance schedules were communicated through the Bank of Canada website on a timely basis.
Concentrating on key benchmarks: All benchmark bonds in 2018–19 continued to reach or exceed minimum benchmark size targets (see Chart 8).[5] Benchmark target sizes were decreased in the 2-, 3-, 5- and 10-year sectors in 2018–19 to support higher treasury bill issuance. This is consistent with the medium-term objective of maintaining a treasury bill stock that is large enough to support a liquid and well-functioning market for Canadian federal government treasury bills, while still supporting healthy benchmark sizes in core bond sectors.
- 2-year sector: $10 billion to $16 billion
- 3-year sector: $4 billion to $9 billion
- 5-year sector: $11 billion to $17 billion
- 10-year sector: $10 billion to $16 billion
- 30-year nominal sector: $10 billion to $16 billion
- 30-year Real Return Bond sector: $10 billion to $16 billion
Chart 8
Size of Gross Bond Benchmarks in 2018-2019
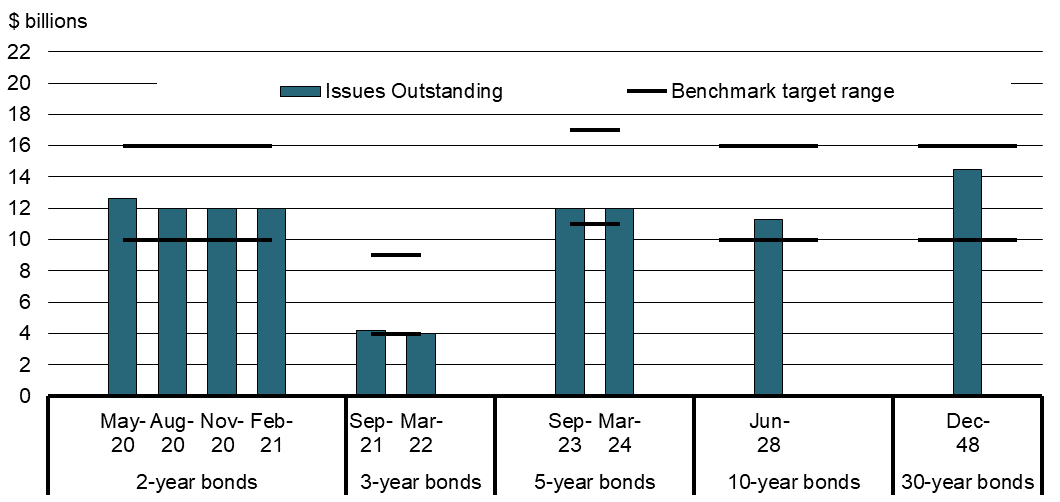
Source: Bank of Canada.
Notes: 3-year bonds are reopenings of older 5-year bonds. Due to the fungible nature of the 3-year and the older 5-year bonds, gross benchmarks are less applicable as a standard of measure.
Ensuring a broad investor base in Government of Canada securities: A diversified investor base supports an active secondary market for Government of Canada securities, thereby helping to keep funding costs low and stable. Diversification of the investor base is pursued by maintaining a domestic debt program that issues securities in a wide range of maturity sectors, which meet the needs of many different types of investors.
As at March 31, 2019, domestic investors (including the Bank of Canada) held about 69 per cent of Government of Canada securities (see Chart 9). Among domestic investors, insurance companies and pension funds held the largest share of Government of Canada securities (25.1 per cent), followed by financial institutions (21.0 per cent) and the Bank of Canada (13.3 per cent). Taken together, these top three categories accounted for close to two thirds of outstanding Government of Canada securities.
Chart 9
Distribution of Government of Canada Securities
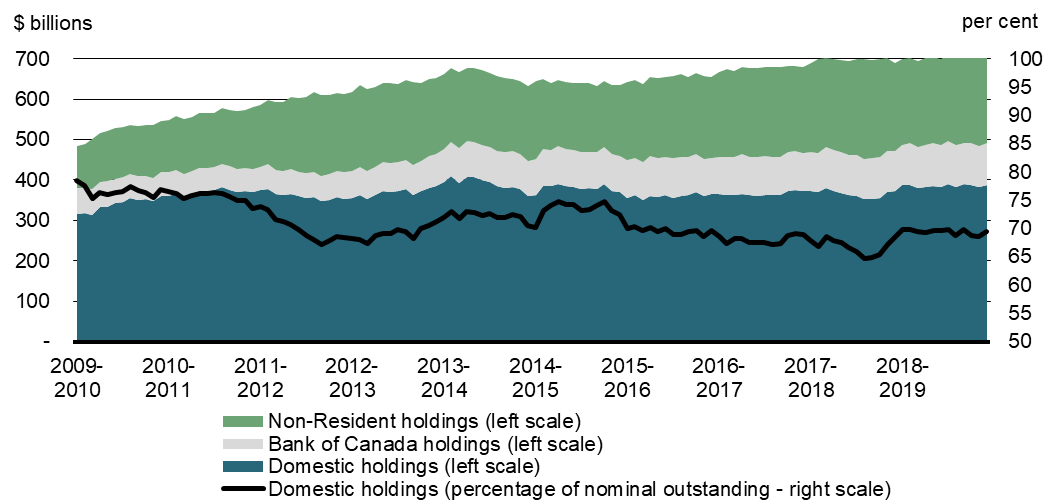
Source: Statistics Canada.
In 2018–19, non-resident investors held 31 per cent of Government of Canada marketable securities,[6] down about one percentage point from 2017–18. This level of non-resident holdings of Government of Canada debt remains in the mid-range compared to other sovereigns in the G7 (see Chart 10).
Chart 10
Percentage of Total Marketable Debt of G7 Countries Held by Non-Residents
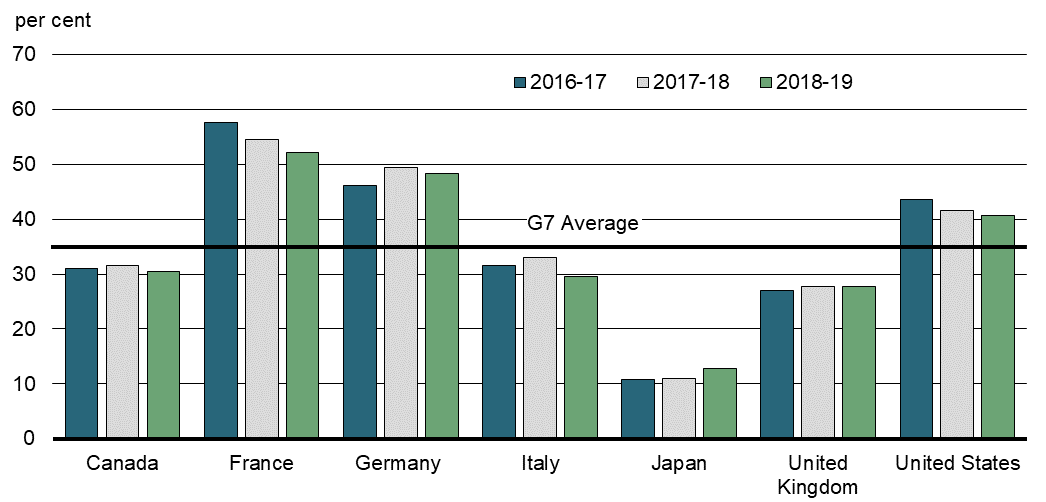
Sources: Statistics Canada, L'Agence France Trésor, Bundesbank, Bancaimi (Italy Central Bank), Ministry of Finance Japan, United Kingdom Debt Management Office, United States Department of Treasury.
Consulting with market participants: Formal consultations with market participants are held at least once a year, in order to obtain their views on the design of the borrowing program and on the liquidity and efficiency of the Government of Canada securities markets. In September 2017, the Bank of Canada and the Department of Finance Canada held about 35 bilateral meetings with organizations in Toronto, Montréal and New York. These consultations sought the views of market participants on issues related to the design and operation of the Government of Canada's domestic debt program for 2018–19 and beyond.
Market participants reported that the Government of Canada bond market continues to function very well and has been showing good levels of liquidity in core maturity sectors. Liquidity in off-the-run bonds was deemed to have improved from recent years although they remain less liquid than benchmark bonds, particularly for longer-dated maturities (between 10 and 30 years). The treasury bill market continues to function well; however, market participants pointed out that the stock of outstanding bills was approaching a level below which the well-functioning of the treasury bill market could be impacted. More details on these discussions are available on the Bank of Canada website.[7]
Further discussions with market participants in mid-2018–19 provided additional insight on the state of the treasury bill market at that time. Many noted some tightness in short-dated treasury bills in early 2018 as treasury bill auction sizes were reduced in response to the Government's lower-than-expected financial requirements, causing the total outstanding stock to drop. However, issues related to the decreased supply dissipated as treasury bill auction sizes increased and the total outstanding stock rose part way through 2018 due to higher seasonal cash requirements and downward adjustments to the bond program.
Maintaining a well-functioning securities distribution system: As the Government's fiscal agent, the Bank of Canada distributes Government of Canada marketable bills and bonds by auction to government securities distributors (GSDs) and customers. GSDs that maintain a certain threshold of activity in the primary and secondary market for Government of Canada securities may become primary dealers, which form the core group of distributors for Government of Canada securities. To maintain a well-functioning securities distribution system, government securities auctions are monitored to ensure that GSDs abide by the terms and conditions.[8]
Quick turnaround times enhance the efficiency of the auction and buyback processes, and reduce market risk for participants. In 2018–19, the turnaround time for treasury bill and bond auctions averaged 2 minutes 2 seconds, while buyback operations averaged 2 minutes 30 seconds. The average turnaround times in 2017–18 were 2 minutes 12 seconds and 2 minutes 51 seconds, respectively.[9]
Monitoring secondary market trading in Government of Canada securities: Two measures of liquidity and efficiency in the secondary market for Government of Canada securities are trading volume and turnover ratio.
Trading volume represents the amount of securities traded during a specific period (e.g., daily). Large trading volumes typically allow participants to buy or sell in the marketplace without a substantial impact on the price of the securities and generally imply lower bid-offer spreads.
Turnover ratio, which is the ratio of securities traded relative to the amount of securities outstanding, measures market depth. High turnover implies that a large amount of securities changes hands over a given period of time.
The average daily trading volume in the secondary market for Government of Canada bonds during 2018–19 was $36.7 billion, a decrease of $1.7 billion from 2017–18 (see Chart 11).
The annual debt stock turnover ratio in the Government of Canada secondary bond market was 18.1x in 2018–19, an increase from 17.7x in 2017–18. The sectors with the highest turnover are medium-term bonds with maturities between 3 and 10 years at 31.5x, while Real Return Bonds have the lowest turnover at 0.5x (see Chart 12).
Chart 11
Government of Canada Bond Average Daily Trading Volumes
Source: Bank of Canada.
Chart 12
Government of Canada Bond Turnover Ratio by Term to Maturity
Annualized Monthly Trading Volume / Total Bond Stock

Supporting secondary market liquidity: The Bank of Canada operates a securities-lending program to support the liquidity of Government of Canada securities by providing a secondary and temporary source of securities to the market. The program is triggered when market pricing for Government of Canada bonds and bills in repurchase transactions moves beyond a specified point.[10]
More liquid markets in 2018–19 resulted in a reduction in demand for securities-lending operations. Consequently, the Bank of Canada conducted only 3 securities-lending operations in 2018–19, compared to 5 operations in 2017–18. Securities-lending operations are generally conducted to alleviate tightness in markets for Government of Canada bonds. A bond is considered "tight", or trading "on special", when the repo rate (i.e., the rate of interest to be paid on the loan in a repurchase agreement between two parties) is below the general collateral rate (i.e., the repo rate on general collateral, or in this case, the Canadian Overnight Repo Rate Average).
Using the regular bond buyback program: Bond buyback operations on a cash basis and on a switch basis involve the purchase of bonds with a remaining term to maturity of 12 months to 25 years. Bond buyback operations on a cash basis involve the exchange of a bond for cash. Bond buyback operations on a switch basis, on the other hand, involve the exchange of one bond for another (e.g., an off-the-run bond for the building to benchmark bond), on a duration-neutral basis.[11]
In 2018–19, there were two regular bond buybacks on a switch basis. Both operations involved the exchange of an off-the-run bond for the 30-year building-to-benchmark bond. Switch operations amounted to $886 million at par value issued, which was $44 million lower than the switch operations that occurred in 2017–18. There were no regular bond buybacks on a cash basis in 2018–19.
Part III
Report on the 2018–19 Debt Program
In 2018–19, treasury bill and bond auctions continued to perform well. Demand for Government of Canada securities remained strong throughout the fiscal year as a result of persistent demand for high-quality sovereign debt securities, and Canada's strong fiscal and economic position.
Domestic Marketable Bonds
Bond Program
In 2018–19, gross bond issuance was $99.7 billion (including issuance through switch buybacks), $37.5 billion lower than the $137.2 billion issued in 2017–18. Gross issuance consisted of $97.5 billion in nominal bonds (including switch operations) and $2.2 billion in Real Return Bonds (see Table 4).
| 2014–15 | 2015–16 | 2016–17 | 2017–18 | 2018–19 | |
|---|---|---|---|---|---|
| Nominal (auction) | 96.0 | 89.8 | 130.4 | 134.21 | 96.7 |
| Nominal (switch) | 0.4 | 0.4 | 0.8 | 0.8 | 0.8 |
| Real Return Bonds | 2.2 | 2.2 | 2.2 | 2.2 | 2.2 |
| Total gross issuance | 98.6 | 92.4 | 133.4 | 137.2 | 99.7 |
| Cash buyback | 0.0 | 0.0 | 0.0 | 0.0 | 0.0 |
| Switch buyback | -0.5 | -0.4 | -0.8 | -0.8 | -0.8 |
| Total buyback | -0.5 | -0.4 | -0.8 | -0.8 | -0.8 |
| Net issuance | 98.1 | 92.0 | 132.6 | 136.4 | 98.9 |
| Note: Numbers may not add due to rounding. 1 This table includes ultra-long bond auctions of $1.25 billion that took place in fiscal year 2017–18, resulting in nominal issuance for the fiscal year of $134.15 billion (number has been rounded up to $134.2 billion). Excluding ultra-long issuance would result in nominal issuance of $132.9 billion for the fiscal year. Source: Bank of Canada. |
|||||
Auction Result Indicators for Domestic Bonds
The auction tail represents the number of basis points between the highest yield accepted and the average yield of an auction. A small auction tail is preferable as it is generally indicative of better transparency in the pricing of securities. Average auction tails were below the 5-year average across all maturities in 2018–19.[12] A total of 36 nominal bond auctions were conducted in 2018–19, four fewer than in 2017–18. This decrease in nominal bond auctions was the result of a planned reduction of two 3-year auctions as part of the Debt Management Strategy for 2018–19 and a cancellation of two additional 3-year auctions during 2018–19 in order to promote a healthy treasury bill stock.
Auction coverage is defined as the total amount of bids received, including bids from the Bank of Canada, divided by the amount auctioned. All else being equal, a higher auction coverage level typically reflects strong demand and therefore should result in a lower average auction yield. Bond auctions in 2018–19 continued to be well-covered, with ratios above the 5-year average in all sectors.
| Nominal Bonds | Real Return Bonds |
||||||
|---|---|---|---|---|---|---|---|
| 2-year | 3-year | 5-year | 10-year | 30-year | 30-year | ||
| Tail (basis points) | 2018–19 | 0.15 | 0.17 | 0.16 | 0.36 | 0.27 | n/a |
| 5-year average | 0.16 | 0.21 | 0.26 | 0.39 | 0.34 | n/a | |
| Coverage | 2018–19 | 2.88 | 2.87 | 2.62 | 2.42 | 2.80 | 2.43 |
| 5-year average | 2.64 | 2.56 | 2.48 | 2.37 | 2.56 | 2.34 | |
| Notes: Tail represents the number of basis points between the highest yield accepted and the average yield of an auction. Coverage is defined as the total amount of bids received, including bids from the Bank of Canada, divided by the amount auctioned. Source: Bank of Canada. |
|||||||
Participation at Domestic Bond Auctions
In 2018–19, primary dealers (PDs) were allotted 63 per cent of auctioned nominal bonds, and customers were allotted 37 per cent (see Table 6), excluding the Bank of Canada's allotment.[13] In aggregate, the 10 most active participants were in total allotted 77 per cent of these securities. Primary dealers' share of the Real Return Bond allotments decreased from 54 per cent in 2017–18 to 40 per cent in 2018–19, with customer allocations increasing from 46 per cent to 60 per cent.
| Participant type | 2014–15 | 2015–16 | 2016–17 | 2017–18 | 2018–19 | |||||
|---|---|---|---|---|---|---|---|---|---|---|
| ($ billion) | (%) | ($ billions) | (%) | ($ billions) | (%) | ($ billions) | (%) | ($ billions) | (%) | |
| PDs | 81 | 84 | 66 | 73 | 96 | 74 | 94 | 70 | 61 | 63 |
| Non-PD GSDs | 3 | 3 | 0 | 0 | 0 | 0 | 0 | 0 | 0 | 0 |
| Customers | 13 | 14 | 24 | 27 | 34 | 26 | 40 | 30 | 36 | 37 |
| Top 5 participants | 63 | 66 | 51 | 57 | 72 | 55 | 75 | 56 | 46 | 48 |
| Top 10 participants | 86 | 90 | 77 | 86 | 111 | 85 | 114 | 85 | 74 | 77 |
| Total nominal bonds issued | 96 | 90 | 130 | 134 | 97 | |||||
| Participant type | 2014–15 | 2015–16 | 2016–17 | 2017–18 | 2018–19 | |||||
|---|---|---|---|---|---|---|---|---|---|---|
| ($ billions) | (%) | ($ billions) | (%) | ($ billions) | (%) | ($ billions) | (%) | ($ billions) | (%) | |
| PDs | 1 | 55 | 1 | 23 | 1 | 38 | 1 | 54 | 1 | 40 |
| Non-PD GSDs | 0 | 0 | 0 | 0 | 0 | 0 | 0 | 0 | 0 | 0 |
| Customers | 1 | 44 | 2 | 77 | 1 | 62 | 1 | 46 | 1 | 60 |
| Top 5 participants | 1 | 54 | 1 | 52 | 1 | 66 | 1 | 59 | 1 | 46 |
| Top 10 participants | 2 | 75 | 2 | 75 | 2 | 87 | 2 | 82 | 1 | 68 |
| Total Real Return Bonds issued | 2 | 2 | 2 | 2 | 2 | |||||
| Note: Numbers may not add due to rounding. 1 Not including Bank of Canada allotment. Source: Bank of Canada. |
||||||||||
Treasury Bills and Cash Management Bills
During 2018–19, $272 billion in 3-, 6- and 12-month treasury bills were issued, an increase of $19.5 billion from the previous year. There were also 24 cash management bill operations for a total of $68.4 billion in 2018–19, compared to 20 operations and a total of $52.7 billion in 2017–18. Together, treasury bill and cash management bill issuance totaled $340.4 billion. As at March 31, 2019, the combined treasury and cash management bill stock totaled $134.3 billion, an increase of $23.6 billion from the end of 2017–18 (see Chart 13).
Chart 13
Treasury Bills Outstanding and as a Share of Marketable Domestic Debt
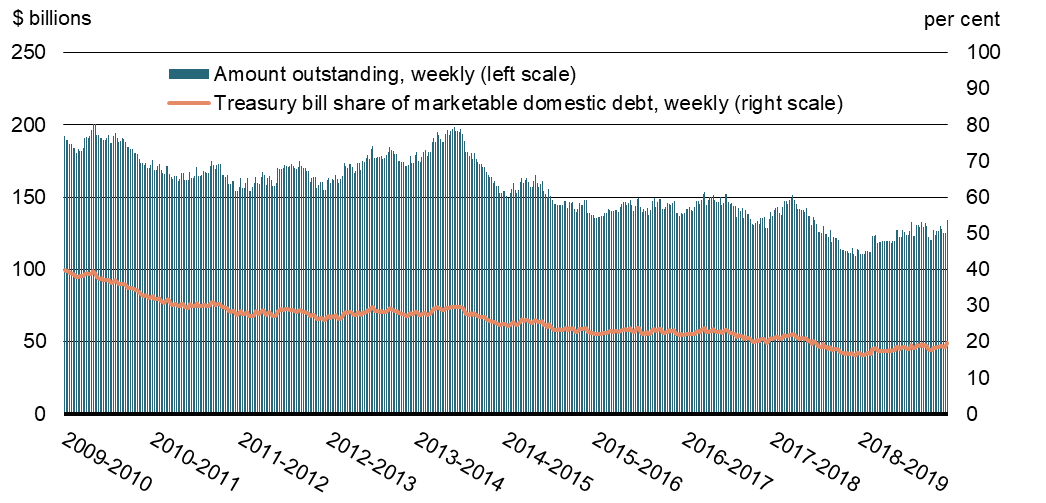
Source: Bank of Canada.
In 2018–19, all treasury bill and cash management bill auctions were fully covered. Auction tails were higher than the 5-year average across treasury bill maturity sectors. Coverage ratios for treasury bill auctions in 2018–19 were lower than the 5-year average for the 12-month sector and higher for the 3-month sector, 6-month sector and cash management bills (see Table 7).
| 3-month | 6-month | 12-month | Cash management bills |
||
|---|---|---|---|---|---|
| Tail | 2018–19 | 0.54 | 0.72 | 0.71 | 1.88 |
| 5-year average | 0.46 | 0.53 | 0.45 | 1.60 | |
| Coverage | 2018–19 | 2.22 | 2.29 | 2.31 | 2.64 |
| 5-year average | 2.09 | 2.28 | 2.33 | 2.57 | |
| Notes: Tail represents the number of basis points between the highest yield accepted and the average yield of an auction. Coverage is defined as the total amount of bids received, including bids from the Bank of Canada, divided by the amount auctioned. Tail and coverage ratio were calculated as the weighted averages, where the weight assigned to each auction equals the percentage total allotment in the auction's issuance sector. Source: Bank of Canada. | |||||
Participation at Treasury Bill Auctions
In 2018–19, the share of treasury bills allotted to primary dealers decreased by 3 percentage points to 88 per cent from a record high of 91 per cent in 2017–18, while the share allotted to customers increased by 3 percentage points to 12 per cent (see Table 8). The 10 most active participants were in total allotted 89 per cent of these securities.
| Participant type | 2014–15 | 2015–16 | 2016–17 | 2017–18 | 2018–19 | |||||
|---|---|---|---|---|---|---|---|---|---|---|
| ($ billion) | (%) | ($ billions) | (%) | ($ billions) | (%) | ($ billions) | (%) | ($ billions) | (%) | |
| PDs | 256 | 84 | 255 | 85 | 253 | 87 | 230 | 91 | 239 | 88 |
| Non-PD GSDs | 0 | 0 | 0 | 0 | 0 | 0 | 0 | 0 | 0 | 0 |
| Customers | 49 | 16 | 45 | 15 | 38 | 13 | 23 | 9 | 33 | 12 |
| Top 5 participants | 192 | 63 | 216 | 72 | 198 | 68 | 174 | 69 | 190 | 70 |
| Top 10 participants | 259 | 85 | 261 | 87 | 262 | 90 | 235 | 93 | 242 | 89 |
| Total treasury bills issued | 305 | 300 | 291 | 253 | 272 | |||||
| Note: Numbers may not add due to rounding.
1 Net of Bank of Canada allotment. Source: Bank of Canada. |
||||||||||
Foreign Currency Debt
Foreign currency debt is used to fund the Exchange Fund Account (EFA), which represents the largest component of the official international reserves. The primary objectives of the international reserves are to provide the Government of Canada with liquidity and the ability to intervene in the foreign exchange market to support the Canadian dollar.
The EFA is primarily made up of liquid foreign currency securities and special drawing rights (SDRs). Liquid foreign currency securities are composed primarily of debt securities of highly rated sovereigns, their agencies that borrow in public markets and are supported by a comprehensive government guarantee, and highly rated supranational organizations. SDRs are international reserve assets created by the IMF whose value is based on a basket of international currencies. The official international reserves also include Canada's reserve position at the IMF. This position, which represents Canada's investment in the activities of the IMF, fluctuates according to drawdowns and repayments from the IMF. The Report on the Management of Canada's Official International Reserves provides information on the objectives, composition and performance of the reserves portfolio.
The market value of Canada's official international reserves increased to US$83.4 billion as at March 29, 2019 from US$83.3 billion as at March 31, 2018. The change reflects a US$580 million increase in the IMF reserve position, partially offset by a US$474 million decrease in EFA assets. EFA assets, which totaled $80.7 billion as at March 29, 2019, were held at a level that is consistent with the Government's commitment to maintain holdings of liquid foreign currency securities at or above 3 per cent of nominal GDP.
The EFA is funded by liabilities of the Government of Canada denominated in, or converted to, foreign currencies. Funding requirements are primarily met through an ongoing program of cross-currency swaps funded by domestic issuances. As at March 29, 2019, Government of Canada cross-currency swaps outstanding stood at US$59.3 billion (par value).
In addition to cross-currency swaps funded by domestic issuances, the EFA is funded through a short-term US-dollar paper program (Canada bills), medium-term note (MTN) issuance in various markets (Canada notes, euro medium-term notes (EMTNs)) and international bond issues (global bonds). The funding method of choice depends on funding needs, costs, market conditions and funding diversification objectives. (see Table 9).
| March 29, 2019 | March 31, 2018 | Change | |
|---|---|---|---|
| Swapped domestic issues | 59,275 | 60,229 | -954 |
| Global bonds | 8,244 | 8,461 | -217 |
| Canada bills | 2,020 | 2,011 | 9 |
| Medium-term notes | |||
| Euro medium-term notes | 568 | 835 | -267 |
| Canada notes | 1,150 | 1,150 | – |
| Total | 71,257 | 72,686 | -1,429 |
| Note: Liabilities are stated at the exchange rates prevailing on March 29, 2019. | |||
As at March 31, 2019, the Government of Canada had three global bonds outstanding.
| Year of issuance | Market | Amount in original currency | Yield (%) |
Term to maturity (years) |
Coupon (%) |
Benchmark interest rate—government bonds |
Spread from benchmark at issuance (basis points) |
Spread over swap curve in relevant currency on issuance date (basis points) |
|---|---|---|---|---|---|---|---|---|
| 2010 | Global | €2 billion | 3.571 | 10 | 3.500 | Germany | 19.4 | EURIBOR + 2.0 |
| 2017 | Global | US$3 billion | 2.066 | 5 | 2.000 | US | 9.0 | LIBOR + 1.5 |
| 2019 | Global | US$3 billion | 2.633 | 3 | 2.625 | US | 10.0 | LIBOR - 4.7 |
| Notes: EURIBOR = Euro Interbank Offered Rate. LIBOR = London Interbank Offered Rate.
Source: Department of Finance Canada. The MTN program provides the Government with additional flexibility to raise foreign currency. The program allows for issuance in a number of currencies, including the US dollar, euro and British pound sterling, using either a US MTN or EMTN prospectus. During 2018–19, no medium-term notes were issued. |
||||||||
| Date of issuance | Date of maturity | Market | Amount | Yield | Term to maturity (years) | Fixed /floating | Interest rate basis | Index maturity | Spread over swap curve in relevant currency on issuance date (basis points) |
|---|---|---|---|---|---|---|---|---|---|
| 10-Dec-2013 | 10-Dec-2019 | Canada notes | US$50,000,000 | 1.86% | 6 | Fixed | LIBOR - 2 | ||
| 13-Dec-2013 | 13-Dec-2019 | Canada notes | US$50,000,000 | 6 | Floating | US$ LIBOR | 3 month | LIBOR - 2 | |
| 20-Dec-2013 | 20-Dec-2020 | Canada notes | US$50,000,000 | 2.30% | 7 | Fixed | LIBOR + 0 | ||
| 19-Mar-2014 | 19-Mar-2020 | EMTN | US$125,000,000 | 6 | Floating | US$ LIBOR | 3 month | LIBOR + 0 | |
| 08-May-2014 | 08-May-2020 | EMTN | US$125,000,000 | 6 | Floating | US$ LIBOR | 3 month | LIBOR + 0 | |
| 10-Jun-2014 | 10-Jun-2020 | Canada notes | US$100,000,000 | 6 | Floating | US$ LIBOR | 3 month | LIBOR - 2 | |
| 10-Sep-2014 | 10-Sep-2020 | Canada notes | US$250,000,000 | 6 | Floating | US$ LIBOR | 3 month | LIBOR - 2 | |
| 15-Sep-2014 | 15-Sep-2020 | Canada notes | US$50,000,000 | 6 | Floating | US$ LIBOR | 3 month | LIBOR - 3 | |
| 15-Jan-2015 | 15-Jan-2021 | EMTN | € 150,000,000 | 0.15% | 6 | Fixed | 6 month EURIBOR -27.5 | ||
| 24-Aug-2015 | 24-Aug-2021 | Canada notes | US$50,000,000 | 6 | Floating | US$ LIBOR | 3 month | LIBOR + 0 | |
| 25-Aug-2015 | 25-Aug-2019 | Canada notes | US$50,000,000 | 1.454% | 4 | Fixed | LIBOR - 6 | ||
| 10-Feb-2016 | 10-Feb-2020 | Canada notes | US$150,000,000 | 1.276% | 4 | LIBOR + 15 | |||
| 21-Jul-2016 | 21-Jul-2019 | Canada notes | US$150,000,000 | 3 | Floating | US$ LIBOR | 3 month | LIBOR + 2 | |
| 07-Sep-2016 | 06-Sep-2019 | Canada notes | US$100,000,000 | 3 | Floating | US$ LIBOR | 3 month | LIBOR - 6 | |
| 13-Jan-2017 | 13-Jan-2020 | Canada notes | US$250,000,000 | 3 | Floating | US$ LIBOR | 3 month | LIBOR + 0 | |
| Notes: LIBOR = London Interbank Offered Rate. EURIBOR = Euro Interbank Offered Rate. Source: Department of Finance Canada. |
|||||||||
Retail Debt
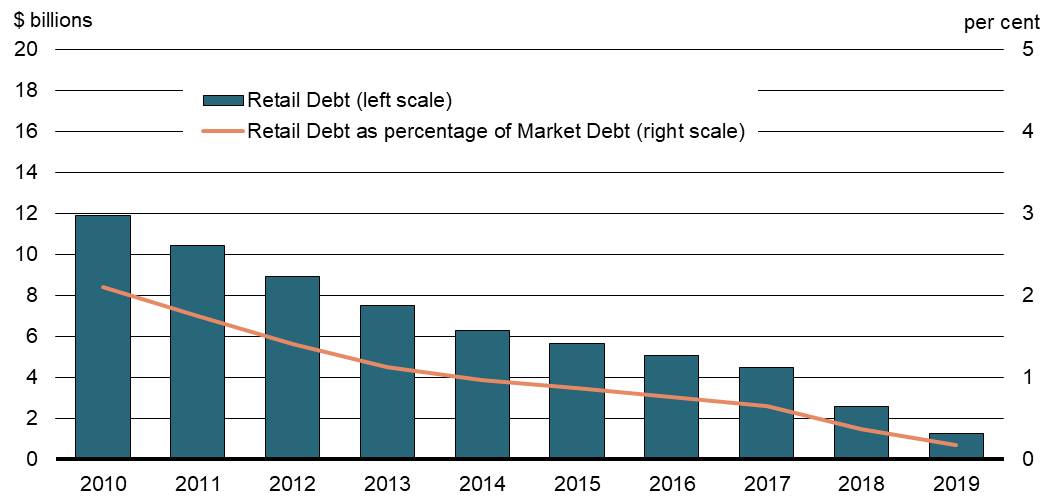
In 2018–19, the level of outstanding Canada Savings Bonds and Canada Premium Bonds held by retail investors decreased from $2.6 billion to $1.2 billion. Retail debt represented around 0.2 per cent of total market debt as at March 31, 2019 (see Chart 14).
In Budget 2017, the Government of Canada announced that it would discontinue the sales of new Canada Savings Bonds and Canada Premium Bonds in 2017 given that retail debt is no longer a cost-effective source of funds or a preferred investment by Canadians. Following the announcement, Canadians who participated in the payroll savings channel in the fall of 2016 were allowed to continue to make contributions towards Canada Savings Bonds purchased during the fall sales campaign, but only until October 31, 2017. With the end of the contributions to the payroll and registered product channels and no new certificated bond sales, the Canada Savings Bonds Program continues to be wound down systematically.
Chart 14
Evolution of Retail Debt Stock, as at March 31
Source: Bank of Canada.
In 2018–19, gross sales and redemptions were $0.1 billion and $1.4 billion respectively, for a net reduction of $1.3 billion in the stock of retail debt (see Table 12).
| Gross sales | Redemptions | Net change | |
|---|---|---|---|
| Payroll | 0.0 | 0.9 | -0.9 |
| Cash | 0.0 | 0.5 | -0.5 |
| Total | 0.1 | 1.4 | -1.3 |
| Note: Numbers may not add due to rounding. Source: Bank of Canada. |
|||
Cash Management
The Bank of Canada, as the Government's fiscal agent, manages the Receiver General (RG) Consolidated Revenue Fund, from which the balances required for the Government's day-to-day operations are drawn. The core objective of cash management is to ensure that the Government has sufficient cash available, at all times, to meet its operating requirements.
Cash consists of money on deposit to the credit of the Receiver General for Canada with the Bank of Canada, chartered banks and other financial institutions. Cash with the Bank of Canada includes RG operating balances and a $20 billion callable demand deposit held for the prudential liquidity plan.
The year-end daily liquidity position increased by $3.6 billion to $32 billion by the end of 2018–19 (see Table 13 and Chart 15).
| March 31, 2018 | March 31, 2019 | Annual average | Net change | |
|---|---|---|---|---|
| Callable deposits with the Bank of Canada | 20.0 | 20.0 | 20.0 | 0.0 |
| RG balances with the Bank of Canada | 1.8 | 3.5 | 2.7 | 1.7 |
| RG balances with financial institutions | 6.5 | 8.4 | 7.5 | 1.9 |
| Total | 28.4 | 32.0 | 30.2 | 3.6 |
| Note: Numbers may not add due to rounding. Source: Bank of Canada. |
||||
Chart 15
Daily Liquidity Position for 2018–19

Source: Bank of Canada.
Prudential Liquidity Management
The Government holds liquid financial assets in the form of domestic cash deposits and foreign exchange reserves[14] to promote investor confidence and safeguard its ability to meet payment obligations in situations where normal access to funding markets may be disrupted or delayed. In 2018–19, the Government's overall liquidity levels were maintained to cover at least one month of net projected cash flows, including coupon payments and debt refinancing needs.
Investment of Receiver General Cash Balances
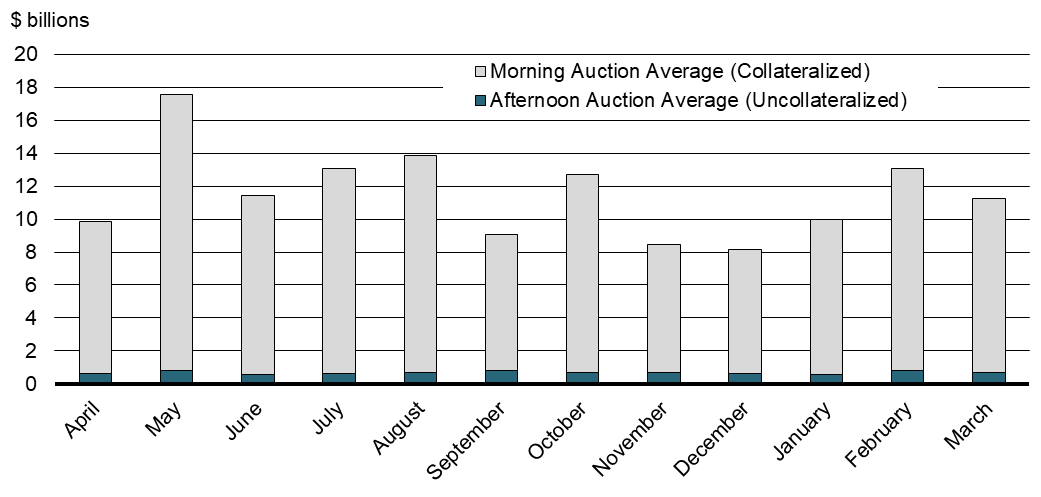
RG cash balances are invested in a prudent and cost-effective manner via short-term deposits allocated through auctions to chartered banks and other financial institutions. Since February 1999, when Canada's electronic funds transfer system—the Large Value Transfer System—was implemented, RG cash balances have been allocated to bidders twice daily through an auction process administered by the Bank of Canada. Roughly 90 per cent of daily RG cash balances are auctioned off in the morning auction while the remaining 10 per cent are auctioned off in the afternoon auction. These auctions serve two main purposes: first, as a treasury management tool, they are the means by which the Government invests its excess short-term Canadian-dollar cash balances; second, the auctions are used by the Bank of Canada in its monetary policy implementation to neutralize the impact of public sector flows on the level of settlement balances available to the financial system.
The balances placed via the morning auction are fully collateralized, which reduces the Government's exposure to counterparty credit risk. The balances placed via the afternoon auction for a term of one business day (i.e., overnight) remain uncollateralized as the auction process typically takes place late in the day and, as a result, operational constraints do not allow for collateralization before day's end (see Chart 16).
Chart 16
Allocation of Cash Balances for Receiver General Auctions (Average of Daily Balances for Each Month of 2018–19 Fiscal Year)
Source: Bank of Canada.
A key measure of the cost to the Government of maintaining cash balances is the net return on these cash balances—the difference between the return on government cash balances auctioned to financial institutions (typically around the overnight rate) and the weighted average yield paid on treasury bills. A typically upward sloping yield curve results in a cost of carry for the Government, as financial institutions pay rates of interest for government deposits that are lower than the rate paid by the Government to issue treasury bills. Conversely, under an inverted yield curve, short-term deposit rates are higher than the average of 3- to 12-month treasury bill rates, which can result in a net gain for the Government.
In 2018–19, treasury bill yields traded predominantly above the overnight rate, resulting in a loss of carrying cash of $13.0 million in 2018–19.
Cash Management Bond Buyback Program
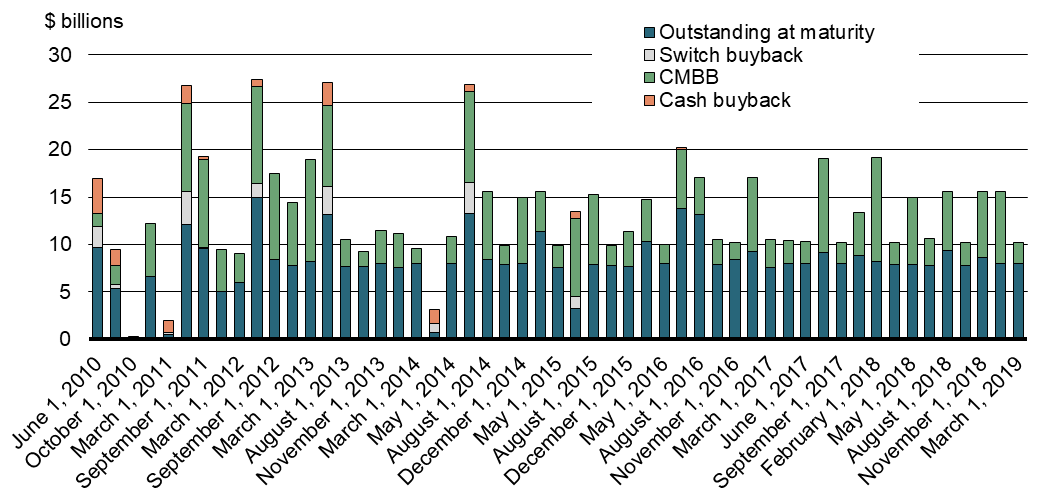
The cash management bond buyback (CMBB) program helps manage cash requirements by reducing the high levels of cash balances needed for key maturity and coupon payment dates. The program also helps smooth variations in treasury bill auction sizes over the year and reduce rollover risk. Securities targeted under this program are Government of Canada bonds with a term to maturity of up to 18 months where the total amount of maturing bonds is greater than $8 billion.
In 2018–19, the total amount of bonds repurchased through the CMBB program was $47.7 billion, compared to $40.5 billion in 2017–18. The maximum amount of CMBBs allowed for 2018–19 decreased to $73.7 billion from $86 billion the previous year, mainly due to slightly decreasing the maximum repurchase amount at each operation. A pilot program introduced in January 2017 to increase flexibility in the maximum repurchase amount at each operation was made permanent in November 2018.[15] The CMBB program had a take up rate of 64.8 per cent for 2018–19 compared to 47.0 per cent in 2017–18. Overall, the CMBB program, together with the switch buyback program, continued to keep bond maturities at reasonable levels in 2018–19.
The impact of repurchase operations is especially evident for June maturities (see Chart 17).
Chart 17
Impact of Repurchase Operations on Bond Maturities
Source: Bank of Canada.
Annex 1
Completed Treasury Evaluation Reports
In order to inform future decision making and to support transparency and accountability, different aspects of the Government of Canada's treasury activities are reviewed periodically under the Treasury Evaluation Program. The program's purpose is to obtain periodic external assessments of the frameworks and processes used in the management of wholesale and retail market debt, cash and reserves as well as the treasury activities of other entities under the authority of the Minister of Finance.
Reports on the findings of these evaluations and the Government's response to each evaluation are tabled with the House of Commons Standing Committee on Public Accounts by the Minister of Finance. Copies are also sent to the Auditor General of Canada. The reports are posted on the Department of Finance Canada website.
| Area | Year |
|---|---|
| Debt Management Objectives | 1992 |
| Debt Structure—Fixed/Floating Mix | 1992 |
| Internal Review Process | 1992 |
| External Review Process | 1992 |
| Benchmarks and Performance Measures | 1994 |
| Foreign Currency Borrowing—Canada Bills Program | 1994 |
| Developing Well-Functioning Bond and Bill Markets | 1994 |
| Liability Portfolio Performance Measurement | 1994 |
| Retail Debt Program | 1994 |
| Guidelines for Dealing With Auction Difficulties | 1995 |
| Foreign Currency Borrowing—Standby Line of Credit and FRN | 1995 |
| Treasury Bill Program Design | 1995 |
| Real Return Bond Program | 1998 |
| Foreign Currency Borrowing Programs | 1998 |
| Initiatives to Support a Well-Functioning Wholesale Market | 2001 |
| Debt Structure Target/Modelling | 2001 |
| Reserves Management Framework1 | 2002 |
| Bond Buybacks1 | 2003 |
| Funds Management Governance Framework1 | 2004 |
| Retail Debt Program1 | 2004 |
| Borrowing Framework of Major Federal Government-Backed Entities1 | 2005 |
| Receiver General Cash Management Program1 | 2006 |
| Exchange Fund Account Evaluation1 | 2006 |
| Risk Management Report1 | 2007 |
| Evaluation of the Debt Auction Process1 | 2010 |
| Evaluation of the Asset Allocation Framework of the Exchange Fund Account1 | 2012 |
| Report of the Auditor General of Canada on Interest-Bearing Debt2 | 2012 |
| Crown Borrowing Program Evaluation1 | 2013 |
| Retail Debt Evaluation1 | 2015 |
| 1 Available on the Department of Finance Canada website. 2 This audit was conducted outside of the Treasury Evaluation Program. |
|
Annex 2
Debt Management Policy Measures
Taken Since 1997
The fundamental objectives of debt management are to raise stable and low-cost funding to meet the financial needs of the Government of Canada and to maintain a well-functioning market for Government of Canada securities. For the Government as a debt issuer, a well-functioning market attracts investors and contributes to keeping funding costs low and stable over time. For market participants, a liquid and transparent secondary market in government debt provides risk-free assets for investment portfolios, a pricing benchmark for other debt issues and derivatives, and a primary tool for hedging interest rate risk. The following table lists significant policy measures that have been taken to achieve stable, low-cost funding and ensure a well-functioning Government of Canada securities market.
| Measure | Year |
|---|---|
| Dropped the 3-year bond benchmark | 1997 |
| Moved from weekly to bi-weekly treasury bill auctions | 1998 |
| Introduced a cash-based bond buyback program | 1999 |
| Introduced standardized benchmarks (fixed maturities and increased size) | 1999 |
| Started regular cross-currency swap-based funding of foreign assets | 1999 |
| Introduced a switch-based bond buyback program | 2001 |
| Allowed the reconstitution of bonds beyond the size of the original amount issued | 2001 |
| Introduced the cash management bond buyback program | 2001 |
| Reduced targeted turnaround times for auctions and buyback operations | 2001 |
| Advanced the timing of treasury bill auctions from 12:30 p.m. to 10:30 a.m. | 2004 |
| Advanced the timing of bond auctions from 12:30 p.m. to 12:00 p.m. | 2005 |
| Reduced the timing between bond auctions and cash buybacks to 20 minutes | 2005 |
| Dropped one quarterly 2-year auction | 2006 |
| Announced the maintenance of benchmark targets through fungibility (common dates) | 2006 |
| Consolidated the borrowings of three Crown corporations | 2007 |
| Changed the maturity of the 5-year benchmark and dropped one quarterly 5-year auction | 2007 |
| Reintroduced the 3-year bond benchmark | 2009 |
| Increased the frequency of cash management bond buyback operations from bi-weekly to weekly | 2010 |
| Announced a new framework for the medium-term debt management strategy | 2011 |
| Announced plans to increase the level of prudential liquidity by $35 billion over 3 years | 2011 |
| Added four new maturity dates—February 1, May 1, August 1 and November 1 | 2011 |
| Increased benchmark target range sizes in the 2-, 3- and 5-year sectors | 2011 |
| Announced a temporary increase in longer-term debt issuance | 2012 |
| Announced changes to the Terms and Conditions Governing the Morning Auction of Receiver General Cash Balances | 2013 |
| Introduced ultra-long bond issuance | 2014 |
| Discontinued 3-year issuance | 2015 |
| Increased benchmark target range sizes in the 2- and 5-year sectors | 2015 |
| Increased benchmark target range sizes in the 2-, 5- and 10-year sectors | 2016 |
| Reintroduced the 3-year bond benchmark | 2016 |
| Introduced a pilot program to increase flexibility in the maximum repurchase amount at CMBB operations | 2017 |
| Discountinued the sales of new Canada Savings Bonds | 2017 |
| Pilot program to increase flexibility of CMBB operations made permanent | 2018 |
Annex 3
Glossary
asset-liability management: An investment decision-making framework that is used to concurrently manage a portfolio of assets and liabilities.
average term to maturity: The weighted average amount of time until the securities in the debt portfolio mature.
benchmark bond: A bond that is considered by the market to be the standard against which all other bonds in that term area are evaluated against. It is typically a bond issued by a sovereign, since sovereign debt is usually the most creditworthy within a domestic market. Usually it is the most liquid bond within each range of maturities and is therefore priced accurately.
budgetary deficit: The shortfall between government annual revenues and annual budgetary expenses.
buyback on a cash basis: The repurchase of bonds for cash. Buybacks on a cash basis are used to maintain the size of bond auctions and new issuances.
buyback on a switch basis: The exchange of outstanding bonds for new bonds in the current building benchmark bond.
Canada bill: A promissory note denominated in US dollars, issued for terms of up to 270 days. Canada bills are issued for foreign exchange reserves funding purposes only.
Canada Investment Bond: A non-marketable fixed-term security instrument issued by the Government of Canada.
Canada note: A promissory note usually denominated in US dollars, and available in book-entry form. Canada notes can be issued for terms of nine months or longer, and can be issued at a fixed or a floating rate. Canada notes are issued for foreign exchange reserves funding purposes only.
Canada Premium Bond: A non-marketable security instrument issued by the Government of Canada, which is redeemable once a year on the anniversary date or during the 30 days thereafter without penalty.
Canada Savings Bond: A non-marketable security instrument issued by the Government of Canada, which is redeemable on demand by the registered owner(s), and which, after the first three months, pays interest up to the end of the month prior to cashing.
cross-currency swap: An agreement that exchanges one type of debt obligation for another involving different currencies and the exchange of the principal amounts and interest payments.
duration: Measures the sensitivity of the price of a bond or portfolio to fluctuations in interest rates. It is a measure of volatility and is expressed in years. The higher the duration number, the greater the interest rate risk for bond or portfolio prices.
electronic trading system: An electronic system that provides real-time information about securities and enables the user to execute financial trades.
Exchange Fund Account (EFA): An account that aids in the control and protection of the external value of the Canadian dollar and which provides a source of liquidity for the Government of Canada. Assets held in the EFA are managed to provide liquidity to the Government and to promote orderly conditions for the Canadian dollar in the foreign exchange markets, if required.
financial source/requirement: The difference between the cash inflows and outflows of the Government's Receiver General account. In the case of a financial requirement, it is the amount of new borrowing required from outside lenders to meet financing needs in any given year.
fixed-rate share of market debt: The proportion of market debt that does not mature or need to be repriced within one year (i.e. the inverse of the refixing share of market debt).
foreign exchange reserves: The foreign currency assets (e.g. interest-earning bonds) held to support the value of the domestic currency. Canada's foreign exchange reserves are held in the Exchange Fund Account.
Government of Canada securities auction: A process used for selling Government of Canada debt securities (mostly marketable bonds and treasury bills) in which issues are sold by public tender to government securities distributors and approved clients.
government securities distributor: An investment dealer or bank that is authorized to bid at Government of Canada auctions and through which the Government distributes Government of Canada treasury bills and marketable bonds.
interest-bearing debt: Debt consisting of unmatured debt, or debt issued on the credit markets, liabilities for pensions and other future benefits, and other liabilities.
Large Value Transfer System: An electronic funds transfer system introduced in February 1999 and operated by the Canadian Payments Association. It facilitates the electronic transfer of Canadian-dollar payments across the country virtually instantaneously.
marketable bond: An interest-bearing certificate of indebtedness issued by the Government of Canada, having the following characteristics: bought and sold on the open market; payable in Canadian or foreign currency; having a fixed date of maturity; interest payable either in coupon or registered form; face value guaranteed at maturity.
marketable debt: Market debt that is issued by the Government of Canada and sold via public tender or syndication. These issues can be traded between investors while outstanding.
money market: The market in which short-term capital is raised, invested and traded using financial instruments such as treasury bills, bankers' acceptances, commercial paper, and bonds maturing in one year or less.
non-market debt: The Government's internal debt, which is, for the most part, federal public sector pension liabilities and the Government's current liabilities (such as accounts payable, accrued liabilities, interest payments and payments of matured debt).
overnight rate; overnight financing rate; overnight money market rate; overnight lending rate: An interest rate at which participants with a temporary surplus or shortage of funds are able to lend or borrow until the next business day. It is the shortest term to maturity in the money market.
primary dealer: A member of the core group of government securities distributors that maintain a certain threshold of activity in the market for Government of Canada securities. The primary dealer classification can be attained in either treasury bills or marketable bonds, or both.
primary market: The market in which issues of securities are first offered to the public.
Real Return Bond: A bond whose interest payments are based on real interest rates. Unlike standard fixed-coupon marketable bonds, the semi-annual interest payments on Government of Canada Real Return Bonds are determined by adjusting the principal by the change in the Consumer Price Index.
refixing share of market debt: The proportion of market debt that matures or needs to be repriced within one year (i.e. the inverse of the fixed-rate share of market debt).
refixing share of market debt to gross domestic product (GDP): The amount of market debt that matures or needs to be repriced within one year relative to nominal GDP for that year.
secondary market: The market where existing securities trade after they have been sold to the public in the primary market.
sovereign market: The market for debt issued by a government.
treasury bill: A short-term obligation sold by public tender. Treasury bills, with terms to maturity of 3, 6 or 12 months, are currently auctioned on a bi-weekly basis.
ultra-long bond: A bond with a maturity of 40 years or longer.
yield curve: The conceptual or graphic representation of the term structure of interest rates. A "normal" yield curve is upward sloping, with short-term rates lower than long-term rates. An "inverted" yield curve is downward sloping, with short-term rates higher than long-term rates. A "flat" yield curve occurs when short-term rates are the same as long-term rates.
Annex 4 – Contact Information
Consultations and Communications Branch
Department of Finance Canada
14th floor
90 Elgin Street
Ottawa, Ontario K1A 0G5
Phone: 613-369-3710
Facsimile: 613-369-4065
TTY: 613-369-3230
E-mail: fin.financepublic-financepublique.fin@canada.ca
Media Enquiries:
613-369-4000
Reference Tables
I - Total Liabilities, Outstanding Market Debt and Debt Charges, as at March 31
II - Government of Canada Outstanding Market Debt, as at March 31
III - Issuance of Government of Canada Domestic Bonds
IV - Outstanding Government of Canada Domestic Bonds, as at March 31, 2019
V - Government of Canada Cross-Currency Swaps Outstanding, as at March 31, 2019
VI - Crown Corporation Borrowings, as at March 31
| Liabilities | |||||
|---|---|---|---|---|---|
| Year | Market debt | Market debt value adjustments | Accounts payable and accrued liabilities | Pension and other liabilities (restated)1 | Total liabilities (restated)1 |
| 1986 | 201.2 | -0.4 | 39.4 | 79.1 | 319.4 |
| 1987 | 228.6 | -0.4 | 42.1 | 84.7 | 355.0 |
| 1988 | 250.8 | -0.9 | 47.2 | 90.9 | 388.0 |
| 1989 | 276.3 | -2.2 | 50.2 | 97.1 | 421.4 |
| 1990 | 294.6 | -2.9 | 53.2 | 104.5 | 449.3 |
| 1991 | 323.9 | -3.2 | 54.9 | 112.1 | 487.7 |
| 1992 | 351.9 | -2.2 | 56.1 | 118.5 | 524.2 |
| 1993 | 382.7 | -3.0 | 58.4 | 125.1 | 563.2 |
| 1994 | 414.0 | -1.8 | 63.7 | 131.4 | 607.3 |
| 1995 | 441.0 | -3.4 | 71.3 | 139.8 | 648.7 |
| 1996 | 469.5 | -1.7 | 74.9 | 148.5 | 691.3 |
| 1997 | 476.9 | 0.3 | 75.9 | 156.3 | 709.4 |
| 1998 | 466.8 | 1.4 | 81.7 | 160.9 | 710.8 |
| 1999 | 457.7 | 2.6 | 83.7 | 168.2 | 712.2 |
| 2000 | 454.2 | -0.2 | 83.9 | 175.8 | 713.6 |
| 2001 | 444.9 | 1.3 | 88.5 | 179.0 | 713.6 |
| 2002 | 440.9 | 0.9 | 83.2 | 177.9 | 703.0 |
| 2003 | 438.6 | -1.1 | 83.2 | 178.3 | 699.0 |
| 2004 | 436.5 | -2.5 | 85.2 | 180.9 | 700.1 |
| 2005 | 431.8 | -4.3 | 97.7 | 179.8 | 705.0 |
| 2006 | 427.3 | -6.1 | 101.4 | 179.9 | 702.5 |
| 2007 | 418.8 | -4.7 | 106.5 | 185.1 | 705.8 |
| 2008 | 394.1 | -3.4 | 110.5 | 191.2 | 692.3 |
| 2009 | 510.9 | 3.1 | 114.0 | 200.4 | 828.4 |
| 2010 | 564.4 | -5.3 | 120.5 | 208.7 | 888.3 |
| 2011 | 596.8 | -5.7 | 119.1 | 217.2 | 927.5 |
| 2012 | 631.0 | -4.7 | 125.0 | 226.1 | 977.5 |
| 2013 | 668.0 | 4.4 | 118.7 | 236.2 | 1,027.4 |
| 2014 | 648.7 | 10.3 | 111.4 | 245.2 | 1,015.8 |
| 2015 | 649.5 | 15.7 | 123.6 | 251.4 | 1,040.2 |
| 2016 | 669.7 | 18.5 | 127.9 | 262.0 | 1,078.0 |
| 2017 | 695.1 | 18.5 | 132.5 | 270.7 | 1,116.9 |
| 2018 | 704.3 | 16.9 | 154.8 | 281.4 | 1,157.4 |
| 2019 | 721.1 | 15.8 | 159.7 | 282.6 | 1,185.2 |
| 1 Historical Public Accounts data for pension and other liabilities and total liabilities have been restated back to 2008–09 following revisions in methodology. | |||||
| Accumulated deficit and debt charges | ||||||
|---|---|---|---|---|---|---|
| Year | Total liabilities (restated)1 | Financial assets | Net debt (restated)1 | Non-financial assets | Accumulated deficit (restated)1 | Gross public debt charges (restated)1 |
| 1986 | 319.4 | 70.1 | 249.2 | 21.4 | 227.8 | 27.7 |
| 1987 | 355.0 | 73.2 | 281.8 | 24.2 | 257.7 | 28.7 |
| 1988 | 388.0 | 75.0 | 313.0 | 26.3 | 286.7 | 31.2 |
| 1989 | 421.4 | 77.9 | 343.6 | 29.0 | 314.6 | 35.5 |
| 1990 | 449.3 | 74.5 | 374.8 | 31.0 | 343.8 | 41.2 |
| 1991 | 487.7 | 76.6 | 411.1 | 33.4 | 377.7 | 45.0 |
| 1992 | 524.2 | 78.5 | 445.7 | 35.8 | 410.0 | 43.9 |
| 1993 | 563.2 | 76.0 | 487.2 | 38.2 | 449.0 | 41.3 |
| 1994 | 607.3 | 79.3 | 527.9 | 40.4 | 487.5 | 40.1 |
| 1995 | 648.7 | 81.2 | 567.5 | 43.3 | 524.2 | 44.2 |
| 1996 | 691.3 | 92.7 | 598.6 | 44.4 | 554.2 | 49.4 |
| 1997 | 709.4 | 100.4 | 609.0 | 46.1 | 562.9 | 47.3 |
| 1998 | 710.8 | 103.6 | 607.2 | 47.2 | 559.9 | 43.1 |
| 1999 | 712.2 | 109.3 | 602.9 | 48.7 | 554.1 | 43.3 |
| 2000 | 713.6 | 123.5 | 590.1 | 50.2 | 539.9 | 43.4 |
| 2001 | 713.6 | 141.9 | 571.7 | 51.7 | 520.0 | 43.9 |
| 2002 | 703.0 | 137.7 | 565.3 | 53.4 | 511.9 | 39.7 |
| 2003 | 699.0 | 139.5 | 559.6 | 54.2 | 505.3 | 37.3 |
| 2004 | 700.1 | 149.1 | 551.0 | 54.8 | 496.2 | 35.8 |
| 2005 | 705.0 | 155.4 | 549.6 | 54.9 | 494.7 | 34.1 |
| 2006 | 702.5 | 165.6 | 536.9 | 55.4 | 481.5 | 33.8 |
| 2007 | 705.8 | 181.9 | 523.9 | 56.6 | 467.3 | 33.9 |
| 2008 | 692.3 | 176.0 | 516.3 | 58.6 | 457.6 | 33.3 |
| 2009 | 828.4 | 298.9 | 529.4 | 61.5 | 467.9 | 28.3 |
| 2010 | 888.3 | 300.8 | 587.5 | 63.4 | 524.1 | 26.6 |
| 2011 | 927.5 | 304.0 | 623.5 | 66.6 | 556.9 | 28.6 |
| 2012 | 977.5 | 317.6 | 659.9 | 68.0 | 591.9 | 29.0 |
| 2013 | 1,027.4 | 337.8 | 689.5 | 68.9 | 620.6 | 25.5 |
| 2014 | 1,015.8 | 318.5 | 696.4 | 70.4 | 626.0 | 24.7 |
| 2015 | 1,040.2 | 336.7 | 703.5 | 74.6 | 628.9 | 24.2 |
| 2016 | 1,078.0 | 365.8 | 712.2 | 77.8 | 634.4 | 21.8 |
| 2017 | 1,116.9 | 382.8 | 734.1 | 82.6 | 651.5 | 21.2 |
| 2018 | 1,157.4 | 397.5 | 752.9 | 81.6 | 671.3 | 21.9 |
| 2019 | 1,185.2 | 413.0 | 772.1 | 86.7 | 685.5 | 23.2 |
| 1 Historical Public Accounts data for total liabilities, net debt, the accumulated deficit and gross public debt charges have been restated back to 2008–09 following revisions in methodology. | ||||||
| Payable in Canadian dollars | |||||
|---|---|---|---|---|---|
| Year | Treasury bills | Marketable bonds1 | Retail debt | Canada Pension Plan bonds |
Total |
| 1986 | 62.0 | 81.1 | 44.2 | 0.4 | 187.7 |
| 1987 | 77.0 | 94.4 | 44.3 | 1.8 | 217.5 |
| 1988 | 81.1 | 103.9 | 53.3 | 2.5 | 240.8 |
| 1989 | 102.7 | 115.7 | 47.8 | 3.0 | 269.2 |
| 1990 | 118.6 | 127.7 | 40.9 | 3.1 | 290.2 |
| 1991 | 139.2 | 143.6 | 34.4 | 3.5 | 320.7 |
| 1992 | 152.3 | 158.1 | 35.6 | 3.5 | 349.5 |
| 1993 | 162.1 | 178.5 | 34.4 | 3.5 | 378.4 |
| 1994 | 166.0 | 203.4 | 31.3 | 3.5 | 404.3 |
| 1995 | 164.5 | 225.7 | 31.4 | 3.5 | 425.1 |
| 1996 | 166.1 | 252.8 | 31.4 | 3.5 | 453.8 |
| 1997 | 135.4 | 282.6 | 33.5 | 3.5 | 454.9 |
| 1998 | 112.3 | 294.6 | 30.5 | 3.5 | 440.8 |
| 1999 | 97.0 | 295.8 | 28.2 | 4.1 | 425.0 |
| 2000 | 99.9 | 294.4 | 26.9 | 3.6 | 424.7 |
| 2001 | 88.7 | 295.5 | 26.4 | 3.5 | 414.1 |
| 2002 | 94.2 | 294.9 | 24.0 | 3.4 | 416.5 |
| 2003 | 104.6 | 289.2 | 22.6 | 3.4 | 419.8 |
| 2004 | 113.4 | 279.0 | 21.3 | 3.4 | 417.1 |
| 2005 | 127.2 | 266.7 | 19.1 | 3.4 | 416.3 |
| 2006 | 131.6 | 261.9 | 17.3 | 3.1 | 413.9 |
| 2007 | 134.1 | 257.9 | 15.2 | 1.7 | 408.9 |
| 2008 | 117.0 | 253.8 | 13.1 | 1.0 | 384.9 |
| 2009 | 192.5 | 295.3 | 12.5 | 0.5 | 500.8 |
| 2010 | 175.9 | 367.9 | 11.8 | 0.5 | 556.1 |
| 2011 | 163.0 | 416.1 | 10.1 | 0.0 | 589.2 |
| 2012 | 163.2 | 448.1 | 8.9 | 0.0 | 620.3 |
| 2013 | 180.7 | 469.0 | 7.5 | 0.0 | 657.2 |
| 2014 | 153.0 | 473.3 | 6.3 | 0.0 | 632.6 |
| 2015 | 135.7 | 487.9 | 5.7 | 0.0 | 629.2 |
| 2016 | 138.1 | 504.1 | 5.1 | 0.0 | 647.2 |
| 2017 | 136.7 | 536.3 | 4.5 | 0.0 | 677.5 |
| 2018 | 110.7 | 575.0 | 2.6 | 0.0 | 688.2 |
| 2019 | 134.3 | 569.5 | 1.2 | 0.0 | 705.1 |
| 1 Inflation adjusted. | |||||
| Payable in foreign currencies | |||||||
|---|---|---|---|---|---|---|---|
| Year | Canada bills | Marketable bonds | Canada notes1 | Euro medium-term notes1 | Standby drawings |
Term loans | Total |
| 1986 | 0.0 | 9.3 | 0.0 | 0.0 | 2.2 | 2.2 | 13.8 |
| 1987 | 1.0 | 8.9 | 0.0 | 0.0 | 0.0 | 2.0 | 12.0 |
| 1988 | 1.0 | 7.9 | 0.0 | 0.0 | 0.0 | 2.3 | 11.3 |
| 1989 | 1.1 | 6.3 | 0.0 | 0.0 | 0.0 | 0.9 | 8.3 |
| 1990 | 1.4 | 4.3 | 0.0 | 0.0 | 0.0 | 0.0 | 5.7 |
| 1991 | 1.0 | 3.6 | 0.0 | 0.0 | 0.0 | 0.0 | 4.5 |
| 1992 | 0.0 | 3.4 | 0.0 | 0.0 | 0.0 | 0.0 | 3.4 |
| 1993 | 2.6 | 2.8 | 0.0 | 0.0 | 0.0 | 0.0 | 5.4 |
| 1994 | 5.6 | 5.0 | 0.0 | 0.0 | 0.0 | 0.0 | 10.7 |
| 1995 | 9.0 | 7.9 | 0.0 | 0.0 | 0.0 | 0.0 | 16.9 |
| 1996 | 7.0 | 9.5 | 0.3 | 0.0 | 0.0 | 0.0 | 16.8 |
| 1997 | 8.4 | 12.5 | 2.1 | 0.0 | 0.0 | 0.0 | 23.0 |
| 1998 | 9.4 | 14.6 | 1.7 | 1.5 | 0.0 | 0.0 | 27.2 |
| 1999 | 10.2 | 19.7 | 1.3 | 4.9 | 0.0 | 0.0 | 36.0 |
| 2000 | 6.0 | 21.4 | 1.1 | 4.1 | 0.0 | 0.0 | 32.6 |
| 2001 | 7.2 | 21.2 | 1.6 | 3.7 | 0.0 | 0.0 | 33.7 |
| 2002 | 3.4 | 19.8 | 1.2 | 3.2 | 0.0 | 0.0 | 27.5 |
| 2003 | 2.6 | 14.5 | 1.2 | 3.3 | 0.0 | 0.0 | 21.6 |
| 2004 | 3.4 | 13.2 | 1.3 | 3.0 | 0.0 | 0.0 | 20.8 |
| 2005 | 3.9 | 9.9 | 1.1 | 1.7 | 0.0 | 0.0 | 16.5 |
| 2006 | 4.7 | 7.6 | 0.5 | 1.5 | 0.0 | 0.0 | 14.3 |
| 2007 | 1.8 | 6.7 | 0.5 | 1.6 | 0.0 | 0.0 | 10.6 |
| 2008 | 1.5 | 6.1 | 0.5 | 1.6 | 0.0 | 0.0 | 9.7 |
| 2009 | 8.7 | 0.3 | 0.0 | 1.7 | 0.0 | 0.0 | 10.6 |
| 2010 | 2.5 | 5.8 | 0.0 | 0.0 | 0.0 | 0.0 | 8.2 |
| 2011 | 2.0 | 5.6 | 0.0 | 0.0 | 0.0 | 0.0 | 7.7 |
| 2012 | 2.1 | 8.6 | 0.0 | 0.0 | 0.0 | 0.0 | 10.7 |
| 2013 | 2.1 | 8.7 | 0.0 | 0.0 | 0.0 | 0.0 | 10.8 |
| 2014 | 2.3 | 13.0 | 0.6 | 0.1 | 0.0 | 0.0 | 16.0 |
| 2015 | 3.8 | 14.8 | 1.2 | 0.5 | 0.0 | 0.0 | 20.3 |
| 2016 | 4.7 | 15.3 | 1.6 | 0.9 | 0.0 | 0.0 | 22.5 |
| 2017 | 3.5 | 11.5 | 1.7 | 0.9 | 0.0 | 0.0 | 17.6 |
| 2018 | 2.6 | 10.9 | 1.7 | 0.9 | 0.0 | 0.0 | 16.0 |
| 2019 | 2.7 | 11.0 | 1.7 | 0.6 | 0.0 | 0.0 | 16.0 |
| 1 Amounts for 2016 and 2017 and have restated following historical revisions. | |||||||
| Total market debt | |||||
|---|---|---|---|---|---|
| Year | Total payable in Canadian dollars | Total payable in foreign currencies |
Less: Government's holdings and consolidation adjustment1 |
Total market debt | Average interest rate (%) |
| 1986 | 187.7 | 13.8 | -0.3 | 201.2 | 10.7 |
| 1987 | 217.5 | 12.0 | -0.9 | 228.6 | 9.3 |
| 1988 | 240.8 | 11.3 | -1.2 | 250.8 | 9.6 |
| 1989 | 269.2 | 8.3 | -1.2 | 276.3 | 10.8 |
| 1990 | 290.2 | 5.7 | -1.3 | 294.6 | 11.2 |
| 1991 | 320.7 | 4.5 | -1.3 | 323.9 | 10.7 |
| 1992 | 349.5 | 3.4 | -1.0 | 351.8 | 8.9 |
| 1993 | 378.4 | 5.4 | -1.1 | 382.7 | 7.9 |
| 1994 | 404.3 | 10.7 | -1.0 | 414.0 | 6.8 |
| 1995 | 425.1 | 16.9 | -1.0 | 441.0 | 8.0 |
| 1996 | 453.8 | 16.8 | -1.0 | 469.5 | 7.3 |
| 1997 | 454.9 | 23.0 | -1.1 | 476.8 | 6.7 |
| 1998 | 440.8 | 27.2 | -1.2 | 466.8 | 6.6 |
| 1999 | 425.0 | 36.0 | -3.3 | 457.7 | 6.7 |
| 2000 | 424.7 | 32.6 | -3.1 | 454.2 | 6.2 |
| 2001 | 414.1 | 33.7 | -2.9 | 444.9 | 6.1 |
| 2002 | 416.5 | 27.5 | -3.1 | 440.9 | 5.6 |
| 2003 | 419.8 | 21.6 | -2.7 | 438.6 | 5.3 |
| 2004 | 417.1 | 20.8 | -1.5 | 436.4 | 4.9 |
| 2005 | 416.3 | 16.5 | -1.1 | 431.7 | 4.6 |
| 2006 | 413.9 | 14.3 | -1.0 | 427.2 | 4.7 |
| 2007 | 408.9 | 10.6 | -0.7 | 418.9 | 4.9 |
| 2008 | 384.9 | 9.7 | -0.5 | 394.1 | 4.6 |
| 2009 | 500.8 | 10.6 | -0.6 | 510.8 | 3.2 |
| 2010 | 556.1 | 8.2 | -0.1 | 564.2 | 2.7 |
| 2011 | 589.2 | 7.7 | -0.1 | 596.8 | 2.8 |
| 2012 | 620.3 | 10.7 | -0.1 | 631.0 | 2.7 |
| 2013 | 657.2 | 10.8 | -0.0 | 668.0 | 2.5 |
| 2014 | 632.6 | 16.0 | -0.3 | 648.7 | 2.4 |
| 2015 | 629.2 | 20.3 | -0.4 | 649.5 | 2.3 |
| 2016 | 647.2 | 22.5 | 0.1 | 669.7 | 2.0 |
| 2017 | 677.5 | 17.6 | -0.4 | 695.1 | 1.9 |
| 2018 | 688.3 | 16.0 | 0.9 | 704.3 | 2.0 |
| 2019 | 705.1 | 16.0 | -0.4 | 721.1 | 2.2 |
| 1 Because certain comparative figures have been restated to reflect the presentation method used in recent years, the numbers presented in this reference table can differ from numbers presented in other sections of the Debt Management Report. In the reference table, ''Government's holdings and consolidation adjustment'' is presented separately but in the rest of the report the amount is incorporated into the figures. For more information, please consult table 6.2 and table 6.3 of the Public Accounts of Canada 2019. | |||||
| Gross issuance | ||||||||||||
|---|---|---|---|---|---|---|---|---|---|---|---|---|
| Nominal1 | Real Return Bonds | Buybacks | ||||||||||
| Fiscal year | 2-year | 3-year | 5-year | 10-year | 30-year | Total | 30-year | Total | Cash | Switch | Total | Net issuance |
| 1995–96 | 11.1 | 5.1 | 17.0 | 10.5 | 5.0 | 48.7 | 1.0 | 49.7 | 0.0 | 49.7 | ||
| 1996–97 | 12.0 | 11.1 | 13.3 | 11.8 | 5.8 | 54.0 | 1.7 | 55.7 | 0.0 | 55.7 | ||
| 1997–98 | 14.0 | 9.9 | 9.3 | 5.0 | 38.2 | 1.7 | 39.9 | 0.0 | 39.9 | |||
| 1998–99 | 14.0 | 9.8 | 9.2 | 3.3 | 36.3 | 1.6 | 37.9 | 0.0 | 37.9 | |||
| 1999–00 | 14.2 | 14.0 | 12.9 | 3.7 | 44.8 | 1.3 | 46.0 | -2.7 | 0.0 | -2.7 | 43.3 | |
| 2000–01 | 14.1 | 10.5 | 10.1 | 3.8 | 38.5 | 1.4 | 39.9 | -2.8 | 0.0 | -2.8 | 37.1 | |
| 2001–02 | 14.0 | 10.0 | 9.9 | 6.3 | 40.2 | 1.4 | 41.6 | -5.3 | -0.4 | -5.6 | 35.9 | |
| 2002–03 | 13.9 | 11.0 | 12.6 | 4.8 | 42.3 | 1.4 | 43.7 | -7.1 | -5.0 | -12.1 | 31.6 | |
| 2003–04 | 13.0 | 10.7 | 11.5 | 4.2 | 39.4 | 1.4 | 40.8 | -5.2 | -5.0 | -10.2 | 30.7 | |
| 2004–05 | 12.0 | 9.6 | 10.6 | 3.3 | 35.5 | 1.4 | 36.9 | -6.8 | -4.7 | -11.4 | 25.5 | |
| 2005–06 | 10.0 | 9.2 | 10.0 | 3.2 | 32.4 | 1.5 | 33.9 | -5.3 | -3.3 | -8.6 | 25.3 | |
| 2006–07 | 10.3 | 7.8 | 10.4 | 3.3 | 31.8 | 1.6 | 33.4 | -5.1 | -4.7 | -9.8 | 23.5 | |
| 2007–08 | 11.7 | 6.3 | 10.7 | 3.4 | 32.0 | 2.3 | 34.3 | -4.3 | -2.4 | -6.7 | 27.6 | |
| 2008–09 | 23.2 | 29.0 | 15.7 | 5.1 | 72.9 | 2.1 | 75.0 | -3.2 | -2.7 | -6.0 | 69.0 | |
| 2009–10 | 31.5 | 20.1 | 24.0 | 17.4 | 7.0 | 100.0 | 2.2 | 102.2 | 0.0 | -2.1 | -2.1 | 100.1 |
| 2010–11 | 36.3 | 18.8 | 21.2 | 12.0 | 5.0 | 93.3 | 2.2 | 95.5 | 0.0 | -4.4 | -4.4 | 91.2 |
| 2011–12 | 44.0 | 18.0 | 21.0 | 10.0 | 4.7 | 97.7 | 2.2 | 99.9 | -3.0 | -3.0 | -5.9 | 94.0 |
| 2012–13 | 35.9 | 13.9 | 20.4 | 16.5 | 6.7 | 93.4 | 2.2 | 95.6 | -0.4 | -1.1 | -1.5 | 94.1 |
| 2013–14 | 32.4 | 13.5 | 20.4 | 14.0 | 5.0 | 85.3 | 2.2 | 87.5 | 0.0 | -1.0 | -1.0 | 86.5 |
| 2014–15 | 38.4 | 16.2 | 20.4 | 13.3 | 4.6 | 92.9 | 2.2 | 95.1 | 0.0 | -0.5 | -0.5 | 94.6 |
| 2015–16 | 50.2 | 26.8 | 10.0 | 3.2 | 90.2 | 2.2 | 92.4 | 0.0 | -0.4 | -0.4 | 92.0 | |
| 2016–17 | 62.4 | 19.5 | 30.0 | 15.0 | 4.3 | 131.2 | 2.2 | 133.4 | 0.0 | -0.8 | -0.8 | 132.6 |
| 2017–18 | 59.1 | 24.7 | 30.6 | 15.0 | 4.3 | 133.7 | 2.2 | 135.9 | 0.0 | -0.8 | -0.8 | 135.1 |
| 2018–19 | 48.0 | 8.2 | 24.0 | 13.5 | 3.8 | 97.5 | 2.2 | 99.7 | 0.0 | -0.8 | -0.8 | 98.9 |
| 1 Including nominal issuance through switch buyback operations. Source: Bank of Canada. |
||||||||||||
| Maturity date | Amount ($ millions) |
Coupon rate (%) |
|---|---|---|
| 1-May-2019 | 7,888 | 0.75 |
| 1-Jun-2019 | 7,935 | 3.75 |
| 1-Aug-2019 | 8,344 | 0.75 |
| 1-Sep-2019 | 9,860 | 1.75 |
| 1-Nov-2019 | 14,043 | 1.25 |
| 1-Feb-2020 | 8,715 | 1.25 |
| 1-Mar-2020 | 20,958 | 1.50 |
| 1-May-2020 | 10,446 | 1.75 |
| 1-Jun-2020 | 12,162 | 3.50 |
| 1-Aug-2020 | 11,961 | 1.75 |
| 1-Sep-2020 | 26,000 | 0.75 |
| 1-Nov-2020 | 12,000 | 2.00 |
| 1-Feb-2021 | 12,000 | 2.25 |
| 1-Mar-2021 | 25,500 | 0.75 |
| 15-Mar-2021 | 567 | 10.50 |
| 1-May-2021 | 9,000 | 1.75 |
| 1-Jun-2021 | 11,500 | 3.25 |
| 1-Jun-2021 | 286 | 9.75 |
| 1-Sep-2021 | 19,200 | 0.75 |
| 1-Mar-2022 | 19,000 | 0.50 |
| 1-Jun-2022 | 12,700 | 2.75 |
| 1-Jun-2022 | 206 | 9.25 |
| 1-Sep-2022 | 15,600 | 1.00 |
| 1-Mar-2023 | 15,000 | 1.75 |
| 1-Jun-2023 | 14,200 | 1.50 |
| 1-Jun-2023 | 2,359 | 8.00 |
| 1-Sep-2023 | 12,000 | 2.00 |
| 1-Mar-2024 | 12,000 | 2.25 |
| 1-Jun-2024 | 13,800 | 2.50 |
| 1-Jun-2025 | 13,100 | 2.25 |
| 1-Jun-2025 | 2,303 | 9.00 |
| 1-Jun-2026 | 13,500 | 1.50 |
| 1-Jun-2027 | 15,000 | 1.00 |
| 1-Jun-2027 | 4,036 | 8.00 |
| 1-Jun-2028 | 13,500 | 2.00 |
| 1-Jun-2029 | 9,000 | 2.25 |
| 1-Jun-2029 | 10,883 | 5.75 |
| 1-Jun-2033 | 12,274 | 5.75 |
| 1-Jun-2037 | 12,501 | 5.00 |
| 1-Jun-2041 | 14,484 | 4.00 |
| 1-Dec-2045 | 16,400 | 3.50 |
| 1-Dec-2048 | 14,900 | 2.75 |
| 1-Dec-2051 | 5,300 | 2.00 |
| 1-Dec-2064 | 4,750 | 2.75 |
| Fixed-coupon bonds—total | 507,162 |
| Maturity date | Amount ($ millions) |
Coupon rate (%) |
Inflation adjustment ($ millions) |
Outstanding amount ($ millions) |
|---|---|---|---|---|
| 1-Dec-2021 | 5,175 | 4.25 | 3,147 | 8,322 |
| 1-Dec-2026 | 5,250 | 4.25 | 2,736 | 7,986 |
| 1-Dec-2031 | 5,800 | 4.00 | 2,679 | 8,479 |
| 1-Dec-2036 | 5,850 | 3.00 | 1,738 | 7,588 |
| 1-Dec-2041 | 6,550 | 2.00 | 1,318 | 7,868 |
| 1-Dec-2044 | 7,700 | 1.50 | 1,199 | 8,899 |
| 1-Dec-2047 | 7,700 | 1.25 | 643 | 8,343 |
| 1-Dec-2050 | 4,400 | 0.50 | 123 | 4,523 |
| Real Return Bonds—total | 48,425 | 13,583 | 62,008 | |
| Note: Outstanding bond amounts reported in this table are in accordance with Bank of Canada reports, which may vary slightly with Government of Canada amounts due to differences in classification methods. Source: Bank of Canada. | ||||
| Swaps of domestic obligations | |||||
|---|---|---|---|---|---|
| Maturity date | USD | EUR | JPY | GBP | Total |
| 2019 | 1,757 | 787 | 553 | 1,685 | 4,782 |
| 2020 | 7,457 | 1,115 | 0 | 574 | 9,146 |
| 2021 | 4,642 | 5,508 | 0 | 0 | 10,150 |
| 2022 | 5,535 | 495 | 567 | 0 | 6,596 |
| 2023 | 8,147 | 525 | 2,218 | 148 | 11,038 |
| 2024 | 4,605 | 1,941 | 301 | 226 | 7,074 |
| 2025 | 3,407 | 285 | 0 | 4,166 | 7,858 |
| 2026 | 7,189 | 412 | 0 | 809 | 8,410 |
| 2027 | 2,839 | 1,649 | 0 | 2,453 | 6,942 |
| 2028 | 8,986 | 1,199 | 0 | 0 | 10,185 |
| 2029 | 802 | 149 | 0 | 0 | 952 |
| Total | 55,366 | 14,066 | 3,640 | 10,062 | 83,133 |
| Note: Foreign currency swaps converted to Canadian dollars using Bank of Canada closing exchange rates as of March 29, 2019. Includes cross-currency swaps related to IMF transactions. Table does not include $2,065 million in foreign exchange forwards and $10.7 million in foreign exchange swaps that were outstanding as at March 29, 2019. Totals may not add due to rounding. Source: Department of Finance Canada. |
|||||
| Borrowings from the market | 2010 | 2011 | 2012 | 2013 | 2014 | 2015 | 2016 | 2017 | 2018 | 2019 |
|---|---|---|---|---|---|---|---|---|---|---|
| Export Development Canada | 23,001 | 22,033 | 24,141 | 26,613 | 36,393 | 41,985 | 46,687 | 49,226 | 55,470 | 55,217 |
| Business Development Bank of Canada | 1,488 | 897 | 658 | 648 | 507 | 305 | 253 |
163 | 139 | 137 |
| Farm Credit Canada | 1,765 | 1,293 | 913 | 691 | 615 | 669 | 762 | 815 | 833 | 818 |
| Canada Mortgage and Housing Corporation | 4,421 | 3,039 | 2,221 | 1,870 | 1,465 | 1,429 | 282 | 0 | 0 | 0 |
| Canada Housing Trust1 | 180,440 | 199,238 | 213,251 | 212,639 | 205,113 | 207,544 | 217,392 | 225,306 | 233,981 | 237,516 |
| Canada Post Corporation | 90 | 1,051 | 1,051 | 1,051 | 1,051 | 1,051 | 997 | 997 | 997 | 997 |
| Other | 248 | 204 | 106 | 106 | 128 | 137 | 109 | 52 | 48 | 49 |
| Total | 211,453 | 227,755 | 242,341 | 243,617 | 245,272 | 253,120 | 266,482 | 276,559 | 291,469 | 294,734 |
| 1 Canada Housing Trust has been included in the government reporting entity effective April 1, 2005 as a result of the application of a new accounting standard. | ||||||||||
| 2010 | 2011 | 2012 | 2013 | 2014 | 2015 | 2016 | 2017 | 2018 | 2019 | |
|---|---|---|---|---|---|---|---|---|---|---|
| Business Development Bank of Canada |
12,245 | 13,223 | 12,561 | 13,214 | 14,320 | 15,676 | 16,942 | 18,811 | 20,470 | 22,235 |
| Canada Mortgage and Housing Corporation1 | 72,262 | 69,569 | 66,595 | 63,123 | 21,173 | 10,708 | 10,531 | 9,811 | 8,687 | 8,095 |
| Farm Credit Canada | 15,931 | 17,558 | 19,326 | 21,174 | 22,029 | 22,691 | 23,438 | 25,684 | 28,009 | 29,862 |
| Other | 132 | 122 | 92 | 90 | 149 | 333 | 340 | 455 | 468 | 5,2442 |
| Total | 100,570 | 100,472 | 98,574 | 97,602 | 57,670 | 49,408 | 51,251 | 54,761 | 57,633 | 65,436 |
| 1 Includes outstanding lending related to the Insured Mortgage Purchase Program for 2009 to 2014.
2 Includes lending to Canada Development Investment Corporation for the purchase of entities that own and operate the Trans Mountain pipeline. Source: Public Accounts of Canada. |
||||||||||
[1] Financial assets include securities, cash, receivables, advances etc. Non-financial assets include tangible capital assets, inventories and prepaid expenses.
[2] Approved Orders in Council (OIC) are available on the Privy Council Office website. The reference number for the 2018–19 OIC is 2018-0347.
[3] Non-market liabilities include pensions, other employee and veteran future benefits, and other liabilities.
[4] See the Bank of Canada website.
[5] Non-fungible securities do not share the same maturity dates with outstanding bond issues. The benchmark size for bonds that are fungible with existing bonds is deemed attained once the total amount of outstanding bonds for that maturity exceeds the minimum benchmark size.
[6] Data on foreign holdings of both Canadian-dollar-denominated and foreign currency instruments issued by the Government of Canada is collected by Statistics Canada from the Bank of Canada on new issues and through monthly and quarterly questionnaires of market participants on cross-border transactions.
[7] See the Bank of Canada website.
[8] See the Bank of Canada website.
[9] The turnaround time is the time taken between the submission of a bid and the return of the complete output to the auction participant. The Bank of Canada targets an average turnaround time of less than 3 minutes for auctions and less than 5 minutes for buyback operations. Maximum turnaround times are 5 minutes for auctions and 10 minutes for buyback operations.
[10] See the Bank of Canada website.
[11] The amount of new bonds issued through buybacks on a switch basis does not necessarily equal the amount of old bonds bought back through those operations because the exchange is not based on par value, but rather is on a duration-neutral equivalent basis.
[12] Tails are not calculated for Real Return Bond auctions since successful bidders are allotted bonds at the single-price equivalent of the highest real yield (single-price auction type) of accepted competitive bids. See Section 5 of the Standard Terms for Auctions of Government of Canada Securities.
[13] The Bank of Canada purchased 13 per cent of the amount issued at each nominal bond auction in 2018–19. A customer is a bidder on whose behalf a government securities distributor (GSD) has been directed to submit a competitive or non-competitive bid for a specified amount of securities at a specific price.
[14] The legislative purposes of Canada's foreign exchange reserves are to aid in the control and protection of the external value of the Canadian dollar and to provide a source of liquidity for the Government, if required.
[15] See press release on the Bank of Canada website for more details.