
Debt Management Report 2024-2025

Table of contents
- Foreword by the Minister of Finance and National Revenue
- Purpose of This Publication
- Executive Summary
- Part I: 2024-25 Debt Management Context
- Composition of Federal Debt
- Sources of Borrowings and Uses of Borrowings
- Borrowing Authorities
- Government of Canada Credit Rating Profile
- Part II: Report on Objectives, Strategic Direction and Principles of Debt Management
- Introduction
- Raising Stable and Low-Cost Funding
- Maintaining a Well-Functioning Government Securities Market
- Part III: Report on the 2024-25 Debt Program
- Domestic Marketable Bonds
- Treasury Bills and Cash Management Bills
- Foreign Currency Debt
- Cash Management
- Investment of Receiver General Cash Balances
- Annex 1: Debt Management Policy Measures Taken Since 2001
- Annex 2: Glossary
- Annex 3: Contact Information
- Reference Tables
Foreword by the Minister of Finance and National Revenue
I am pleased to table before Parliament the Debt Management Report for the 2024-25 fiscal year.
The world is rapidly changing and is increasingly uncertain. While external forces are reshaping the global economy, Canada retains the ability to chart its own economic course from a position of fiscal strength and resilience.
Canada's new government is modernizing the way we operate—spending less on operations so we can invest ambitiously and responsibly in Canada's future. Our focus is clear: creating high-paying careers, building our country, and growing our economy.
This approach is grounded in fiscal responsibility. We're making smart, strategic investments while preserving the advantage that comes from having the lowest net debt-to-GDP ratio of the G7, a strong fiscal position, and a clear path for long-term sustainability. Canada's AAA credit ratings ensure investor confidence, which keeps our borrowing costs as low as possible. These savings allow us to invest and build Canada's economy to be the strongest in the G7.
Every year, the federal government provides a report to Parliament and Canadians that details the government's domestic debt program. This report outlines the main activities of the government's borrowing program, as set out in the 2024-25 Debt Management Strategy, and is guided by the key principles of transparency, regularity, prudence, and liquidity. As in the past, we have continued to consult dealers and investors as part of the process for developing the debt management strategy.
Highlights for 2024-25 include additional purchases of $28.75 billion of Canada Mortgage Bonds, to generate savings to support spending on priorities like affordable housing, and a total of $4 billion in green bonds during 2024-25 issued over two transactions, supporting the growth of the sustainable finance market.
This report confirms that Canada's debt management operations continue to support the effective execution of the debt management program, contributing to the objectives of raising stable and low-cost funding, while maintaining a well-functioning market for Government of Canada securities.
The Honourable François-Philippe Champagne, P.C., M.P.
Minister of Finance and National Revenue
Ottawa, 2026
Purpose of This Publication
This edition of the Debt Management Report provides a detailed account of the Government of Canada's borrowing and debt management activities for the fiscal year ending March 31, 2025.
As required under Part IV (Public Debt) of the Financial Administration Act (the "FAA"), this publication provides transparency and accountability regarding these activities. It reports on actual borrowing and uses of funds compared to those forecast in the Debt Management Strategy for 2024-25, tabled on April 16, 2024, in Budget 2024. It also discusses the environment in which the debt was managed, the composition of the debt, changes in the debt during the year, strategic policy initiatives and performance outcomes.
Other Information
The Public Accounts of Canada is tabled annually in Parliament and is available on the Public Services and Procurement Canada website. The Debt Management Strategy and the Report on the Management of Canada's Official International Reserves, which are also tabled annually in Parliament, are available on the Department of Finance Canada website. Additionally, monthly updates on cash balances and foreign exchange assets are available through the Monthly OIR updates, and the Fiscal Monitor, which is also available on the Department of Finance Canada website. Under the Borrowing Authority Act (the "BAA"), the Minister of Finance (the "Minister") is required to table a report to Parliament every three years on amounts borrowed by the Minister on behalf of His Majesty in right of Canada, by way of issue and sale of Canada Mortgage Bonds guaranteed by the Canada Mortgage and Housing Corporation except if they are purchased by the Minister and are not resold other than for the purpose of providing a source of temporary liquidity, and by agent Crown corporations. The most recent report was tabled in Parliament on May 2, 2024, and is available on the Department of Finance Canada website.
Executive Summary
Introduction
This publication reports on two major activities: (i) the management of federal market debt (the portion of the debt that is borrowed in financial markets); and (ii) the investment of cash balances in liquid assets for operational purposes and contingency planning.
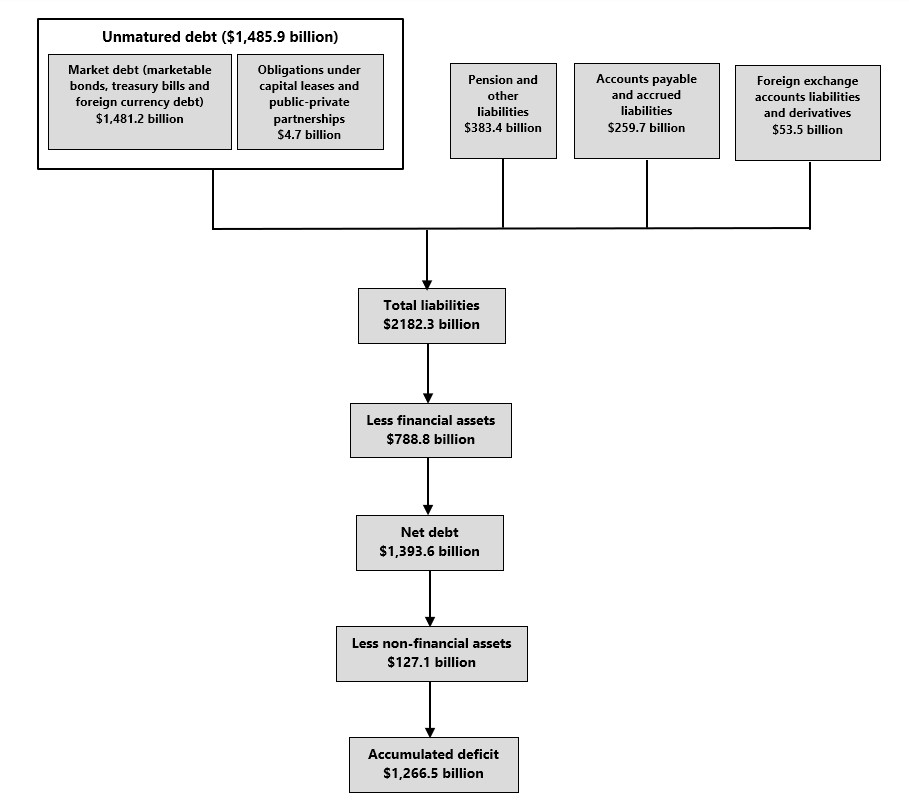
The government's total market debt, including marketable bonds, treasury bills and foreign currency debt, stood at $1,481.2 billion at the end of fiscal year 2024-25 (see Chart 1). When combined with other types of unmatured debt and liabilities, total liabilities of the Government of Canada was $2,182.3 billion. After accounting for financial and non-financial assetsFootnote 1, the net federal debt (accumulated deficit) was $1,266.5 billion as at March 31, 2025 (see Chart 1).
Domestic funding is conducted through the issuance of marketable securities, which consist of nominal bonds, green bonds and treasury bills (including cash management bills). All securities are sold through competitive auctions, except for green bonds, which are issued through a syndication process at the government's discretion. All the securities are sold to government securities distributors (GSDs)—a group of banks and investment dealers in the Canadian market—or to investors who submit bids through GSDs. These GSDs then facilitate the distribution and secondary-market trading of Government of Canada securities with their wholesale and retail clients. Government of Canada auctions continue to be well subscribed, which supports the low cost of funding for the government.
Government of Canada marketable securities are widely held by a wide range of investor, including pension funds, insurance companies, hedge funds and central banks. Overall, about 65.8 per cent of Government of Canada market debt was held by domestic investors. Participation of international investors in Government of Canada securities markets has grown over the last number of years and benefits Canadians, as this increases competition, broadens the diversity of the government's investor base, and ultimately reduces borrowing costs for Canadian taxpayers. Beyond maintaining low debt service ratios for the government, low and stable government borrowing costs translate into stable mortgage rates and certainty for businesses as they borrow to invest in job-creating expansion. Furthermore, provinces, pension funds and corporates use Government of Canada securities as a pricing reference for debt issuances. Low and stable costs for the Government of Canada translate into favourable borrowing conditions for all Canadians.
Cross-currency swaps and issuance of foreign currency debt are used exclusively to fund foreign reserve assets held in the Exchange Fund Account (see the section entitled "Foreign Currency Debt").
Federal Balance Sheet, as at March 31, 2025
Highlights for 2024-25
The Debt Management Report consists of three parts covering the main aspects of the Government of Canada's debt program. "Part I – 2024-25 Debt Management Context" focuses on the state of the accumulated deficit (i.e., federal debt), the year's financial requirements and the sources of borrowings used to raise funds, the federal government's credit ratings, and the authorities required to borrow. "Part II – Report on Objectives, Strategic Direction and Principles" reports on debt management objectives to implement the government's strategic direction to raise stable and low-cost funding to meet the financial needs of the Government of Canada, and to maintain a well-functioning market for Government of Canada securities. "Part III – Report on the 2024-25 Debt Program" reports on the operational aspects of the market debt program.
The 2024-25 debt management operations continue to support the effective execution of the debt management program. The main highlights are as follows:
Borrowing Program
In 2024-25, changes were made to the borrowing program in line with the debt management strategy, and in response to the evolving fiscal outlook. In Budget 2024, the government introduced, on a temporary basis, the 1-month treasury bill as a new tenor to support the Canadian money market's transition from Bankers' Acceptances following the cessation of the Canadian Dollar Offered Rate (CDOR) in June 2024.
In the Fall Economic Statement 2024, reflecting increased borrowing requirements and feedback received during the Debt Management Strategy consultations in the fall of 2024, the government increased issuance across all bond sectors and treasury bills, with the relative proportions of bond and bill issuances remaining in line with Budget 2024. In addition, the quarterly number of 2-year auctions increased to five, from four, for the fourth quarter of 2024-25.
Canada Mortgage Bonds
The government began purchases of the Canada Mortgage Bonds (CMBs) in February 2024 to raise revenues for affordable housing initiatives. In 2024-25, the Government of Canada purchased $28.75 billion of Canada Mortgage Bonds (CMBs).
To ensure transparency regarding its purchases and holdings of Canada Mortgage Bonds, the government publishes relevant information on these transactions on the Bank of Canada website.
Federal Green Bond Program
The Government of Canada issued a total of $4 billion in green bonds during 2024–25, matching the target set in Budget 2024. This comprised the October 2024 reopening for an additional $2 billion of the 10-year green bond first issued in February 2024, and a new $2 billion issuance of a 7-year green bond in February 2025.
Both issuances saw strong participation from environmentally and socially responsible investors and robust overall investor demand. The October 2024 issuance saw 53 per cent of bonds allocated to environmentally and socially responsible investors, while the final order book stood at over $3.8 billion. The February 2025 issuance saw 57 per cent of bonds allocated to these investors and had an order book over $3.1 billion.
Canada's green bond program is supporting the growth of the sustainable finance market both domestically and globally, while advancing Canada's investments in clean growth, renewable energy, climate action, and environmental protection. The government remains committed to regular green bond issuances.
Stock of Domestic Market Debt
The stock of domestic market debt increased by $109.3 billion in 2024-25, bringing the total debt stock to $1,481.2 billion. The change in the stock was comprised of a $81.7 billion increase in marketable bonds payable in Canadian dollars, a $19.3 billion increase in treasury and cash management bills, and a $8.3 billion increase in marketable debt payable in foreign currencies. Canada's general government net debt-to-GDP (gross domestic product) ratio was the lowest in the Group of Seven (G7) nations in 2024-25, according to the International Monetary Fund (IMF).
In 2024-25, as interest rates dropped, the weighted average rate of interest on market debt decreased to 2.76 per cent compared to 2.90 per cent in 2023-24. The decrease was mainly due to lower interest rates on treasury bills.
Strong Demand for Government of Canada Debt Securities
In 2024-25, the relative strength of the Canadian economy and its capital markets continued to support demand for Government of Canada securities in primary and secondary markets. Accordingly, treasury bill and bond auctions remained well-covered and competitively bid, providing an efficient manner for the government to raise funding. The publication of the Quarterly Bond Schedule before each quarter and the Call for Tenders before each auction helped maintain transparency. This promoted well-functioning markets for the government's securities to the benefit of a wide array of domestic market participants, contributing to the objective of raising stable and low-cost funding.
Part I: 2024-25 Debt Management Context
Composition of Federal Debt
In 2024-25, total market debt increased by $109 billion to $1,481.2 billion (see Table 1). For additional information on the financial position of the government, see the 2024-25 Annual Financial Report of the Government of Canada.
| 2025 | 2024 | Change | |
|---|---|---|---|
| Payable in Canadian currency1 | |||
| Marketable bonds | 1,169.4 | 1,087.7 | 81.7 |
| Treasury and cash management bills | 282.3 | 263.0 | 19.3 |
| Total payable in Canadian currency | 1,451.6 | 1,350.7 | 100.9 |
| Payable in foreign currencies | 29.6 | 21.2 | 8.3 |
| Total market debt | 1,481.2 | 1,371.9 | 109.3 |
| Market debt value adjustment, capital lease obligations and other unmatured debt | 4.7 | 4.9 | -0.2 |
| Total unmatured debt | 1,485.9 | 1,376.8 | 109.1 |
| Pension and other Liabilities | 383.4 | 368.7 | 14.7 |
| Total interest-bearing debt | 1,869.3 | 1,745.5 | 123.8 |
| Accounts payable, accruals and allowances | 259.7 | 264.1 | -4.4 |
| Foreign Liabilities and Derivatives | 53.3 | 48.2 | 5.0 |
| Total liabilities | 2,182.3 | 2,057.8 | 124.5 |
| Total financial assets | 788.8 | 705.0 | 83.8 |
| Total non-financial assets | 127.1 | 116.6 | 10.5 |
| Federal debt (accumulated deficit) | 1,266.5 | 1,236.2 | 30.2 |
Note: 1 The Bills and Bonds figures may differ slightly from those shown in other parts of this report, as they reflect adjustments for amortized cost and consolidation in the table. Numbers may not add due to rounding. Marketable bonds and treasury and cash management bills (payable in Canadian currency) and amounts payable in foreign currencies include accounting adjustments such as, adjustments to amortized cost and consolidation adjustment. Source: Public Accounts of Canada. |
|||
Sources of Borrowings and Uses of Borrowings
The key reference point for debt management is the financial requirement or financial source, which represents the net cash outflow or inflow for the fiscal year. This measure differs from the budgetary balance (i.e., the deficit or surplus on an accrual basis) by the amount of non-budgetary transactions and the timing of payments on a cash basis, which can be significant. Non-budgetary transactions include changes in federal employee pension liabilities; changes in non-financial assets; investing activities through loans, investments and advances; and changes in other financial assets and liabilities, including foreign exchange activities. Details on financial requirements can typically be found in Annex 1 ('Economic and Fiscal Projections') of Budget publications. Refinancing maturing debt, in combination with financial requirements, form most of the government's financing needs. Anticipated borrowing and planned uses of borrowings are set out in the Debt Management Strategy, while actual borrowing and uses of borrowings compared to those forecasted are reported in this publication (see Table 2).
There was a financial requirement of $130.0 billion in 2024-25, reflecting $36.3 billion in cash outflows due to a budgetary deficit and a cash outflow of $93.7 billion due to non-budgetary transactions, including $28.8 billion funding for purchases of Canada Mortgage Bonds. For comparison, the financial requirement in 2023-24 was $85.7 billion.Footnote 2
A number of Crown corporations receive debt funding under the Crown Borrowing Program. The Government of Canada borrows funds from the market and subsequently lends the funds to these Crown corporations at the government's cost of funding. In 2024-25, loans to the Business Development Bank of Canada, Canada Mortgage and Housing Corporation, and Farm Credit Canada under the Crown Borrowing Program were $106.0 billion, $11.0 billion higher than in 2023-24.
| Planned1 | Actual | Difference | |
|---|---|---|---|
| Sources of borrowings | |||
Payable in Canadian currency |
|||
Treasury bills |
272 | 285 | 13 |
Bonds |
228 | 247 | 19 |
Total payable in Canadian currency |
500 | 532 | 32 |
Payable in foreign currencies |
8 | 14 | 6 |
| Total cash raised through borrowing activities | 508 | 546 | 38 |
| Uses of borrowings2 | |||
| Refinancing needs | |||
Payable in Canadian currency |
|||
Treasury bills |
267 | 267 | 0 |
Bonds |
147 | 166 | 19 |
Of which: |
|||
Bonds that mature3 |
147 | 155 | 8 |
Switch bond buybacks |
0 | 0 | 0 |
Cash management bond buybacks |
0 | 11 | 11 |
Total payable in Canadian currency |
414 | 433 | 19 |
Payable in foreign currencies |
7 | 8 | 1 |
| Total refinancing needs | 421 | 441 | 20 |
| Financial source/requirement | |||
Budgetary balance |
40 | 36 | -4 |
Non-budgetary transactions |
|||
Pension and other accounts |
-6 | -9 | -3 |
Non-financial assets |
5 | 11 | 6 |
Loans, investments and advances |
|||
Of which: |
|||
Loans to enterprise Crown corporations4 |
42 | 61 | 19 |
Other |
6 | 7 | 1 |
Other transactions5 |
16 | 25 | 9 |
Total non-budgetary transactions |
62 | 94 | 32 |
| Total financial source/requirement | 102 | 130 | 28 |
| Total uses of borrowings | 523 | 571 | 48 |
| Change in other unmatured debt transactions6 | 0 | 5 | 5 |
| Net increase or decrease (-) in cash | -16 | -20 | -4 |
|
Note: Numbers may not add due to rounding. 1 Planned numbers are from the Debt Management Strategy for 2024–25 in Budget 2024. 2 A negative sign denotes a financial source. 3 The difference in planned vs. actual maturities reflects pre-financing activity which is not captured in the Public Accounts of Canada (source material for Actual maturities). 4 Loans to enterprise Crown corporations represent corporations under the Crown Borrowing Program. 5 Primarily includes the conversion of accrual adjustments into cash, such as tax and other account receivables; provincial and territorial tax collection agreements; and tax payables and other liabilities. 6 Includes cross-currency swap revaluation, unamortized discounts on debt issues, obligations related to capital leases and other unmatured debt, where this refers to in the table. Source: Department of Finance Calculations |
|||
Borrowing Authorities
In order to undertake market borrowing activities, the Minister needs authority from Parliament as well as the Governor in Council (the "GIC").
Under the Parliamentary borrowing authority framework enacted on November 23, 2017, Parliamentary authority is granted through the Borrowing Authority Act (BAA) and Part IV of the Financial Administration Act (FAA), which together allow the Minister to borrow money up to a maximum overall amount as approved by Parliament. The FAA also authorizes the Minister to borrow in excess of the approved maximum amount under limited circumstances for the specific purposes of refinancing outstanding debt, extinguishing or reducing liabilities, and making payments in extraordinary circumstances, such as natural disasters.
Subject to the noted limited exceptions, the maximum stock of borrowings approved by Parliament in effect from June 20, 2024 was $2,126 billion, which also includes amounts borrowed by agent Crown corporations, and Canada Mortgage Bonds guaranteed by Canada Mortgage and Housing Corporation (excluding amounts purchased by the Government of Canada). As at March 31, 2025, the outstanding borrowings subject to the maximum amount was $1,787.5 billion ($1,688.4 billion as at March 31, 2024).
Part IV of the FAA also requires the Minister to receive annual approval from the GIC to carry out borrowing for the Government of Canada for each fiscal year, including issuing securities in financial markets and undertaking related activities subject to a maximum aggregate amount. On the recommendation of the Minister, the GIC approved $604 billion to be the maximum aggregate principal amount of money that may be borrowed by the Minister in 2024-25 ($517 billion for fiscal year 2024). The maximum aggregate principal amount is the sum of the following: (i) the maximum stock of treasury bills anticipated to be outstanding during the year, ii) the total value of new issuances of marketable bonds, and iii) the total value of new issuances intended to fund the Exchange Fund Account, and (iv) a contingency margin to enable responses to changes in economic circumstances.
During 2024-25, $544.5 billion of the GIC-approved borrowing authority was used, $59.5 billion below the authorized borrowing authority limit.
Government of Canada Credit Rating Profile
Throughout 2024-25, the Government of Canada continued to benefit from high credit ratings from rating agencies, with a stable outlook, on Canadian-dollar and foreign-currency-denominated short- and long-term debt (see Table 3).
Canada's credit rating is supported by strong institutions, credible monetary policy, a strong fiscal position, a sound banking sector, an actively traded currency, and a wealthy, well diversified economy. These strengths are reflected in Canada's strong current credit ratings: Moody's (Aaa), S&P (AAA), Fitch (AA+), DBRS (AAA).
| Rating agency | Term | Domestic currency |
Foreign currency |
Outlook | Previous rating action |
|---|---|---|---|---|---|
| Moody's | Long-term Short-term |
Aaa - | Aaa - | Stable | Nov 2003 |
| Standard & Poor's | Long-term Short-term |
AAA A-1+ | AAA A-1+ | Stable | July 2002 |
| Fitch Ratings | Long-term Short-term |
AA+ F1+ | AA+ F1+ | Stable | June 2020 |
| Morningstar DBRS | Long-term Short-term |
AAA R-1 (High) | AAA R-1 (High) | Stable | n/a |
Source: Rating Agency Reports |
|||||
Part II: Report on Objectives, Strategic Direction and Principles of Debt Management
Introduction
The debt management objectives in 2024-25 were to raise stable and low-cost funding to meet the financial needs of the Government of Canada and to maintain a well-functioning market for Government of Canada securities.
The design and implementation of the domestic debt program are guided by the key principles of transparency, regularity, prudence, and liquidity. The structure of the market debt is managed conservatively in a cost-risk framework, preserving access to diversified sources of funding and supporting a broad investor base. Additionally, the government publishes strategies and plans and consults regularly with market participants to ensure the integrity, transparency, and attractiveness of the market for dealers and investors.
As a stable, strategic issuer, the Government of Canada made marginal adjustments to the overall strategy relative to 2023-24. In Budget 2024, the Government of Canada announced its decision to introduce the
1-month treasury bill temporarily as a new tenor for the domestic debt program to support the Canadian money market's transition from Bankers' Acceptances, following the cessation of Canadian Dollar Offered Rate (CDOR) in June 2024.
Raising Stable and Low-Cost Funding
In general, achieving stable and low-cost funding involves striking a balance between debt costs and various risks in the debt structure. This selected balance between cost and risk is mostly achieved through the deliberate allocation of issuance among various debt instruments and terms.
Market Debt Issuance in 2024-25
In 2024-25, total bond issuance was $241 billion, up from $204 billion in 2023-24, reflecting higher financial requirements, including funding for Canada Mortgage Bonds. As a result, issuance in all sectors was higher than projected in Budget 2024. There was a modest reallocation from short-term to long-term tenors with long-term issuance rising to $80.0 billion in 2024-25 from $61.0 billion in 2023-24. On a percentage basis, the share of bond issuance made up by long-term bonds rose slightly to 33 per cent in 2024-25, from 30 per cent in 2023-24 (see Table 4.2).
| 2023-24 Actual | 2024-25 Planned | 2024-25 Actual | Difference between Actual and Planned | 2024-25 Actual vs 2023-24 % change | |
|---|---|---|---|---|---|
| Treasury Bills | 267 | 272 | 285 | 13 | 7% |
| 2-year | 86 | 88 | 94 | 6 | 9% |
| 3-year | 6 | 0 | 0 | 0 | NA |
| 5-year | 47 | 60 | 63 | 3 | 34% |
| 10-year | 47 | 60 | 63 | 3 | 34% |
| 30-year | 14 | 16 | 17 | 1 | 21% |
| Green Bonds | 4 | 4 | 4 | 0 | 0% |
| Total Bonds | 204 | 228 | 241 | 13 | 18% |
| Total Gross Issuance | 471 | 500 | 526 | 26 | 12% |
1 Issuance is estimated from Bank of Canada data, using issuance date to determine the amount issued in each sector and fiscal year, consistent with Bank of Canada methodology. The use of issuance date instead of auction date results in slight differences in some sectors. Source: Bank of Canada, Department of Finance Calculations |
|||||
| 2023-24 Previous Year | 2024-25 Actual | |||
|---|---|---|---|---|
| Issuance ($ billions) | Share of Bond Issuance | Issuance ($ billions) | Share of Bond Issuance | |
| Short (2, 3, 5-year sectors) | 139 | 68% | 157 | 65% |
| Long (10-year+) | 61 | 30% | 80 | 33% |
| Green bonds | 4 | 2% | 4 | 2% |
| Gross bond issuance | 204 | 100% | 241 | 100% |
|
Source: Bank of Canada. Department of Finance calculations |
||||
Cost of Market Debt
Annual interest rate costs on unmatured market debt remain the largest component of public debt charges, which also include interest on non-market liabilities.Footnote 3 The weighted average rate of interest on the stock of market debt declined to 2.76 per cent in 2024-25, from 2.90 per cent in 2023-24, primarily reflecting lower Treasury bill rates (Chart 3.1).
While public debt charges are sizeable on an absolute basis at over $53 billion, context is important. In 2024-25, the Government of Canada's total government expenses were $547 billion. This amount includes supports for health expenditures, equalization payments, employment insurance and more. Public debt charges as a share of total government expenses were 9.74 per cent in 2024-25, up from 9.07 per cent in 2023-24 (see Chart 3.1). Public debt charges should also be considered relative to GDP, as the government's capacity to service debt increases with growth in GDP—on this basis, Canada's debt costs remain relatively low compared to recent decades (see Chart 3.2).
Public Debt Charges and Average Effective Interest Rate

Public Debt Charges as a percentage of GDP, 1984-2029

Market Debt Composition: Ensuring Stable Funding
Market Debt Composition
The composition of the stock of market debt reflects past debt issuance choices. The effect of changes in issuance patterns of short-term debt instruments become visible relatively quickly, while the full effect of issuance changes in longer-term debt instruments takes the entire maturity period to be fully appreciated
(e.g., over the last 30 years for the 30-year sector). A well-distributed maturity profile helps maintain a prudent risk exposure to changes in interest rates over time at an affordable cost, while promoting well-functioning markets by providing liquidity across different maturity sectors.
In 2024-25, the proportion of debt with remaining maturity of more than 5 years remained stable at 39 per cent from 2023-24 (Chart 3). This stable pattern reflects the Government of Canada's objective of remaining a stable, predictable issuer in the bond market.
Composition of Market Debt by Remaining Term to Maturity, as at March 31

Average Term to Maturity
In 2024-25, the ATM remained in line with 2023-24, at 6.5 years, a level that reflects the government's risk tolerance (i.e., rollover) that is appropriately balanced with debt servicing costs (see Chart 4.1) Footnote 4.
Average Term to Maturity of Government of Canada Market Debt

Canada's ATM is also in line with its peers, particularly given its relatively lower market debt-to-GDP ratio. This points to a prudent debt structure relative to other G7(+Australia) countries (see Chart 4.2).Footnote 5
Weighted ATM vs Gross Market Debt to GDP

Debt Rollover: Quarterly Maturities to GDP
Debt rollover, measured as the amount of debt maturing per quarter as a percentage of GDP, increased to an average of 7.1 per cent in 2024-25 from an average of 5.8 per cent in 2023-24. In comparison, the average debt rollover for the previous decade was 5.4 per cent (see Chart 5). The increase in 2024-25 primarily reflected the large maturities associated with the COVID-era five-year issuances.
Quarterly Maturities of Domestic Market Debt as a percentage of GDP

Debt Rollover: Single-Day Maturities
The government reduced the number of maturity dates in 2024-25 from 9 dates to 8 dates, as a result of the complete phasing out of the 3-year bonds. Reflecting the significant increase in debt during the COVID pandemic period, single-day maturities remain high relative to historical averages. The government monitors the level of single-day maturities and treasury managers use various levers to effectively manage Government of Canada cash flows ahead of large debt maturities.
The benchmark maturity date profile is as follows:
- 2-year bonds: February 1, May 1, August 1, November 1
- 5-year bonds: March 1, September 1
- 10-year bonds: June 1, December 1
- 30-year bonds: December 1 (note: while Real Return Bonds and nominal 30-year bonds both mature on December 1, they mature in alternative years).
Prudent management of debt promotes investor confidence, while at the same time, minimizes the impact of market volatility. Based on some of the key refinancing risk indicators—such as average term-to-maturity (ATM) and debt rollover—the Government of Canada's market debt remained robust through 2024-25 when compared to historical averages.
Maintaining a Well-Functioning Government Securities Market
A well-functioning market for Government of Canada supports the government's ability to raise stable, low-cost funding and maintain reliable access to financing over time. This flexibility enables the government to meet changing financial requirements.
For market participants, a liquid and transparent secondary market in government debt instruments provides risk-free assets for investment portfolios as well as a benchmark to other domestic fixed-income markets (e.g., provinces, municipalities and corporations). Additionally, it can also be used as a tool for hedging interest rate risk.
Providing Regular and Transparent Issuance
To promote transparency, the Government of Canada announces bond auction schedules prior to the start of each quarter, published in the Quarterly Bond Schedule on the Bank of Canada website. Details for each operation are also provided in a Call for Tender in the week prior to an auction.Footnote 6 In 2024-25, there were regular auctions for 2-, 5-, 10- and 30-year bonds.
Concentrating on Key Benchmarks
The Government of Canada continues to focus on core sectors for issuance. In general, benchmark bond sizes in 2024-25 met the benchmark target ranges(see Chart 6).Footnote 7 Compared to 2023-24, the benchmark target sizes for all bond sectors in 2024-25 were larger:
- 2-year bonds: $24 billion to $32 billion
- 5-year bonds: $30 billion to $36 billion
- 10-year bonds: $32 billion to $40 billion
- 30-year nominal bonds: $22 billion to $32 billion
Size of Gross Bond Benchmarks in 2024-2025

Ensuring a Broad Investor Base in Government of Canada Securities
A diversified investor base supports an active secondary market for Government of Canada securities, thereby helping to keep funding costs low and stable. Diversification of the investor base is pursued by maintaining a domestic debt program that issues securities in a wide range of maturity sectors, which meet the needs of different investor types.
During 2024-25, domestic investors (including the Bank of Canada) held about 65 per cent of Government of Canada securities (see Chart 7). Among domestic investors, the Bank of Canada held the largest share of Government of Canada securities (17 per cent), followed by insurance companies and pension funds (15 per cent). Taken together, these top two categories accounted for 32 per cent of outstanding Government of Canada securities in 2024-25, compared to 36 per cent in 2023-24.
In 2024-25, non-resident investors held 35 per cent of Government of Canada securitiesFootnote 8, up from 28 per cent in the previous year. This share of non-resident holdings of government securities is in line with the average share for G7 countries (see Chart 8).
Distribution of Government of Canada Securities

Percentage of Total Marketable Debt of G7 Countries Held by Non-Residents

Consulting With Market Participants
Formal consultations with market participants are held at least once a year to obtain their views on the design of the borrowing program and on the liquidity and efficiency of the Government of Canada's securities markets.
During the consultations held in September 2024, the Department of Finance and the Bank of Canada attended bilateral in-person meetings and received written comments from dealers, investors and other relevant market participants. These consultations sought the views of market participants on issues related to the design and operation of the Government of Canada's domestic debt program and helped to inform the Debt Strategy Management Strategy for 2025-26.
During the fall 2024 consultations, participants continued to view the Government of Canada securities market as functioning well, with competition for market share among dealers remaining strong. In general, participants were satisfied with the supply of each bond tenor.
In the treasury bill sector, participants noted that demand remained high for the 3-, 6- and 12-month tenors. Many participants noted that while the introduction of the 1-month treasury bill supported the Canadian money market's transition away from Bankers' Acceptances over the summer of 2024, there had since been a decrease in demand for the tenor, indicating it could even be discontinued. (In line with this, the 1-month treasury bill was terminated on July 29, 2025.)
Details on these discussions are available in the Fall 2024 Debt Management Strategy Consultations Summary, published on the Bank of Canada website on December 16, 2024.Footnote 9
Securities Distribution System
As the government's fiscal agent, the Bank of Canada distributes Government of Canada marketable bills and bonds by auction to government securities distributors (GSDs) and customers. GSDs that meet certain standards in the primary and secondary markets for Government of Canada securities may become primary dealers (PDs), which form a select core group of distributors for Government of Canada securities. To maintain a well-functioning securities distribution system, government securities auctions are monitored to ensure that GSDs abide by the terms and conditions.Footnote 10
Quick turnaround times enhance the efficiency of auctions and reduce market risk for participants. In 2024-25, the turnaround time for treasury bill and bond auctions averaged 50.4 seconds. The average turnaround time in 2023-24 was 51 seconds.Footnote 11
Monitoring Secondary Market Trading in Government of Canada Securities
Two important measures of liquidity and efficiency in the secondary market for Government of Canada securities are trading volume and turnover ratio.
Trading volume represents the amount of securities traded during a specific period (e.g., daily). Large trading volumes typically indicate that participants can buy or sell in the marketplace without a substantial impact on the price of the securities and generally imply lower bid-offer spreads.
The average daily trading volume in the secondary market for Government of Canada's bonds during 2024-25 was $64.3 billion, up $17.7 billion from 2023-24 (see Chart 9).
Government of Canada Bond Average Daily Trading Volumes

Turnover ratio, which is the ratio of securities traded relative to the number of securities outstanding, measures market depth. High turnover implies that a large proportion of securities change hands for a given amount available in the market, which is an indication of a liquid market.
In 2024-25, the annualized monthly debt stock turnover ratio in the Government of Canada secondary bond market, calculated as annualized monthly trading volume divided by total debt stock, increased to 14.4x from 11.4x in 2023-24. The sectors with the highest monthly turnover during the fiscal year were short-term bonds with maturities under 3 years at 17.9x, while Real Return Bonds had the lowest turnover at 0.2x (see Chart 10).
Government of Canada Bond Turnover Ratio by Term to Maturity
Annualized Monthly Trading Volume / Total Bond Stock

Supporting Secondary Market Liquidity
The Bank of Canada operates programs to support the liquidity of Government of Canada securities markets. On October 2, 2024, the Bank of Canada launched its Securities Lending Program (SLP) to replace its Securities Repo Operations (SRO), which was discontinued.Footnote 12 This provides a temporary source of Government of Canada nominal bonds and treasury bills to primary dealers to support liquidity in the securities financing market. In 2024-25, the Bank of Canada conducted 127 SRO operations and 123 SLP operations—for a total of 250 operations—compared to 247 SRO operations in 2023-24.
Cash Management Bond Buyback (CMBB) program
The government announced the resumption of the Government of Canada Cash Management Bond Buyback program in November 2022. This treasury management operation is intended to effectively manage the government's cash flows ahead of large bond maturities.
The government conducted $14.7 billion in cash management bond buybacks in 2024-25, while $7.4 billion were conducted in 2023-24.
Part III: Report on the 2024-25 Debt Program
Treasury bill and bond auctions performed well and demand for Government of Canada securities remained strong throughout the fiscal year due to persistent demand for high-quality sovereign debt securities and Canada's strong fiscal and economic position.
Domestic Marketable Bonds
Bond Program
In 2024-25, gross bond issuance was $237.0 billion, $33.2 billion higher than the $203.8 billion issued in 2023-24 (see Table 5).
| 2019-20 | 2020-21 | 2021-22 | 2022-23 | 2023-24 | 2024-25 | |
|---|---|---|---|---|---|---|
| Nominal (Auction) | 122.4 | 368.5 | 247.0 | 184.5 | 203.8 | 241.0 |
| Nominal (switch) | 2.8 | 0.0 | 0.0 | 0.0 | 0.0 | 0.0 |
| Real Return Bonds | 1.8 | 1.4 | 1.4 | 0.7 | 0.0 | 0.0 |
| Total Gross Issuance | 127.0 | 369.9 | 248.4 | 185.2 | 203.8 | 241.0 |
| Cash buyback | 0.0 | 0.0 | 0.0 | 0.0 | 0.0 | 0.0 |
| Switch buyback | -2.8 | 0.0 | 0.0 | 0.0 | 0.0 | 0.0 |
| Total buyback | -2.8 | 0.0 | 0.0 | 0.0 | 0.0 | 0.0 |
| Net Issuance | 124.2 | 369.9 | 248.4 | 185.2 | 203.8 | 241.0 |
Note: Numbers may not add due to rounding. Source: Bank of Canada. |
||||||
Auction Result Indicators for Domestic Bonds
A total of 48 nominal bond auctions were conducted in 2024-25, compared to 49 bond auctions conducted in 2023-24.
The auction tail represents the number of basis points between the highest yield accepted and the average yield of an auction. A small auction tail is preferable as it is generally indicative of better transparency in the pricing of securities. Average auction tails were somewhat smaller than the 5-year average across all maturities.
Auction coverage is defined as the total amount of bids received, including bids from the Bank of Canada, divided by the amount auctioned. All else being equal, a higher auction coverage level typically reflects strong demand and therefore should result in a lower average auction yield. Bond auction coverage was somewhat lower than the 5-year average for all maturities (see Table 6).
| Nominal Bonds | |||||
|---|---|---|---|---|---|
| 2-Year | 5-Year | 10-Year | 30-Year | ||
| Tail | 2024-25 | 0.24 | 0.30 | 0.42 | 0.40 |
| 5-year average | 0.26 | 0.41 | 0.57 | 0.52 | |
| Coverage | 2024-25 | 2.39 | 2.27 | 2.18 | 2.23 |
| 5-year average | 2.42 | 2.39 | 2.25 | 2.36 | |
Notes: Tail represents the number of basis points between the highest yield accepted and the average yield of an auction. Coverage is defined as the total amount of bids received, including bids from the Bank of Canada, divided by the amount auctioned. Source: Bank of Canada. |
|||||
Participation at Domestic Bond Auctions
In 2024-25, primary dealers' allotments for nominal bonds decreased to 55 per cent from 60 per cent in 2023-24, with customer allocations increasing from 40 per cent to 45 per cent (see Table 7), excluding the Bank of Canada's allotment.Footnote 13 In aggregate, the 10 most active participants were in total allotted 77 per cent of nominal bonds auctioned in 2024-25.
| Participant Type | 2020–21 | 2021–22 | 2022–23 | 2023-24 | 2024-25 | |||||
|---|---|---|---|---|---|---|---|---|---|---|
| ($ billions) | (%) | ($ billions) | (%) | ($ billions) | (%) | ($ billions) | (%) | ($ billions) | (%) | |
| PDs | 237 | 64 | 140 | 63 | 117 | 63 | 120 | 60 | 129 | 55 |
| Non-PD GSDsFootnote 14 | 0 | 0 | 0 | 0 | 0 | 0 | 0 | 0 | 0 | 0 |
| Customers | 135 | 36 | 84 | 38 | 67 | 36 | 80 | 40 | 107 | 45 |
| Top 5 participants | 207 | 56 | 112 | 50 | 96 | 52 | 102 | 51 | 126 | 53 |
| Top 10 participants | 299 | 80 | 168 | 75 | 144 | 78 | 153 | 76 | 183 | 77 |
| Total nominal bonds issued | 373 | 223 | 185 | 200 | 237 | |||||
Source: Bank of Canada. Note: Numbers do not add up due to rounding. |
||||||||||
Treasury Bills and Cash Management Bills
During 2024-25, $663 billion in treasury bills were issued, an increase of $94 billion from the previous year of $569 billion. In addition, $71.5 billion cash management bills were issued in 2024-25, compared to $19 billion in 2023-24. There were 20 cash management bill operations for 2024-25, compared to 5 in 2023-24. As at March 31, 2025, the combined treasury bill and cash management bill stock totaled $285.2 billion (20.1 per cent of total marketable domestic debt), an increase of $17.8 billion from the end of 2023-24 (see Chart 11).
Treasury Bills Outstanding and as a Share of Marketable Domestic Debt

In 2024-25, all treasury bill and cash management bill auctions were fully covered with an average coverage ratio of 2.05. Auctions tails were somewhat lower than the 5-year average for both treasury bills and cash management bills, though coverage ratios for treasury bill auctions in 2024-25 were somewhat lower than the
5-year average for all treasury bill maturity sectors and for cash management bills (see Table 8).
| 3-Month | 6-Month | 12-Month | Cash Management Bills | ||
|---|---|---|---|---|---|
| Tail | 2024-25 | 0.70 | 0.68 | 0.98 | 1.68 |
| 5-year average | 0.78 | 0.76 | 0.91 | 1.74 | |
| Coverage | 2024-25 | 1.85 | 2.09 | 2.03 | 2.05 |
| 5-year average | 1.97 | 2.22 | 2.23 | 2.12 | |
Notes: Tail represents the number of basis points between the highest yield accepted and the average yield of an auction. Coverage is defined as the total amount of bids received, including bids from the Bank of Canada, divided by the amount auctioned. Tail and coverage ratio were calculated as the weighted averages, where the weight assigned to each auction equals the percentage total allotment in the auction's issuance sector. Source: Bank of Canada. |
|||||
Participation at Treasury Bill Auctions
In 2024-25, the share of treasury bills allotted to primary dealers increased to 71 per cent from 59 per cent in 2023-24, while the share allotted to customers decreased to 29 per cent from 41 per cent (see Table 9). The 10 most active participants were allotted 89 per cent of these securities.
| Participant Type | 2020–21 | 2021–22 | 2022–23 | 2023–24 | 2024–25 | |||||
|---|---|---|---|---|---|---|---|---|---|---|
| ($ billions) | (%) | ($ billions) | (%) | ($ billions) | (%) | ($ billions) | (%) | ($ billions) | (%) | |
| PDs | 543 | 84 | 318 | 74 | 258 | 62 | 347 | 59 | 523 | 71 |
| Non-PD GSDs | 0 | 0 | 0 | 0 | 0 | 0 | 0 | 0 | 0 | 0 |
| Customers | 103 | 16 | 114 | 26 | 157 | 38 | 240 | 41 | 210 | 29 |
| Top 5 participants | 431 | 67 | 260 | 60 | 249 | 60 | 355 | 60 | 456 | 62 |
| Top 10 participants | 577 | 89 | 379 | 88 | 350 | 84 | 501 | 85 | 652 | 89 |
| Total Treasury Bills Issued | 646 | 432 | 416 | 588 | 734 | |||||
Note: Numbers may not add due to rounding. 1 Net of Bank of Canada allotment. Source: Bank of Canada. |
||||||||||
Foreign Currency Debt
Foreign currency debt is used exclusively to fund the Exchange Fund Account (EFA), which represents the largest component of the official international reserves. The primary objectives of the international reserves are to aid in the control and protection of the external value of the Canadian dollar and provide a source of liquidity to the Government of Canada, if required.
The EFA is primarily made up of liquid foreign currency securities and special drawing rights (SDRs). Liquid foreign currency securities are composed primarily of debt securities of highly rated sovereigns, their agencies that borrow in public markets and are supported by a comprehensive government guarantee, and highly rated supranational organizations. SDRs are international reserve assets created by the IMF, the value of which is based on a basket of international currencies. The official international reserves also include Canada's reserves position at the IMF. This position, which represents Canada's investment in the activities of the IMF, fluctuates according to drawdowns and repayments from the IMF. The Report on the Management of Canada's Official International Reserves provides information on the objectives, composition and performance of the reserves portfolio.
The market value of Canada's official international reserves as at March 31, 2025 increased to US$126.0 billion from US$118.0 billion as at March 31, 2024, while EFA assets totaled US$120.4 billion as at March 31, 2025, up from US$113.3 billion as at March 31, 2024. Liquid foreign currency securities amounted to US$97.8 billion, which is consistent with the government's commitment to maintain these holdings at or above 3 per cent of nominal GDP.
The EFA is funded by liabilities of the Government of Canada denominated in, or converted to, foreign currencies. Funding requirements are primarily met through an ongoing program of cross-currency swaps funded by domestic issuances. As at March 31, 2025, Government of Canada cross-currency swaps outstanding stood at US$80.2 billion (par value).
In addition to cross-currency swaps funded by domestic issuances, the EFA is funded through a short-term
US-dollar paper program (Canada bills) and a global bond program. Funding approaches for the EFA vary by year, depending on funding needs, costs, market conditions and funding diversification objectives (see Table 10).
| March 31, 2025 | March 31, 2024 | Change | |
|---|---|---|---|
| Swapped domestic issues | 80,203 | 78,532 | 1,671 |
| Global bonds | 17,500 | 14,000 | 3,500 |
| Canada bills | 2,926 | 1,604 | 1,322 |
| Total | 100,629 | 94,136 | 6,493 |
Note: Liabilities are stated at the exchange rates prevailing on March 31, 2025. Source: Department of Finance Canada. |
|||
As at March 31, 2025, the Government of Canada had five global bonds outstanding (see Table 11).
| Year of issuance | Amount in original currency | Term to maturity (years) |
Coupon (%) |
Benchmark interest rate—government bonds |
Spread from benchmark at issuance (basis points) |
|
|---|---|---|---|---|---|---|
| 2021 | US$3.5 billion | 5 | 0.750 | US Treasury | 6.0 | |
| 2022 | US$3.5 billion | 3 | 2.875 | US Treasury | 9.0 | |
| 2023 | US$4.0 billion | 5 | 3.750 | US Treasury | 11.0 | |
| 2024 | US$3.0 billion | 5 | 4.625 | US Treasury | 10.0 | |
| 2025 | US$3.5 billion | 5 | 4.000 | US Treasury | 11.0 | |
|
Source: Department of Finance Canada. |
||||||
Cash Management
The Bank of Canada, as the government's fiscal agent, manages the Receiver General (RG) Consolidated Revenue Fund, from which the balances required for the government's day-to-day operations are drawn. The core objective of cash management is to ensure that the government has sufficient cash available, at all times, to meet its operating requirements.
Cash consists of money on deposit to the credit of the RG for Canada with the Bank of Canada. Cash with the Bank of Canada includes RG operating balances, and a $20 billion callable demand deposit held for the prudential liquidity plan.
In 2024-25, the year-end daily liquidity position decreased by $22.1 billion to $40.9 billion (see Chart 12 and Table 12), reflecting lower liquidity needs.
Daily Liquidity Position for 2024-2025

| March 31, 2024 | March 31, 2025 | Average | Net Change | |
|---|---|---|---|---|
| Callable deposits with the Bank of Canada | 20.0 | 20.0 | 20.0 | 0.0 |
| Balances with the Bank of Canada | 35.0 | 5.0 | 14.1 | -30.0 |
| Balances with financial institutions | 8.0 | 15.9 | 9.0 | 7.9 |
| Total | 63.0 | 40.9 | 43.2 | -22.1 |
|
Note: Numbers may not add due to rounding. Source: Bank of Canada. |
||||
Prudential Liquidity Management
The government holds liquid financial assets in the form of domestic cash deposits and foreign exchange reservesFootnote 15 to safeguard its ability to meet payment obligations in situations where normal access to funding markets may be disrupted or delayed. This promotes investor confidence. The government's overall liquidity levels are managed to normally cover at least one month (i.e., 23 business days) of net projected cash flows, including coupon payments and debt refinancing needs. The 23-day liquidity requirement is a forward-looking measure that changes daily due to daily actual cash balances and new projected cash requirements.
Investment of Receiver General Cash Balances
In April 2022, the Bank indefinitely moved to a floor system of conducting monetary policy, which it implemented on March 23, 2020. Prior to the COVID-19 crisis, the Bank implemented monetary policy through
a corridor system.
Under a corridor system, the Bank targets only a small amount of excess settlement balances. This creates an occasional need to inject liquidity into the payment system by auctioning off government funds that are in excess of the government's day-to-day operating needs and prudential liquidity plan. The Bank's auction of Receiver General cash balances to payment system participants thus allows participants to settle their payments without needing overnight advances from the Bank.
Conversely, under a floor system, the Bank does not target a specific level of settlement balances but instead provides a supply that is sufficiently large. Payment system participants can use these excess settlement balances to fund payments during the day.
Morning auctions of Receiver General cash balances were reintroduced on February 21, 2024. These operations were previously suspended in August 2020 due to lack of participation.
There were 250 RG auctions conducted in 2024-25, compared to 26 in 2023-24.
Annex 1: Debt Management Policy Measures Taken Since 2001
The fundamental objectives of debt management are to raise stable and low-cost funding to meet the financial needs of the Government of Canada and to maintain a well-functioning market for Government of Canada securities. For the government as a debt issuer, a well-functioning market attracts investors and contributes to keeping funding costs low and stable over time. For market participants, a liquid and transparent secondary market in government debt provides risk-free assets for investment portfolios, a pricing benchmark for other debt issues and derivatives, and a primary tool for hedging interest rate risk. The following table lists significant policy measures that have been taken to achieve stable, low-cost funding and ensure a well-functioning Government of Canada securities market.
| Measure | Year |
|---|---|
| Introduced a switch-based bond buyback program | 2001 |
| Allowed the reconstitution of bonds beyond the size of the original amount issued | 2001 |
| Introduced the cash management bond buyback program | 2001 |
| Reduced targeted turnaround times for auctions and buyback operations | 2001 |
| Advanced the timing of treasury bill auctions from 12:30 p.m. to 10:30 a.m. | 2004 |
| Advanced the timing of bond auctions from 12:30 p.m. to 12:00 p.m. | 2005 |
| Reduced the timing between bond auctions and cash buybacks to 20 minutes | 2005 |
| Dropped one quarterly 2-year auction | 2006 |
| Announced the maintenance of benchmark targets through fungibility (common dates) | 2006 |
| Consolidated the borrowings of three Crown corporations | 2007 |
| Changed the maturity of the 5-year benchmark and dropped one quarterly 5-year auction | 2007 |
| Reintroduced the 3-year bond benchmark | 2009 |
| Increased the frequency of cash management bond buyback operations from bi-weekly to weekly | 2010 |
| Announced a new framework for the medium-term debt management strategy | 2011 |
| Announced plans to increase the level of prudential liquidity by $35 billion over 3 years | 2011 |
| Added four new maturity dates—February 1, May 1, August 1 and November 1 | 2011 |
| Increased benchmark target range sizes in the 2-, 3- and 5-year sectors | 2011 |
| Announced a temporary increase in longer-term debt issuance | 2012 |
| Announced changes to the Terms and Conditions Governing the Morning Auction of Receiver General Cash Balances | 2013 |
| Introduced ultra-long bond issuance | 2014 |
| Discontinued 3-year issuance | 2015 |
| Reintroduced the 3-year bond benchmark | 2016 |
| Introduced a pilot program to increase flexibility in the maximum repurchase amount at CMBB operations | 2017 |
| Discontinued the sales of new Canada Savings Bonds | 2017 |
| Pilot program to increase flexibility of CMBB operations made permanent | 2018 |
| Ceased all buyback operations and RG auctions | 2020 |
| Added a second 10-year benchmark bond per year—December 1 | 2020 |
| Increased the frequency of treasury bills auctions from bi-weekly to weekly (i.e., first half of the fiscal year) | 2020 |
| Reduced the frequency of treasury bills auctions from weekly to bi-weekly (i.e., second half of the fiscal year) | 2020 |
| Introduced federal green bond program | 2022 |
| Discontinued the Real Return bond program | 2022 |
| Discontinued 3-year issuance | 2023 |
| Updated the green bond framework to include certain nuclear expenditures | 2023 |
| Introduced 1-month treasury bill to support the CORRA transition | 2024 |
Annex 2: Glossary
average term to maturity (ATM): The weighted average amount of time until the securities in the debt portfolio mature.
benchmark bond: A bond that is considered by the market to be the standard against which all other bonds in that term area are evaluated against. It is typically a bond issued by a sovereign, since sovereign debt is usually the most creditworthy within a domestic market. Usually, it is the most liquid bond within each range of maturities and is therefore priced accurately.
budgetary deficit: The shortfall between government annual revenues and annual budgetary expenses.
buyback on a cash basis: The repurchase of bonds for cash. Buybacks on a cash basis are used to maintain the size of bond auctions and new issuances.
buyback on a switch basis: The exchange of outstanding bonds for new bonds in the current building benchmark bond.
Canada bill: A promissory note denominated in US dollars, issued for terms of up to 270 days. Canada bills are issued for foreign exchange reserves funding purposes only.
Canada note: A promissory note usually denominated in US dollars, and available in book-entry form. Canada notes can be issued for terms of nine months or longer and can be issued at a fixed or a floating rate. Canada notes are issued for foreign exchange reserves funding purposes only.
Canada Savings Bond: A non-marketable security instrument issued by the Government of Canada, which is redeemable on demand by the registered owner(s), and which, after the first three months, pays interest up to the end of the month prior to cashing.
cross-currency swap: An agreement that exchanges one type of debt obligation for another involving different currencies and the exchange of the principal amounts and interest payments.
Exchange Fund Account (EFA): An account that aids in the control and protection of the external value of the Canadian dollar and which provides a source of liquidity for the Government of Canada. Assets held in the EFA are managed to provide liquidity to the government and to promote orderly conditions for the Canadian dollar in the foreign exchange markets, if required.
financial source/requirement: The difference between the cash inflows and outflows of the government's Receiver General account. In the case of a financial requirement, it is the amount of new borrowing required from outside lenders to meet financing needs in any given year.
foreign exchange reserves: The foreign currency assets (e.g. interest-earning bonds) held to support the value of the domestic currency. Canada's foreign exchange reserves are held in the Exchange Fund Account.
government securities distributor (GSD): An investment dealer or bank that is authorized to bid at Government of Canada auctions and through which the government distributes Government of Canada treasury bills and marketable bonds.
interest-bearing debt: Debt consisting of unmatured debt, or debt issued on the credit markets, liabilities for pensions and other future benefits, and other liabilities.
marketable bond: An interest-bearing certificate of indebtedness issued by the Government of Canada, having the following characteristics: bought and sold on the open market; payable in Canadian or foreign currency; having a fixed date of maturity; interest payable either in coupon or registered form; face value guaranteed at maturity.
marketable debt: Market debt that is issued by the Government of Canada and sold via public tender or syndication. These issues can be traded between investors while outstanding.
money market: The market in which short-term capital is raised, invested and traded using financial instruments such as treasury bills, bankers' acceptances, commercial paper, and bonds maturing in one year or less.
non-market debt: The government's internal debt, which is, for the most part, federal public sector pension liabilities and the government's current liabilities (such as accounts payable, accrued liabilities, interest payments and payments of matured debt).
overnight rate; overnight financing rate; overnight money market rate; overnight lending rate: An interest rate at which participants with a temporary surplus or shortage of funds are able to lend or borrow until the next business day. It is the shortest term to maturity in the money market.
primary dealer (PD): A member of the core group of government securities distributors that maintain a certain threshold of activity in the market for Government of Canada securities. The primary dealer classification can be attained in either treasury bills or marketable bonds, or both.
primary market: The market in which issues of securities are first offered to the public.
Real Return Bond (RRB): A bond whose interest payments are based on real interest rates. Unlike standard fixed-coupon marketable bonds, the semi-annual interest payments on Government of Canada Real Return Bonds are determined by adjusting the principal by the change in the Consumer Price Index.
secondary market: The market where existing securities trade after they have been sold to the public in the primary market.
sovereign market: The market for debt issued by a government.
treasury bill: A short-term obligation sold by public tender. Treasury bills, with terms to maturity of 3, 6 or 12 months, are currently auctioned on a bi-weekly basis.
yield curve: The conceptual or graphic representation of the term structure of interest rates. A "normal" yield curve is upward sloping, with short-term rates lower than long-term rates. An "inverted" yield curve is downward sloping, with short-term rates higher than long-term rates. A "flat" yield curve occurs when short-term rates are the same as long-term rates.
Annex 3: Contact Information
Consultations and Communications Branch
Department of Finance Canada
14th floor
90 Elgin Street
Ottawa, Ontario K1A 0G5
Phone: 613-369-3710
Facsimile: 613-369-4065
TTY: 613-369-3230
E-mail: financepublic-financepublique@fin.gc.ca
Media Enquiries:
613-369-4000
Reference Tables
- I
- Total Liabilities, Outstanding Market Debt and Debt Charges, as at March 31
- II
- Government of Canada Outstanding Market Debt, as at March 31
- III
- Issuance of Government of Canada Domestic Bonds
- IV
- Outstanding Government of Canada Domestic Bonds, as at March 31, 2025
- V
- Government of Canada Cross-Currency Swaps Outstanding, as at March 31, 2025
- VI
- Crown Corporation Borrowings, as at March 31
| Liabilities | |||||
|---|---|---|---|---|---|
| Year | Market debt | Market debt value adjustments | Accounts payable and accrued liabilities | Pension and other liabilities | Total liabilities |
| 1990 | 294.6 | -2.9 | 53.2 | 104.5 | 449.3 |
| 1991 | 323.9 | -3.2 | 54.9 | 112.1 | 487.7 |
| 1992 | 351.9 | -2.2 | 56.1 | 118.5 | 524.2 |
| 1993 | 382.7 | -3.0 | 58.4 | 125.1 | 563.2 |
| 1994 | 414.0 | -1.8 | 63.7 | 131.4 | 607.3 |
| 1995 | 441.0 | -3.4 | 71.3 | 139.8 | 648.7 |
| 1996 | 469.5 | -1.7 | 74.9 | 148.5 | 691.3 |
| 1997 | 476.9 | 0.3 | 75.9 | 156.3 | 709.4 |
| 1998 | 466.8 | 1.4 | 81.7 | 160.9 | 710.8 |
| 1999 | 457.7 | 2.6 | 83.7 | 168.2 | 712.2 |
| 2000 | 454.2 | -0.2 | 83.9 | 175.8 | 713.6 |
| 2001 | 444.9 | 1.3 | 88.5 | 179.0 | 713.6 |
| 2002 | 440.9 | 0.9 | 83.2 | 177.9 | 703.0 |
| 2003 | 438.6 | -1.1 | 83.2 | 178.3 | 699.0 |
| 2004 | 436.5 | -2.5 | 85.2 | 180.9 | 700.1 |
| 2005 | 431.8 | -4.3 | 97.7 | 179.8 | 705.0 |
| 2006 | 427.3 | -6.1 | 101.4 | 179.9 | 702.5 |
| 2007 | 418.8 | -4.7 | 106.5 | 185.1 | 705.8 |
| 2008 | 394.1 | -3.4 | 110.5 | 191.2 | 692.3 |
| 2009 | 510.9 | 3.1 | 114.0 | 200.4 | 828.4 |
| 2010 | 564.4 | -5.3 | 120.5 | 208.7 | 888.3 |
| 2011 | 596.8 | -5.7 | 119.1 | 217.2 | 927.5 |
| 2012 | 631.0 | -4.7 | 125.0 | 226.1 | 977.5 |
| 2013 | 668.0 | 4.4 | 118.7 | 236.2 | 1,027.4 |
| 2014 | 648.7 | 10.3 | 111.4 | 245.2 | 1,015.8 |
| 2015 | 649.5 | 15.7 | 123.6 | 251.4 | 1,040.2 |
| 2016 | 669.7 | 18.5 | 127.9 | 262.0 | 1,078.0 |
| 2017 | 695.1 | 18.5 | 132.5 | 270.7 | 1,116.9 |
| 2018 | 704.3 | 16.9 | 154.8 | 281.4 | 1,157.4 |
| 2019 | 721.1 | 15.8 | 159.7 | 282.6 | 1,185.2 |
| 2020 | 765.2 | 18.6 | 163.8 | 301.0 | 1,248.6 |
| 2021 | 1,109.8 | 15.4 | 207.4 | 319.7 | 1,652.2 |
| 2022 | 1,244.6 | 5.4 | 262.5 | 335.1 | 1,892.3 |
| 2023 | 1,259.9 | 5.1 | 259.4 | 351.7 | 1,925.0 |
| 2024 | 1,371.9 | 4.9 | 264.1 | 368.7 | 2,057.8 |
| 2025 | 1481.2 | 4.7 | 259.7 | 383.4 | 2,182.3 |
| Accumulated deficit and debt charges | ||||||
|---|---|---|---|---|---|---|
| Year | Total liabilities | Financial assets | Net debt | Non-financial assets | Accumulated deficit | Gross public debt charges |
| 1990 | 449.3 | 74.5 | 374.8 | 31.0 | 343.8 | 41.2 |
| 1991 | 487.7 | 76.6 | 411.1 | 33.4 | 377.7 | 45.0 |
| 1992 | 524.2 | 78.5 | 445.7 | 35.8 | 410.0 | 43.9 |
| 1993 | 563.2 | 76.0 | 487.2 | 38.2 | 449.0 | 41.3 |
| 1994 | 607.3 | 79.3 | 527.9 | 40.4 | 487.5 | 40.1 |
| 1995 | 648.7 | 81.2 | 567.5 | 43.3 | 524.2 | 44.2 |
| 1996 | 691.3 | 92.7 | 598.6 | 44.4 | 554.2 | 49.4 |
| 1997 | 709.4 | 100.4 | 609.0 | 46.1 | 562.9 | 47.3 |
| 1998 | 710.8 | 103.6 | 607.2 | 47.2 | 559.9 | 43.1 |
| 1999 | 712.2 | 109.3 | 602.9 | 48.7 | 554.1 | 43.3 |
| 2000 | 713.6 | 123.5 | 590.1 | 50.2 | 539.9 | 43.4 |
| 2001 | 713.6 | 141.9 | 571.7 | 51.7 | 520.0 | 43.9 |
| 2002 | 703.0 | 137.7 | 565.3 | 53.4 | 511.9 | 39.7 |
| 2003 | 699.0 | 139.5 | 559.6 | 54.2 | 505.3 | 37.3 |
| 2004 | 700.1 | 149.1 | 551.0 | 54.8 | 496.2 | 35.8 |
| 2005 | 705.0 | 155.4 | 549.6 | 54.9 | 494.7 | 34.1 |
| 2006 | 702.5 | 165.6 | 536.9 | 55.4 | 481.5 | 33.8 |
| 2007 | 705.8 | 181.9 | 523.9 | 56.6 | 467.3 | 33.9 |
| 2008 | 692.3 | 176.0 | 516.3 | 58.6 | 457.6 | 33.3 |
| 2009 | 828.4 | 298.9 | 529.4 | 61.5 | 467.9 | 28.3 |
| 2010 | 888.3 | 300.8 | 587.5 | 63.4 | 524.1 | 26.6 |
| 2011 | 927.5 | 304.0 | 623.5 | 66.6 | 556.9 | 28.6 |
| 2012 | 977.5 | 317.6 | 659.9 | 68.0 | 591.9 | 29.0 |
| 2013 | 1,027.4 | 337.8 | 689.5 | 68.9 | 620.6 | 25.5 |
| 2014 | 1,015.8 | 318.5 | 696.4 | 70.4 | 626.0 | 24.7 |
| 2015 | 1,040.2 | 336.7 | 703.5 | 74.6 | 628.9 | 24.2 |
| 2016 | 1,078.0 | 365.8 | 712.2 | 77.8 | 634.4 | 21.8 |
| 2017 | 1,116.9 | 382.8 | 734.1 | 82.6 | 651.5 | 21.2 |
| 2018 | 1,157.4 | 397.5 | 752.9 | 81.6 | 671.3 | 21.9 |
| 2019 | 1,185.2 | 413.0 | 772.1 | 86.7 | 685.5 | 23.3 |
| 2020 | 1,248.6 | 435.7 | 812.9 | 91.5 | 721.4 | 24.5 |
| 2021 | 1,652.2 | 502.4 | 1,149.8 | 101.1 | 1,048.8 | 20.4 |
| 2022 | 1,892.3 | 647.5 | 1,244.7 | 104.8 | 1,140.0 | 24.5 |
| 2023 | 1,925.0 | 642.3 | 1,282.7 | 109.7 | 1,173.0 | 35.0 |
| 2024 | 2,057.8 | 705.0 | 1,352.8 | 116.6 | 1,236.2 | 47.3 |
| 2025 | 2182.3 | 788.8 | 1393.5 | 127.1 | 1266.5 | 53.4 |
| Payable in Canadian dollars | |||||
|---|---|---|---|---|---|
| Year | Treasury bills | Marketable bonds1 | Retail debt | Canada Pension Plan bonds |
Total |
| 1990 | 118.6 | 127.7 | 40.9 | 3.1 | 290.2 |
| 1991 | 139.2 | 143.6 | 34.4 | 3.5 | 320.7 |
| 1992 | 152.3 | 158.1 | 35.6 | 3.5 | 349.5 |
| 1993 | 162.1 | 178.5 | 34.4 | 3.5 | 378.4 |
| 1994 | 166.0 | 203.4 | 31.3 | 3.5 | 404.3 |
| 1995 | 164.5 | 225.7 | 31.4 | 3.5 | 425.1 |
| 1996 | 166.1 | 252.8 | 31.4 | 3.5 | 453.8 |
| 1997 | 135.4 | 282.6 | 33.5 | 3.5 | 454.9 |
| 1998 | 112.3 | 294.6 | 30.5 | 3.5 | 440.8 |
| 1999 | 97.0 | 295.8 | 28.2 | 4.1 | 425.0 |
| 2000 | 99.9 | 294.4 | 26.9 | 3.6 | 424.7 |
| 2001 | 88.7 | 295.5 | 26.4 | 3.5 | 414.1 |
| 2002 | 94.2 | 294.9 | 24.0 | 3.4 | 416.5 |
| 2003 | 104.6 | 289.2 | 22.6 | 3.4 | 419.8 |
| 2004 | 113.4 | 279.0 | 21.3 | 3.4 | 417.1 |
| 2005 | 127.2 | 266.7 | 19.1 | 3.4 | 416.3 |
| 2006 | 131.6 | 261.9 | 17.3 | 3.1 | 413.9 |
| 2007 | 134.1 | 257.9 | 15.2 | 1.7 | 408.9 |
| 2008 | 117.0 | 253.8 | 13.1 | 1.0 | 384.9 |
| 2009 | 192.5 | 295.3 | 12.5 | 0.5 | 500.8 |
| 2010 | 175.9 | 367.9 | 11.8 | 0.5 | 556.1 |
| 2011 | 163.0 | 416.1 | 10.1 | 0.0 | 589.2 |
| 2012 | 163.2 | 448.1 | 8.9 | 0.0 | 620.3 |
| 2013 | 180.7 | 469.0 | 7.5 | 0.0 | 657.2 |
| 2014 | 153.0 | 473.3 | 6.3 | 0.0 | 632.6 |
| 2015 | 135.7 | 487.9 | 5.7 | 0.0 | 629.2 |
| 2016 | 138.1 | 504.1 | 5.1 | 0.0 | 647.2 |
| 2017 | 136.7 | 536.3 | 4.5 | 0.0 | 677.5 |
| 2018 | 110.7 | 575.0 | 2.6 | 0.0 | 688.2 |
| 2019 | 134.3 | 569.5 | 1.2 | 0.0 | 705.1 |
| 2020 | 151.9 | 596.9 | 0.5 | 0.0 | 749.2 |
| 2021 | 218.8 | 875.3 | 0.3 | 0.0 | 1,109.8 |
| 2022 | 186.9 | 1,043.2 | 0.0 | 0.0 | 1,230.1 |
| 2023 | 198.9 | 1,045.0 | 0.0 | 0.0 | 1,243.9 |
| 2024 | 263.0 | 1,087.7 | 0.0 | 0.0 | 1,350.7 |
| 2025 | 282.3 | 1169.4 | 0.0 | 0,0 | 1451.7 |
| 1 Inflation adjusted. | |||||
| Payable in foreign currencies | |||||||
|---|---|---|---|---|---|---|---|
| Year | Canada bills | Marketable bonds | Canada notes1 | Euro medium-term notes1 | Standby drawings |
Term loans | Total |
| 1990 | 1.4 | 4.3 | 0.0 | 0.0 | 0.0 | 0.0 | 5.7 |
| 1991 | 1.0 | 3.6 | 0.0 | 0.0 | 0.0 | 0.0 | 4.5 |
| 1992 | 0.0 | 3.4 | 0.0 | 0.0 | 0.0 | 0.0 | 3.4 |
| 1993 | 2.6 | 2.8 | 0.0 | 0.0 | 0.0 | 0.0 | 5.4 |
| 1994 | 5.6 | 5.0 | 0.0 | 0.0 | 0.0 | 0.0 | 10.7 |
| 1995 | 9.0 | 7.9 | 0.0 | 0.0 | 0.0 | 0.0 | 16.9 |
| 1996 | 7.0 | 9.5 | 0.3 | 0.0 | 0.0 | 0.0 | 16.8 |
| 1997 | 8.4 | 12.5 | 2.1 | 0.0 | 0.0 | 0.0 | 23.0 |
| 1998 | 9.4 | 14.6 | 1.7 | 1.5 | 0.0 | 0.0 | 27.2 |
| 1999 | 10.2 | 19.7 | 1.3 | 4.9 | 0.0 | 0.0 | 36.0 |
| 2000 | 6.0 | 21.4 | 1.1 | 4.1 | 0.0 | 0.0 | 32.6 |
| 2001 | 7.2 | 21.2 | 1.6 | 3.7 | 0.0 | 0.0 | 33.7 |
| 2002 | 3.4 | 19.8 | 1.2 | 3.2 | 0.0 | 0.0 | 27.5 |
| 2003 | 2.6 | 14.5 | 1.2 | 3.3 | 0.0 | 0.0 | 21.6 |
| 2004 | 3.4 | 13.2 | 1.3 | 3.0 | 0.0 | 0.0 | 20.8 |
| 2005 | 3.9 | 9.9 | 1.1 | 1.7 | 0.0 | 0.0 | 16.5 |
| 2006 | 4.7 | 7.6 | 0.5 | 1.5 | 0.0 | 0.0 | 14.3 |
| 2007 | 1.8 | 6.7 | 0.5 | 1.6 | 0.0 | 0.0 | 10.6 |
| 2008 | 1.5 | 6.1 | 0.5 | 1.6 | 0.0 | 0.0 | 9.7 |
| 2009 | 8.7 | 0.3 | 0.0 | 1.7 | 0.0 | 0.0 | 10.6 |
| 2010 | 2.5 | 5.8 | 0.0 | 0.0 | 0.0 | 0.0 | 8.2 |
| 2011 | 2.0 | 5.6 | 0.0 | 0.0 | 0.0 | 0.0 | 7.7 |
| 2012 | 2.1 | 8.6 | 0.0 | 0.0 | 0.0 | 0.0 | 10.7 |
| 2013 | 2.1 | 8.7 | 0.0 | 0.0 | 0.0 | 0.0 | 10.8 |
| 2014 | 2.3 | 13.0 | 0.6 | 0.1 | 0.0 | 0.0 | 16.0 |
| 2015 | 3.8 | 14.8 | 1.2 | 0.5 | 0.0 | 0.0 | 20.3 |
| 20161 | 4.7 | 15.3 | 1.6 | 0.9 | 0.0 | 0.0 | 22.5 |
| 2017 | 3.5 | 11.5 | 1.7 | 0.9 | 0.0 | 0.0 | 17.6 |
| 2018 | 2.6 | 10.9 | 1.7 | 0.9 | 0.0 | 0.0 | 16.0 |
| 2019 | 2.7 | 11.0 | 1.7 | 0.6 | 0.0 | 0.0 | 16.0 |
| 2020 | 2.2 | 12.7 | 0.7 | 0.4 | 0.0 | 0.0 | 15.9 |
| 2021 | 4.1 | 11.3 | 0.1 | 0.0 | 0.0 | 0.0 | 15.4 |
| 2022 | 2.6 | 11.9 | 0.0 | 0.0 | 0.0 | 0.0 | 14.5 |
| 2023 | 2.5 | 13.6 | 0.0 | 0.0 | 0.0 | 0.0 | 16.0 |
| 2024 | 2.2 | 19.1 | 0.0 | 0.0 | 0.0 | 0.0 | 21.2 |
| 2025 | 4.2 | 25.4 | 0.0 | 0.0 | 0.0 | 0.0 | 29.6 |
1 Amounts for 2016 and 2017 have been restated following historical revisions. |
|||||||
| Total market debt | |||||
|---|---|---|---|---|---|
| Year | Total payable in Canadian dollars | Total payable in foreign currencies |
Less: Government's holdings and consolidation adjustment1 |
Total market debt | Average interest rate (%) |
| 1990 | 290.2 | 5.7 | -1.3 | 294.6 | 11.2 |
| 1991 | 320.7 | 4.5 | -1.3 | 323.9 | 10.7 |
| 1992 | 349.5 | 3.4 | -1.0 | 351.8 | 8.9 |
| 1993 | 378.4 | 5.4 | -1.1 | 382.7 | 7.9 |
| 1994 | 404.3 | 10.7 | -1.0 | 414.0 | 6.8 |
| 1995 | 425.1 | 16.9 | -1.0 | 441.0 | 8.0 |
| 1996 | 453.8 | 16.8 | -1.0 | 469.5 | 7.3 |
| 1997 | 454.9 | 23.0 | -1.1 | 476.8 | 6.7 |
| 1998 | 440.8 | 27.2 | -1.2 | 466.8 | 6.6 |
| 1999 | 425.0 | 36.0 | -3.3 | 457.7 | 6.7 |
| 2000 | 424.7 | 32.6 | -3.1 | 454.2 | 6.2 |
| 2001 | 414.1 | 33.7 | -2.9 | 444.9 | 6.1 |
| 2002 | 416.5 | 27.5 | -3.1 | 440.9 | 5.6 |
| 2003 | 419.8 | 21.6 | -2.7 | 438.6 | 5.3 |
| 2004 | 417.1 | 20.8 | -1.5 | 436.4 | 4.9 |
| 2005 | 416.3 | 16.5 | -1.1 | 431.7 | 4.6 |
| 2006 | 413.9 | 14.3 | -1.0 | 427.2 | 4.7 |
| 2007 | 408.9 | 10.6 | -0.7 | 418.9 | 4.9 |
| 2008 | 384.9 | 9.7 | -0.5 | 394.1 | 4.6 |
| 2009 | 500.8 | 10.6 | -0.6 | 510.8 | 3.2 |
| 2010 | 556.1 | 8.2 | -0.1 | 564.2 | 2.7 |
| 2011 | 589.2 | 7.7 | -0.1 | 596.8 | 2.8 |
| 2012 | 620.3 | 10.7 | -0.1 | 631.0 | 2.7 |
| 2013 | 657.2 | 10.8 | -0.0 | 668.0 | 2.5 |
| 2014 | 632.6 | 16.0 | -0.3 | 648.7 | 2.4 |
| 2015 | 629.2 | 20.3 | -0.4 | 649.5 | 2.3 |
| 2016 | 647.2 | 22.5 | 0.1 | 669.7 | 2.0 |
| 2017 | 677.5 | 17.6 | -0.4 | 695.1 | 1.9 |
| 2018 | 688.3 | 16.0 | 0.9 | 704.3 | 2.0 |
| 2019 | 705.1 | 16.0 | -0.4 | 721.1 | 2.2 |
| 2020 | 749.2 | 15.9 | -0.3 | 765.2 | 2.0 |
| 2021 | 1,094.4 | 15.4 | -0.3 | 1,109.8 | 1.4 |
| 2022 | 1,230.1 | 14.5 | -0.2 | 1,244.6 | 1.4 |
| 2023 | 1,243.9 | 16.0 | -0.2 | 1,259.9 | 2.3 |
| 2024 | 1,350.7 | 21.2 | 0.0 | 1,371.9 | 2.9 |
| 2025 | 1451.6 | 29.6 | 0.0 | 1481.2 | 2.76 |
1 Because certain comparative figures have been restated to reflect the presentation method used in recent years, the numbers presented in this reference table can differ from numbers presented in other sections of the Debt Management Report. In the reference table, ''Government's holdings and consolidation adjustment'' is presented separately but in the rest of the report the amount is incorporated into the figures. For more information, please consult table 6.2 and table 6.3 of the Public Accounts of Canada 2022. |
|||||
| Gross issuance | ||||||||||||||||||
|---|---|---|---|---|---|---|---|---|---|---|---|---|---|---|---|---|---|---|
| Nominal1 | Real Return Bonds | Buybacks | ||||||||||||||||
| Fiscal year | 2-year | 3-year | 5-year | 10-year | 30-year | 50-year | Green | Total | 30-year | Total | Cash | Switch | Total | Net issuance | ||||
| 1997-98 | 14.0 | 9.9 | 9.3 | 5.0 | 38.2 | 1.7 | 39.9 | 0.0 | 39.9 | |||||||||
| 1998-99 | 14.0 | 9.8 | 9.2 | 3.3 | 36.3 | 1.6 | 37.9 | 0.0 | 37.9 | |||||||||
| 1999-00 | 14.2 | 14.0 | 12.9 | 3.7 | 44.8 | 1.3 | 46.0 | -2.7 | 0.0 | -2.7 | 43.3 | |||||||
| 2000-01 | 14.1 | 10.5 | 10.1 | 3.8 | 38.5 | 1.4 | 39.9 | -2.8 | 0.0 | -2.8 | 37.1 | |||||||
| 2001-02 | 14.0 | 10.0 | 9.9 | 6.3 | 40.2 | 1.4 | 41.6 | -5.3 | -0.4 | -5.6 | 35.9 | |||||||
| 2002-03 | 13.9 | 11.0 | 12.6 | 4.8 | 42.3 | 1.4 | 43.7 | -7.1 | -5.0 | -12.1 | 31.6 | |||||||
| 2003-04 | 13.0 | 10.7 | 11.5 | 4.2 | 39.4 | 1.4 | 40.8 | -5.2 | -5.0 | -10.2 | 30.7 | |||||||
| 2004-05 | 12.0 | 9.6 | 10.6 | 3.3 | 35.5 | 1.4 | 36.9 | -6.8 | -4.7 | -11.4 | 25.5 | |||||||
| 2005-06 | 10.0 | 9.2 | 10.0 | 3.2 | 32.4 | 1.5 | 33.9 | -5.3 | -3.3 | -8.6 | 25.3 | |||||||
| 2006-07 | 10.3 | 7.8 | 10.4 | 3.3 | 31.8 | 1.6 | 33.4 | -5.1 | -4.7 | -9.8 | 23.5 | |||||||
| 2007-08 | 11.7 | 6.3 | 10.7 | 3.4 | 32.0 | 2.3 | 34.3 | -4.3 | -2.4 | -6.7 | 27.6 | |||||||
| 2008-09 | 23.2 | 29.0 | 15.7 | 5.1 | 72.9 | 2.1 | 75.0 | -3.2 | -2.7 | -6.0 | 69.0 | |||||||
| 2009-10 | 31.5 | 20.1 | 24.0 | 17.4 | 7.0 | 100.0 | 2.2 | 102.2 | 0.0 | -2.1 | -2.1 | 100.1 | ||||||
| 2010-11 | 36.3 | 18.8 | 21.2 | 12.0 | 5.0 | 93.3 | 2.2 | 95.5 | 0.0 | -4.4 | -4.4 | 91.2 | ||||||
| 2011-12 | 44.0 | 18.0 | 21.0 | 10.0 | 4.7 | 97.7 | 2.2 | 99.9 | -3.0 | -3.0 | -5.9 | 94.0 | ||||||
| 2012-13 | 35.9 | 13.9 | 20.4 | 16.5 | 6.7 | 93.4 | 2.2 | 95.6 | -0.4 | -1.1 | -1.5 | 94.1 | ||||||
| 2013-14 | 29.7 | 16.2 | 20.4 | 14.0 | 5.0 | 85.3 | 2.2 | 87.5 | 0.0 | -1.0 | -1.0 | 86.5 | ||||||
| 2014-15 | 38.4 | 16.2 | 20.4 | 13.3 | 4.6 | 3.5 | 92.9 | 2.2 | 95.1 | 0.0 | -0.5 | -0.5 | 94.6 | |||||
| 2015-16 | 50.2 | 26.8 | 10.0 | 3.2 | 90.2 | 2.2 | 92.4 | 0.0 | -0.7 | -0.7 | 91.7 | |||||||
| 2016-17 | 62.4 | 19.5 | 30.0 | 15.0 | 4.3 | 131.2 | 2.2 | 133.4 | 0.0 | -0.8 | -0.8 | 132.6 | ||||||
| 2017-18 | 59.1 | 24.7 | 30.6 | 15.0 | 4.3 | 1.3 | 135.0 | 2.2 | 137.2 | 0.0 | -0.8 | -0.8 | 136.4 | |||||
| 2018-19 | 48.0 | 8.2 | 24.0 | 13.5 | 3.8 | 97.5 | 2.2 | 99.7 | 0.0 | -0.8 | -0.8 | 98.9 | ||||||
| 2019-20 | 53.0 | 19.7 | 33.5 | 13.5 | 5.5 | 125.2 | 1.8 | 127.0 | 0.0 | -2.8 | -2.8 | 124.2 | ||||||
| 2020-21 | 129.0 | 56.5 | 77.5 | 73.5 | 32.0 | 368.5 | 1.4 | 369.9 | 0.0 | 0.0 | 0.0 | 369.9 | ||||||
| 2021-22 | 67.0 | 29.0 | 44.0 | 79.0 | 28.0 | 4.0 | 5.0 | 256.0 | 1.4 | 257.4 | 0.0 | 0.0 | 0.0 | 257.4 | ||||
| 2022-23 | 67.0 | 20.0 | 31.0 | 52.0 | 14.5 | 184.5 | 0.7 | 185.2 | 0.0 | 0.0 | 0.0 | 185.2 | ||||||
| 2023-24 | 86.0 | 6.0 | 47.0 | 47.0 | 14.0 | 4.0 | 204.0 | 0.0 | 204.0 | 0.0 | 0.0 | 0.0 | 204.0 | |||||
| 2024-25 | 94.0 | 63.0 | 63.0 | 17.0 | 4.0 | 241.0 | 0.0 | 241.0 | 0.0 | 0.0 | 0.0 | 241.0 | ||||||
|
1 Including nominal issuance through switch buyback operations. |
||||||||||||||||||
| Maturity date | Amount ($ millions) | Coupon rate (%) |
|---|---|---|
| 01-Apr-2025 | 11,875 | 1.5 |
| 01-May-2025 | 14,700 | 3.8 |
| 01-Jun-2025 | 12,950 | 2.3 |
| 01-Jun-2025 | 2,134 | 9.0 |
| 01-Aug-2025 | 11,597 | 3.5 |
| 01-Sep-2025 | 47,492 | 0.5 |
| 01-Oct-2025 | 10,000 | 3.0 |
| 01-Nov-2025 | 19,375 | 4.5 |
| 01-Feb-2026 | 22,250 | 4.5 |
| 01-Mar-2026 | 34,000 | 0.3 |
| 01-Apr-2026 | 10,000 | 3.0 |
| 01-May-2026 | 25,800 | 4.0 |
| 01-Jun-2026 | 13,472 | 1.5 |
| 01-Aug-2026 | 21,450 | 4.0 |
| 01-Sep-2026 | 22,700 | 1.0 |
| 01-Nov-2026 | 21,500 | 3.3 |
| 01-Dec-2026 | 5,250 | 4.3 |
| 01-Feb-2027 | 27,500 | 3.0 |
| 01-Mar-2027 | 17,000 | 1.3 |
| 01-May-2027 | 16,500 | 2.8 |
| 01-Jun-2027 | 14,740 | 1.0 |
| 01-Jun-2027 | 3,621 | 8.0 |
| 24-Aug-2027 | 500 | 3.2 |
| 01-Sep-2027 | 16,000 | 2.8 |
| 01-Mar-2028 | 15,000 | 3.5 |
| 01-Jun-2028 | 13,500 | 2.0 |
| 01-Sep-2028 | 20,000 | 3.3 |
| 01-Mar-2029 | 27,000 | 4.0 |
| 01-Jun-2029 | 12,300 | 2.3 |
| 01-Jun-2029 | 10,599 | 5.8 |
| 01-Sep-2029 | 30,000 | 3.5 |
| 01-Dec-2029 | 5,000 | 2.3 |
| 01-Mar-2030 | 33,000 | 2.8 |
| 01-Jun-2030 | 44,200 | 1.3 |
| 01-Dec-2030 | 40,000 | 0.5 |
| 01-Jun-2031 | 42,000 | 1.5 |
| 01-Dec-2031 | 32,000 | 1.5 |
| 01-Dec-2031 | 5,800 | 4.0 |
| 01-Mar-2032 | 2,000 | 3.0 |
| 01-Jun-2032 | 24,000 | 2.0 |
| 01-Dec-2032 | 21,000 | 2.5 |
| 01-Jun-2033 | 19,000 | 2.8 |
| 01-Jun-2033 | 11,989 | 5.8 |
| 01-Dec-2033 | 21,000 | 3.3 |
| 01-Mar-2034 | 6,000 | 3.5 |
| 01-Jun-2034 | 34,000 | 3.0 |
| 01-Dec-2034 | 30,000 | 3.3 |
| 01-Jun-2035 | 18,000 | 3.3 |
| 01-Dec-2036 | 5,850 | 3.0 |
| 01-Jun-2037 | 11,731 | 5.0 |
| 01-Jun-2041 | 13,838 | 4.0 |
| 01-Dec-2041 | 6,550 | 2.0 |
| 01-Dec-2044 | 7,700 | 1.5 |
| 01-Dec-2045 | 16,300 | 3.5 |
| 01-Dec-2047 | 7,700 | 1.3 |
| 01-Dec-2048 | 14,900 | 2.8 |
| 01-Dec-2050 | 7,600 | 0.5 |
| 01-Dec-2051 | 51,817 | 2.0 |
| 01-Dec-2053 | 32,000 | 1.8 |
| 01-Dec-2054 | 2,100 | 0.3 |
| 01-Dec-2055 | 28,750 | 2.8 |
| 01-Dec-2057 | 5,000 | 3.5 |
| Fixed-Coupon Bonds Total | 1,140,379 | |
Note: 1. The outstanding amount excludes any security that has been auctioned but has not yet settled. 2. The outstanding amount includes any bond that has been repurchased by the Minister of Finance but has yet been cancelled. 3. The outstanding amount is not adjusted for securities that have been stripped or reconstituted. It is the amount after adjusting for inflation. Source: Bank of Canada. |
||
| Maturity Date | Amount | Coupon rate | Inflation adjustment | Outstanding amount |
|---|---|---|---|---|
| ($ millions) | (%) | ($ millions) | ($ millions) | |
| 1-Dec-2026 | 5,250 | 4.25 | 4,392 | 9,642 |
| 1-Dec-2031 | 5,800 | 4.00 | 4,437 | 10,237 |
| 1-Dec-2036 | 5,850 | 3.00 | 3,312 | 9,162 |
| 1-Dec-2041 | 6,550 | 2.00 | 2,949 | 9,499 |
| 1-Dec-2044 | 7,700 | 1.50 | 3,044 | 10,744 |
| 1-Dec-2047 | 7,700 | 1.25 | 2,374 | 10,074 |
| 1-Dec-2050 | 7,600 | 0.50 | 1,832 | 9,432 |
| 1-Dec-2054 | 2,100 | 0.25 | 325 | 2,425 |
| Real Return Bonds -Total | 48,550 | 22,665 | 71,215 | |
|
Note: Outstanding bond amounts reported in this table are in accordance with Bank of Canada reports, which may vary slightly with Government of Canada amounts due to differences in classification methods. Source: Bank of Canada. |
||||
| Swaps of domestic obligations | |||||
|---|---|---|---|---|---|
| Maturity date | USD | EUR | JPY | GBP | Total |
| 2025 | 2,877 | 140 | 767 | 4,449 | 8,234 |
| 2026 | 7,883 | 661 | 1,055 | 864 | 10,464 |
| 2027 | 3,057 | 2,178 | - | 2,621 | 7,855 |
| 2028 | 12,378 | 1,400 | - | - | 13,779 |
| 2029 | 5,682 | 2,835 | 863 | - | 9,380 |
| 2030 | 4,316 | 4,286 | 1,343 | - | 9,945 |
| 2031 | 10,681 | 700 | - | 279 | 11,660 |
| 2032 | 18,614 | 1,999 | 959 | 1,905 | 23,478 |
| 2033 | 9,418 | 2,023 | 384 | 2,695 | 14,519 |
| 2034 | 7,459 | 3,423 | 1,199 | 743 | 12,824 |
| 2035 | 1,439 | 1,245 | 96 | 558 | 3,337 |
| Total | 83,803 | 20,890 | 6,667 | 14,114 | 125,473 |
Note: Foreign currency swaps converted to Canadian dollars using Bank of Canada closing exchange rates as at March 31, 2025. Numbers may not add due to rounding. |
|||||
| Borrowings from the market | 2016 | 2017 | 2018 | 2019 | 2020 | 2021 | 2022 | 2023 | 2024 | 2025 |
|---|---|---|---|---|---|---|---|---|---|---|
| Export Development Canada | 46,687 | 49,226 | 55,470 | 55,217 | 63,249 | 47,532 | 44,319 | 54,172 | 58,451 | 61,374 |
| BDC | 253 | 163 | 139 | 137 | 142 | 128 | 0 | 0 | 0 | 0 |
| Farm Credit Canada | 762 | 815 | 833 | 818 | 833 | 852 | 673 | 947 | 927 | 1,225 |
| Canada Housing Trust1 | 282 | 0 | 0 | 0 | 0 | 0 | 0 | 0 | 0 | 0 |
| CMHC | 217,392 | 225,306 | 233,981 | 237,516 | 244,643 | 265,191 | 258,831 | 261,664 | 258,781 | 247,492 |
| Canada Post Corporation | 997 | 997 | 997 | 997 | 997 | 997 | 998 | 998 | 998 | 1,788 |
| Other2 | 109 | 52 | 48 | 49 | 45 | 27 | 50 | 53 | 55 | 54 |
| Total | 266,482 | 276,559 | 291,469 | 294,734 | 309,909 | 314,727 | 304,871 | 317,834 | 319,212 | 311,934 |
1 Canada Housing Trust has been included in the government reporting entity effective April 1, 2005 as a result of the application of a new accounting standard. 2 Other includes Freshwater Fish Marketing Corporation and Royal Canadian Mint Source: Public Accounts of Canada. |
||||||||||
| 2016 | 2017 | 2018 | 2019 | 2020 | 2021 | 2022 | 2023 | 2024 | 2025 | |
|---|---|---|---|---|---|---|---|---|---|---|
| BDC | 16,942 | 18,811 | 20,470 | 22,235 | 23,405 | 18,226 | 20,072 | 26,864 | 29,490 | 33,801 |
| CMHC1 | 10,531 | 9,811 | 8,687 | 8,095 | 14,377 | 15,284 | 17,307 | 19,818 | 22,223 | 23,535 |
| Farm Credit Canada | 23,438 | 25,684 | 28,009 | 29,862 | 32,654 | 34,342 | 37,456 | 40,268 | 43,097 | 47,503 |
| Other | 340 | 455 | 468 | 5,2442 | 6,6872 | 10,4192 | 16,5562 | 16,4272 | 17,1932 | 36,688 |
| Total | 51,251 | 54,761 | 57,633 | 65,436 | 77,122 | 78,271 | 91,391 | 103,377 | 111,908 | 141,527 |
1 Includes outstanding lending related to the Insured Mortgage Purchase Program for 2009 to 2014. 2 Includes lending to Canada Development Investment Corporation for the purchase of entities that own and operate the Trans Mountain pipeline. Source: Public Accounts of Canada. |
||||||||||