
Report on Federal Tax Expenditures - Concepts, Estimates and Evaluations 2020: part 8
A Profile of Trusts as Taxfilers and Taxpayers[1]Footnote 1
1. Introduction
Trusts are one of the three main categories of taxpayers in Canada, alongside individuals and corporations. While there exists a substantial body of descriptive research characterizing individual and corporate income tax filings in Canada—primarily with a focus on the income statistics that are derived from these filings—there is essentially no similar research on trusts.
This paper attempts to fill this information gap by presenting a statistical profile of trusts as taxfilers and taxpayers. Following some background information on trusts and their tax treatment in Canada, this paper presents statistics on tax filings, reported income and taxes paid by trusts, as well as a profile of the individuals that make use of testamentary trusts.
2. Background
2.1 Definition and Types of Trusts
In general terms, a trust can be described under Canadian law as a relationship under which a person, called the settlor, transfers property to another person, called the trustee, who holds that property for the benefit of another person, called the beneficiary.Footnote 2[2] The legal meaning of a trust derives from English common law as well as modern provincial and territorial statutes, and has been adopted for tax purposes.Footnote 3[3]
Many different types of trusts exist, not all of which correspond to types of trusts that are defined for income tax purposes. Types of trusts can be distinguished based on many factors such as the identity of their settlors, trustees and beneficiaries, the reasons they were set up and the purposes they serve, the types of property being held in trust, or the powers that have been assigned to the trustees. Key categories of trusts include:
- Testamentary trusts: Testamentary trusts are trusts or estates created on and as result of the death of an individual, and whose purpose is to manage the deceased's wealth, most particularly the transfer of this wealth to beneficiaries. Testamentary trusts include, for instance, trusts established under the terms of a taxpayer's will and trusts established by court orders for the support of a deceased's dependants. This category also includes graduated rate estates, which in general terms are estates that have been in existence for less than 36 months, and qualified disability trusts, which are testamentary trusts whose beneficiaries qualify for the Disability Tax Credit. Trusts that are not testamentary trusts are referred to as inter vivos trusts, meaning trusts created during the lifetime of a person among living individuals.
- Wealth management trusts: Trusts in this category encompass inter vivos trusts that are set up by individuals or groups of related individuals as part of their wealth management strategies. Different types of trusts can be used for wealth management, including personal trusts (such as family trusts), spousal or common-law partner trusts and alter ego trusts.Footnote 4[4] In general, the settlors of such trusts are related to the beneficiaries (e.g., a taxpayer and his or her spouse, a couple and their children) and the property placed in the trust will consist in some portfolio investment assets such as shares, bonds, real estate properties or partnership interests, as well as shares of closely owned private corporations.
- Investment trusts: Investment trusts cover trusts that serve as collective investment vehicles, and include trusts such as mutual fund trusts, real estate investment trusts and insurance segregated fund trusts. An interest in an investment trust generally takes the form of a unit that could (but need not) be publicly traded.
- Business trusts: Business trusts include trusts under which some businesses are being carried on as well as trusts used by widely held businesses for tax planning purposes.
- Employee benefit trusts: This category encompasses trusts that are set up by employers to manage some forms of employee benefits such as pensions or health and welfare benefits. Employee benefit trusts are used by both small and large firms, and may cover any number of employees, from a single employee to thousands.
- Registered savings plans trusts: This category covers Registered Retirement Savings Plans, Registered Retirement Income Funds, Registered Disability Savings Plans, Registered Education Savings Plans and Tax-Free Savings Accounts that are set up as trusts.
Other types of trusts not covered in the above categories include charitable trusts, non-profit organization trusts, amateur athletic trusts, communal organizations that are treated as trusts for tax purposes, qualifying environmental trusts, and other government-mandated and government-sponsored trusts.
Information is not available that would permit to separate business trusts from wealth managements trusts. As such, information presented in the following as covering wealth management trusts covers all personal trusts, alter ego trusts, spousal/common-law partner trusts and joint spousal/common-law partner trusts, including where such trusts are used as business trusts. Footnote 5[5]
2.2 Tax Treatment of Trusts in Canada
Trusts are not legal entities under Canadian laws (being a form of legal relationship); however, for income tax purposes, trusts are deemed to be individuals distinct from their trustees (in their personal capacities) and beneficiaries, and are therefore subject to income tax as individuals.
Trusts must determine their income, taxable income and tax payable under rules generally similar to those applicable to individuals. However, a number of important differences are worth noting:
- The income of a trust that is paid or payable to a beneficiary during the year is deductible in computing the trust's taxable income and included in the income of the beneficiary. This means that income earned by a trust can be flowed through to a beneficiary without attracting tax at the trust level. The flow-through treatment that is granted to trusts implies that a large number of trusts are in a non-taxable position in any given year (see Section 3.2).
- The income of a trust that is retained within the trust (i.e., that is not flowed through to a beneficiary as just described) is generally subject to tax at the top marginal personal income tax rate.Footnote 6[6] However, when the trust is a graduated rate estate or qualified disability trust, the trust is subject to tax at the graduated income tax rates applicable to individuals.Footnote 7[7]
- Trusts subject to income tax are eligible for a limited number of tax credits, including the dividend tax credit, the charitable donation tax credit, the foreign tax credit and most investment tax credits. Trusts cannot claim the credit for the Basic Personal Amount and the other personal tax credits that are available to individuals.
- Depending on the circumstances, some trusts can remain in existence for very long periods of time, if not indefinitely. To prevent the use of trusts to defer tax on capital gains, trusts are deemed to have disposed of their property and realized any accrued capital gains every 21 years.Footnote 8[8]
- Certain trusts are subject to the alternative minimum tax just like individuals; however, only graduated rate estates can benefit from the $40,000 basic exemption in determining their adjusted taxable income for purpose of the minimum tax.Footnote 9[9]
3. Statistical Profile of Trusts
This section presents some general information about trusts, based on administrative data collected by the Canada Revenue Agency. It should be cautioned that this data does not cover the whole population of trusts, but rather is limited to trusts that have filed a tax return with the Canada Revenue Agency and have registered with the Agency for this purpose (i.e., were issued a trust account number).Footnote 10[10] In general, a trust is required to file a tax return if it has tax payable or distributed all or part of its income or capital to its beneficiaries.Footnote 11[11] Many trusts are not required to file a tax return, including most tax-exempt trusts; however, the number of trusts not filing a tax return is not known, and therefore it is not possible to assess with precision the proportion of the total trust population that is covered in the following analysis.
The information is presented on a calendar-year basis. Trusts generally must have taxation years that end on December 31. There are two exceptions to this rule: testamentary trusts that are graduated rate estates can have non-calendar taxation year-ends, while mutual fund trusts can elect to have a December 15 year-end.Footnote 12[12] Unless otherwise noted, information for a given calendar year covers all trust taxation years ending during that calendar year. All dollar amounts are adjusted for inflation and expressed in 2019 Canadian dollars.
3.1 Number of Trusts and Returns Filed
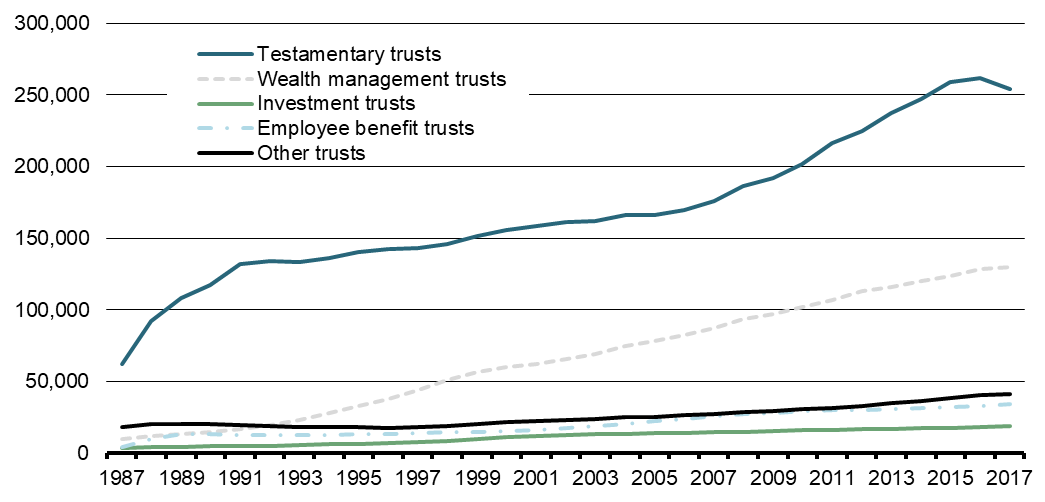
Chart 1 shows the number of trusts that were in existence and registered with the Canada Revenue Agency over the period from 1987 to 2017, for selected categories of trusts. There were close to 254,000 registered testamentary trusts as of 2017, a number that grew significantly over the period, and in particular since 2006. About 130,000 wealth management trusts were registered as of 2017, a number that also grew strongly since 1987. Other categories of trusts are less common, with some 18,500 investment trusts, 33,900 employee benefit trusts and 41,400 other trusts registered as of 2017. Table 1 provides the number of registered trusts for specific types of trusts for selected years between 1990 and 2017.
Chart 1
Number of Registered Trusts, Selected Trust Categories
| 1990 | 1995 | 2000 | 2005 | 2010 | 2015 | 2016 | 2017 | |
|---|---|---|---|---|---|---|---|---|
| Testamentary trusts | 117,586 | 140,410 | 155,601 | 166,115 | 202,072 | 258,981 | 261,575 | 253,801 |
| of which: | ||||||||
| Spousal/common-law partner trusts | 15,089 | 17,641 | 18,335 | 17,288 | 18,786 | 22,036 | 18,430 | 17,523 |
| Graduated rate estates | 27,552 | 73,630 | 76,146 | |||||
| Qualified disability trusts | 52 | 85 | 176 | 330 | 595 | 1,039 | 1,145 | 1,179 |
| Wealth management trusts | 14,744 | 32,535 | 59,906 | 77,820 | 102,062 | 123,694 | 128,589 | 129,797 |
| of which: | ||||||||
| Personal trusts | 14,471 | 32,207 | 59,031 | 74,932 | 97,310 | 116,934 | 121,104 | 121,768 |
| Alter ego trusts | 71 | 1,147 | 2,381 | 3,602 | 4,023 | 4,351 | ||
| Spousal/common-law partner trusts | 247 | 285 | 721 | 1,157 | 1,230 | 1,303 | 1,358 | 1,372 |
| Joint spousal/common-law partner trusts |
27 | 530 | 1,064 | 1,723 | 1,952 | 2,155 | ||
| Investment trusts | 4,667 | 6,376 | 10,923 | 13,731 | 15,677 | 17,761 | 18,294 | 18,527 |
| of which: | ||||||||
| Mutual fund trusts | 638 | 1,148 | 2,503 | 3,071 | 3,419 | 4,159 | 4,345 | 4,459 |
| Other unit trusts | 2,980 | 3,337 | 3,937 | 4,532 | 5,058 | 5,471 | 5,557 | 5,623 |
| Registered investment funds | 810 | 1,497 | 3,270 | 4,067 | 4,057 | 4,082 | 4,251 | 4,261 |
| Insurance segregated fund trusts | 180 | 330 | 1,132 | 1,921 | 2,989 | 3,885 | 3,972 | 4,015 |
| Real estate investment trusts | 1 | 1 | 7 | 11 | 15 | 41 | 44 | 44 |
| Royalty trusts | 56 | 61 | 64 | 67 | 70 | 72 | 72 | 72 |
| Specified investment flow-through trusts | 2 | 2 | 10 | 62 | 69 | 51 | 53 | 53 |
| Employee benefit trusts | 12,909 | 13,050 | 15,521 | 22,035 | 28,980 | 31,913 | 32,760 | 33,874 |
| of which: | ||||||||
| Employee pension plans | 6,006 | 6,939 | 7,809 | 11,674 | 15,092 | 15,334 | 15,287 | 15,375 |
| Deferred profit sharing plans | 5,017 | 3,933 | 4,707 | 6,419 | 8,504 | 10,641 | 11,437 | 12,370 |
| Retirement compensation arrangements | 40 | 196 | 987 | 1,947 | 3,212 | 3,716 | 3,822 | 3,958 |
| Other trusts | 20,517 | 17,831 | 21,305 | 25,282 | 30,759 | 38,096 | 40,461 | 41,440 |
| of which: | ||||||||
| Communal organizations | 293 | 321 | 353 | 360 | 381 | 404 | 406 | 410 |
| Non-profit organization trusts | 695 | 773 | 824 | 1,038 | 935 | 966 | 965 | 965 |
| Qualifying environmental trusts | 0 | 8 | 26 | 44 | 67 | 110 | 110 | 109 |
| Notes: See note to Chart 1. Trust types correspond to the type of a trust as of 2017 (see footnote 5), which explains why there are some graduated rate estates and qualified disability trusts in years prior to 2016. | ||||||||
The proportion of registered trusts that file a trust tax return varies by trust type (Chart 2). About three-quarters of wealth management trusts and investment trusts file a T3 return in any given year, while slightly less than two-thirds of employee benefit trusts and other trusts do so. The filing rate for testamentary trusts is the lowest amongst the categories shown in Chart 2, and has been on a gradual decline since the early 2000s. Large increases in the filing rates of investment trusts and employee benefit trusts in 2002 are due to the introduction of new filing requirements for registered investment funds, employee pension plans and deferred profit sharing plans.
Chart 2
Share of Trusts That Filed a T3 Return, Selected Trust Categories (%)
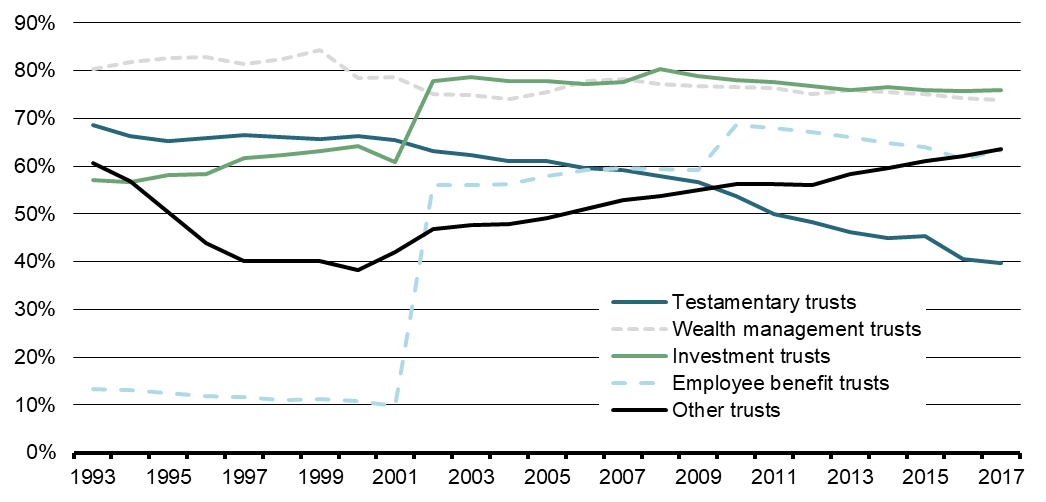
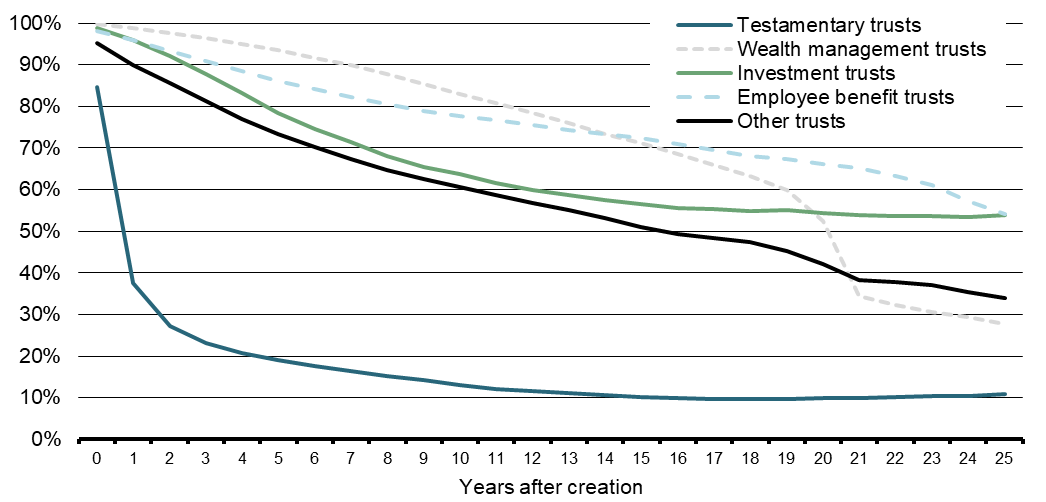
Chart 3 and Table 2 provide some information about the dynamics of trust creation and trust closure for selected categories of trusts. As can be seen, the typical lifespan of a testamentary trust is quite different than the typical lifespan of other trusts. Fewer testamentary trusts are kept in existence for long periods of time: more than 80% of testamentary trusts are closed within five years of their creation, and the median age for trusts in existence at any point in time is four years. Also, about one testamentary trust out of five in existence in a given year was created in that year, and about one in five was closed in that year. In contrast, other categories of trusts are kept in existence for much longer periods of time, and have much lower rates of annual creation and closure. A large number of wealth management trusts are closed immediately before reaching the 21-year limit at which they are deemed to have disposed of their capital property.
Chart 3
Survival Rates, Selected Trust Categories, Averages Cohorts 1987-2017 (%)
| Proportion of trusts in existence in a year that were created during the year (%) | Proportion of trusts in existence in a year that were closed during the year (%) | Net annual rate at which trusts are created (%) | Average age of trusts in existence in the year |
Median age of trusts in existence in the year |
|
|---|---|---|---|---|---|
| Testamentary trusts | 21 | 17 | 3 | 8 | 4 |
| Wealth management trusts | 7 | 3 | 3 | 9 | 8 |
| Investment trusts | 5 | 3 | 2 | 17 | 11 |
| Employee benefit trusts | 4 | 2 | 2 | 15 | 10 |
| Other trusts | 6 | 2 | 4 | 15 | 11 |
| Note: See note to Chart 1. | |||||
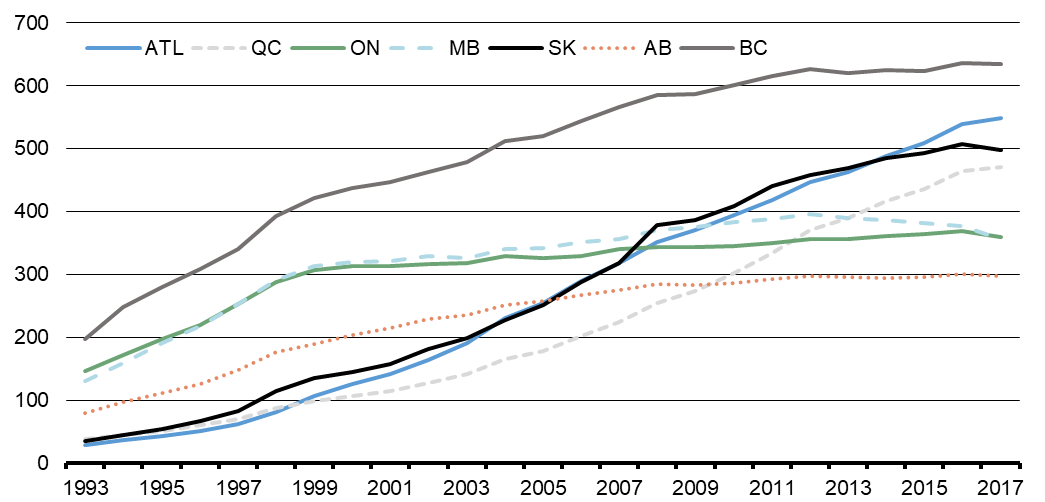
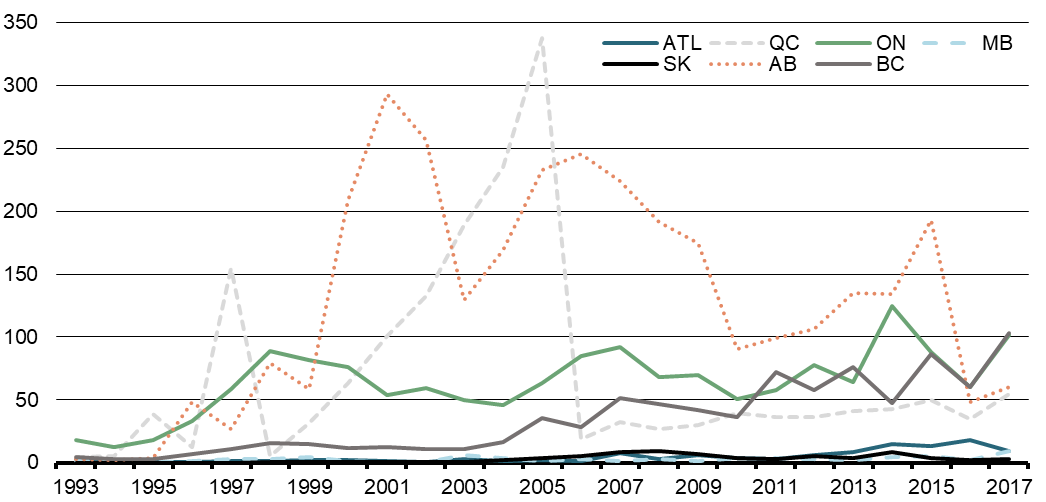
Over 99% of all trusts registered with the Canada Revenue Agency are trusts that are resident in Canada for income tax purposes.Footnote 13[13] Charts 4 and 5 show the ratios of testamentary trusts and wealth management trusts per 100,000 of population aged 18 years and over, by province of residence of the trusts. The use of testamentary trusts appears to be more prevalent in Manitoba and Saskatchewan, while the use of wealth management trusts appears to be significantly higher in British Columbia. As shown in Chart 5, the ratio of wealth management trusts per population has grown significantly since 1993 in Saskatchewan, in the Atlantic provinces and in Quebec.
Chart 4
Number of Testamentary Trusts per 100,000 Population 18 Years and Over, by Province
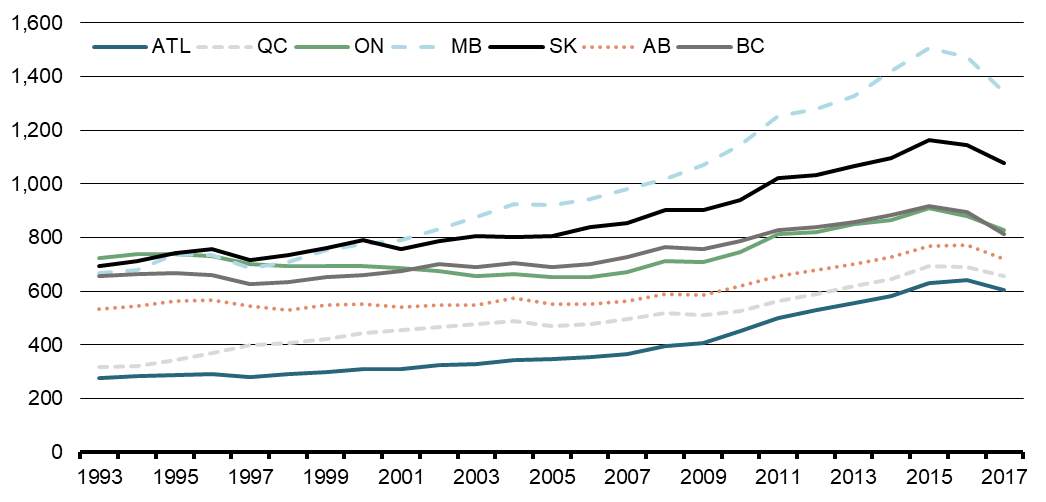
Chart 5
Number of Wealth Management Trusts per 100,000 Population 18 Years and Over, by Province
3.2 Income and Net Federal Tax
Chart 6 shows the total adjusted income reported by trusts that filed a trust tax return between 1993 and 2017, for selected trust categories. The adjusted income of a trust corresponds to its total income (line 20 of the general T3 return), adjusted to add back the non-includable portion of capital gains and deduct current-year capital losses, and is prior to deductions for distributions paid or payable to beneficiaries.Footnote 14[14]
Total adjusted income was $223 billion in 2017, up from $26 billion in 1993, corresponding to a 9% annual increase in real terms over the period. Investment trusts account for 80% on average of the total income reported by trusts, although the income reported by investment trusts is highly cyclical and decreased substantially in the early 2000s and during the 2008-2009 financial crisis. The total adjusted income reported by wealth management trusts and other trusts also grew significantly over the period, and currently account for 9% and 5% respectively of total income reported. In contrast, the income reported by testamentary trusts and employee benefit trusts remained relatively stable (employee benefit trusts are largely exempt from income tax and from filing a trust tax return, and as such do not report significant income in the aggregate). The income reported by wealth management trusts, testamentary trusts and other trusts spiked in 2015 and then experienced a one-year decrease in 2016.
Chart 6
Total Adjusted Income, Selected Trust Categories (millions of dollars)
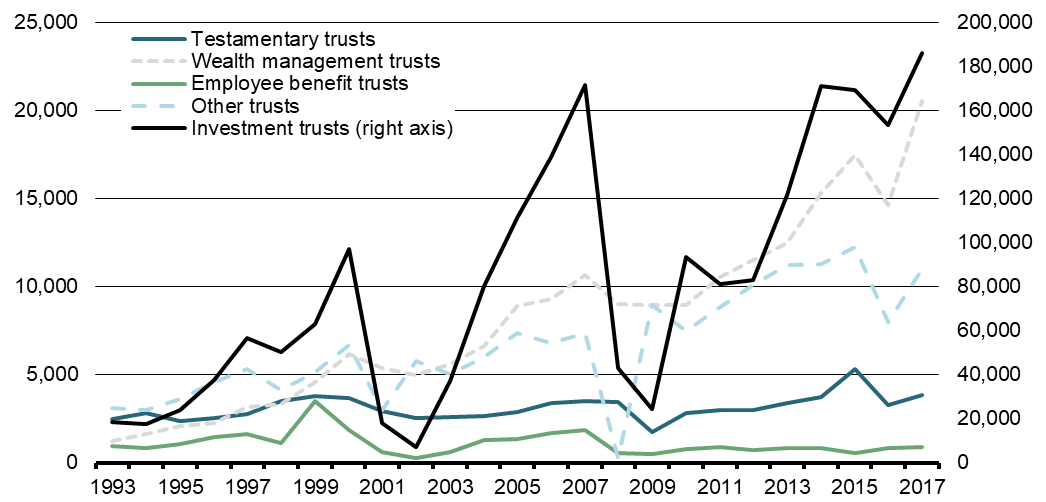
Care should be taken in interpreting these income figures, as total trust income is over-estimated to the extent that the income that a trust derives from another trust is counted twice. Such double-counting has likely become more significant over time in light of the growth over the period of mutual funds and exchange-traded funds that invest in other funds ("funds of funds").
Chart 7 shows the average adjusted trust income by trust category. Investment trusts have the highest average income, at some $15.8 million on average over the last five years, followed by employee benefit trusts ($865,000), other trusts ($626,000), wealth management trusts ($236,000) and testamentary trusts ($38,500).
Chart 7
Average Adjusted Income, Selected Trust Categories (dollars)
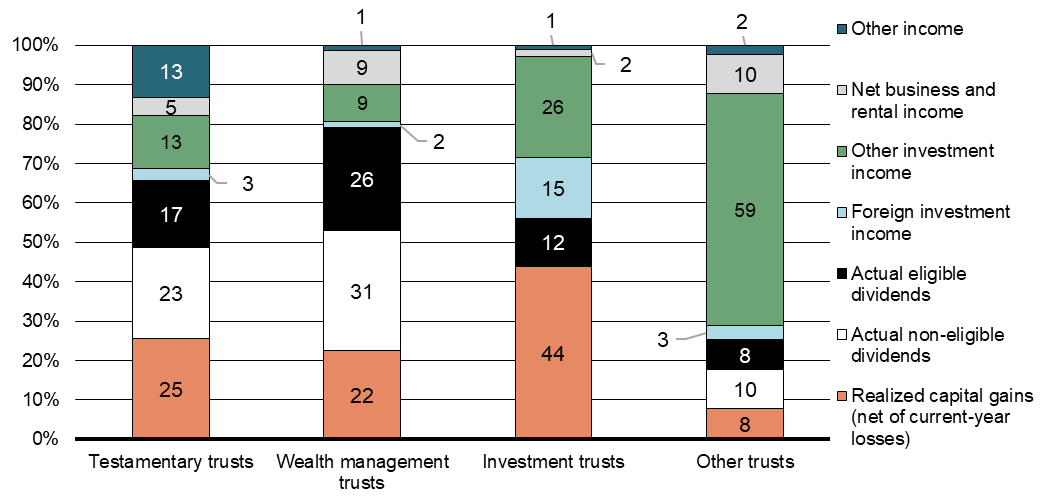
Sources of income differ significantly across categories of trusts (Chart 8). Capital gains represent 44% on average of the adjusted income of investment trusts, versus 25% of the income of testamentary trusts and 22% of the income of wealth management trusts. Non-eligible dividends (which in large part consist in dividends received from small privately owned Canadian corporations) account for 23% and 31% of the total income of testamentary trusts and wealth management trusts, but a negligible fraction of the income of investment trusts. In turn, eligible dividends (which mainly consist in dividends from larger corporations) account for 17% and 26% of the total income of testamentary trusts and wealth management trusts. Foreign investment income and other investment income account for a significantly larger share of the income of investment trusts and other trusts compared to testamentary trusts and wealth management trusts. Net business and rental income represents about 10% of the income of wealth management trusts and other trusts, 5% of the income of testamentary trusts, and a negligible share of the income of investment trusts.
Chart 8
Distribution of Total Adjusted Income by Income Source, Average 2010-2017 (%)
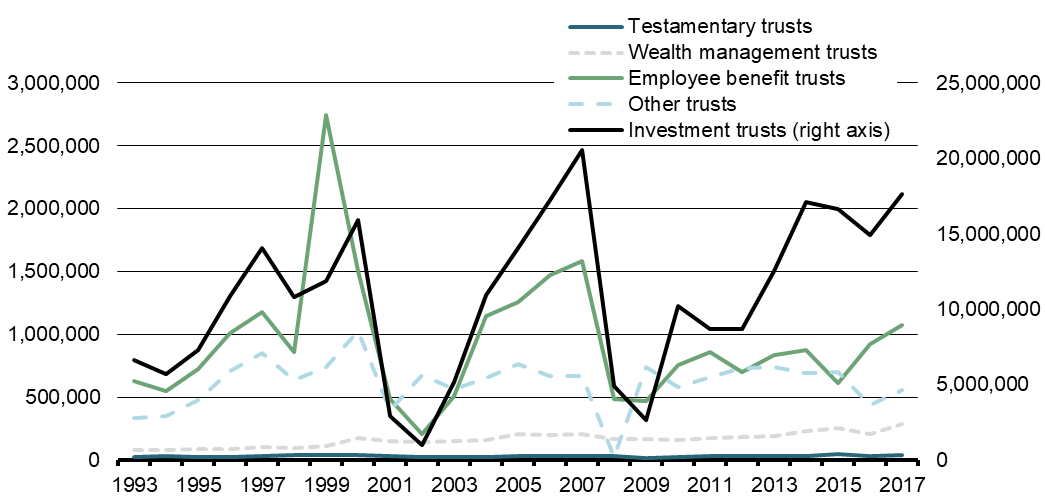
Charts 9 and 10 show the evolution in the composition of the total adjusted income of wealth management trusts and investment trusts since 1993. Wealth management trusts have been reporting increasingly large amounts of capital gains and taxable Canadian dividends (both eligible and non-eligible) since the end of the financial crisis. As for investment trusts, Chart 10 shows that the high variability of their reported income reflects large swings in reported capital gains and losses that have tracked stock market cycles. Other investment income (which includes Canadian-source interest income) of investment trusts grew strongly between 2002 and 2007, reflecting the growth in income trusts over that period.Footnote 15[15] Investment trusts have also been earning increasing amounts of foreign investment income, a change that may be attributable in part to the repeal of the limitation on foreign investment that applied to Registered Retirement Savings Plans before 2005, but may also reflect a greater interest of Canadian investors towards foreign securities.Footnote 16[16]
Chart 9
Wealth Management Trusts, Total Adjusted Income by Income Source
(millions of dollars)
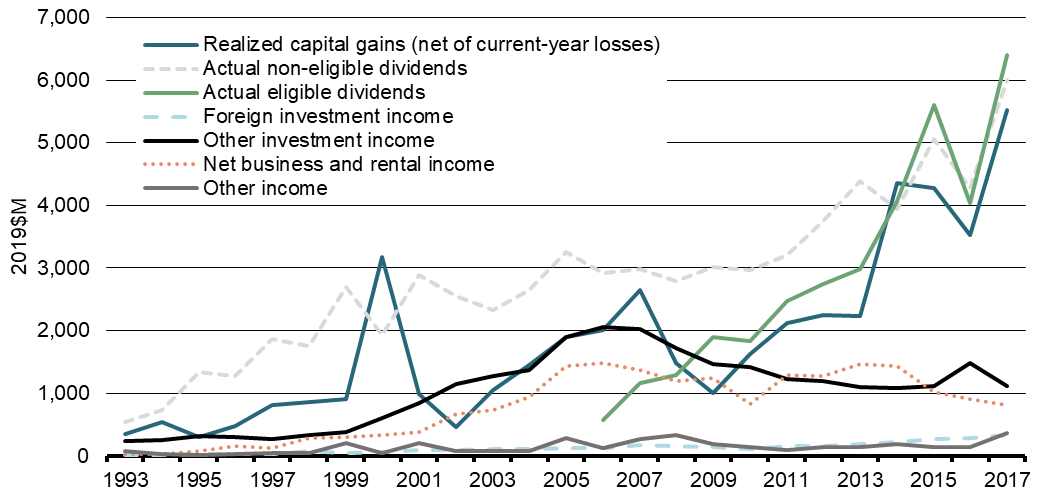
Chart 10
Investment Trusts, Total Adjusted Income by Income Source
(millions of dollars)
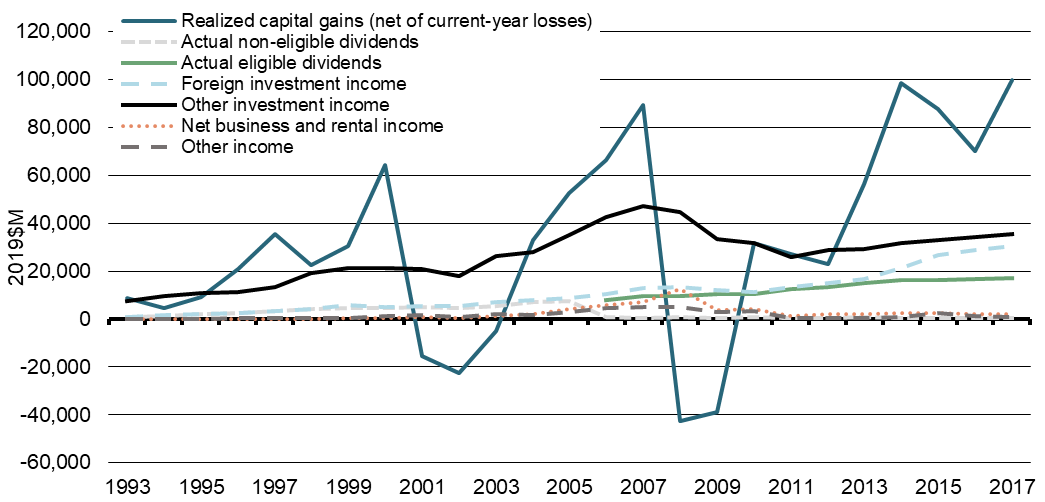
Chart 11
Wealth Management Trusts, Average Adjusted Income by Province
(dollars)
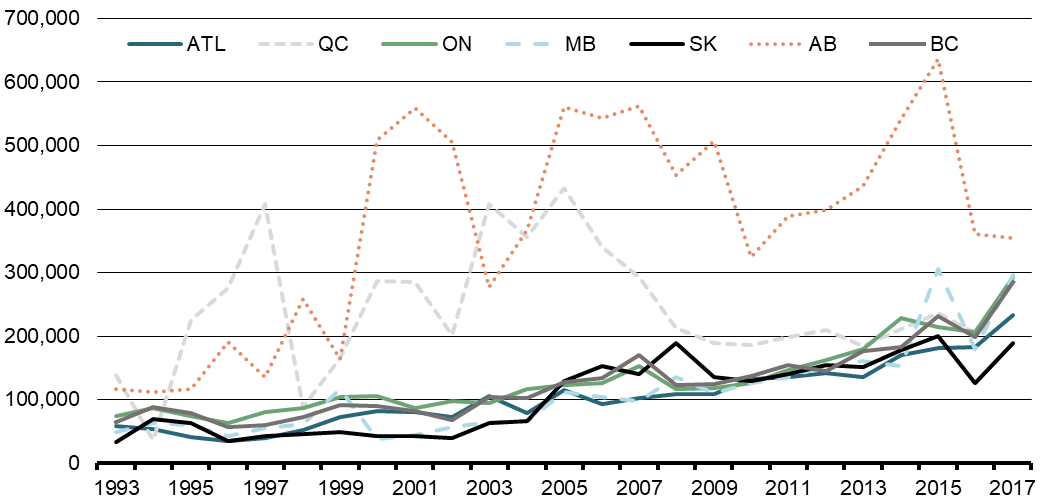
The average income reported by wealth management trusts has been increasing in all provinces since 1993 (Chart 11). Average adjusted income is higher in Alberta than in other provinces, which may be attributable to this province's relatively lower density of wealth management trusts compared to other provinces (see Chart 5). Average income was also higher for wealth management trusts in Quebec up to 2012, but has since been on par with average income in other provinces (except Alberta), reflecting the substantial increase in the number of wealth management trusts in Quebec in recent years (see Chart 5).
Table 3 and Chart 12 provide information on the extent to which the income earned by trusts is being flowed through to their beneficiaries or is retained and taxed within the trusts. As noted in Section 2.2, trusts other than graduated rate estates (and, prior to 2016, other testamentary trusts) pay tax at the top personal income tax rate. This creates a strong incentive for trusts taxed at the top rate to pay out all of their income to their beneficiaries so as to minimize the income that is retained and taxed at the trust level. Indeed, as shown in Table 3, more than 85% of all wealth management trusts, investment trusts and other trusts either had no positive income or retained 5% or less of their income. The proportion of trusts that retained more than 95% of their income varied between 4% and 13% for these categories of trusts. As expected, the retention behaviours of testamentary trusts differ drastically, with some 72% of all testamentary trusts on average having retained more than 95% of their income.Footnote 17[17] Overall, total net income (after allocations) reported by testamentary trusts represented 85% of their total income before allocations (average 2008 to 2017), in comparison to 17%, 15% and 18% for wealth management trusts, investment trusts and other trusts respectively.
| Degree of income retention within the trust |
Testamentary trusts | Wealth management trusts | Investment trusts |
Other trusts |
|---|---|---|---|---|
| Distribution of Total Number of Trusts | ||||
| Income before allocations nil or neg. | 12 | 31 | 33 | 30 |
| Retained 5% or less | 12 | 57 | 52 | 55 |
| Retained between 5% and 50% | 2 | 2 | 8 | 2 |
| Retained between 50% and 95% | 2 | 1 | 3 | 1 |
| Retained more than 95% | 72 | 8 | 4 | 13 |
| Total | 100 | 100 | 100 | 100 |
| Distribution of Total Income Before Allocations | ||||
| Income before allocations nil or neg. | -1 | -2 | -2 | 8 |
| Retained 5% or less | 16 | 82 | 60 | 79 |
| Retained between 5% and 50% | 9 | 3 | 30 | 3 |
| Retained between 50% and 95% | 9 | 4 | 9 | 2 |
| Retained more than 95% | 67 | 13 | 3 | 8 |
| Total | 100 | 100 | 100 | 100 |
| Notes: The data shown in this table excludes trusts that did not file a T3 return. Income before allocations can be negative due to business losses or claimed deductions in excess of reported income. The degree of income retention is calculated as the ratio of income after allocations (line 48 of the general T3 return) to income before allocations (line 46). Employee benefit trusts are not shown as total income before allocations is small or negative for this category of trusts. | ||||
Chart 12
Share of Trusts With Positive Adjusted Income, Income After Allocations and Net Federal Tax (%)
Share with positive adjusted income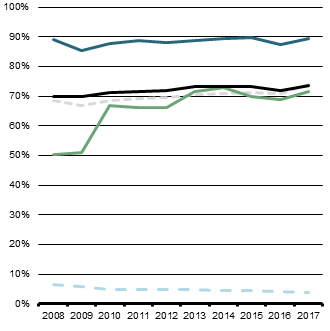
Share with positive income
after allocations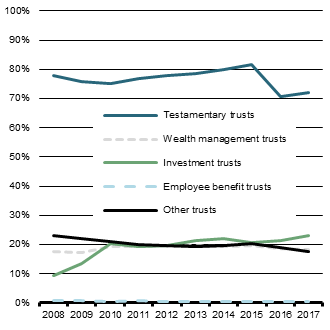
Share with positive net federal tax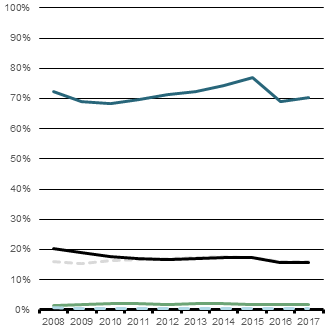
Chart 13 shows the total net federal tax paid by trusts since 1993. Testamentary trusts paid $380 million in net federal taxes on average annually over the last 10 years, compared to $365 million paid by wealth management trusts and $75 million paid by other trusts. Investment trusts and employee benefit trusts (not shown in Chart 13) pay negligible amounts of federal taxes. As previously noted, employee benefit trusts are generally exempt from federal income tax; as for investment trusts, these trusts either flow through most of their income to their investors or, in the case of mutual fund trusts that retain a portion of their capital gains and pay tax on these gains, are eligible for a refund of the taxes paid upon redemption of their trust units.Footnote 18[18]
Chart 11
Wealth Management Trusts, Average Adjusted Income by Province
(dollars)
Chart 13
Net Federal Tax, Selected Trust Categories (millions of dollars)
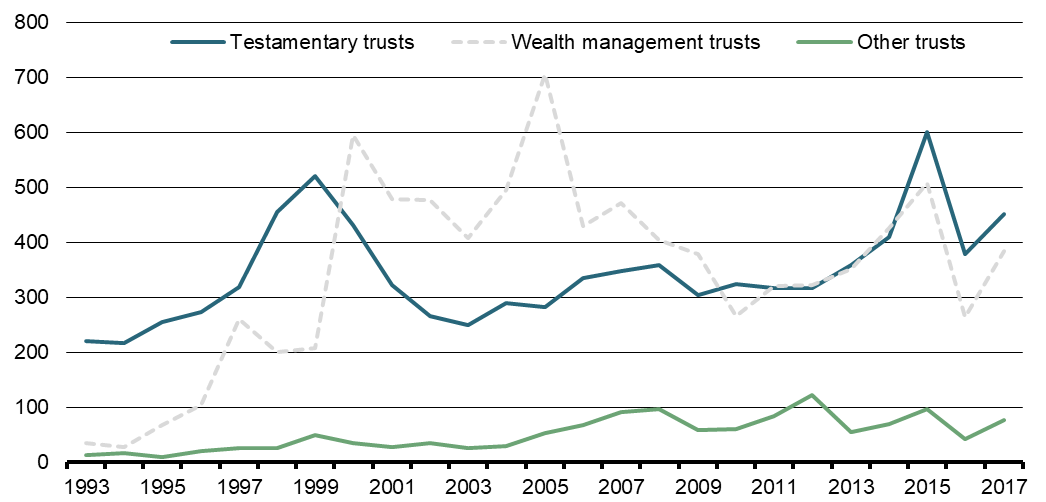
Chart 14
Testamentary Trusts, Net Federal Tax by Province (millions of dollars)
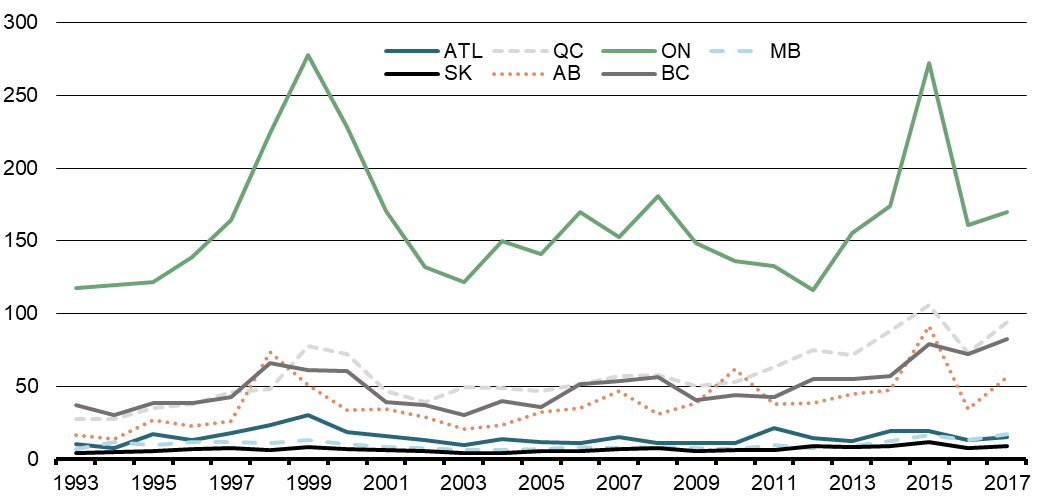
Chart 15
Wealth Management Trusts, Net Federal Tax by Province (millions of dollars)
Charts 14 and 15 break down by province of residence of the trusts the amounts of net federal tax paid by testamentary trusts and wealth management trusts. The provincial distribution of taxes paid by testamentary trusts is broadly in line with the provincial distribution of personal income, with trusts resident in Ontario accounting for about 45% of the total paid on average over the last 10 years. The noticeable surge in net federal taxes paid around 1999 is partly attributable to deemed dispositions that took place that year due to the effect of the 21-year rule mentioned in Section 2.2.Footnote 19[19]
The provincial distribution of taxes paid by wealth management trusts has differed significantly than that for testamentary trusts. Taxes paid by Quebec resident trusts increased substantially between 1998 and 2005, but then decreased sharply. Between 2000 and 2015, Alberta resident trusts accounted for the largest share of net federal tax paid among all provinces (except for a short period between 2003 and 2005 when the largest share accrued to trusts resident in Quebec), but taxes paid decreased sharply in 2016.
4. Profile of Settlors of Testamentary Trusts
This section presents information on individuals who were the settlors of testamentary trusts over the period 2002 to 2015. The information was extracted from individual income tax (T1) filings of the deceased individuals that were matched to income tax (T3) filings of related testamentary trusts.Footnote 20[20]
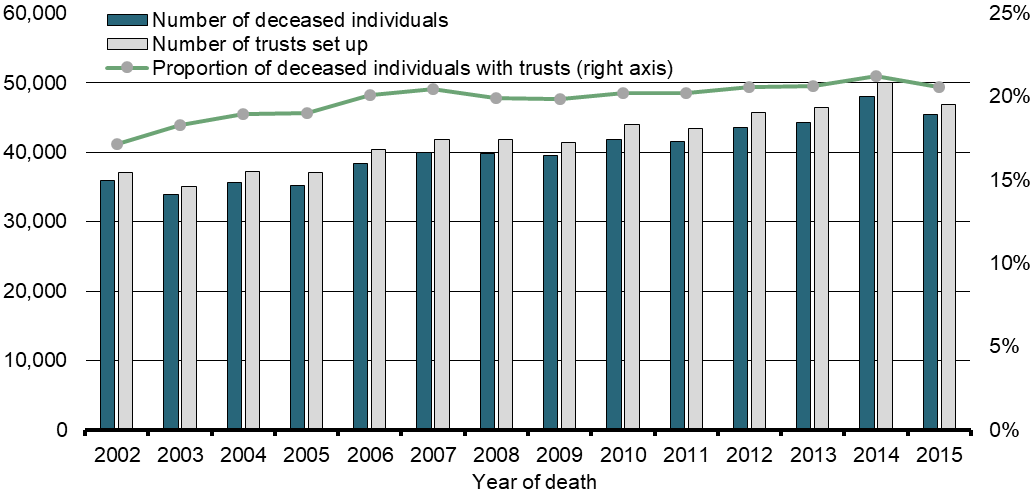
As shown in Chart 16, some 46,800 testamentary trusts were set up in 2015 in respect of 45,500 individuals who died that year (a small number of individuals set up more than one testamentary trust each). About one in five individuals who died in 2015 had set up a testamentary trust. The number of individuals who set up testamentary trusts and the proportion of deceased individuals who had set up testamentary trusts have both been increasing slowly since 2002.
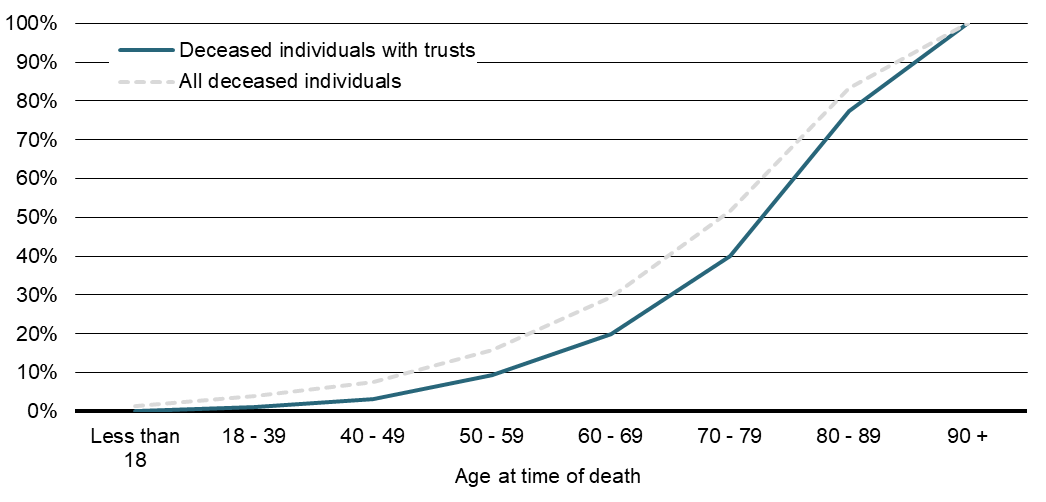
It could be expected that testamentary trusts would be more frequently set up by individuals who do not have a surviving spouse or partner who could inherit and manage their estate. A number of facts bear out this expectation. First, the propensity to have a testamentary trust is higher among deceased individuals who were single at time of death, especially if those individuals had not been in a couple before (Table 4).Footnote 21[21] Indeed, individuals who were in couple at time of death account for only 8% of all deceased individuals who set up testamentary trusts (not shown). Second, the propensity to have a testamentary trust is slightly higher for deceased women than for deceased men (Table 4), which is in line with the fact that women are generally more likely than men to survive their spouse or partner. Finally, the proportion of deceased individuals who have set up a testamentary trust increases slightly with age at time of death (Chart 17), consistent with the fact that settlors of testamentary trusts are more likely to be the surviving spouses or partners.
Chart 16
Number of Deceased Individuals With Testamentary Trusts, Number of Testamentary Trusts Set Up and Proportion of Deceased Individuals With Testamentary Trusts
| By couple status | Proportion with a testamentary trust (%) |
|---|---|
| In a couple at time of death | 10 |
| Not in a couple at time of death, but in a couple before | 19 |
| Not in a couple, either at time of death or before | 25 |
| By sex of deceased individual | |
| Men | 19 |
| Women | 21 |
Chart 17
Number of Deceased Individuals With and Without Testamentary Trusts, Cumulative Distributions by Age at Time of Death (%, average 2002-2015)
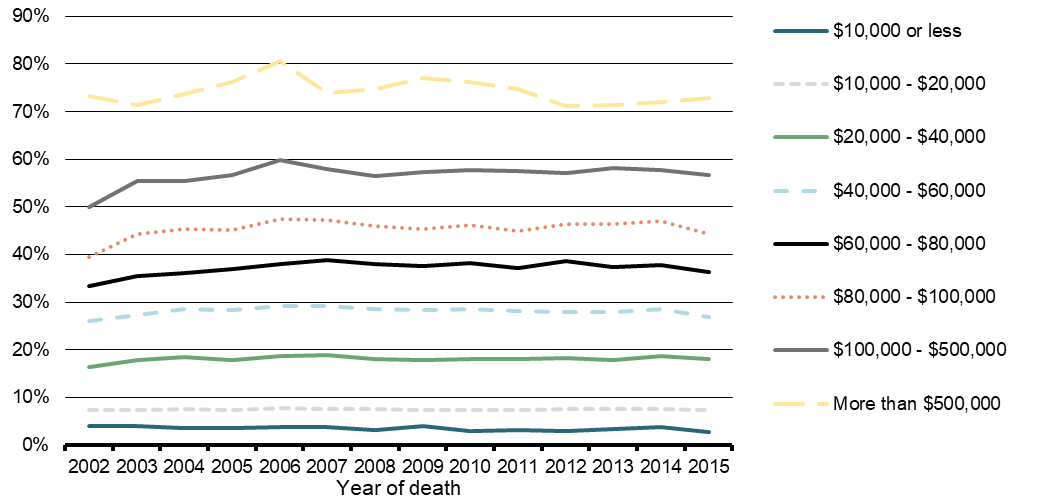
The propensity to have a testamentary trust also increases with income (Chart 18). Close to 60% of deceased individuals with average income of $100,000 or more had set up a testamentary trust, compared to less than 10% of deceased individuals with average income below $20,000. However, as high-income individuals remain a relatively small group of the population, deceased individuals with average income of $100,000 or more represent a relatively small fraction (11% on average) of all testamentary trusts.
Chart 18
Proportion of Deceased Individuals With a Testamentary Trust, by Average Income (%)
5. Conclusion
The analysis and commentary presented in this study are intended to emphasize the relevance of trusts within the Canadian income tax system. Overall, there has been significant growth in the number of trusts set up in recent decades, as well as in income reported and federal tax paid by trusts. There are dozens of different types of trusts, each with different purposes and objectives. Investment trusts, particularly mutual fund trusts, continue to represent the largest category of trusts by income, but pay little income tax as they flow essentially all of their income to investors. Testamentary trusts account for the largest number of trusts and largest share of federal income taxes paid by trusts. The use of wealth management trusts has also grown significantly over time.
References
Chow, Grace and Prior, Ian (2018). Taxation of Trusts and Estates—A Practitioner's Guide 2019, Thomson Reuters. Toronto, Ontario, Canada.
Department of Finance Canada (2005a). The Budget Plan 2005. Ottawa, Ontario, Canada.
Department of Finance Canada (2005b). Tax and Other Issues Related to Publicly-Listed Flow-Through Entities (Income Trusts and Limited Partnerships),Publication No. 2005-055. Ottawa, Ontario, Canada.
Department of Finance Canada (2013). Government Invites Comments on Proposals to Improve the Integrity of the Federal Tax System by Limiting Access to Graduated Rates for Trusts and Certain Estates, Publication No. 2013-080. Ottawa, Ontario, Canada.
Department of Finance Canada (2018). "Evaluation of the Non-Taxation of Capital Gains on Donations of Publicly Listed Securities," Report on Federal Tax Expenditures: Concepts, Estimates and Evaluations—2018. Ottawa, Ontario, Canada.
Dolson, H.M. (2014). "Trust Residence After Garron: Provincial Considerations," Canadian Tax Journal, 62(3), 671-699.
Edgar, T. (2004). "The Trouble With Income Trusts," Canadian Tax Journal, 52(3), 819-852.
Hawkesworth, K.B. (1992). "Planning for 1993: Proposed Amendments to the Deemed Realization Rules for Trusts," Canadian Tax Journal, 40(1), 190-209.
Investment Funds Institute of Canada (2018). Monthly Statistics—August 2018 [Data File]. Available at: https://www.ific.ca/en/stats.
McCarley, B. and Christian, D. (1995). "Changes in the Taxation of Trusts Resulting From the 1995 Federal Budget," 1995 British Columbia Tax Conference, 5, 1-78.
McKenzie, K. (2006). "Income Taxes, Integration, and Income Trusts," Canadian Tax Journal, 54(3), 633-656.
Rochwerg, M. (2003). "Using Trusts as an Income-Splitting Tool," Report of the Proceedings of Fifty-Fifth Tax Conference, 2003, 18:1-30.
Roth, E. S., Youdan, T., Anderson, C. and Brown, K. (2016). Canadian Taxation of Trusts, Canadian Tax Foundation. Toronto, Ontario, Canada.
van Voorst (2006). Interprovincial Tax Planning—An Update. 2006 Ontario Tax Conference, 5, 1-48.
Waters, D.W.M., Gillen, M.R. and Smith, L.D. (2012). Waters' Law of Trusts in Canada (4th ed.), Carswell. Toronto, Ontario, Canada.
Young, K.C. (2004). "Mutual Fund and Segregated Fund Flowthrough Tax Rules: Resolving the Inconsistencies," Canadian Tax Journal, 52(3), 884-924.
Footnote 11 The analysis presented in this paper was prepared by Scott Legree and David Messier, respectively former economist and economist, Tax Policy Branch, Department of Finance Canada. Enquiries regarding Department of Finance Canada publications can be sent to finpub@canada.ca.
Footnote 22 This definition is found in Chow and Pryor (2018).
Footnote 33 The federal Income Tax Act does not formally define what a trust is, other than to specify that a trust includes an estate and that a reference to a trust or estate is to be read to include a reference to the "trustee, executor, administrator, liquidator of a succession, heir or other legal representative having ownership or control of the trust property". It also deems some entities created under the Quebec Civil Code to be trusts for federal income tax purposes (Quebec's laws governing trusts differ significantly from the common law applicable in other Canadian provinces).
Footnote 44 In general terms: a personal trust is a trust in which no beneficial interest was acquired for consideration payable directly or indirectly to the trust or to any person or partnership that has made a contribution to the trust; a family trust (not a type of trust that is defined in the Income Tax Act) is a trust whose settlors and beneficiaries are related; a spousal or common-law partner trust is a trust where the settlor's spouse or partner is entitled to all of the trust income during the lifetime of the settlor and his or her spouse or partner, and no other person can receive any income or capital from the trust during that period; and an alter ago trust is a trust where the settlor is 65 years old or over and is the only person entitled to receive the income and capital of the trust until his or her death.
Footnote 55 Specified investment flow-through trusts are categorized as investment trusts, even though many such trusts are carrying on businesses. Information on trust types is as reported to the Canada Revenue Agency and corresponds to the different types of trusts that are listed in the Agency's T3 Trust Guide (publication T4013). Trust types correspond to the type of a trust as of 2017; since the type of a trust can change over time, this may result in the misclassification of certain trusts for years prior to 2017.
Footnote 66 Certain types of trusts are exempt from income tax in Canada (provided certain conditions are met), including most employee benefit trusts and registered savings plans trusts.
Footnote 77 Before 2016, all testamentary trusts as well as certain grandfathered inter vivos trusts paid income tax at the graduated income tax rates.
Footnote 88 These deemed disposition rules generally do not apply to investment trusts, employee benefit trusts and registered savings plans trusts. The initial deemed disposition date is also postponed in the case of certain spousal and common-law partner trusts, joint spousal and common-law partner trusts and alter ego trusts.
Footnote 99 All testamentary trusts could benefit from the $40,000 basic exemption prior to 2016.
Footnote 1010 The information covers filings of the general T3 Trust Income Tax and Information return as well as filings of the "special" T3 returns (T3D, T3P, T3S, T3IND-RESP, T3RI, T3R-IND, T3RIF-IND, T3ATH-IND, T3M, T3GR, T3-1061 or T3RCA), which are filed by specific types of trusts only. Information on income and taxes paid by trusts is generally extracted from the general T3 return, and as such would not cover trusts filing a special T3 return.
Footnote 1111 There are some special cases where trusts not meeting these conditions may still be required to file. New reporting requirements have been proposed in Budget 2018 that, when in effect in 2021, will extend T3 filing requirements to a larger number of trusts, as well as provide for the reporting of detailed beneficial ownership information on an annual basis.
Footnote 1212 Prior to 2016, any testamentary trust could have a non-calendar taxation year-end.
Footnote 1313 Following a recent Supreme Court of Canada decision, the residence of a trust is now generally accepted to be the location where the central management and control of the trust is exercised, as determined based on all relevant facts and circumstances. See Roth et al. (2016) at 710. Prior to that decision, the residence of a trust generally corresponded to the residence of the trustee or trustees that controlled the property of the trust. Certain non-resident trusts can be deemed to be resident in Canada for income tax purposes.
Footnote 1414 Registered savings plans trusts report negligible amounts of income, and are therefore excluded from the statistics presented in this section. The category "other trusts" includes the other types of trusts mentioned at the end of Section 2.1 (except charitable trusts) as well as trusts identified as "other inter vivos trusts" in the Canada Revenue Agency data.
Footnote 1515 See Department of Finance Canada (2005b), Edgar (2004) and McKenzie (2006) for additional information on income trusts. New rules were announced on October 31, 2006 to effectively tax income trusts on the same basis as corporations. These rules, which were fully phased-in by 2011, effectively ended the growth of this sector.
Footnote 1616 The foreign property rule limited the amount of foreign investments an individual could own in a Registered Retirement Savings Plan or Registered Pension Plan to 30% of the total assets owned. This rule was repealed as of 2005.
Footnote 1717 This corresponds to the average for years 2008 to 2017. A significant decrease is observed as of 2016 when access to the graduated rate structure was limited to graduated rate estates and qualified disability trusts. While 74% of all testamentary trusts retained more than 95% of their income on average between 2008 and 2015, this proportion decreased to 66% in 2016 and 2017.
Footnote 1818 The refundable capital gains tax mechanism for mutual fund trusts ensures the proper integration between taxes paid at the trust level and taxes paid at the investor level, and operates in a similar manner as the refundable capital gains tax for investment and mutual fund corporations (see the description of this measure in Part 3 of this report).
Footnote 1919 Although the first deemed dispositions took place in 1993 (that is, 21 years after the introduction of capital gains taxation in 1972), legislation was passed in the early 1990s that allowed trusts to elect to defer the deemed disposition until 1999. Some 2,300 deemed dispositions were reported in 1993 by testamentary trusts versus 2,850 in 1999 and 760 in 2014 (or 21 years after 1993).
Footnote 2020 A small proportion (about 3%) of all testamentary trusts that were created over that period were excluded from the analysis, either because these trusts did not report the social insurance numbers of the deceased individuals or because the deceased individuals did not file a T1 return. The absence of any T1 filings for certain deceased individuals may be attributable to late filings (i.e., T1 returns filed too late to be included in the datasets used for this analysis) or the fact that these deceased individuals were not required to file a T1 return.
Footnote 2121 Couple status prior to the year of death is determined on the basis of couple status in all prior years an individual has filed a T1 return since 1995. To account for the possibility that an individual has been widowed for many years prior to his or her death, an individual is deemed to have been in a couple prior to death if he or she has been in a couple at least half the years for which he or she filed a T1 return.