
Report on Federal Tax Expenditures - Concepts, Estimates and Evaluations 2020: part 9
The Refundable Medical Expense Supplement: A Profile of Beneficiaries [1]
1. Introduction
In Canada, federal, provincial and territorial tax systems contain measures that provide support to individuals and families dealing with significant medical expenses. These measures include the Refundable Medical Expense Supplement (RMES). Introduced in 1997, the RMES was designed to address barriers to labour force participation for Canadians with disabilities by helping to offset the loss of coverage for medical and disability-related expenses when individuals move from social assistance to the paid labour force. More generally, the RMES aims to provide tax relief to low-income working individuals with above-average medical expenses.[2]
This paper presents a profile of RMES beneficiaries. It begins by providing an overview of the measure and its eligibility criteria. A statistical profile of the eligible and beneficiary populations is presented, followed by an analysis of the evolution of several RMES indicators since the introduction of the measure. A discussion ensues on the interaction between the RMES and other measures that provide tax relief for persons with significant medical or disability-related expenses and measures that encourage labour market participation. The paper also includes a longitudinal analysis on trends related to the RMES.
2. Background information on the Refundable Medical Expense Supplement
2.1 Description of the Refundable Medical Expense Supplement
Introduced in 1997, the RMES is a refundable federal tax credit provided to individuals in low-income families, to provide some compensation for the medical and disability-related expenses they incur. Since the RMES is refundable, taxfilers whose income is too low to pay taxes can benefit from the measure. The RMES can be claimed by filing a tax return with the Canada Revenue Agency (CRA).
The RMES amount benefiting a given taxfiler is equal to 25% of total eligible medical expenses claimed under the Medical Expense Tax Credit (METC) and the disability supports deduction (DSD), up to a maximum credit amount of $1,203 in 2017.[3] Since the RMES depends on eligible costs for the METC and the DSD, which both aim to provide tax relief for medical and/or disability-related expenses, both the eligibility criteria for and the amount claimed under the RMES are intrinsically tied to the characteristics of these two measures. The METC and the DSD are not analyzed in this report, but a description of both measures, along with the characteristics of medical expenses claimed by RMES beneficiaries, are considered in Section 4.1.
To be eligible for the RMES in a given year, taxfilers must meet the following five criteria:
- Age—The individual is at least 18 years of age at the end of the taxation year.
- Residence—The individual is a resident in Canada throughout the year.
- Medical expenses—The individual reports eligible medical expenses under the METC (i.e., expenses in excess of the lesser of the following amounts: 3% of net personal income and $2,268[4] in 2017) for themselves, their spouse or common-law partner or a dependant (children under the age of 18 or a family member), or an amount for the DSD.
- Personal working income—The individual's net personal income from employment or self-employment is greater than or equal to the minimum earnings threshold. The threshold was introduced to target taxpayers showing sufficient participation in the labour force, and in 2017, it was $3,514.
- Family income—The individual's net family income[5] is below a certain level. In 2017, the maximum amount of the RMES was clawed back at a rate of 5%, starting at net family income of $26,644, and entirely eliminated when net family income reached $50,704. The net family income reduction threshold and the reduction rate were established to target lower-income taxfilers.[6]
In 1997, the maximum amount of supplement that could be paid was $500. From 2000 onward, the maximum amount of the RMES, the minimum earnings threshold, and the net family income reduction threshold were indexed to inflation. Since 1997, the reduction rate has remained at 5%. The maximum amount further increased from the indexed value to $750 in 2005 and to $1,000 in 2006. Since then, no further substantial changes have been made to the RMES (Figure 1).[7]
Figure 1
Maximum amount of the Refundable Medical Expense Supplement, selected years

3. Statistical profile
Since the objective of the RMES is to provide support for persons with disabilities entering the labour market, it is useful to determine the extent to which the RMES benefits these individuals. To assess whether the RMES reaches Canadians with a disability in the labour force, the population of persons with disabilities needs to be identified. The two most direct tax measures in the T1 return that recognize costs associated with disabilities are the disability supports deduction (DSD) and the Disability Tax Credit (DTC).[8] However, using DSD and DTC claimants as a proxy for identifying persons with disabilities underestimates the population of Canadian taxfilers with a disability and may introduce bias into reported results. For instance, in order to claim the DTC, taxfilers must have a severe and prolonged disability, so it is not possible to identify individuals with mild to moderate disabilities, based on DTC claims. The Canadian Survey on Disability, which is the most comprehensive source of information on persons with disabilities in Canada, estimates that, in 2017, roughly 6.2 million Canadians over the age of 15 had a disability that limited them in performing daily activities, with 57% reporting a mild or moderate disability.[9] In contrast, in the 2017 T1 return, there were 767,900 self-claimants of the DSD or DTC.[10] Because of the challenge of identifying persons with disabilities in the tax data, this study presents a profile of the RMES-eligible and beneficiary populations among all filers, instead of among persons with disabilities.
3.1 Profile of the beneficiary population
Using individual taxfiler data, this section analyzes eligibility for the RMES among the population of Canadian taxfilers, along with characteristics of the beneficiary population. The eligible population is defined as all filers who, according to the information reported in their income tax returns, meet all the eligibility criteria of the supplement, i.e., age, residence, medical expenses, personal working income, and net family income. The beneficiary population is defined as all taxfilers to whom an RMES amount was paid following the assessment of their income tax return by the CRA. The profile of beneficiaries is based on the following personal identity factors: gender, age, province of residence, family type, and total personal income.
Over 27.8 million Canadians filed an income tax return in 2017. As a whole, Canadian taxfilers made up 20.2 million families. Over half (55.0%) lived in a couple with another taxfiler,[11] while 45.0% were sole filers.[12] Table 1 depicts the proportion of all taxfilers, men, and women who met the RMES eligibility criteria in 2017. Among the 27.8 million taxfilers, almost two-thirds (63.6%) reported personal working income at least equal to the RMES minimum earnings threshold of $3,514 and 18.3% claimed eligible medical expenses under the METC or DSD. Nearly half (49.0%) of all taxfilers had reported moderate family income, which is a net family income less than $50,704. Among taxfilers with a moderate family income, 57.4% had net family income that was sufficiently low (less than $26,644) to be eligible for the maximum supplement. The remaining 42.6% had income ($26,644 - $50,704) that did not guarantee the receipt of a supplement amount, since, in their case, eligibility was based on a combination of their level of net family income and eligible medical expenses.
| All | Men | Women | |
|---|---|---|---|
| All Taxfilers (#) | 27,847,900 | 13,461,600 | 14,348,000 |
| Filers 18 and over who lived in Canada all year* | 98.3 | 98.2 | 98.3 |
| Filers with sufficient working income | 63.6 | 68.3 | 59.3 |
| Filers who reported eligible medical expenses | 18.3 | 15.1 | 21.4 |
| Filers with low family income** | 28.1 | 26.0 | 30.0 |
| Filers with moderate family income*** | 49.0 | 46.5 | 51.3 |
| Eligibility rate**** | 2.1 | 1.7 | 2.5 |
| Benefit rate***** | 97.8 | 97.6 | 98.0 |
| Note: The sum of the total number of men and women does not necessarily correspond to the total number of filers, since there are some filers whose gender could not be identified.
*Accurate identification of residence status requires knowing whether taxfilers resided in Canada during the entire year, which is not possible using the tax data. However, the data did allow for the identification of taxfilers who immigrated or emigrated during the taxation year and thus, the exclusion of those who, based on their date of immigration or emigration, had not resided in Canada for at least 183 days. **Low family income refers to a level of net family income that is less than the net family income threshold of $26,644. Filers reporting low family income are eligible for the maximum supplement amount. ***Moderate family income refers to a level of net family income that is less than the level above which no supplement can be paid ($50,704). Among filers with a net family income between the low family income and moderate family income thresholds ($26,644-$50,704), only those who claim a sufficiently high level of medical expenses, taking into account the applied reduction rate (5%), are eligible to receive an RMES amount. ****The eligibility rate is the proportion of eligible taxfilers among all taxfilers. *****The benefit rate is the proportion of beneficiaries among all claimants. Source: 2017 T1 tax returns. |
|||
Table 1 shows that among all 2017 taxfilers, 2.1% met all the RMES eligibility criteria, corresponding to approximately 592,300 filers. Out of 568,400 filers who claimed the RMES, 556,100 received a positive amount, which is equivalent to a benefit rate of 97.8%.[13] If the supplement had not been refundable, only 44.7% of all beneficiaries would have been able to benefit from it in 2017, since 55.3% had no federal income tax payable (notably due to the Basic Personal Amount) before the calculation of refundable credits.
Table 2 shows that, in total, $156.2 million was paid in RMES in 2017, for an average amount of $281 per beneficiary. Only 2.2% of beneficiaries received the maximum supplement amount of $1,203.
| All | Men | Women | |
|---|---|---|---|
| Beneficiaries (#) | 556,100 | 213,400 | 342,400 |
| Tax savings realized by taxfilers due to the RMES ($ millions) | 156.2 | 60.3 | 95.8 |
| Average amount per beneficiary ($) | 281 | 283 | 280 |
| Distribution of RMES beneficiaries based on amount received (%) | |||
| Between $1 and $249 | 61.2 | 61.2 | 61.1 |
| Between $250 and $499 | 20.8 | 20.4 | 21.0 |
| Between $500 and $749 | 9.1 | 9.1 | 9.1 |
| Between $750 and $999 | 4.7 | 4.9 | 4.5 |
| $1,000 and over | 4.3 | 4.5 | 4.2 |
| Proportion of beneficiaries who received the maximum RMES amount (%) | 2.2 | 2.2 | 2.0 |
| Note: The sum of the total number of male and female beneficiaries does not necessarily correspond to the total number of beneficiaries, since there are some filers whose gender could not be identified.
Source: 2017 T1 tax returns. |
|||
Gender
As presented in Table 1, more than half of the 27.8 million taxfilers in 2017 were women (51.5%) and 48.3% were men. Women were more likely to have reported eligible medical expenses, a low family income, and a moderate family income. However, women were less likely than men to have reported sufficient working income. Overall, women had a higher eligibility rate than men (2.5% versus 1.7%). While women represented 51.5% of Canadian taxfilers in 2017 and reported 41.8% of pre-tax income, they represented a significantly higher proportion of the number of RMES beneficiaries (61.6%).[15] Moreover, they received 61.3% of the total amount of RMES payments (Table 2).
Age group
As shown in Table 3, eligibility and benefits from the RMES vary according to age group. Taxfilers aged 18 to 24 had the highest eligibility rate for the RMES (3.6%), particularly since they were more likely to have a moderate family income. Although the proportion of filers reporting eligible medical expenses gradually increased with age, reaching 33.5% among those 75 and older, elderly taxfilers (those 65 and over) had the lowest RMES eligibility rate of all age groups, primarily because they did not meet the personal working income criterion.
Province of residence
Table 3 shows that taxfilers residing in Quebec consisted of only 23.6% of Canadian taxfilers in 2017 yet they made up 45.8% of all RMES beneficiaries. In contrast, the reverse was true for filers from Ontario and to a lesser extent, filers from Alberta and British Columbia. Table 3 shows that these differences are likely the result of varying eligibility rates, which seem to stem primarily from the significantly larger proportion of taxfilers reporting eligible medical expenses in Quebec, relative to other provinces. Quebec filers were more likely to have claimed eligible medical expenses (33.1%) than their Ontario counterparts (12.0%).
This trend could be explained by a few factors that may incentivize Quebec filers to track and report medical expenses, including a provincial METC (similar to other provinces), a provincial refundable tax credit for medical expenses, and unique tax treatment of employer paid benefits from private health and dental plans. Quebec is also the only province or territory with a public drug insurance plan under which annual premiums can be claimed for the federal METC.
Family type
As shown in Table 4, sole filers (with or without children) were over-represented among RMES beneficiaries, consisting of 45.3% of filers in Canada and making up 76.8% of RMES beneficiaries in 2017. Among sole filers, 10.2% were eligible for the RMES compared to 1.9% of filers in a couple. Sole filers with children had the highest eligibility rate for the supplement (6.9%). The moderate family income criterion contributes the most to explaining the higher RMES eligibility rate among sole filers, since filers in a couple were considerably less likely to report net family income below the moderate family income threshold (24.5% compared to 78.7% of sole filers).[14] Moreover, filers with dependent children were slightly more likely to be eligible for the supplement.
Total personal income group
Table 4 shows that more than one-third (39.1%) of filers reported total personal income (individual income, not family income) less than $25,000 in 2017, yet they made up nearly two-thirds (64.7%) of RMES beneficiaries. The RMES eligibility rate was highest among filers with an annual personal income between $12,500 and $25,000 (4.4%) and between $25,000 and $37,500 (4.2%). Those with personal income below $12,500 were less likely to be eligible for the RMES because a smaller proportion of them reported sufficient working income or eligible medical expenses. In accordance with the RMES net family income threshold, the eligibility rate diminishes considerably among filers reporting total personal income above $37,500.
| Distribution of taxfilers (%) | Eligibility rate (%) | % with sufficient working income | % with eligible medical expenses | % with moderate family income | Benefit rate (%) | Distribution of beneficiaries (%) |
Average amount per beneficiary ($) | Distribution of total RMES amount (%) | |
|---|---|---|---|---|---|---|---|---|---|
| Age Group | |||||||||
| 18-24 years | 10.0 | 3.6 | 76.7 | 5.6 | 92.0 | 99.3 | 17.5 | 204 | 12.7 |
| 25-34 years | 16.7 | 2.6 | 83.6 | 10.7 | 51.7 | 98.8 | 20.8 | 247 | 18.3 |
| 35-44 years | 16.2 | 2.3 | 83.6 | 15.1 | 34.4 | 98.4 | 17.2 | 308 | 18.9 |
| 45-54 years | 16.7 | 2.4 | 82.6 | 17.1 | 32.9 | 92.6 | 18.7 | 319 | 21.3 |
| 55-64 years | 17.5 | 2.6 | 65.6 | 21.8 | 37.1 | 97.8 | 20.0 | 313 | 22.3 |
| 65-74 years | 12.9 | 0.8 | 22.1 | 29.2 | 48.2 | 90.9 | 4.7 | 312 | 5.2 |
| 75 years and over | 10.0 | 0.2 | 4.2 | 33.5 | 67.0 | 77.8 | 1.0 | 358 | 1.3 |
| Province of Residence | |||||||||
| Newfoundland and Labrador | 1.5 | 2.1 | 59.2 | 22.8 | 50.3 | 97.7 | 1.4 | 303 | 1.5 |
| Prince Edward Island | 0.4 | 2.7 | 66.4 | 25.1 | 51.4 | 98.2 | 0.5 | 270 | 0.5 |
| Nova Scotia | 2.7 | 2.4 | 59.9 | 22.1 | 52.2 | 98.0 | 2.9 | 265 | 2.7 |
| New Brunswick | 2.2 | 2.7 | 61.4 | 24.1 | 53.2 | 98.3 | 2.7 | 282 | 2.8 |
| Quebec | 23.6 | 4.1 | 62.5 | 33.1 | 52.2 | 97.7 | 45.8 | 248 | 40.5 |
| Ontario | 37.9 | 1.4 | 63.3 | 12.0 | 48.9 | 98.2 | 25.7 | 307 | 28.0 |
| Manitoba | 3.5 | 1.9 | 65.1 | 17.2 | 50.5 | 98.2 | 3.1 | 296 | 3.2 |
| Saskatchewan | 3.0 | 1.6 | 65.6 | 15.3 | 45.7 | 97.8 | 2.2 | 341 | 2.7 |
| Alberta | 11.0 | 1.3 | 69.2 | 12.8 | 40.9 | 97.7 | 6.6 | 325 | 7.7 |
| British Columbia | 13.5 | 1.4 | 63.0 | 14.1 | 48.6 | 97.5 | 8.9 | 322 | 10.3 |
| Territories | 0.7 | 0.0 | 52.0 | 5.0 | 63.3 | 88.0 | 0.1 | 325 | 0.1 |
| All Taxfilers | 100.0 | 2.1 | 63.6 | 18.3 | 49.0 | 97.9 | 100.0 | 281 | 100.0 |
| Source: 2017 T1 tax returns. | |||||||||
| Distribution of taxfilers (%) | Eligibility rate (%) | % with sufficient working income | % with eligible medical expenses | % with moderate family income | Benefit rate (%) | Distribution of beneficiaries (%) | Average amount per beneficiary ($) | Distribution of total RMES amount (%) | |
|---|---|---|---|---|---|---|---|---|---|
| Family Type | |||||||||
| Sole filers without children | 41.3 | 3.3 | 61.4 | 15.1 | 78.7 | 97.9 | 63.9 | 249 | 56.7 |
| Sole filers with children | 3.9 | 6.9 | 71.6 | 17.3 | 78.4 | 98.5 | 12.9 | 302 | 13.9 |
| Filers in a couple with children | 19.7 | 1.1 | 83.0 | 16.3 | 20.9 | 98.4 | 10.5 | 362 | 13.6 |
| Filers in a couple without children | 35.0 | 0.8 | 54.5 | 23.4 | 26.5 | 96.6 | 12.7 | 352 | 15.9 |
| Personal Income Group | |||||||||
| Under $12,500 | 18.8 | 2.5 | 33.9 | 7.6 | 85.1 | 98.4 | 22.0 | 259 | 20.2 |
| From $12,500 to $25,000 | 20.3 | 4.4 | 47.5 | 19.0 | 84.2 | 98.1 | 42.7 | 278 | 42.2 |
| From $25,000 to $37,500 | 14.2 | 4.2 | 68.0 | 27.1 | 61.8 | 97.8 | 27.5 | 302 | 29.5 |
| From $37,500 to $50,000 | 12.6 | 1.1 | 73.5 | 27.7 | 45.8 | 96.2 | 6.4 | 292 | 6.6 |
| $50,000 or more | 34.1 | 0.1 | 84.1 | 15.1 | 4.0 | 91.4 | 1.5 | 272 | 1.4 |
| All Taxfilers | 100.0 | 2.1 | 63.6 | 18.3 | 49.0 | 97.9 | 100.0 | 281 | 100.0 |
| Source: 2017 T1 tax returns. | |||||||||
3.2 Trends in the Refundable Medical Expense Supplement, 1997 to 2017
As shown in Table 5, between 1997 and 2017, the RMES eligibility rate, which is the proportion of taxfilers who met all the RMES eligibility criteria, increased from 0.9% to 2.1%. The benefit rate—the proportion of beneficiaries among all claimants—also increased from 93.2% in 2003 to 97.8% in 2017. The average amount paid per RMES beneficiary has gradually increased over the past 20 years, rising from $220 in 1998 to $281 in 2017. The simultaneous growth in the eligibility and benefit rates and the number of beneficiaries, along with the slight increase in the average amounts of supplement paid to beneficiaries, explains the increase in the total cost of the RMES since its introduction, from $38.6 million in 1998 to $156.2 million in 2017.
| Eligibility rate (%) |
Benefit rate (%) |
Number of beneficiaries | Average amount of supplement paid (2017 $) |
Total amount of supplement paid (millions of 2017 $) |
|
|---|---|---|---|---|---|
| 1997 | 0.9 | n.a. | n.a. | n.a. | n.a. |
| 1998 | 0.9 | n.a. | 175,700 | 220 | 38.6 |
| 1999 | 1.1 | n.a. | 192,800 | 225 | 43.4 |
| 2000 | 1.1 | n.a. | 217,000 | 226 | 49.1 |
| 2001 | 1.3 | n.a. | 248,700 | 234 | 58.3 |
| 2002 | 1.4 | n.a. | 288,800 | 238 | 68.7 |
| 2003 | 1.5 | 93.2 | 310,200 | 236 | 73.3 |
| 2004 | 1.7 | 94.3 | 340,600 | 241 | 82.1 |
| 2005 | 1.8 | 94.6 | 367,600 | 266 | 97.7 |
| 2006 | 1.9 | 95.4 | 403,000 | 289 | 116.5 |
| 2007 | 1.9 | 95.6 | 408,700 | 291 | 118.8 |
| 2008 | 2.0 | 95.9 | 441,800 | 294 | 129.7 |
| 2009 | 2.1 | 96.5 | 482,600 | 295 | 142.2 |
| 2010 | 2.1 | 96.4 | 500,500 | 290 | 144.9 |
| 2011 | 2.1 | 96.5 | 507,700 | 282 | 143.4 |
| 2012 | 2.1 | 97.0 | 516,400 | 280 | 144.5 |
| 2013 | 2.1 | 97.3 | 524,000 | 280 | 146.6 |
| 2014 | 2.1 | 97.6 | 527,800 | 275 | 145.3 |
| 2015 | 2.1 | 97.6 | 544,200 | 278 | 151.3 |
| 2016 | 2.2 | 97.7 | 561,900 | 280 | 157.6 |
| 2017 | 2.1 | 97.8 | 556,100 | 281 | 156.2 |
| Note: "n.a." means that the statistic could not be obtained due to missing data. Source: Department of Finance Canada. |
|||||
Given the presence of various RMES eligibility criteria, there could be multiple factors that explain the growth of the eligibility rate. The possibilities include, for example, growth in the population with a moderate family income who work or who claim eligible medical expenses. The growth indicators presented in Figure 2 provide potential explanations.[15]
Figure 2
Changes in the number of taxfilers based on their eligibility for the RMES, 1997 to 2017 (base 2001=100)
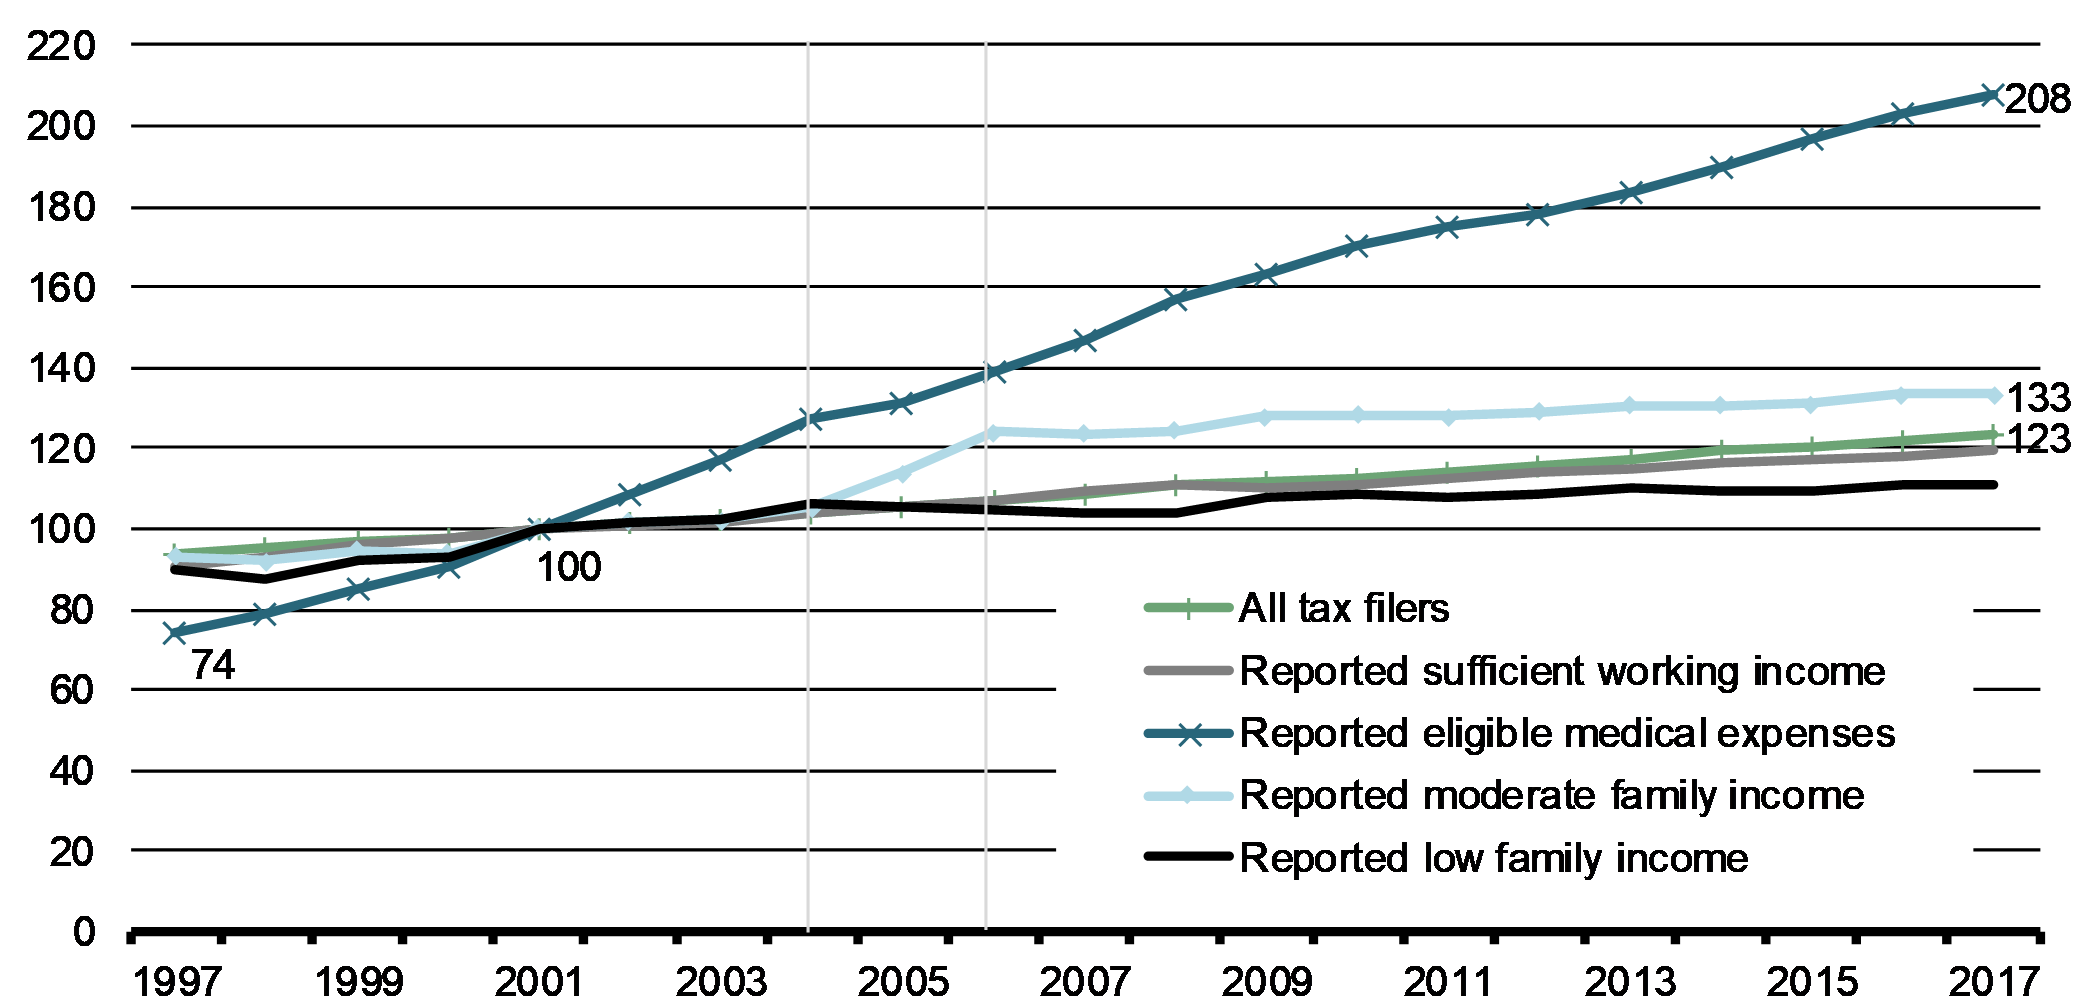
From 1997 to 2017, the number of taxfilers with sufficient personal working income or low family income grew at a rate similar to that of all Canadian taxfilers. Over the course of this period, the more significant changes occurred in relation to the number of filers reporting eligible medical expenses or moderate family income. A continuous upward trend was observed in the proportion of filers reporting eligible medical expenses—rising from 8.6% in 1997[16] to 18.3% in 2017.[17] The number of filers with a moderate family income grew significantly between 2004 and 2006, likely due to changes in the RMES parameters. As discussed in Section 2.1, the maximum supplement amount increased from $500 to $750 in 2005 and from $750 to $1,000 in 2006, with no changes to the other parameters—the reduction rate remained at 5% and the net family income threshold at which the maximum RMES amount begins to be clawed back continued to be indexed to inflation. Both increases in the maximum supplement amount led to major increases in the net family income level above which no further supplement can be paid and accordingly, a considerable increase in the proportion of filers reporting net family income below that level (see Figure 1).
In summary, the trends suggest that the significant increase in the RMES eligibility rate that was observed since its introduction in 1997 can mostly be explained by the continuous increase in the number of filers reporting eligible medical expenses, as well as changes to the RMES parameters.
4. Interaction of the Refundable Medical Expense Supplement with other tax measures
It is worthwhile to determine the extent to which the RMES interacts with other tax measures with similar or potentially complementary policy objectives—i.e., those that recognize the impact of medical expenses on an individual's ability to pay tax or that encourage labour market participation. In this section, the interaction between the RMES and several other tax measures is considered: the Medical Expense Tax Credit (METC), the disability supports deduction (DSD), the Disability Tax Credit (DTC), and the Working Income Tax Benefit (WITB).[18]
4.1 Medical Expense Tax Credit and disability supports deduction
As discussed in Section 2.1, eligible medical expenses for the RMES are equal to 25% of total expenses claimed under the METC and the DSD, up to the maximum credit amount.
The METC is a non-refundable tax credit that allows individuals to claim above-average medical expenses. A wide range of medical expenses are covered under the METC, including some disability-related expenses. Examples of allowable medical expenses include attendant care, devices and equipment, prescription drugs and medication, and service animals. The METC can also be claimed by caregivers, a spouse or common-law partner, or on behalf of dependants (children or certain other family members).[19] In 2017, individuals were able to claim expenses above the lesser of 3% of their net income and $2,268.
Under the DSD, individuals are able to claim the costs associated with disability supports expenses incurred for employment or education purposes. Unlike the METC, which covers a broad spectrum of medical expenses, the DSD recognizes additional costs associated with disability-related supports in a specific context. Examples of qualifying expenses include note-taking and reading services, attendant care, and devices and software. Individuals do not have to be eligible for the DTC in order to claim the DSD. In addition, the same medical expenses cannot be claimed under both the METC and DSD.[20]
As shown in Table 6, in 2017, among RMES beneficiaries, the majority claimed the METC only. This result is expected, due to the narrow scope of the DSD in providing tax relief specifically for disability-related expenses connected to employment or education. In 2017, RMES beneficiaries reported total eligible medical expenses averaging $1,804, while the average RMES payout per beneficiary was $281. Although there were very few individuals who reported medical expenses through the DSD, they reported a higher level of medical expenses compared to the METC-only beneficiaries ($5,232 versus $1,801), partially due to the METC expense threshold, and also received more from the RMES ($514 versus $281 for METC-only beneficiaries). Furthermore, the distribution of RMES beneficiaries based on medical expenses reported shows that 70.3% of all beneficiaries reported eligible medical expenses that were below $2,000. Among DSD claimants, the majority reported medical expenses above $2,000 (59.3%).
| All RMES beneficiaries | METC only | DSD | |
|---|---|---|---|
| Taxfilers (#) | 556,100 | 555,600 | 500 |
| by % of RMES beneficiaries | 100.0 | 99.9 | 0.1 |
| Average eligible* medical expenses reported ($) | 1,804 | 1,801 | 5,232 |
| Average RMES amount per beneficiary ($) | 281 | 281 | 514 |
| Distribution of RMES beneficiaries based on reported medical expenses (%) | |||
| less than $2,000 | 70.3 | 70.3 | 40.7 |
| $2,000 and over | 29.7 | 29.7 | 59.3 |
| Note: Figures are rounded to the nearest 100.
*For the METC, eligible expenses are expenses above the METC expense threshold (i.e., above the lesser of 3% of net income and $2,268). Source: 2017 T1 tax returns. |
|||
4.2 Interaction between the Refundable Medical Expense Supplement and the Disability Tax Credit
The DTC is a non-refundable credit that applies to costs related to a disability that cannot be itemized. For a taxfiler to be eligible for the credit, a medical practitioner must attest to the presence of a serious and prolonged physical or mental impairment that limits an individual's ability to perform a basic activity of daily living[21] or that would limit it in the absence of appropriate care. The maximum benefit amount for the DTC in 2017 was $1,220 (or 15% of the credit amount of $8,133). The DTC amount can be transferred to a supporting spouse, parent, or other person related to the eligible individual. Families caring for eligible children with a serious and prolonged impairment may claim an additional amount as a supplement to the credit.[22]
Table 7 reports the RMES eligibility criteria among DTC beneficiaries. In 2017, there were 740,100 individuals who benefited from the DTC (based on a claim for themselves, a dependant, or unused amounts transferred from a spouse), representing 2.7% of all taxfilers.[23] Of the 556,100 taxfilers who benefited from the RMES, only 11,100 individuals also benefited from the DTC, which is 2.0% of all RMES beneficiaries. There are several possible explanations for the low degree of interaction between the two measures. As mentioned previously, a large proportion of RMES beneficiaries had no tax payable in 2017 (55.3%), and thus might not have taken full advantage of the DTC, since it is a non-refundable credit. Therefore, the pool of RMES beneficiaries who could have potentially benefited from the DTC decreases to the 255,600 beneficiaries who paid tax in 2017, or would have paid tax in the absence of the DTC, with 4.3% of them actually benefiting from both measures.[24]
| All taxfilers | DTC beneficiaries | All WITB beneficiaries | Basic WITB beneficiaries | Disability supplement beneficiaries | |
|---|---|---|---|---|---|
| All Taxfilers (#) | 27,847,900 | 740,100 | 1,427,600 | 1,411,300 | 31,300 |
| Filers with sufficient working income | 63.6 | 52.0 | 95.3 | 95.6 | 79.6 |
| Filers who reported eligible medical expenses | 18.3 | 33.5 | 14.6 | 14.5 | 21.1 |
| Filers with low family income* | 28.1 | 8.6 | 94.9 | 94.9 | 92.3 |
| Filers with moderate family income** | 49.0 | 36.1 | 99.6 | 99.6 | 99.7 |
| Eligibility rate | 2.1 | 2.1 | 13.8 | 13.8 | 18.2 |
| Filers who benefited from the RMES | 556,100 | 11,100 | 191,800 | 190,000 | 4,800 |
| By % of RMES beneficiaries | 100.0 | 2.0 | 34.5 | 34.2 | 0.9 |
| Note: Figures are rounded to the nearest 100.
*Low family income refers to a level of net family income that is less than the net family income threshold of $26,644. Filers reporting low family income are eligible for the maximum supplement amount. **Moderate family income refers to a level of net family income that is less than the level above which no supplement can be paid ($50,704). Among filers with a net family income between the low family income and moderate family income thresholds ($26,644-$50,704), only those who claim a sufficiently high level of medical expenses, taking into account the applied reduction rate (5%), are eligible to receive an RMES amount. Source: 2017 T1 tax returns. |
|||||
The low degree of interaction between the two measures is also explained by the low RMES eligibility rate among DTC beneficiaries, which was only 2.1%. A closer examination of the RMES eligibility criteria shows that, compared to the general population of Canadian taxfilers, DTC beneficiaries were more likely to report eligible medical expenses (33.5% versus 18.3%). However, DTC beneficiaries were less likely to satisfy the RMES income criteria, with just 52% reporting sufficient working income.[25] Since 63.0% of DTC beneficiaries resided in a couple with another taxfiler (Table 8), they were also less likely to meet the family income criteria, with 36.1% reporting a moderate family income (Table 7).
Furthermore, as presented in Table 8, the age distribution suggests that the majority of DTC beneficiaries were older. Among this group, 66% were over 55 years of age (compared to 27.5% of RMES beneficiaries), with 42.5% over the age of 65 (compared to only 5.7% of RMES beneficiaries). Overall, RMES beneficiaries tended to be younger, sole filers, and reporting lower income levels, whereas DTC beneficiaries tended to be older,[26] living in a couple, and reporting higher income levels. It should be noted that this finding may also be the result of situations where caregivers claimed and benefited from the DTC on behalf of dependants or family members. The small overlap between RMES and DTC beneficiaries suggests that the two measures reach different populations.
| All taxfilers | All RMES beneficiaries | All DTC beneficiaries | All WITB beneficiaries | Basic WITB beneficiaries | WITB disability supplement beneficiaries | |
|---|---|---|---|---|---|---|
| Age Group | ||||||
| 18-24 years | 10.0 | 17.5 | 1.0 | 27.3 | 27.5 | 21.8 |
| 25-34 years | 16.7 | 20.8 | 4.2 | 26.7 | 26.7 | 23.7 |
| 35-44 years | 16.2 | 17.2 | 11.6 | 17.2 | 17.2 | 16.1 |
| 45-54 years | 16.7 | 18.7 | 17.2 | 15.1 | 15.1 | 16.8 |
| 55-64 years | 17.5 | 20.0 | 23.5 | 12.0 | 11.9 | 18.3 |
| 65-74 years | 12.9 | 4.7 | 17.5 | 1.4 | 1.4 | 2.7 |
| 75 years and over | 10.0 | 1.0 | 25.0 | 0.2 | 0.2 | 0.7 |
| Family Type | ||||||
| Sole filers without children | 41.3 | 63.9 | 33.9 | 65.1 | 64.9 | 81.1 |
| Sole filers with children | 3.9 | 12.9 | 3.1 | 15.9 | 16.1 | 6.9 |
| Filers in a couple with children | 19.7 | 10.5 | 17.6 | 10.2 | 10.3 | 3.4 |
| Filers in a couple without children | 35.0 | 12.7 | 45.4 | 8.8 | 8.8 | 8.6 |
| Personal Income Group | ||||||
| Under $12,500 | 18.8 | 22.0 | 0.6 | 40.4 | 40.7 | 22.6 |
| From $12,500 to $25,000 | 20.3 | 42.7 | 12.3 | 53.1 | 52.8 | 71.0 |
| From $25,000 to $37,500 | 14.2 | 27.5 | 23.0 | 6.1 | 6.0 | 5.9 |
| From $37,500 to $50,000 | 12.6 | 6.4 | 20.6 | 0.3 | 0.3 | 0.3 |
| $50,000 or more | 34.1 | 1.5 | 43.6 | 0.2 | 0.2 | 0.2 |
| Number of Taxfilers | 27,847,900 | 556,100 | 740,100 | 1,427,600 | 1,411,300 | 31,300 |
| Source: 2017 T1 tax returns. | ||||||
4.3 Overlap between the Refundable Medical Expense Supplement and the Working Income Tax Benefit
Replaced by the Canada Workers Benefit as of 2019, the WITB was a refundable tax credit that supplemented the earnings of low income workers in order to encourage labour market participation. In 2017, the basic refundable credit was equal to 25% of each dollar of working income in excess of $3,000, up to a maximum level. The WITB was phased out at a rate of 15% of each dollar of adjusted family net income above a specific threshold. Both the maximum credit amount and phase-out threshold were dependent on household composition.[27] For individuals eligible for the DTC, the WITB featured a disability supplement that started phasing in at working income of $1,150 and was also subject to a phase-out.[28] Provincial and territorial governments could reconfigure the WITB to better align it with provincial programs, and in 2017, Quebec, Alberta, British Columbia, and Nunavut had reconfigured WITB parameters in place.
As shown in Table 7, a total of 1,427,600 individuals benefited from the WITB in 2017 (5.1% of taxfilers). There were 1,411,300 beneficiaries of the basic credit and 31,300 beneficiaries of the disability supplement.[29] Compared to the DTC, there was a greater degree of overlap between the RMES and the WITB, with 191,800 individuals benefiting from both measures, corresponding to 34.5% of all RMES beneficiaries. One reason for this result is the high eligibility rate for the RMES among WITB beneficiaries (13.8%), compared to the entire taxfiler population or the population of DTC beneficiaries (both 2.1%).
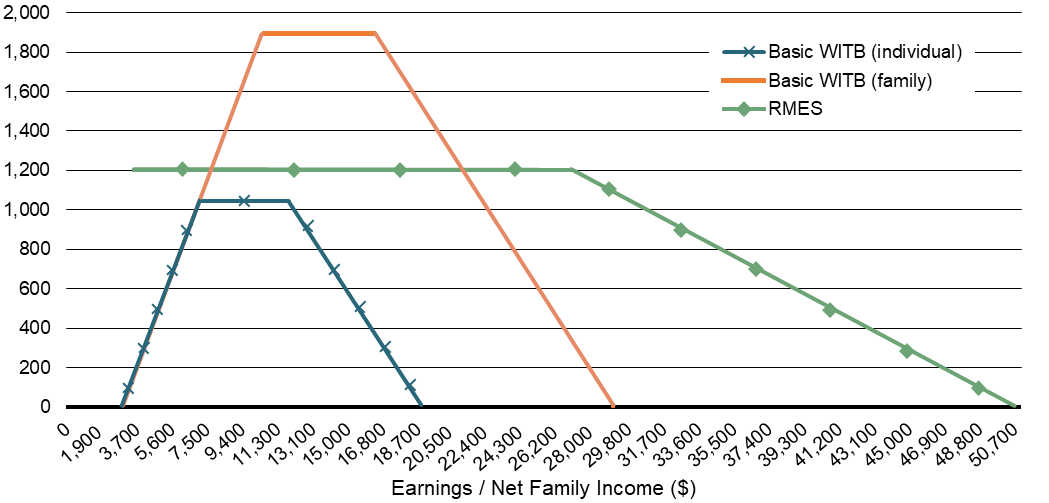
The greater degree of overlap between the WITB and RMES populations is attributable to similarities in the eligibility criteria and characteristics of the beneficiary populations, primarily because both measures target low-income working individuals (Figure 3). Relative to all Canadian taxfilers and DTC beneficiaries, WITB beneficiaries were far more likely to meet the RMES eligibility criteria related to income (Table 7). In fact, as shown in Table 8, 93.5% of all WITB beneficiaries reported total personal income under $25,000. As is the case with RMES beneficiaries, WITB beneficiaries also tended to be younger, with 54% under the age of 35 (compared to 38.3% for the RMES beneficiary population and 26.7% for the entire taxfiler population). The most represented family type among the WITB and RMES beneficiary populations was sole filers (81% versus 76.8%). These results show that the RMES provides an additional supplement to a proportion of WITB beneficiaries, which is, in part, due to the fact that both measures target low-income workers.
Figure 3
Maximum amount of the Working Income Tax Benefit (basic credit) and the Refundable Medical Expense Supplement (2017 $) allocated to taxfilers meeting all eligibility criteria, 2017
5. Longitudinal analysis of the Refundable Medical Expense Supplement
This section presents a longitudinal analysis of the RMES to better understand how individuals access the measure over time. More specifically, the characteristics of new and repeat beneficiaries are compared, along with reasons for entry into and exit from the RMES. Since filers must satisfy several criteria to claim the RMES, examining the reasons for entry and exit is useful for gaining insight into the most important factors that determine whether an individual will benefit from the measure.
5.1 Selection criteria used to determine the longitudinal sample
The analysis follows individuals for a period of five years, from 2013 to 2017. The starting point for determining the longitudinal sample is all individuals who filed their taxes in 2017. Since individuals must be at least 18 years of age to be eligible for the RMES, the target population is all filers who were at least 22 years of age in 2017 and filed their taxes that year. Imposing this condition ensures that individuals were at least 18 years of age in 2013, thus meeting the age criterion for each year in the period of interest. From the 556,100 individuals who benefited from the RMES in 2017, 492,500 were at least 22 years of age (89% of all beneficiaries).[30]
5.2 Characteristics of new and repeat beneficiaries
All 2017 RMES beneficiaries were divided into three mutually exclusive groups:
- New beneficiaries—individuals who received the RMES in 2017 and were not beneficiaries in any of the four prior years.
- Intermittent beneficiaries—individuals who received the RMES in 2017 and at least once between 2013 and 2016, but not all years.
- Persistent beneficiaries—individuals who benefited from the measure in all five years.
Table 9 presents a profile of the 2017 characteristics of new and repeat beneficiaries. Repeat beneficiaries consist of all individuals who were either intermittent or persistent beneficiaries. In 2017, 43.3% of all beneficiaries received the RMES for the first time (new beneficiaries), while repeat beneficiaries made up 56.6% of all beneficiaries. Therefore, in 2017, the RMES reached a large proportion of individuals who were not beneficiaries in the four preceding years. Among repeat beneficiaries, 15.4% were persistent beneficiaries as they received the RMES every year from 2013 to 2017 (8.7% of all beneficiaries), whereas 84.6% were intermittent beneficiaries (47.9% of all beneficiaries). The 2017 cohort of RMES beneficiaries benefited from the RMES for 2.2 years on average, over the 2013 to 2017 period.
As shown in Table 9, across all three above-described groups, women represented the largest proportion of RMES beneficiaries (61.4% of all beneficiaries versus 51.6% of non-beneficiaries) and were also more likely to be repeat beneficiaries.
While RMES beneficiaries tended to be younger (under the age of 35) than non-beneficiaries, persistent beneficiaries were less likely to be under the age of 35. Among persistent beneficiaries, 60.4% were in the 45 to 64 age bracket.
Further, among RMES beneficiaries, persistent beneficiaries were less likely to be in a couple with children (5.8%).
The personal income distribution is more or less the same across the three groups of RMES beneficiaries. However, persistent beneficiaries were slightly more likely to report personal income in the $12,500 to $37,500 range, whereas new beneficiaries were slightly more likely to report personal income under $12,500.
| Non-beneficiaries | All RMES beneficiaries | New beneficiaries | Repeat Beneficiaries | ||
|---|---|---|---|---|---|
| Intermittent beneficiaries | Persistent beneficiaries | ||||
| Taxfilers aged 22+ (#) | 25,104,400 | 492,500 | 213,500 | 236,000 | 43,000 |
| % of RMES beneficiaries | - | 100.0 | 43.3 | 47.9 | 8.7 |
| Gender | |||||
| Male | 48.4 | 38.6 | 43.2 | 36.1 | 29.9 |
| Female | 51.6 | 61.4 | 56.8 | 63.9 | 70.1 |
| Age Group | |||||
| 18-24 | 3.3 | 6.9 | 9.0 | 6.0 | 1.5 |
| 25-34 | 17.9 | 23.5 | 27.2 | 22.2 | 12.2 |
| 35-44 | 17.3 | 19.5 | 19.9 | 19.3 | 17.8 |
| 45-54 | 17.9 | 21.1 | 19.0 | 22.0 | 26.4 |
| 55-64 | 18.7 | 22.6 | 18.8 | 23.9 | 34.0 |
| 65-74 | 14.0 | 5.3 | 4.9 | 5.4 | 6.7 |
| 75+ | 10.9 | 1.2 | 1.1 | 1.2 | 1.4 |
| Family Type | |||||
| Sole filers without children | 36.1 | 59.5 | 57.1 | 60.1 | 68.4 |
| Sole filers with children | 4.0 | 14.4 | 13.4 | 15.4 | 14.6 |
| Filers in a couple with children | 21.5 | 11.8 | 14.0 | 10.9 | 5.8 |
| Filers in a couple without children | 38.4 | 14.2 | 15.5 | 13.6 | 11.2 |
| Personal Income Group | |||||
| <$12,500 | 15.2 | 18.8 | 20.8 | 17.9 | 14.2 |
| $12,500-$25,000 | 19.3 | 42.6 | 40.9 | 43.5 | 46.2 |
| $25,000-$37,500 | 14.4 | 29.8 | 27.8 | 30.9 | 33.6 |
| $37,500-$50,000 | 13.6 | 7.1 | 8.1 | 6.6 | 5.3 |
| $50,000+ | 37.5 | 1.7 | 2.4 | 1.2 | 0.6 |
| Note: Figures are rounded to the nearest 100.
Source: 2013-2017 tax returns. |
|||||
Since the RMES seeks to provide support to individuals who enter the labour market and transition away from social assistance, by helping to offset the loss of coverage for medical and disability-related expenses, it is interesting to examine the prevalence of social assistance among new RMES beneficiaries. Within the cohort of new RMES beneficiaries, the majority of individuals (205,900 out of 213,500) reported receiving no social assistance concurrently with the RMES in 2017. Of these individuals, 93.7% also did not report receiving social assistance in the previous four years, from 2013 to 2016, whereas 6.3% received social assistance in at least one of these years (13,000 individuals). Overall, a small proportion of new RMES beneficiaries in 2017 previously benefited from social assistance, indicating that the RMES helped alleviate an increase in medical expenses for some former social assistance recipients. However, the majority of RMES support was provided to individuals reporting significant medical expenses and low income, regardless of previous social assistance status.
5.3 Entry into and exit from the RMES
The following analysis explores reasons for entry into and exit from the RMES, between 2016 and 2017. Studying these dynamics provides insight into the factors that underpin an individual's ability to benefit from the RMES over time. Since there are several criteria that a filer must fulfill in order to be eligible for the RMES, it is useful to understand the reasons that are more likely to drive the transition from one status to another (i.e., non-beneficiary to beneficiary, or vice versa). Four major factors have been identified which could affect an individual's eligibility for the RMES from one year to the next, which are described in Table 10. An individual was included in a given category if there was a change in status from 2016 to 2017 relating to that specific factor. All individuals in the sample filed their taxes in both years.[31]
The reasons for entry are analyzed for all filers who were beneficiaries in 2017 but not in 2016. Out of the 492,500 RMES beneficiaries aged 22 years or more in 2017, 278,200 individuals[32] met this requirement. The population of interest for studying trends in exit from the RMES is all filers who were beneficiaries of the measure in 2016 but not in 2017. Among all non-RMES beneficiaries in 2017, 299,900 individuals benefited from the RMES in 2016.
| Change in: | Entry into the RMES | Exit from the RMES |
|---|---|---|
| Filer status | Became a resident of Canada for the entire year; eligible for the RMES in both years, but only claimed in 2017 | Not a resident of Canada for the entire year anymore; eligible for the RMES in both years, but only claimed in 2016 |
| Net family income* | Decrease in net family income below the maximum threshold | Increase in net family income above the maximum threshold |
| Personal working income | Increase in personal working income above the minimum threshold | Decrease in personal working income below the minimum threshold |
| Medical expenses** | Increase in eligible medical expenses (either above zero or relative to family income) | Decrease in eligible medical expenses (either to zero or relative to family income) |
| *Net family income can change for two reasons: (1) a change in family structure (i.e., a filer becoming part of a couple or no longer being part of a couple) that causes a change in family income; or (2) a change in family income that is not influenced by family structure.
**This category includes two types of changes to medical expenses. The first is a reported change in medical expenses from zero to a positive amount (or vice versa, for those individuals who exit the RMES). The second is a change in the level of medical expenses where filers reported positive medical expenses in both years. The RMES amount that individuals are eligible for is influenced by their net family income, when the latter is greater than the reduction threshold. When the level of reported eligible medical expenses is high relative to net family income, then the RMES amount is more likely to be greater, whereas in situations where the level of reported eligible medical expenses is low relative to net family income, the RMES amount is likely to be lower (or zero). |
||
The results are depicted in Figure 4. From 2016 to 2017, the three main reasons that contributed to an individual becoming eligible for and benefiting from the RMES are (1) a rise in medical expenses (72.1%); (2) a rise in personal working income (13.7%); and (3) a drop in net family income (12.4%). After ruling out all other factors, an increase in reported eligible medical expenses explains entry into the RMES for nearly three-quarters of all beneficiaries. Among beneficiaries for whom a rise in medical expenses is the driving factor for RMES entry, 78.7% did not report any amount for the METC and/or DSD in 2016 (56.7% of all 2017 entrants). The remaining 21.3% reported an increase in eligible medical expenses relative to family income from 2016 to 2017 (15.4% of all 2017 entrants). These findings are indicative that the RMES is accessed by individuals primarily for reasons relating to important year-over-year increases in medical expenses, rather than other factors, such as a change in income.
Figure 4
Reasons for entry into and exit from the RMES, 2016-2017
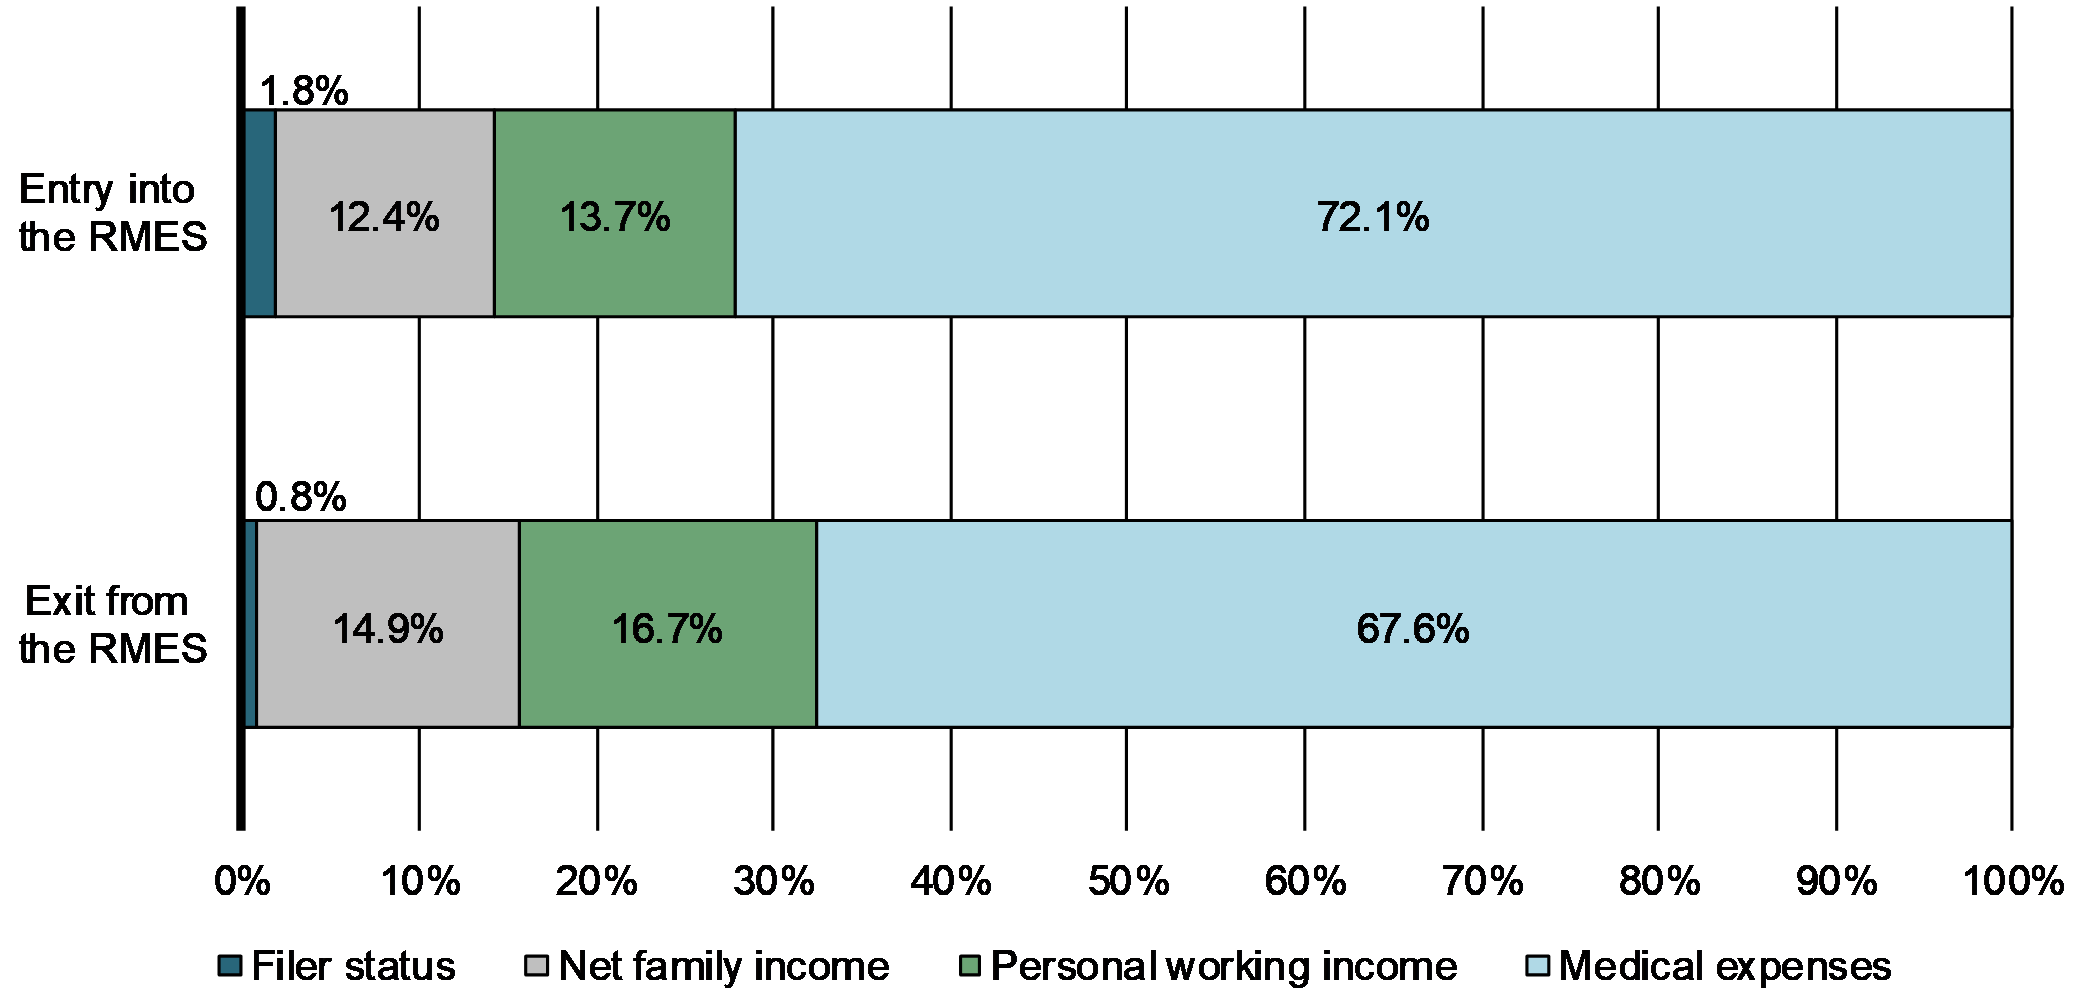
The top three reasons for exit from the RMES are similar: (1) a drop in medical expenses (67.6%); (2) a decrease in personal working income (16.7%); and (3) an increase in net family income (14.9%). Again, after accounting for all other reasons, medical expenses dominate in terms of explaining why individuals no longer receive the RMES. A further breakdown shows that of those who exited due to a change in medical expenses, 74.2% reported zero eligible medical expenses (50.2% of all exiting individuals), whereas 25.8% reported a decrease in medical expenses relative to their family income (17.5% of all exiting individuals). It should be noted that changes in filer status were not a significant factor in explaining either entry or exit.
The longitudinal analysis suggests that changes in individuals' level of reported medical expenses mainly explain why they become, or cease to remain, RMES beneficiaries. The vast majority of filers became RMES beneficiaries because of important increases in their reported level of medical expenses, as opposed to other reasons such as an increase in labour income. Moreover, among those who did not repeat as beneficiaries in two consecutive years, the main reason for exit was a drop in reported medical expenses, with most individuals reporting zero eligible expenses in the year after they were RMES beneficiaries. Although a small proportion of beneficiaries consistently benefited from the RMES between 2013 and 2017 (8.7%), these results suggest that the RMES is primarily a measure that individuals access at a single point in time when they experience a temporary increase in medical expenses. To that effect, the RMES provides tax relief to individuals incurring significant medical expenses. However, these findings also indicate that a large proportion of beneficiaries of the measure are working individuals with high transitory medical expenses, rather than those with high permanent medical expenses.
6. Conclusion
This study presents an analysis of the Refundable Medical Expense Supplement, a refundable credit that aims to reduce barriers to labour market participation for low-income individuals who incur significant medical and disability-related expenses. Since its introduction in 1997, there has been a continuous increase in the eligibility rate, benefit rate, and number of beneficiaries. While the total cost of the RMES has increased significantly over the years, the average amount of supplement received per beneficiary has risen more gradually. The growth in the eligibility rate is due to a continuous increase in the number of filers reporting eligible medical expenses, as well as changes to the RMES parameters in 2005 and 2006, which led to increases in the level of net family income above which the credit is eliminated. In 2017, women represented nearly two-thirds of all beneficiaries, who also tended to be younger, sole filers, and reported personal income under $25,000.
The analysis of METC and DSD claims shows that the majority of RMES beneficiaries claim eligible medical expenses through the METC. There is little overlap between the RMES and the DTC, indicating that the two measures reach different subsets of taxfilers. The higher degree of overlap between the RMES and the WITB occurs because both measures target low-income individuals with some attachment to the labour market.
Finally, the longitudinal analysis shows that a significant proportion of RMES beneficiaries in 2017 (43.2%) had not previously benefited from the measure from 2013 to 2016. The findings on the reasons for entry and exit emphasize that a change in the reported level of medical expenses is a key driver in determining whether an individual will benefit from the RMES. While the RMES provides tax relief to those incurring significant medical expenses, the results also indicate that a large proportion of beneficiaries are working individuals with high transitory medical expenses, rather than working individuals with high permanent medical expenses.
References
Canada Revenue Agency (2015). T1 Final Statistics, 2013 taxation year.
Canada Revenue Agency (2016). Income Tax Folio S1-F1-C2, Disability Tax Credit.
Canada Revenue Agency (2016). Income Tax Folio S1-F1-C3, Disability Supports Deduction.
Canada Revenue Agency (2016). T1 Final Statistics, 2014 taxation year.
Canada Revenue Agency (2017). T1 Final Statistics, 2015 taxation year.
Canada Revenue Agency (2018). T1 Final Statistics, 2016 taxation year.
Canada Revenue Agency (2019). Income Tax Folio S1-F1-C1, Medical Expense Tax Credit.
Canada Revenue Agency (2019). T1 Final Statistics, 2017 taxation year.
Government of Canada (1997). Budget 1997, Building the Future for Canadians (pp. 110, 195, 221).
Statistics Canada (2019). Table 11-10-0232-01: Low income measure (LIM) thresholds by income source and household size.
Statistics Canada (2019). Table 11-10-0222-01: Household spending, Canada, regions and provinces.1 The analysis presented in this paper was prepared by Amnit Litt and Dominique Fleury, Economists, Tax Policy Branch, Department of Finance Canada. Enquiries regarding Department of Finance Canada publications can be sent to finpub@canada.ca
2 Government of Canada, Budget 1997, Building the Future for Canadians, pp. 110, 195.
3 This study uses individual tax data from 2017, which is the most recent year for which complete data is available.
4 Originally, the amount of medical expenses was chosen to target taxpayers who had above-average medical expenses. The threshold remains relevant today since, according to Statistics Canada's Survey of Household Spending (Table 11-10-0222-01), average household spending for health care was $2,579 in 2017.
5 Net family income refers to the total net personal income of taxfilers and their spouse or common-law partner. Total net personal income excludes the Universal Child Care Benefit and income from a Registered Disability Savings Plan.
6 Since 1997, changes in the RMES parameters have closely aligned with changes in the thresholds of the Low Income Measure (LIM), although they are not officially linked. In 1997, the net family income threshold at which no further supplement amount could be granted was slightly below the LIM threshold established for a family of four people ($26,069 compared to $27,780 for the LIM threshold) and this was again the case in 2017 ($50,704 compared to $53,454 for the LIM threshold). Source: Statistics Canada, Table 11-10-0232-01.
7 In 2011, the government eliminated the limit on eligible expenses that can be claimed under the METC with respect to a dependent relative, so taxfilers were able to claim more medical expenses.
8 A description of these measures is presented in Section 4.
9 Statistics Canada, Canadian Survey on Disability, 2018.
10 This figure includes taxfilers who claimed the DTC for themselves. It excludes those who claimed the credit on behalf of a spouse or dependant, without having claimed it for themselves.
11 That is, they were married or living in a common-law relationship with a taxfiling spouse (of the opposite sex or not).
12 Taxfilers who are not part of a couple or who claim couple status, but with a non-filer or a filer who cannot be identified in the T1 data, are considered to be sole filers in the current study. Therefore, the net family income of these filers corresponds to their net personal income. Among taxfilers identified as sole filers in 2015, 2.8% had an uncertain couple status, i.e., they were potentially part of a couple with another filer, but their tax returns contained some inconsistencies that did not allow their status to be definitively confirmed. A proportion of them likely had not been with their spouse for a sufficient amount of time in the taxation year. In fact, line 452 of the 2016 General Income Tax and Benefit Guide stipulates that taxfilers do not have to account for the net income of their spouse if, due to the breakup of the relationship, they have lived separately for a period of 90 days or more, including December 31.
13 It should be noted that some filers who were ineligible according to the data (e.g., because of a personal working income below the minimum earnings threshold or a net family income above the moderate family income threshold) claimed the supplement (13,700 filers), 1,700 of whom received a positive RMES amount. It is possible that the CRA reassessed these claims at a later date, which would not be captured in the data used for this study.
14 Figures not reported.
15 Figures not reported.
16 The proportion of filers who meet the eligibility criteria related to both age and residence has been excluded, as it has remained fairly stable from 1997 to 2017, fluctuating between 97.5% and 98.3%.
17 Figure not reported.
18 This trend was also observed among the population of filers with a moderate family income.
19 Budget 2018 introduced the Canada Workers Benefit, which replaced the WITB as of 2019.
20 Canada Revenue Agency, Income Tax Folio S1-F1-C1, Medical Expense Tax Credit.
21 Canada Revenue Agency, Income Tax Folio S1-F1-C3, Disability Supports Deduction.
22 Basic activities of daily living include: walking, speaking, hearing, feeding, eliminating, dressing, and mental functions (adaptive reasoning, memory, problem-solving and judgement).
23 Canada Revenue Agency, Income Tax Folio S1-F1-C2, Disability Tax Credit.
24 DTC beneficiaries include all taxfilers who benefited from a reduction in taxes payable, which was directly attributable to the DTC amounts they claimed on lines 316 and 318 of Schedule 1 and unused amounts transferred from a spouse claimed on line 357 of Schedule 2 of their T1 return, all else constant. In contrast, DTC claimants are defined as all taxfilers who claimed an amount for the DTC in their T1 return, but did not necessarily benefit from a reduction in taxes due to the DTC claim. In 2017, 1,161,900 individuals claimed the DTC (this figure includes the 740,100 DTC beneficiaries).
25 Figures not reported.
26 Among non-DTC beneficiaries 63.9% reported sufficient working income, 17.9% reported eligible medical expenses, and 49.4% reported moderate family income.
27 DTC beneficiaries also tended to be older than non-DTC beneficiaries. In fact, 42.5% of DTC beneficiaries were over the age of 65, compared to 22.4% of non-DTC beneficiaries.
28 In 2017, the maximum basic credit for single individuals without children was $1,043 and the phase-out threshold was $11,838. For families (single parents or couples) the maximum basic credit was $1,894 and the phase-out threshold was $16,348.
29 In 2017, the phase-out threshold for the disability supplement was $18,791 for single individuals without dependants and $28,975 for families.
30 A total of 15,000 taxfilers were beneficiaries of both the basic credit and the disability supplement in 2017.
31 Of these filers, 429,700 filed in all five years (77% of all 2017 RMES beneficiaries), so there is complete data available for these individuals. A portion of the sample (62,800 filers) did not file for at least one year from 2013 to 2016, which is 11% of all 2017 RMES beneficiaries. Because the characteristics of these individuals in 2017 differ significantly from those who filed every year, non-filers were included in the sample to avoid introducing bias to the results.
32 Since several changes may occur from one year to the next, it was possible for an individual to belong to multiple categories. For instance, an individual entering the RMES may have reported both an increase in medical expenses and an increase in personal working income from 2016 to 2017. Therefore, to ensure that each category was mutually exclusive, it was necessary to prioritize each factor of change. The ranking of the factors is as follows: (1) filer status, (2) net family income, (3) personal working income, and (4) medical expenses. Once individuals were placed in a given category, they were excluded from all other categories. For example, if an individual entering the RMES was eligible for it in both years, but claimed in 2017 only, this individual was placed in the category "filer status" and was, therefore, excluded from the remaining categories, regardless of whether or not there was a change in the remaining factors. The category "filer status" was ranked first in order to rule out minor reasons before considering changes to the three key conditions relating to the RMES—net family income, personal working income, and medical expenses.
33 This includes both new beneficiaries (199,400 individuals) and a portion of intermittent beneficiaries who were not beneficiaries in 2016 (78,800 individuals).