
Archived -Report on Federal Tax Expenditures - Concepts, Estimates and Evaluations 2022: part 8
Gender-Based Analysis Plus of Tax Expenditures and the Indirect Impact of Refundable CreditsFootnote 1
1. Introduction
The Canadian Gender Budgeting Act requires, among other things, that the Minister of Finance make available to the public, on an annual basis, analyses on the impacts of tax expenditures in terms of gender and other identity factors. Gender-based Analysis Plus (GBA+) studies published in this Report since 2019 have focused primarily on the impacts of the federal personal income tax (PIT) system by gender. The first study examined the overall impact of the system and the allocation of the benefits of various individual tax expenditures between men and women. The second study looked at actual claiming patterns of certain tax expenditures between male and female spouses. The third study, published in 2021, focused on the impact of tax expenditures by identity factors other than gender.
All of the previously published GBA+ studies used an approach that was based on the reduction of net federal tax payable in order to identify the beneficiaries and the amount of benefits associated with different tax expenditures. The concept of net federal tax payable is calculated before the allocation of refundable credit amounts, including the Canada Child Benefit (CCB), the GST/HST Credit, the Working Income Tax Benefit (WITB)Footnote 2 and the Refundable Medical Expense Supplement (RMES). While most of the tax expenditures examined in previous GBA+ studies have no impact on refundable credit amounts paid, this is not the case for certain exemptions and deductions. Indeed, some exemptions and deductions have an impact on the concept of net family incomeFootnote 3 used to determine entitlement to these refundable credits and the allocated credit amounts.Footnote 4 For simplicity, the original approach ignored these indirect impacts.
The current study fills this gap by developing a new approach that accounts for the indirect impact of refundable credits in the calculation of the benefits associated with the various individual tax expenditures that impact taxfilers’ net income. It also examines the extent to which this methodological change affects previous GBA+ results. Section 2 provides an overview of the methodology as well as the list of the various tax expenditures for which it is relevant to use the new approach. Section 3 analyzes the new results obtained in terms of benefit amounts and the distribution of benefits between different identity groups by comparing them to the results published in the 2021 study.
2. Methodology
2.1 Original Approach
The most recent GBA+ studies examined the distribution of benefits associated with 58 personal income tax expenditures by age group, family type, family income group, area of residence and, in supplement, by genderFootnote 5. The distribution of benefits was examined by calculating statistics taking into account the number of beneficiaries and the share of benefits received for each of the tax expendituresFootnote 6 considered by identity group. In the previous study, the “number of beneficiaries” referred to the number of claiming taxfilers who, in the absence of a particular tax expenditure, would have had to pay a higher amount of net federal tax, while the “total amount of benefits” referred to the amount of net federal tax saved by claiming taxfilers due to the tax expenditure. As net federal tax is a concept that does not consider refundable tax credits, changes in refundable credit payments that can result from the absence of a specific tax expenditure were not accounted for in the analysis.
2.2 Modified Approach
The large majority of individual tax expenditures will reduce tax payable but have no impact on eligibility or amounts of refundable tax credits. However, this is not the case for certain exemptions and deductions. When a taxfiler claims a tax expenditure that reduces the amount of net family income taken into account to determine entitlement to refundable credits, the claim of this expenditure not only reduces the amount of tax payable but may also increase the value of refundable credits their family is entitled to. For example, a taxfiler who claims the Child Care Expense Deduction (CCED) will generally see their taxable income reduced by this deduction and may benefit from a reduction in their personal income tax payable. At the same time, their net personal income will decrease and this net personal income, combined with that of their spouse (if applicable), will have an impact on the calculation of refundable credit amounts the family is entitled to. Generally, the lower a taxfiler’s net family income, the higher the refundable credit amounts allocated to the family. Since the claim of the CCED reduces net income compared to what it would have been in the absence of the deduction, a portion of the benefits of refundable credits can be attributed to the claim of this particular tax expenditure. As a result, in estimating the benefits associated with certain tax expenditures, we can choose to take into account the indirect change in the refundable credit amounts resulting from the claim of these expenditures. In this case, the definitions of beneficiaries and benefits associated with the tax expenditures that have an impact on net income are modified as follows:
- The “number of beneficiaries” refers to the number of claiming taxfilers who, in the absence of a particular tax expenditure, would have to pay a higher amount of net federal tax and/or would be entitled to a lower amount of refundable credits, all else being equal.Footnote 7
- The “total amount of benefits” refers to the sum of the amount of net federal tax saved by claiming taxfilers and the additional amount of refundable credits their family is entitled to due to the claim of the tax expenditure, regardless of who, in the family, receives the refundable credit payments.Footnote 8
2.3 Tax Expenditures Examined
Table 1 lists the 13 main tax expenditures that have an impact on the net income concept used to calculate the four refundable credits for lower-income families among the 58 tax expenditures examined in the 2021 GBA+. These are the tax expenditures for which it is most relevant to apply the modified approach.Footnote 9
These 13 tax expenditures include one exemption (partial inclusion of capital gains) and 12 deductions. For those who reported capital income during the tax year, the net income amounts reported on line 236 of the T1 tax return would have been higher if the capital gains inclusion rate had been greater than 50%, which would have likely reduced the refundable credit amounts granted. A similar scenario would have occurred for those who claimed the various deductions listed in Table 1.
| Tax expenditures | ||
|---|---|---|
| Partial inclusion of capital gains | ||
| Child Care Expense Deduction (CCED) | ||
| Deduction for clergy residence | ||
| Deduction of allowable business investment losses | ||
| Deduction of interest and carrying charges incurred to earn investment income | ||
| Deduction of union and professional dues | ||
| Disability supports deduction | ||
| Moving expense deduction | ||
| Apprentice vehicle mechanics’ tools deduction | ||
| Deductibility of certain costs incurred by musicians or of expenses by employed artists | ||
| Deduction for tradespeople’s tool expenses | ||
| Partial deduction of and partial input tax credits for meals and entertainment | ||
| Deduction of other employment expenses | ||
| Source: Report on Federal Tax Expenditures 2021. | ||
3. Results
3.1 Benefit Amounts
Table 2 presents the new benefit amounts associated with the various individual tax expenditures that have an impact on taxfilers’ net income, taking into account the indirect impact of refundable credits in the calculation of total benefits. Direct benefits, i.e., those on which the previous GBA+ studies were based, refer to net tax savings resulting from these expenditures. Indirect benefits, on the other hand, refer to increases in refundable credit amounts that are a result of those same tax expenditures.
| Tax expenditures | Direct benefits | Indirect benefits | Total benefits* | Indirect benefits as a share of total benefits |
|---|---|---|---|---|
| ($ millions) | (%) | |||
| Partial inclusion of capital gains | 8,577.6 | 96.8 | 8,674.4 | 1.1 |
| Child Care Expense Deduction (CCED) | 1,014.7 | 330.7 | 1,345.5 | 24.6 |
| Deduction for clergy residence | 74.7 | 17.1 | 91.8 | 18.6 |
| Deduction of allowable business investment losses | 30.4 | 2.7 | 33.1 | 8.2 |
| Deduction of interest and carrying charges incurred to earn investment income | 1,794.8 | 43.9 | 1,838.8 | 2.4 |
| Deduction of union and professional dues | 956.6 | 137.8 | 1,094.4 | 12.6 |
| Disability supports deduction | 1.8 | 0.3 | 2.1 | 13.1 |
| Moving expense deduction | 97.9 | 15.5 | 113.4 | 13.7 |
| Apprentice vehicle mechanics’ tools deduction | 3.2 | 0.5 | 3.8 | 14.1 |
| Deductibility of certain costs incurred by musicians or of expenses by employed artists | 1.0 | 0.1 | 1.1 | 12.2 |
| Deduction for tradespeople’s tool expenses | 2.2 | 0.5 | 2.7 | 19.0 |
| Partial deduction of and partial input tax credits for meals and entertainment** | 37.0 | 1.9 | 38.9 | 5.0 |
| Deduction of other employment expenses | 821.2 | 64.5 | 885.7 | 7.3 |
| *For methodological reasons, total benefits may differ slightly from the total costs presented in the most recent RFTE. Costs are generally estimated using a methodology based on a T1 microsimulation model. These methodological differences do not have a significant impact on the distribution of benefits by identity group, and thus on the GBA+ results obtained. ** The GBA+ of the partial deduction of and partial input tax credits for meals and entertainment was conducted only on the portion of the deduction related to the accumulation of employment income (Guide4044, FormT777). It excludes expenses deducted from gross business or professional income (Guide 4002), which were taken into account in the calculation of the total costs reported in the RFTE. Note: Totals may not always add up due to rounding. Source: 2018 T1 return data. |
||||
Table 2 suggests that, overall, the largest share of benefits associated with the various tax expenditures examined is due to the tax savings they provide to claimants. It also shows that, for most of these expenditures, non-negligible amounts of indirect benefits result from increases in the amount of refundable credits granted to their family as a result of the expenditures. The indirect impact of refundable credits is greater for some expenditures than for others. For example, indirect benefits accounted for 24.6% of the total benefits associated with the CCED, compared to 1.1% for the partial inclusion of capital gains. These differences can be explained by the fact that claimants of some tax expenditures have characteristics that make them more or less likely to be eligible for the various refundable credits available, such as the presence of children in the family or being a member of a lower-income family. Variations in the generosity of each of these refundable credits may also explain these differences (e.g., CCB maximum annual amounts are greater than GSTC amounts).
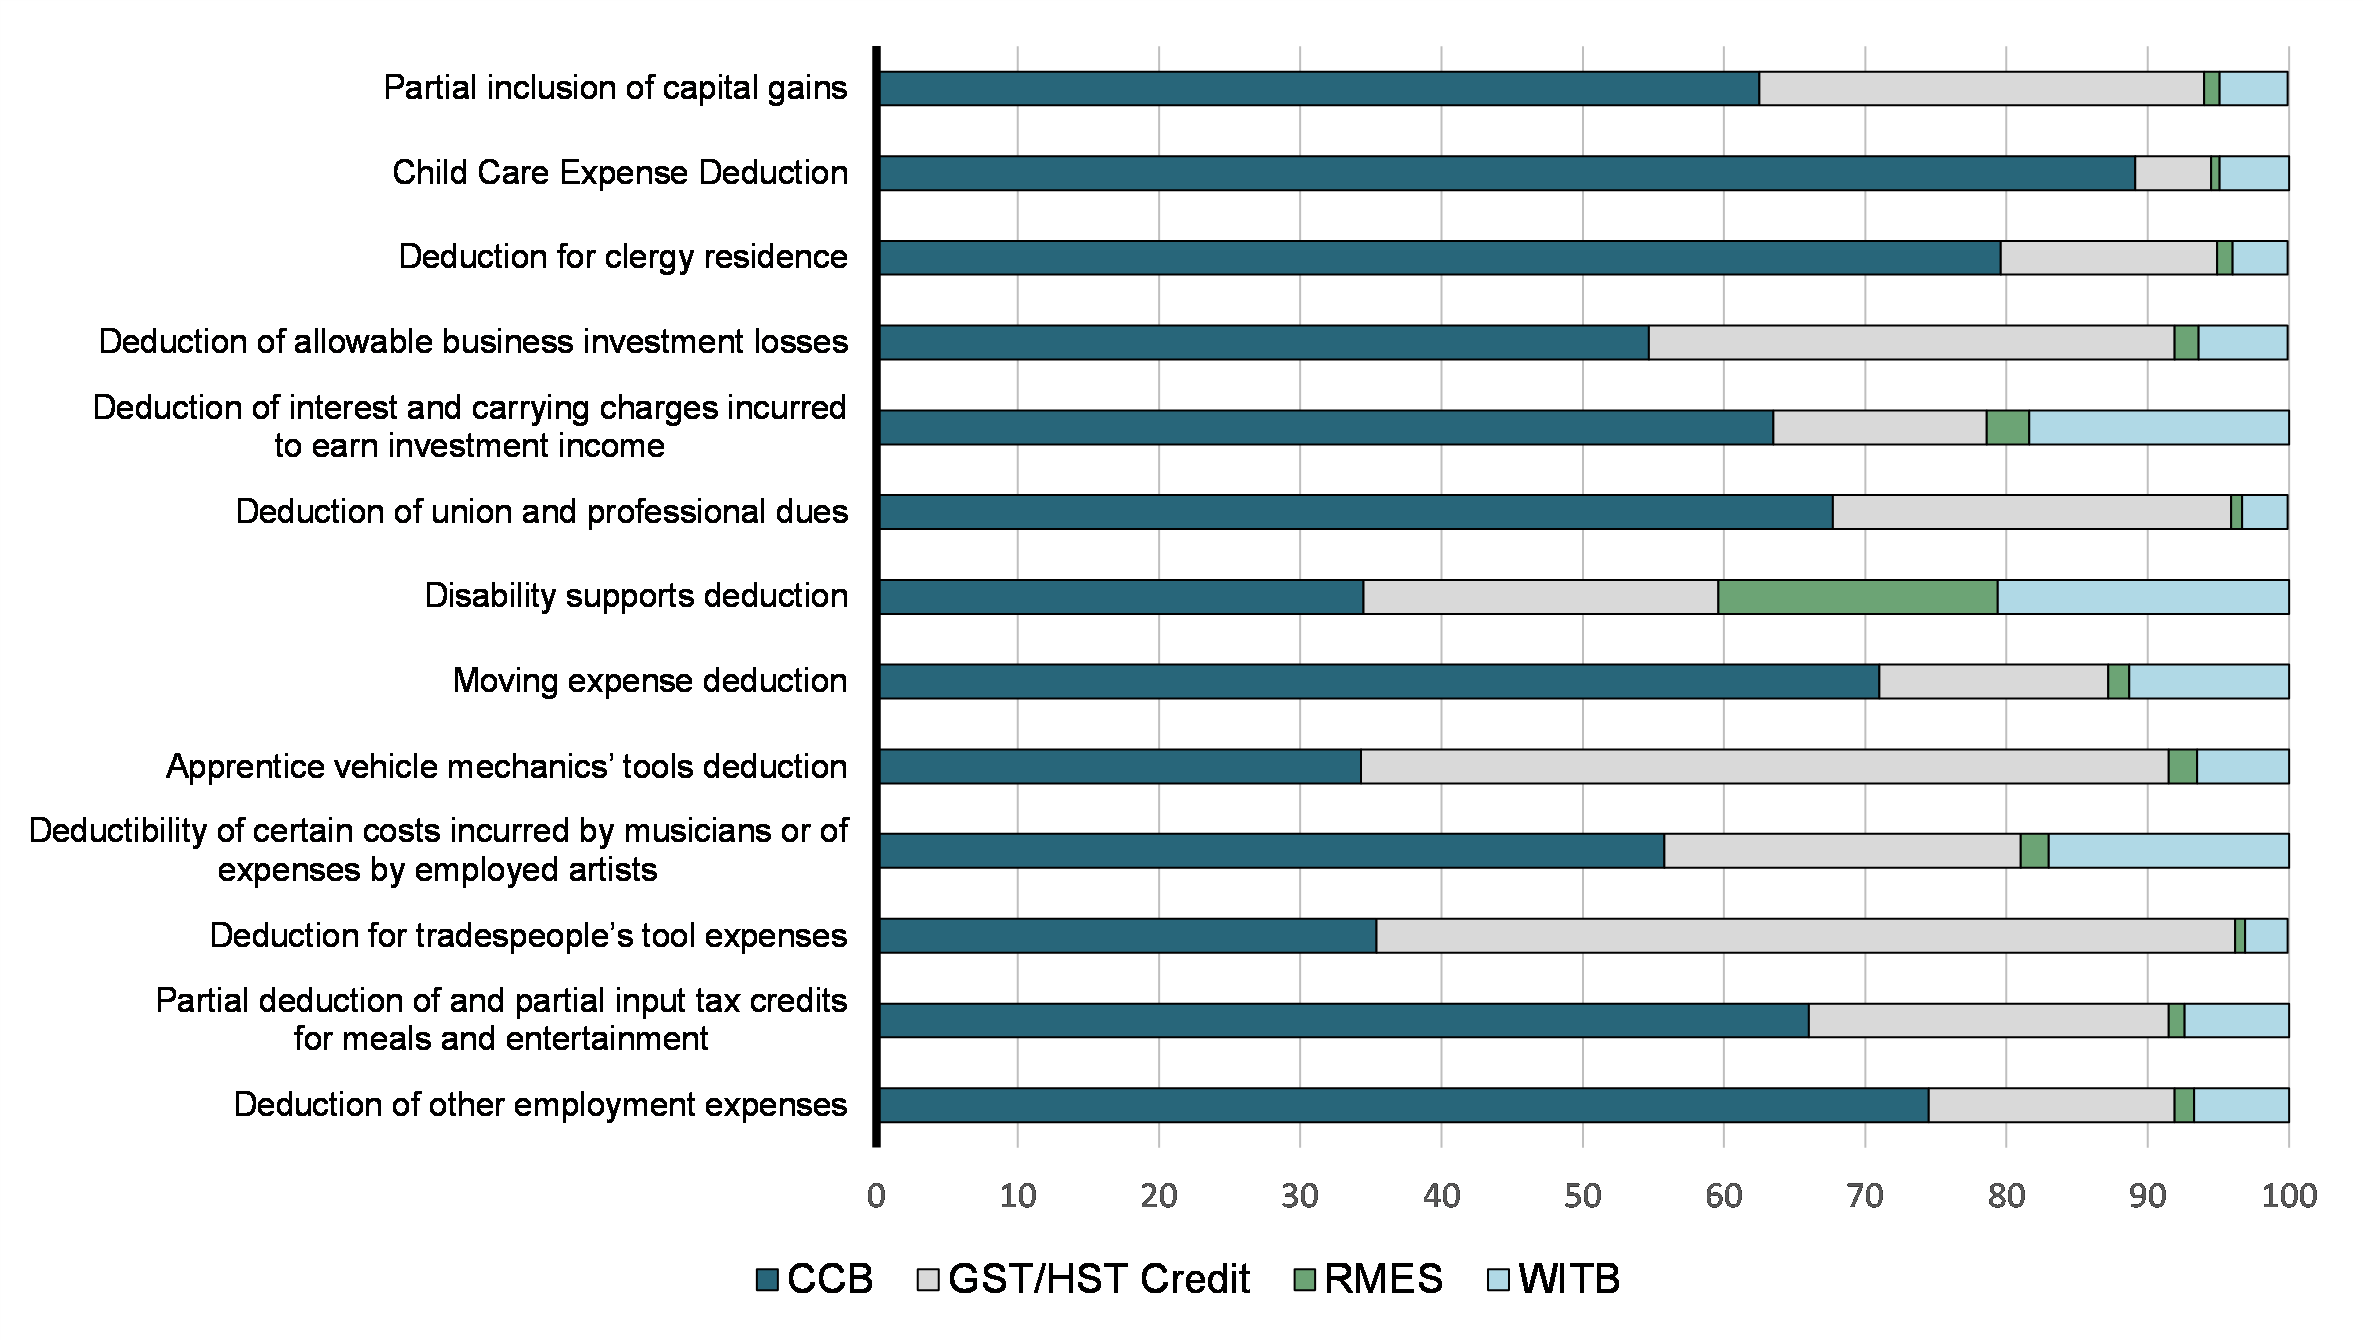
Chart 1 shows that, for most tax expenditures, variations in CCB amounts account for the largest share of indirect benefits. This is particularly true with regard to the CCED. The only exceptions are the apprentice vehicle mechanics’ tools deduction and the deduction for tradespeople’s tool expenses, two tax expenditures for which the GST/HST Credit represents a greater share of indirect benefits. The Disability Supports Deduction is another exception, as its indirect benefits arise somewhat more evenly from the various refundable credits available.
The CCB, GST/HST Credit, RMES and WITB as a share (%) of the total indirect benefits associated with the 13 tax expenditures examined, 2018
3.2 Distribution of Benefits
Section 3.1 quantified the indirect impact of refundable credits on the total amount of benefits associated with certain tax expenditures. This section examines more closely the distribution of these total benefits. New ratios identifying the share of total benefits received by each identity group relative to their share of total pre-tax income were calculated. As indicated in the 2021 GBA+ study (p. 365), drawing conclusions based on these ratios allows a distinction between the impact of the tax system and the impact of pre-existing differences in income earned by the different identity groups under review. These new ratios were used to identify the identity groups that especially benefit from the various expenditures under the modified approach. Table 3 provides an example of the ratios obtained by adjusted family income quintile Footnote 10 using the original approach and the modified approach. It is noteworthy that, as for the previous GBA+ studies, a threshold of 1.05 has been selected to identify groups that especially benefit from the tax expenditure. Conversely, ratios of 0.95 or less identify groups that benefit proportionally less.
| Direct benefits only | Both direct and indirect benefits | |||||||||
|---|---|---|---|---|---|---|---|---|---|---|
| By adjusted family income quintile (Q) | Q1 | Q2 | Q3 | Q4 | Q5 | Q1 | Q2 | Q3 | Q4 | Q5 |
| Share (%) of total pre-tax personal income | 4.2 | 9.1 | 15.1 | 22.6 | 49.0 | 4.2 | 9.1 | 15.1 | 22.6 | 49.0 |
| Share (%) of benefits received from the Child Care Expense Deduction (CCED) | 0.6 | 5.7 | 16.0 | 31.4 | 46.4 | 1.4 | 9.9 | 18.0 | 31.2 | 39.6 |
| Ratios of the share of benefits received from the CCED relative to the share of total pre-tax personal income | 0.14 | 0.62 | 1.06 | 1.39 | 0.95 | 0.37 | 1.08 | 1.19 | 1.38 | 0.81 |
| Note: A ratio higher than 1.05 indicates that a group of taxfilers benefits from the tax expenditure proportionally more than other groups, and vice versa.
Source: 2018 T1 return data. |
||||||||||
As noted in the 2021 study (footnote 16), taking into account the indirect impact of refundable credits suggests that members of quintiles 2, 3 and 4 especially benefit from the CCED as opposed to only members of quintiles 3 and 4. This is consistent with one of the main findings of the 2021 study presenting a profile of the CCED beneficiaries, which suggested that “once federal income-tested benefits are also included in the estimates of the impact of the CCED, the total benefits accruing to low-to modest-income taxfilers increase significantly.”Footnote 11
Using the old and new ratios (not reported), Table 4 highlights all of the changes in results under the modified approach compared to the original approach.
| Tax expenditures | Identity groups that especially benefit considering direct benefits only | Changes in the identity groups that especially benefit considering both direct and indirect benefits |
|---|---|---|
| Partial inclusion of capital gains |
– Men – Older filers – Filers in quintile 5 – Filers without children – Urban area residents |
– No change |
| Child Care Expense Deduction (CCED) |
– Women – Younger and middle-age filers – Filers in quintiles 3 and 4 – Filers with children – Urban area residents |
– Filers in quintiles 2, 3 and 4 |
| Deduction for clergy residence |
– Men – Middle-age and older filers – Filers in quintiles 3 and 4 – Filers in a couple |
– Middle-age filers – Filers in quintiles 2, 3 and 4 – Filers in a couple with children |
| Deduction of allowable business investment losses |
– Men – Middle-age and older filers – Filers in quintile 5 – Filers in a couple – Urban area residents |
– No change |
Deduction of interest and carrying charges incurred to earn investment income |
– Older filers – Filers in quintile 5 – Filers in a couple without children – Urban area residents |
– No change |
| Deduction of union and professional dues |
– Women – Younger and middle-age filers – Filers in quintile 4 – Filers with children |
– Filers in quintiles 3 and 4 |
| Disability supports deduction |
– Women – Older filers – Filers in quintiles 3 and 5 – Sole filers and sole parents – Urban area residents |
– Filers in quintile 3 |
| Moving expense deduction |
– Men – Younger and middle-age filers – Filers in quintiles 4 and 5 – Filers in a couple with children – Remote area residents |
– Filers in quintiles 3 and 4 |
| Apprentice vehicle mechanics’ tools deduction |
– Men – Younger filers – Filers in quintiles 2, 3 and 4 – Sole filers – Remote area residents |
– No change |
| Deductibility of certain costs incurred by musicians or of expenses by employed artists |
– Men – Younger and middle-age filers – Filers in quintiles 4 and 5 – Sole filers and filers in a couple with children – Urban area residents |
– Filers in quintiles 3 and 4 |
| Deduction for tradespeople’s tool expenses |
– Men – Younger filers – Filers in quintiles 3 and 4 – Sole filers and filers in a couple with children – Remote area residents |
– No change |
| Partial deduction of and partial input tax credits for meals and entertainment |
– Men – Middle-age filers – Filers in quintile 5 – Filers in a couple with children – Urban area residents |
– No change |
| Deduction of other employment expenses |
– Men – Middle-age filers – Filers in quintile 5 – Filers in a couple with children |
– Sole parents and filers in a couple with children |
| Source: 2018 T1 return data; Report on Federal Tax Expenditures 2021, "Gender-Based Analysis Plus of Federal Personal Income Tax Measures: Impacts by Identity Factors other than Gender," February 2021. | ||
Among other things, Table 4 shows that, for 6 of the 13 tax expenditures examined, taking into account indirect benefits does not have a notable impact on the identity groups found as especially benefiting from each expenditure. For the 7 other expenditures, however, some changes are noted, particularly in the distribution of benefits by family income quintile. The modified approach does not have a significant impact on the distribution of benefits by gender and area of residence. For all 13 tax expenditures examined, the gender and area of residence that especially benefit from them remain unchanged, regardless of the approach used. In addition, there is virtually no difference in the age groups that especially benefit from the different tax expenditures. The only change observed is for the deduction for clergy residence, which is found to especially benefit middle-age and older filers using the original approach, but only middle-age filers using the modified approach. Changes in the type of family that especially benefits are observed for only two measures: the deduction for clergy residenceFootnote 12 and the deduction of other employment expenses.
Slightly more changes are seen in the distribution of benefits by family income quintile. Using the modified approach, PIT expenditures in the form of exemptions and deductions remain more likely to especially benefit members of the higher quintiles. However, taking into account the indirect impact of refundable credits changes the distribution of benefits associated with some of these expenditures in favour of lower-income groups. Indeed, two of the deductions found to be regressive using the original approach —the CCED and the deduction for clergy residence—are neither regressive nor progressive using the new approach: they especially benefit quintiles 2, 3 and 4, as opposed to only quintiles 3 and 4 under the original approach.
Moreover, three additional deductions—the deduction of union and professional dues, the moving expense deduction and the deductibility of certain costs incurred by musicians or of expenses by employed artists—are less regressive using the modified approach, under which the benefits especially advantage quintiles 3 and 4 rather than quintiles 4 and/or 5. A similar pattern is observed with respect to the disability supports deduction, as the new approach suggests their benefits are more highly concentrated in the middle of the income distribution (quintile 3) than under the original approach.
So far, the benefits associated with refundable credits have been set at the credit amounts paid to taxpayers under these various income support measures. WITB and RMES amounts are determined and generally paidFootnote 13 when the T1 income tax return is processed, while CCB and GST/HST Credit amounts are based on income reported on the T1 return but are determined separately and are paid during a distinct benefit period.Footnote 14 The previous GBA+ study clearly showed that, as expected, given the design parameters for these credits, they especially benefit filers whose family income is in the lower quintiles of the income distribution. However, using the modified approach, a portion of the benefits of refundable credits are attributed to the claim of particular exemptions and deductions. One might therefore ask to what extent reallocating a portion of the benefits of refundable credits to other tax expenditures impacts the distribution of benefits that remain specific to refundable credits. To investigate this, we chose to compare the distributions by quintile of allocated refundable credit amounts in the presence and absence of the CCED, as this deduction has the greatest impact on allocated refundable credit amounts. This comparison did not show any notable change between the distribution by quintile obtained in the previous GBA+ and the distribution following the methodological changes applied in this analysis. In both cases, the four refundable credits under review (the CCB, GST/HST Credit, RMES and WITB) especially benefit filers in lower-income families (quintiles 1, 2 and/or 3, depending on the credit).
4. Conclusion
To date, the approach used to examine the distribution of benefits associated with the claim of various personal income tax expenditures was based on the calculation of tax savings before the payment of refundable credits. However, some exemptions and deductions have an impact on the concept of net family income used to determine entitlement to refundable credits, namely the CCB, the GST/HST Credit, the RMES and the WITB. Therefore, this study proposes a modified approach that takes into account the indirect impact of these refundable credits in the calculation of the benefits associated with 13 other tax expenditures. It examines the extent to which this new approach, which considers both direct and indirect benefits, changes the GBA+ results obtained in previous studies.
First, the analysis shows that taking into account changes in the refundable credit amounts related to the claim of certain exemptions and deductions indirectly increases the level of associated benefits. This impact varies depending on the tax expenditure, but is always significantly smaller than the direct impact observed in terms of tax savings for the claiming taxfiler.
The analysis also indicates that taking into account the indirect impact of refundable credits does not have a significant impact on the distribution of benefits by gender and area of residence of taxfilers. This also results in few changes in the distribution of benefits by age group and family type. However, more changes are observed in the distribution of benefits by family income quintile. Indeed, the approach mitigates the perceived regressivity of 6 out of the 13 tax expenditures examined in the current analysis by extending their benefits to filers living in more modest-income families.