
Archived -Report on Federal Tax Expenditures - Concepts, Estimates and Evaluations 2022: part 9
Deductions of Other Employment Expenses and Union and Professional Dues: A Profile of Claimants and BeneficiariesFootnote 1
1. Introduction
Deductions are afforded to employees in some circumstances where the expenses are necessary to fulfill the duties of employment but are not reimbursed by the employer. Among these are the deduction of union and professional dues (UPD), as well as the deduction of other employment expenses (OEE).Footnote 2 Made statutory in the mid-twentieth century, these tax expenditures recognize a number of common expenses incurred by employees.
This study presents a profile of both the UPD and OEE deductions, focussing on the usage of the measures by claimants of different demographic groups for the period spanning 2000-2019. It begins, in Section 2, with historical and background information on both measures. In Section 3, data sources are provided. Section 4 describes the data for the UPD deduction. It starts by describing the fiscal cost of the measure and the average amounts claimed, broken down by gender, age, industry, and income group. Then, it considers the share of taxfilers claiming the deduction across the same dimensions. The section also provides information on the labour market characteristics of the claimants, specifically the number of jobs worked, along with earnings and total income. These numbers are also compared to those for non-claimants. Finally, the section describes the benefits received by the claimants of the deduction, including both direct and indirect benefits through other tax credits. In Section 5, the study provides the same information for the OEE deductions. Finally, the last section concludes.
2. Background on Measures
Although employers generally provide employees with the means to perform their duties, there are circumstances where employees must incur expenses out-of-pocket. For example, employers usually do not pay nor provide reimbursement for professional dues. Expenses related to travelling and lodging, food and entertainment, and tools and equipment (among others) may also be borne by the employee instead of the employer.
Where employees are required to incur such out-of-pocket expenses in the context of their employment, their income is reduced. The tax system recognizes these non-discretionary expenses through deductions so that individuals pay tax only on their net employment income – this is known as the ability-to-pay principle. Both the UPD and OEE deductions follow the principle, although in the case of the OEE deductions, the set of recognized expenses is relatively limitedFootnote 3 in order to balance recognizing employees’ work-related expenses, not subsidizing personal consumption, and minimizing compliance and administrative costs.
For instance, employees may only deduct 50% of food and beverage expenses incurred while away from the employer’s place of business (under certain conditions), as these include an element of personal consumption. As another example, parking costs may be deducted where an employee is normally required to work away from the employer’s place of business (and subject to other conditions), but parking at the employer’s office is considered a personal cost. Food, beverage and parking costs are treated similarly in both Australia and the United States, while some recognition exists in France for parking at the employer’s place of business. Some jurisdictions allow for more expenses to be deducted. For example, taxpayers in Switzerland can deduct fees incurred for using public transportation between home and work.
Beyond the ability-to-pay principle, these deductions also provide for a more comparable treatment of employment, self-employment and business income, as the self-employed and employers may deduct a range of expenses. They also provide for more neutral treatment between occupations of similar value-added that differ in the level of expenses required to perform the work. The deductions may also be seen as generally supporting economic efficiency by reducing barriers to employment, thereby promoting a better allocation of labour.
2.1 Union and Professional Dues
The UPD deduction was introduced in its current form in 1951.Footnote 4 Before then, some professionals such as doctors and lawyers were able to deduct fees for professional memberships under certain conditions, such as operating for fees. During parliamentary debates in 1951, some Members of Parliament argued that trade unionists and salaried professionals should also be able to deduct similar fees. Two main justifications were brought forward: fairness between taxpayers, and supporting trade unions concretely.
The UPD deduction applies to:
- Annual dues for membership in a trade union or an association of public servants;
- Professional membership dues legally required to keep a professional status and reasonably related to the individual’s employment; and
- Professional board and parity or advisory committee dues required under provincial or territorial law.
2.2 Other Employment Expenses
From the early 1920’s, there was a provision in the Income War Tax Act permitting deductions for travelling and other expenses from salaries and wages received by railway employees. This stood in contrast to the general principle that salaries and wages are to be considered net income. On the grounds of fairness, the provision was made statutory with the 1948 Budget, and extended to board and lodging expenses for employees working more broadly in the transportation industry, whose duties require them to be absent from their home regularly, as well as the expenses of employees selling property or negotiating contracts, who perform their duties away from their employer’s place of business.Footnote 5
The range of eligible expenses increased over time. For instance, Budget 1951 allowed the deduction of travelling expenses more generally, as well as office rent or salary to assistants or substitutes, and supplies consumed directly in the course of employment, provided the expenses were necessary to incur under the contract of employment. Budget 1957 then rendered deductible the portion of teachers’ salaries funding the exchange of teachers within the Commonwealth. Legal expenses incurred to collect salary or wages were made deductible with Budget 1961. Budget 1979 also permitted a deduction for depreciation and interest expense relating to an aircraft required for use in employment.
Total employment expenses are declared on line 229 of the T1 return, most of which should be supported by a completed Form T777, “Statement of Employment Expenses”, which details work-related expenses incurred by the taxfiler. In addition, claimants must have a copy of Form T2200, “Declaration of Conditions of Employment”, completed and signed by the employer, which sets out the nature and extent of out-of-pocket expenses incurred in the course of performing their duties. Some expenses, such as transportation employees’ cost of meals and lodging, forestry operations employees’ expenses for buying and using power saws, and repayments of salary or wages, are indicated directly on line 229.
The categories of employment expenses available for deduction in the T777 are summarized in Table 1. There are a number of applicable restrictions to each of these categories, which are detailed in the T4044 Employment Expenses guide. For example, food and beverages may only be deducted when the employee is required to be away for at least 12 consecutive hours, and outside the municipality and metropolitan area (as applicable) of the employer’s location where the employee normally reports for work. Along with entertainment expenses, food and beverages are also subject to a 50% limit, where the most that can be deducted is 50% of the lesser of the amount actually paid, or the amount that would be reasonable to pay in the circumstances. Moreover, as the names of these items suggest, some deductions are only available to certain types of employees.
| In addition to what can be deducted by employees earning a salary | ||||
|---|---|---|---|---|
| Employees earning commission income | Employees earning a salary | Employed artists | Employed tradespersons | |
| Accounting and legal fees | X | X | ||
| Advertising and promotion | X | |||
| Allowable motor vehicle expenses | X | X | ||
| Food, beverages, and entertainment expenses | X | X | ||
| Lodging | X | X | ||
| Parking | X | X | ||
| Office supplies | X | X | ||
| Other expenses | X | X | ||
| Tradesperson's tools expenses | X | |||
| Apprentice mechanic tools expenses | X | |||
| Musical instrument expenses | X | |||
| Capital cost allowance (CCA) for musical instruments | X | |||
| Artists' employment expenses | X | |||
| Work-space-in-the-home expenses | X | X | ||
3. Description of Data Sources and Availability
The data used in this study, spanning the 2000-2019 period, are primarily derived from T1 tax returns and T4 employment slips, which provide information on claimants and their employers. In addition, to determine the NAICS code to which a given employer belongs,Footnote 6 T4 data are supplemented with information from corporate tax returns (T2) and partnership returns (T5013). T4 data are also used to estimate the number of jobs held by taxfilers.Footnote 7
The total UPD deduction cannot be broken down into union dues and professional dues separately, since both types of dues are claimed in the same box in tax forms. However, it might be interesting to know whether individuals claiming this deduction for union dues (i.e., unionized workers) differ from those who are claiming it for professional dues only (i.e., non-unionized workers).
The data do allow an estimation of this breakdown by using T4 slips. Indeed, the latter forms include union dues specifically. Therefore, the study categorizes the population of UPD claimants in two groups: those with a T4 reporting positive union dues (which we refer to as unionized claimants), and those without such a T4 (which we refer to as claimants of professional dues only). This categorization is imperfect, since some unionized workers may have both unionized and non-unionized jobs, for example. However, it should provide an idea of the differences between the two populations.
In the case of OEE, the total amount claimed can often be broken down into multiple categories (as detailed in Section 2.2) using the T777 form. Data from this form are available as of 2016.
Finally, while most of this study considers claimants and the amounts they claim on their T1, it also estimates the benefits received by claimants in 2018 (the latest year for which all data are available to calculate benefits). These benefits are calculated as the amount by which an individual’s income tax payable is decreased due to one of the deductions. When a claimant’s tax payable is reduced due to one of the deductions, the study will refer to that individual as a beneficiary of that deduction.Footnote 8
These benefits can be separated in two categories: direct and indirect. To calculate the direct benefits received from either the UPD or OEE deductions, the study calculates, for each claimant, the taxes owed with and without the deduction. The difference between these two calculations is the direct benefit. Indirect benefits are calculated by estimating the impact of the UPD or OEE deductions on the amount received by the claimant from four different refundable credits: the Goods and Services Tax Credit (GST Credit), the Refundable Medical Expense Supplement, the Canada Workers Benefit/Working Income Tax Benefit, and the Canada Child Benefit (CCB).Footnote 9
4. Union and Professional Dues
4.1 Number of Claimants and Amounts Claimed
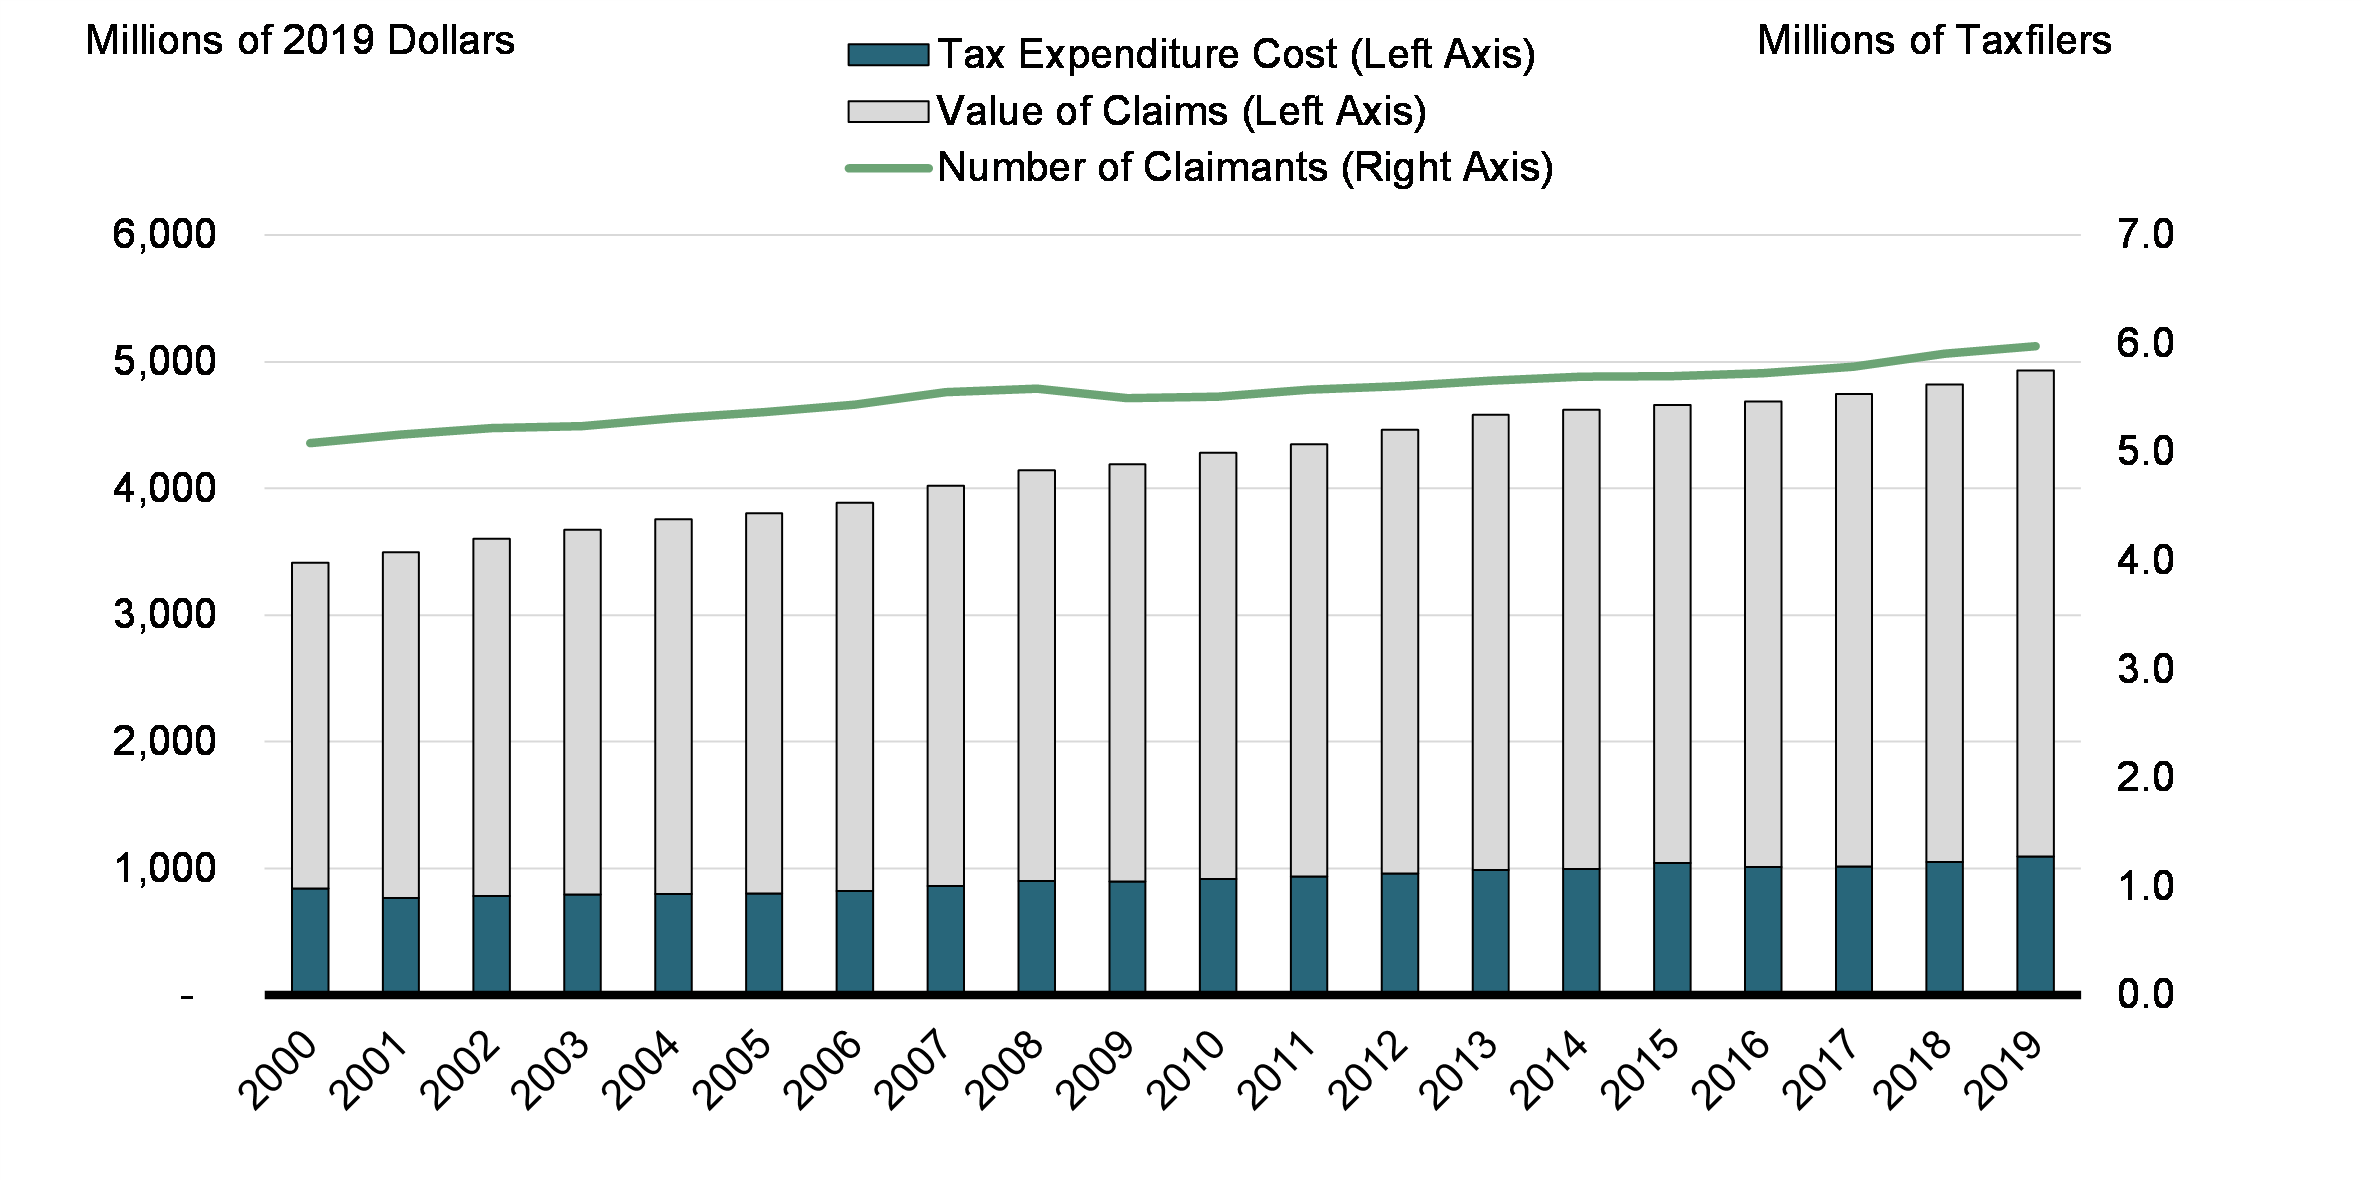
In 2019, 5,976,232 Canadians claimed the UPD deduction, or 20.7% of all taxfilers in that year (Chart 1). This percentage steadily decreased since 2000, when 23.1% of taxfilers claimed that deduction (5,083,193 Canadians). In 2019, these claims represented a total of about $4,932 million. The value increased steadily by 2.0% per year since 2000, when it represented a total of $3,412 million (in constant 2019 dollars). Notably, the increase in the value of claims was not accompanied by a similar increase in the fiscal cost of the measure. Indeed, the fiscal cost only increased by 1.4% annually, according to past Reports on Federal Tax Expenditures. The difference in growth rates could be due to the increase in the share of claimants in the lowest tax bracket and the reduction in tax rates over the period. In 2019, the deduction was projected to cost $1,095 million, up from $841 million in 2000. As shown in Chart 1, the fiscal cost also decreased in some years, and was rather constant over certain periods, such as from 2012 to 2017.
Value of UPD Claims, Associated Tax Expenditure Cost, and Number of Claimants (2000-2019)
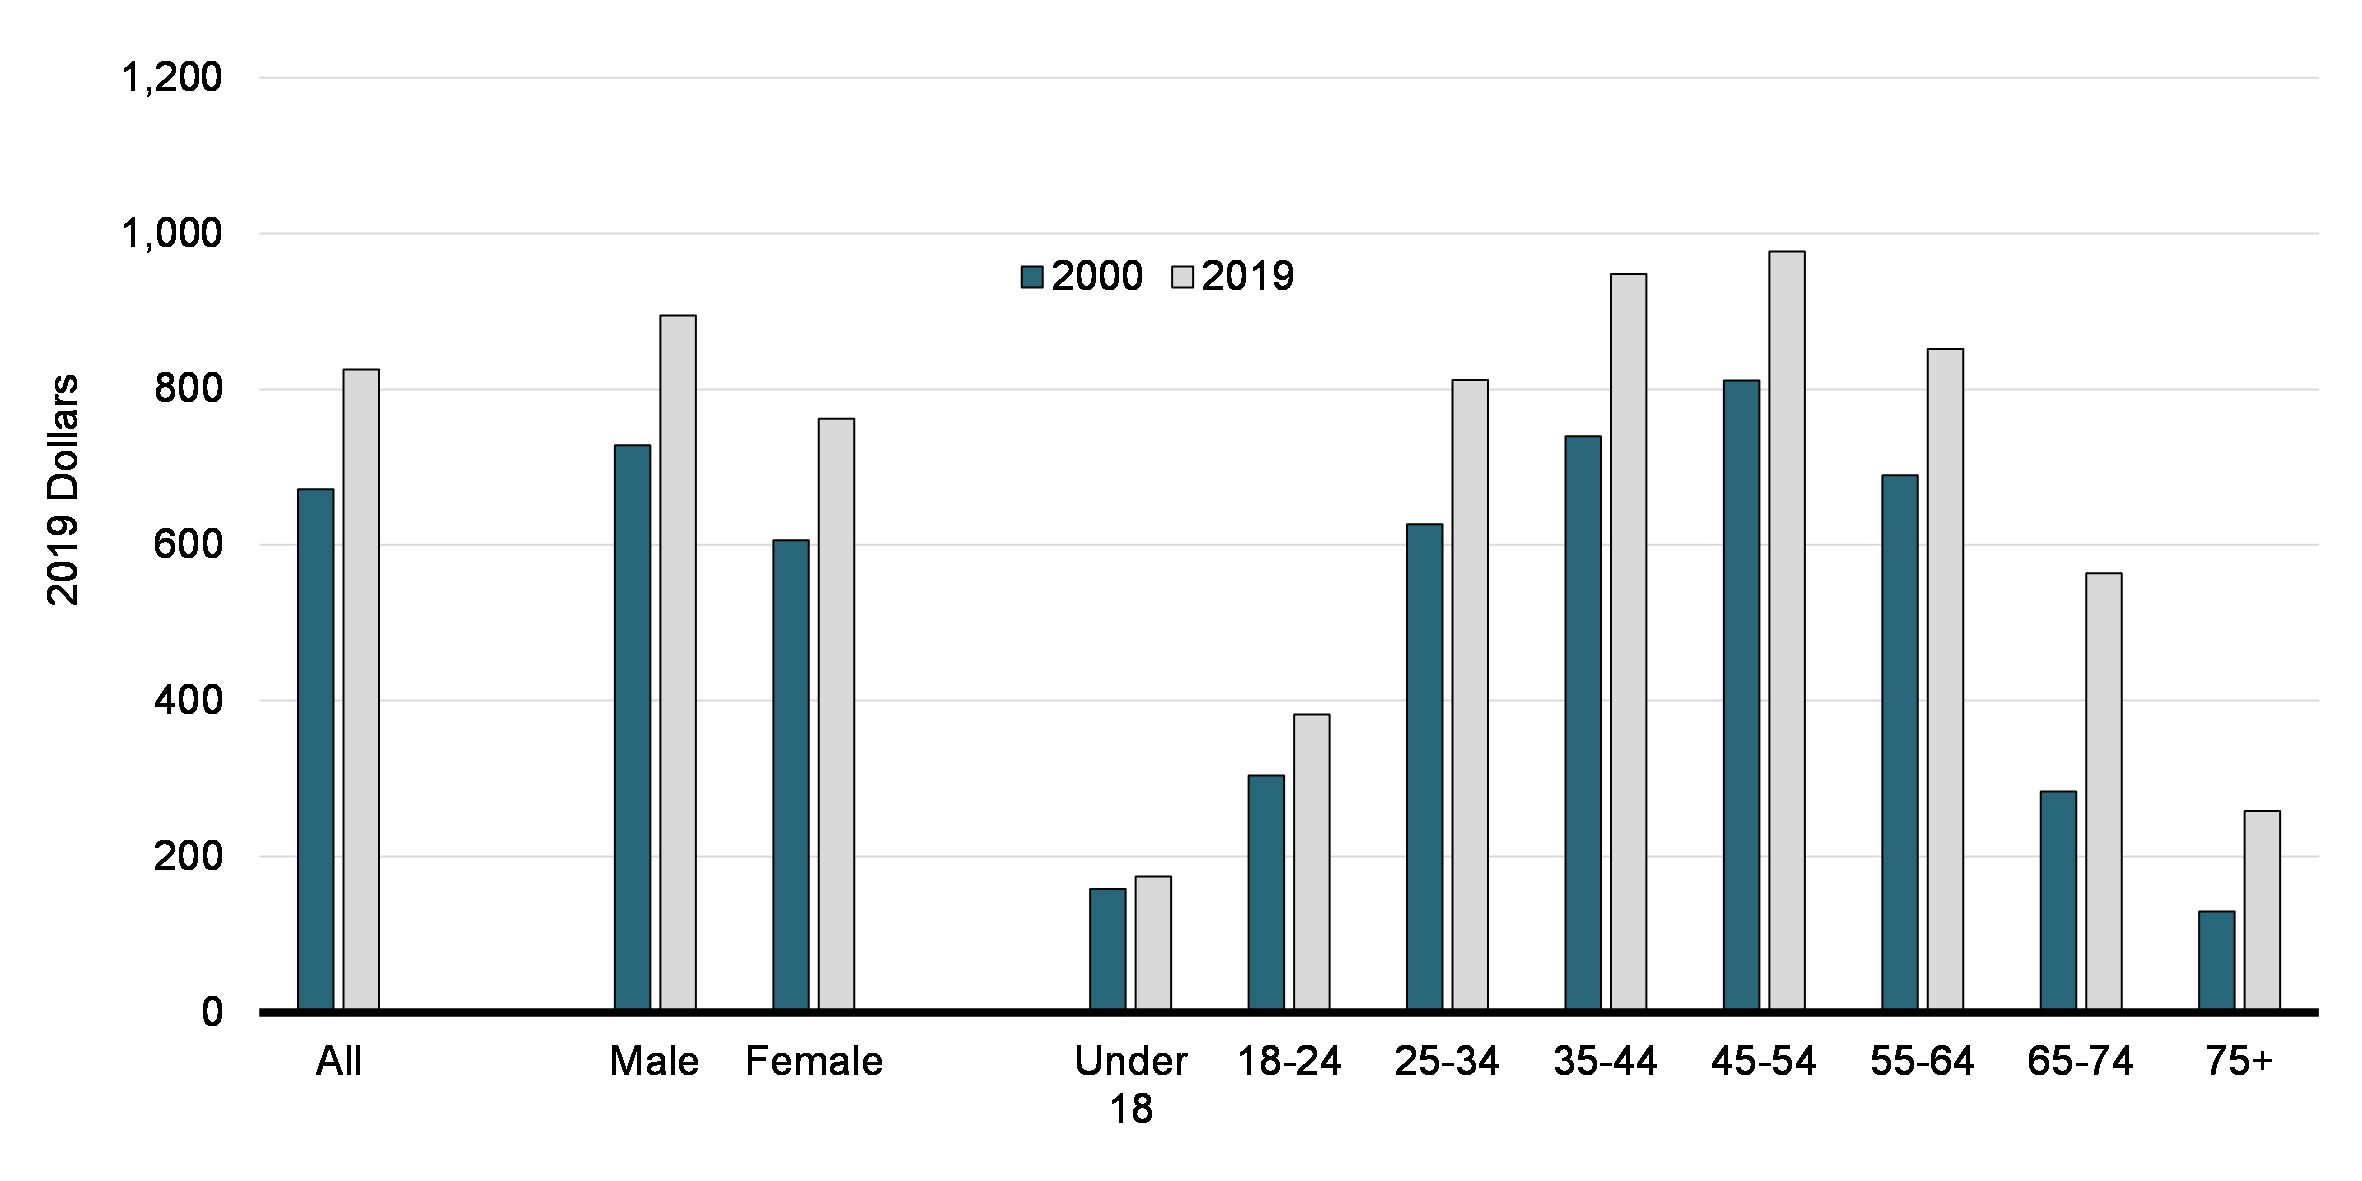
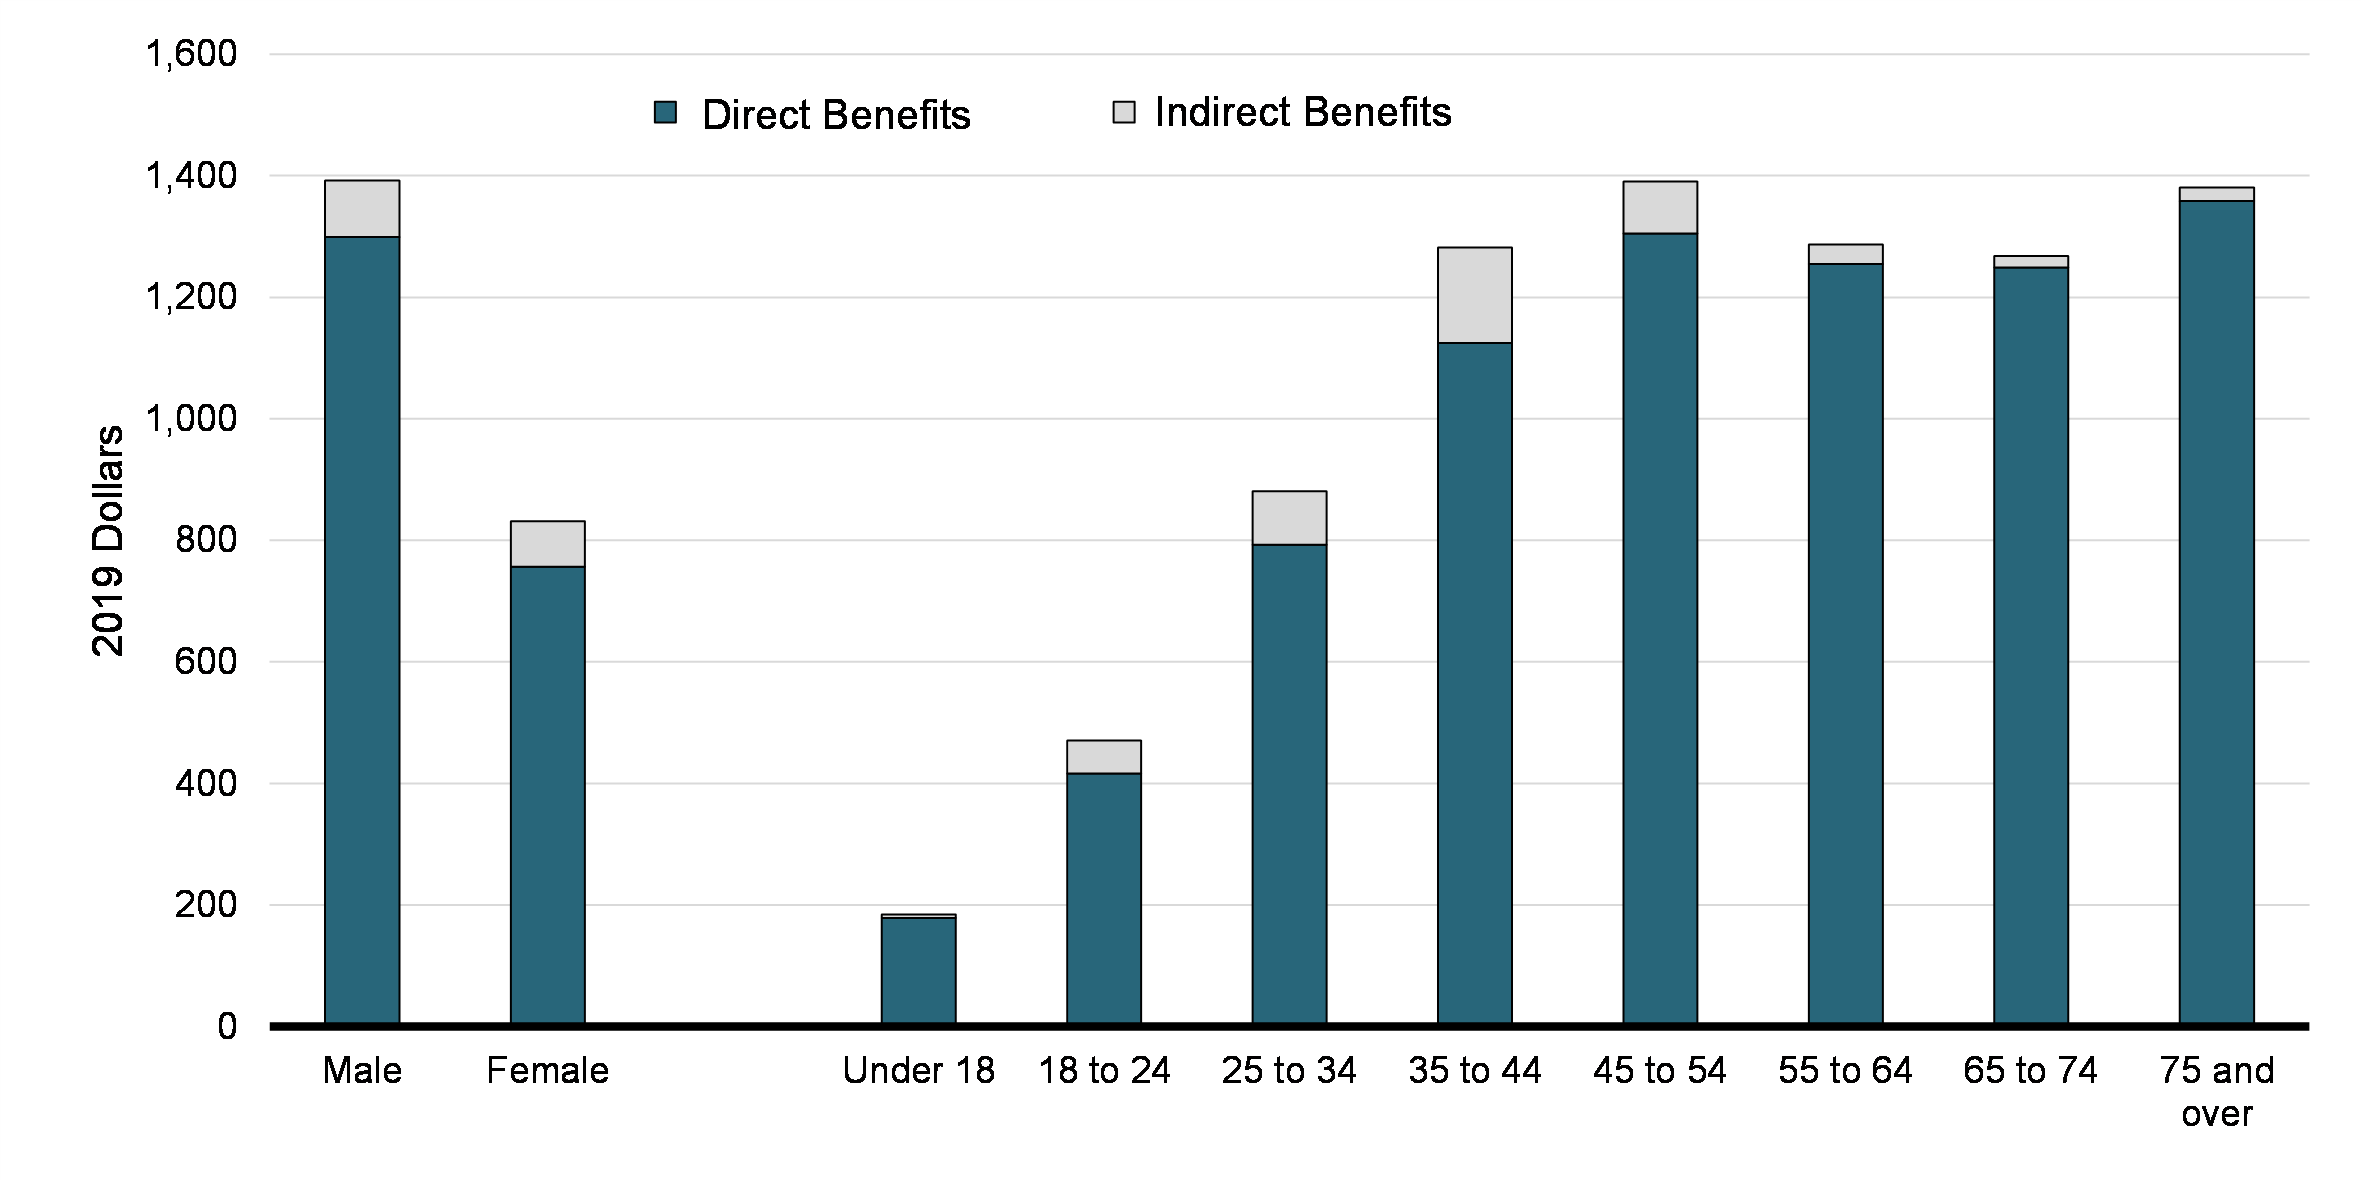
In 2019, taxfilers who claimed the UPD deduction claimed on average about $825. Male taxfilers claimed a little more on average ($894) than female claimants ($762). The average amount claimed increased with age, reaching a maximum of $977 on average for claimants aged between 45 and 54 years old (Chart 2). The analysis also suggests that there was no significant difference between the amounts claimed by unionized claimants and claimants of professional dues only.
Average UPD Amount Claimed in 2000 and 2019, by Gender and Age Group (Constant 2019 Dollars)
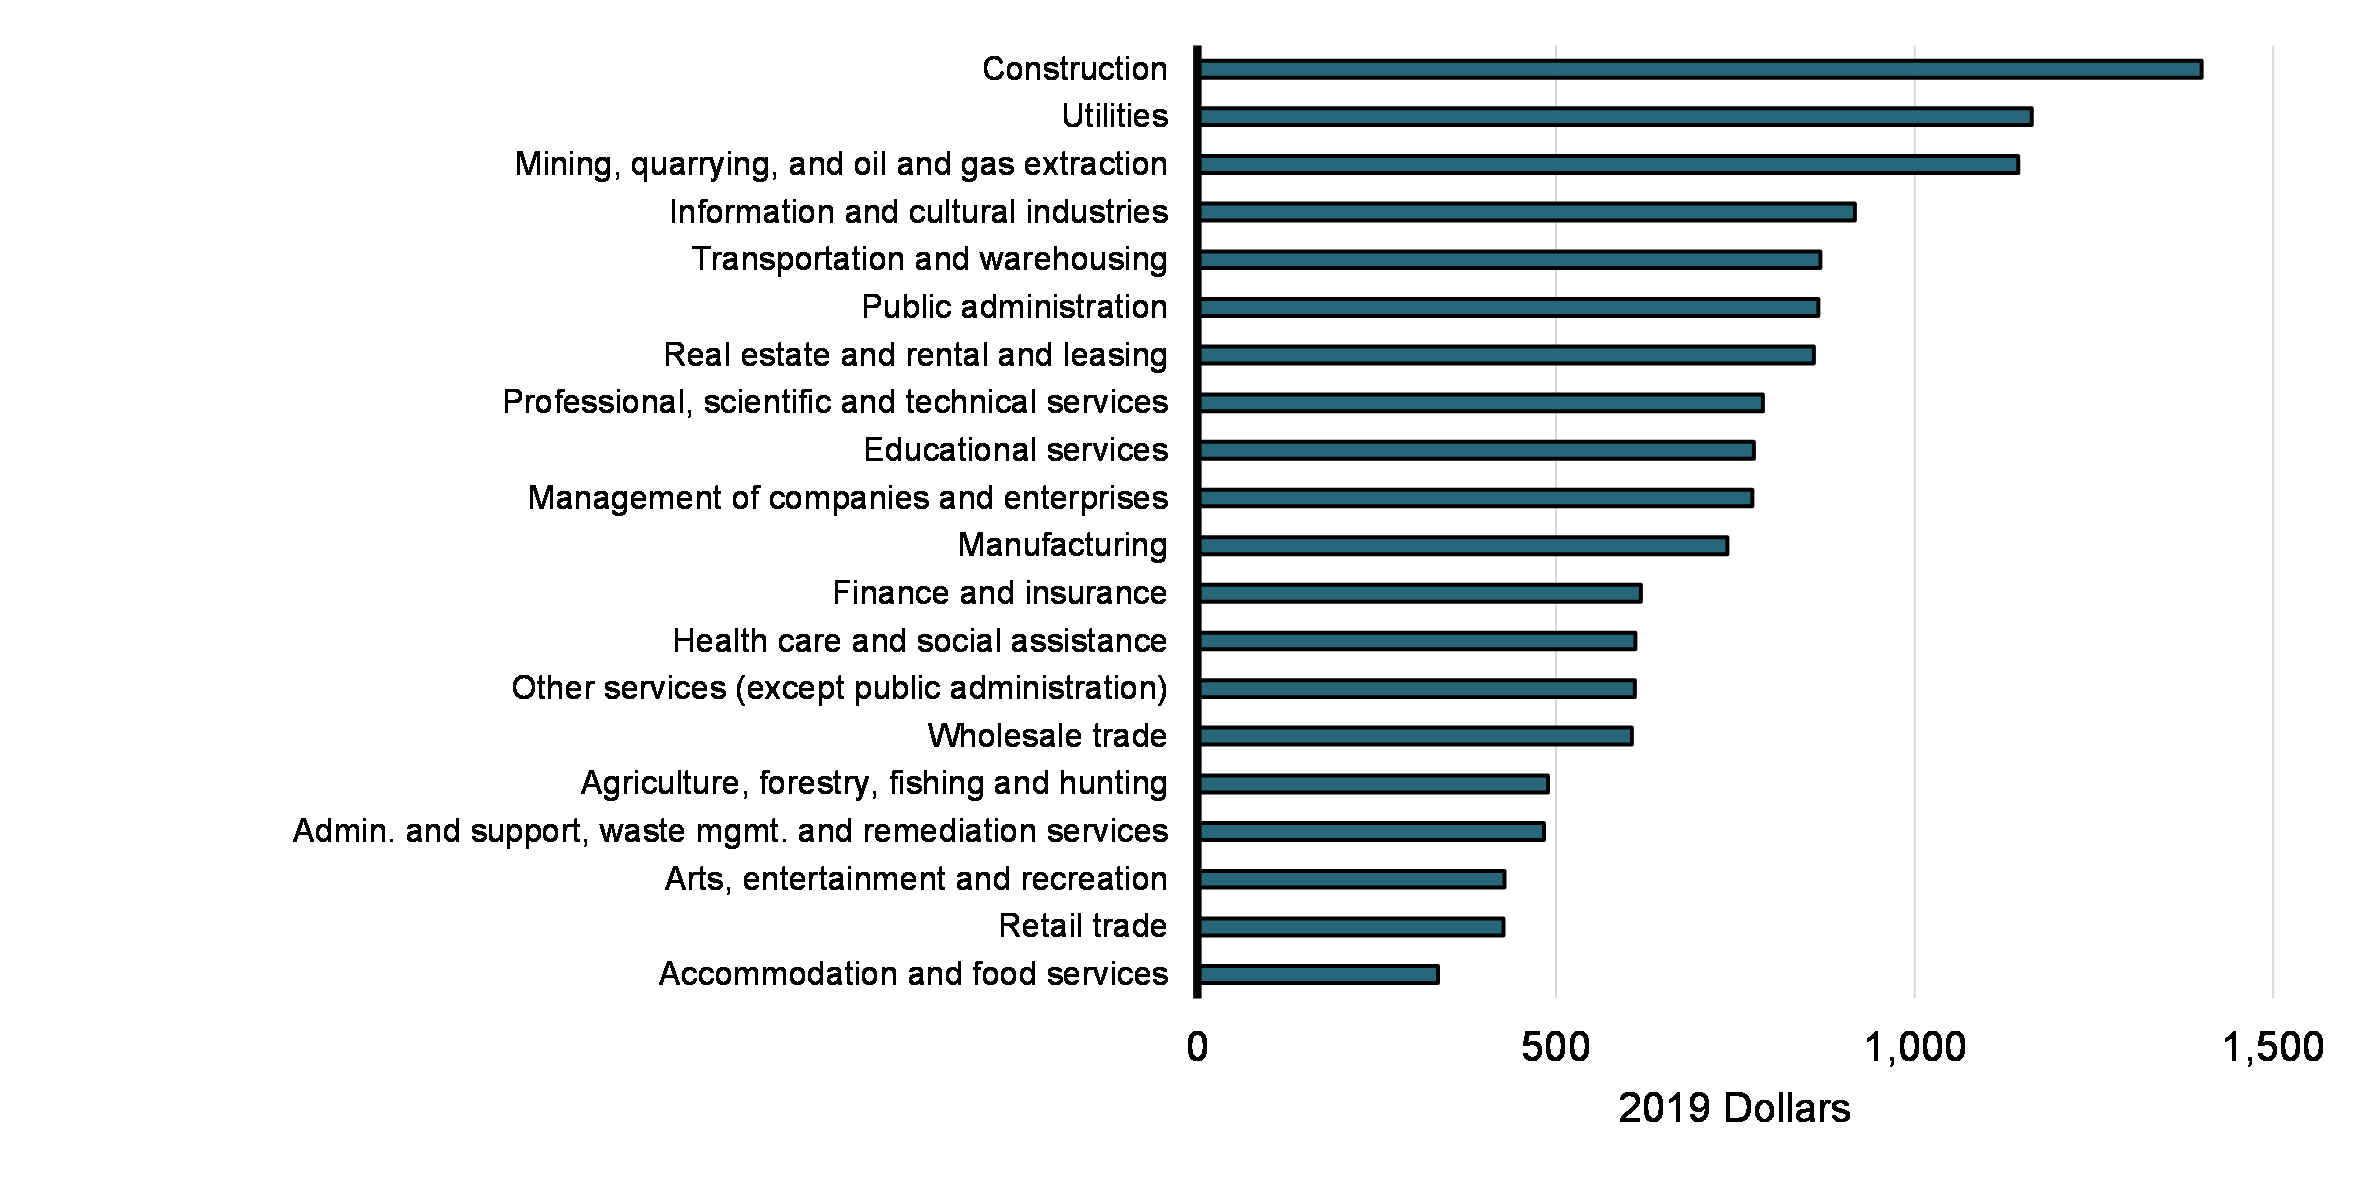
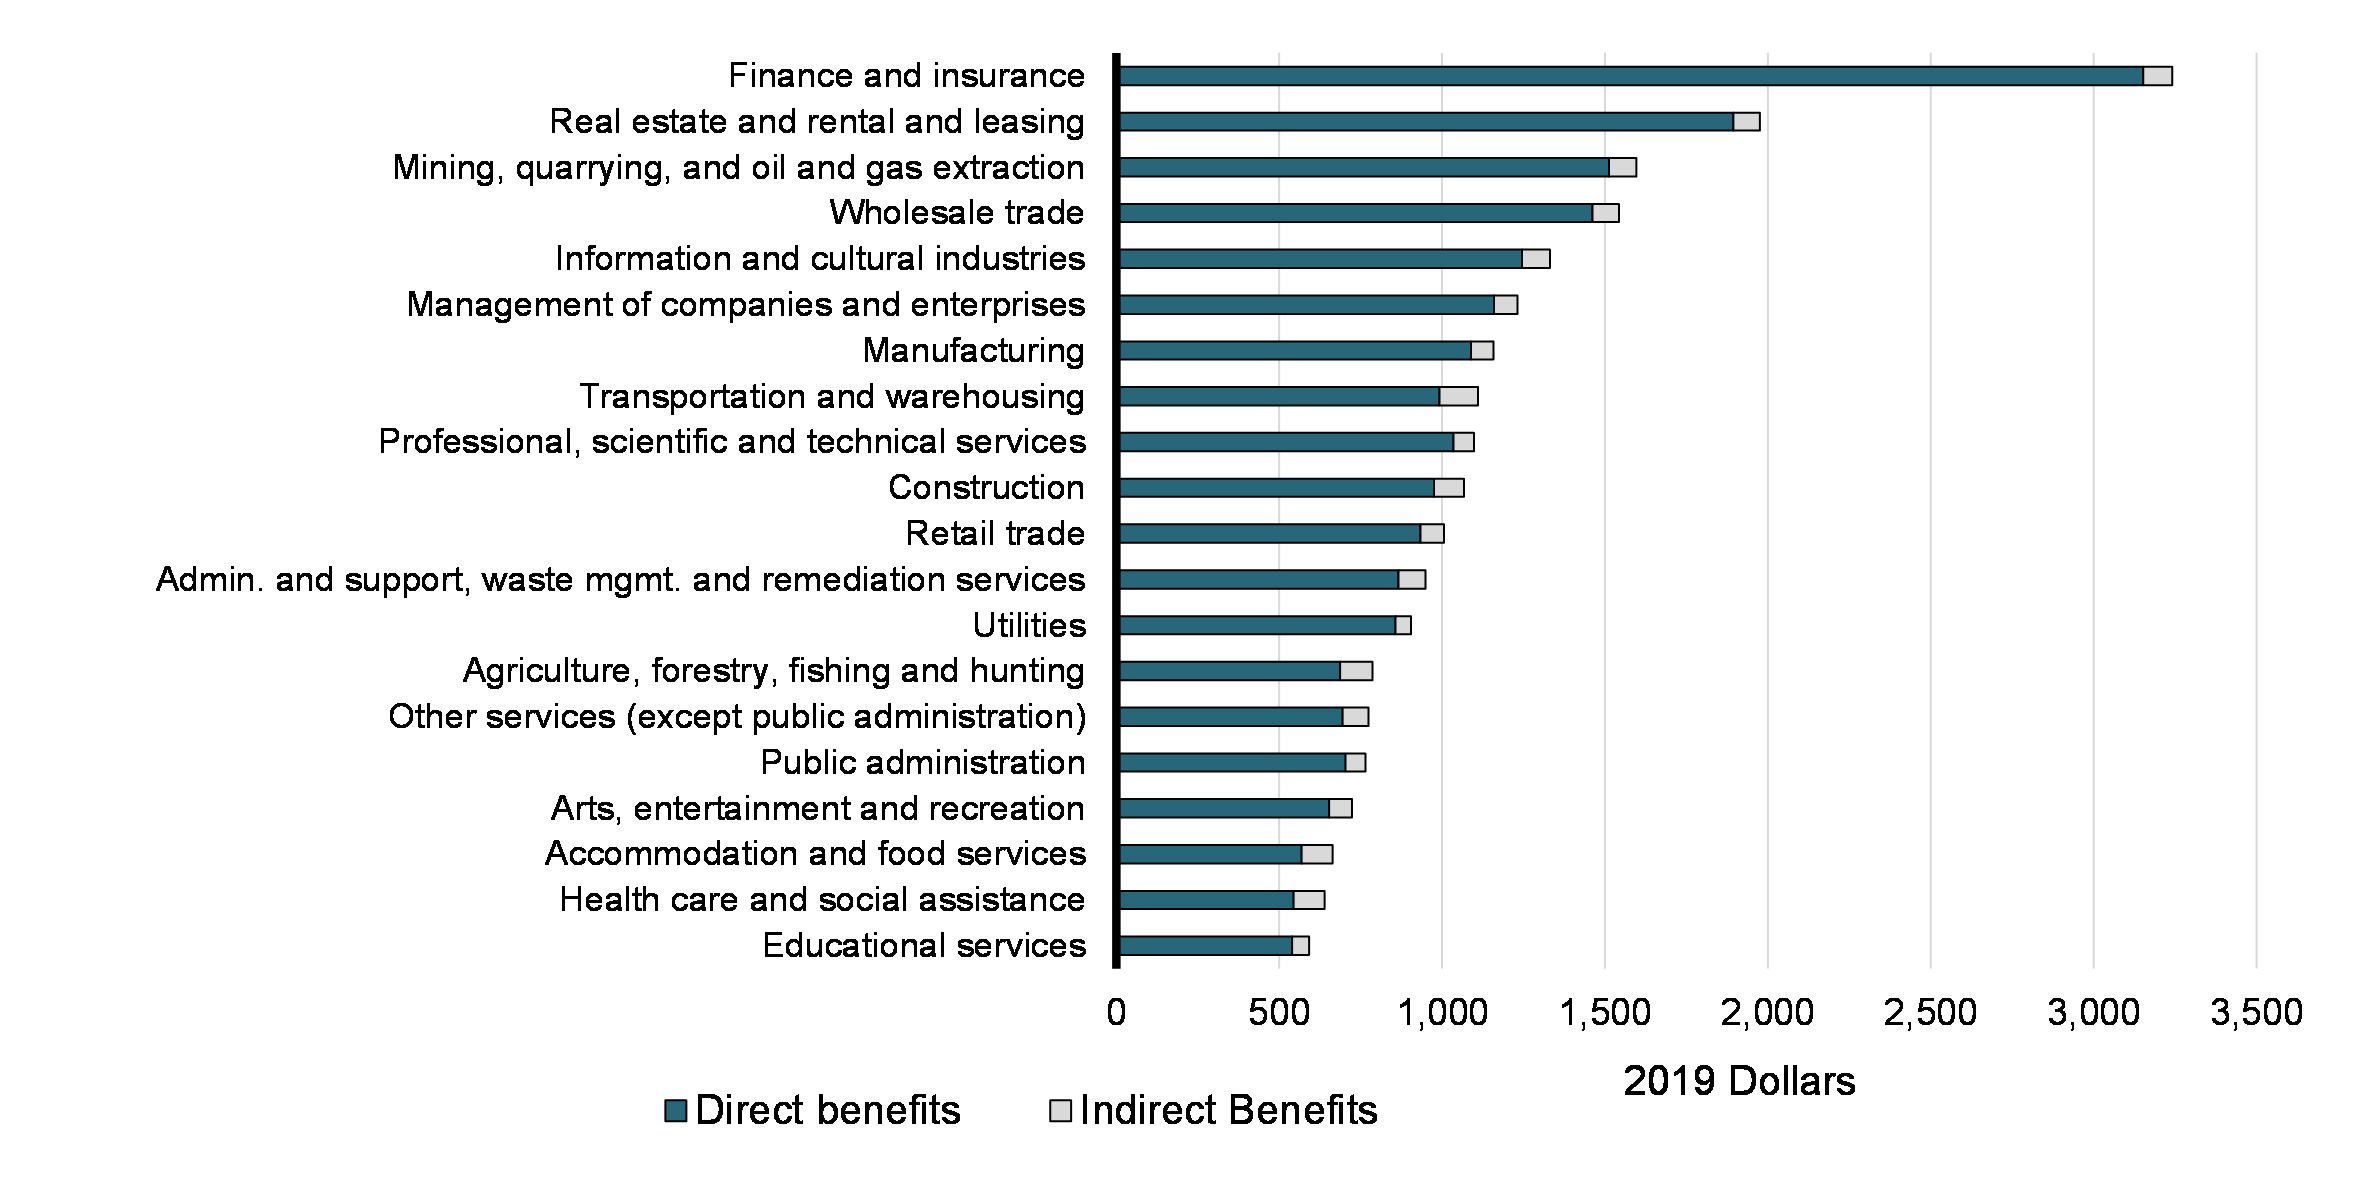
There is a large variation in amounts claimed between industries (Chart 3). In the construction sector, for example, claimants have an average deduction of $1,400, while the average is only $336 in the accommodation and food services sector. Other sectors with high average claims include utilities ($1,163), mining, quarrying, and oil and gas extraction ($1,145), and information and cultural industries ($917).
Average UPD Amount Claimed, by Industry (2019)
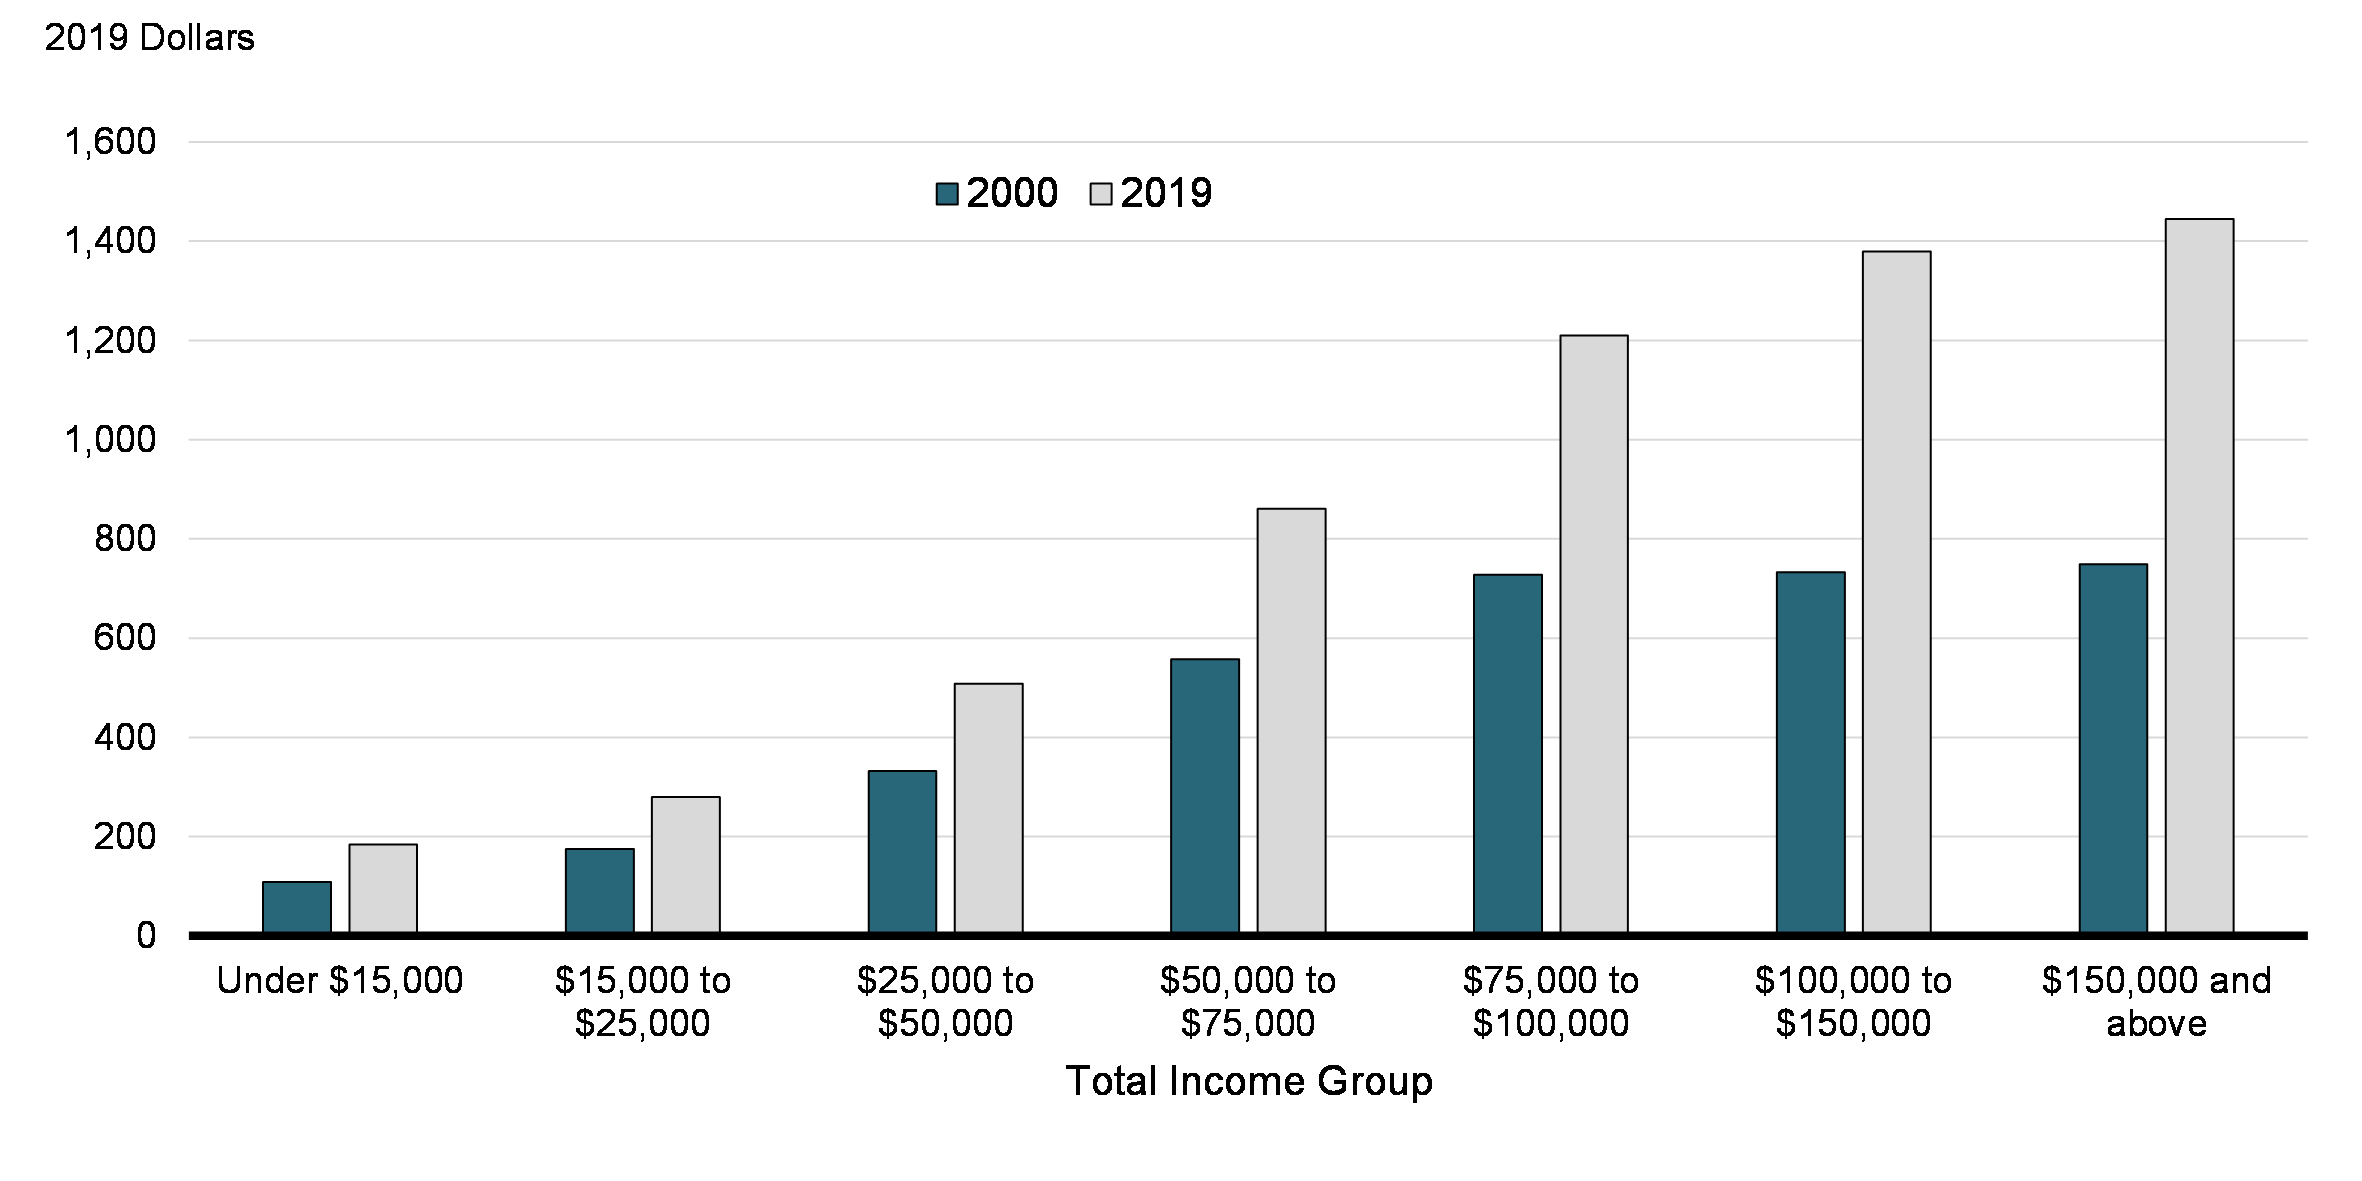
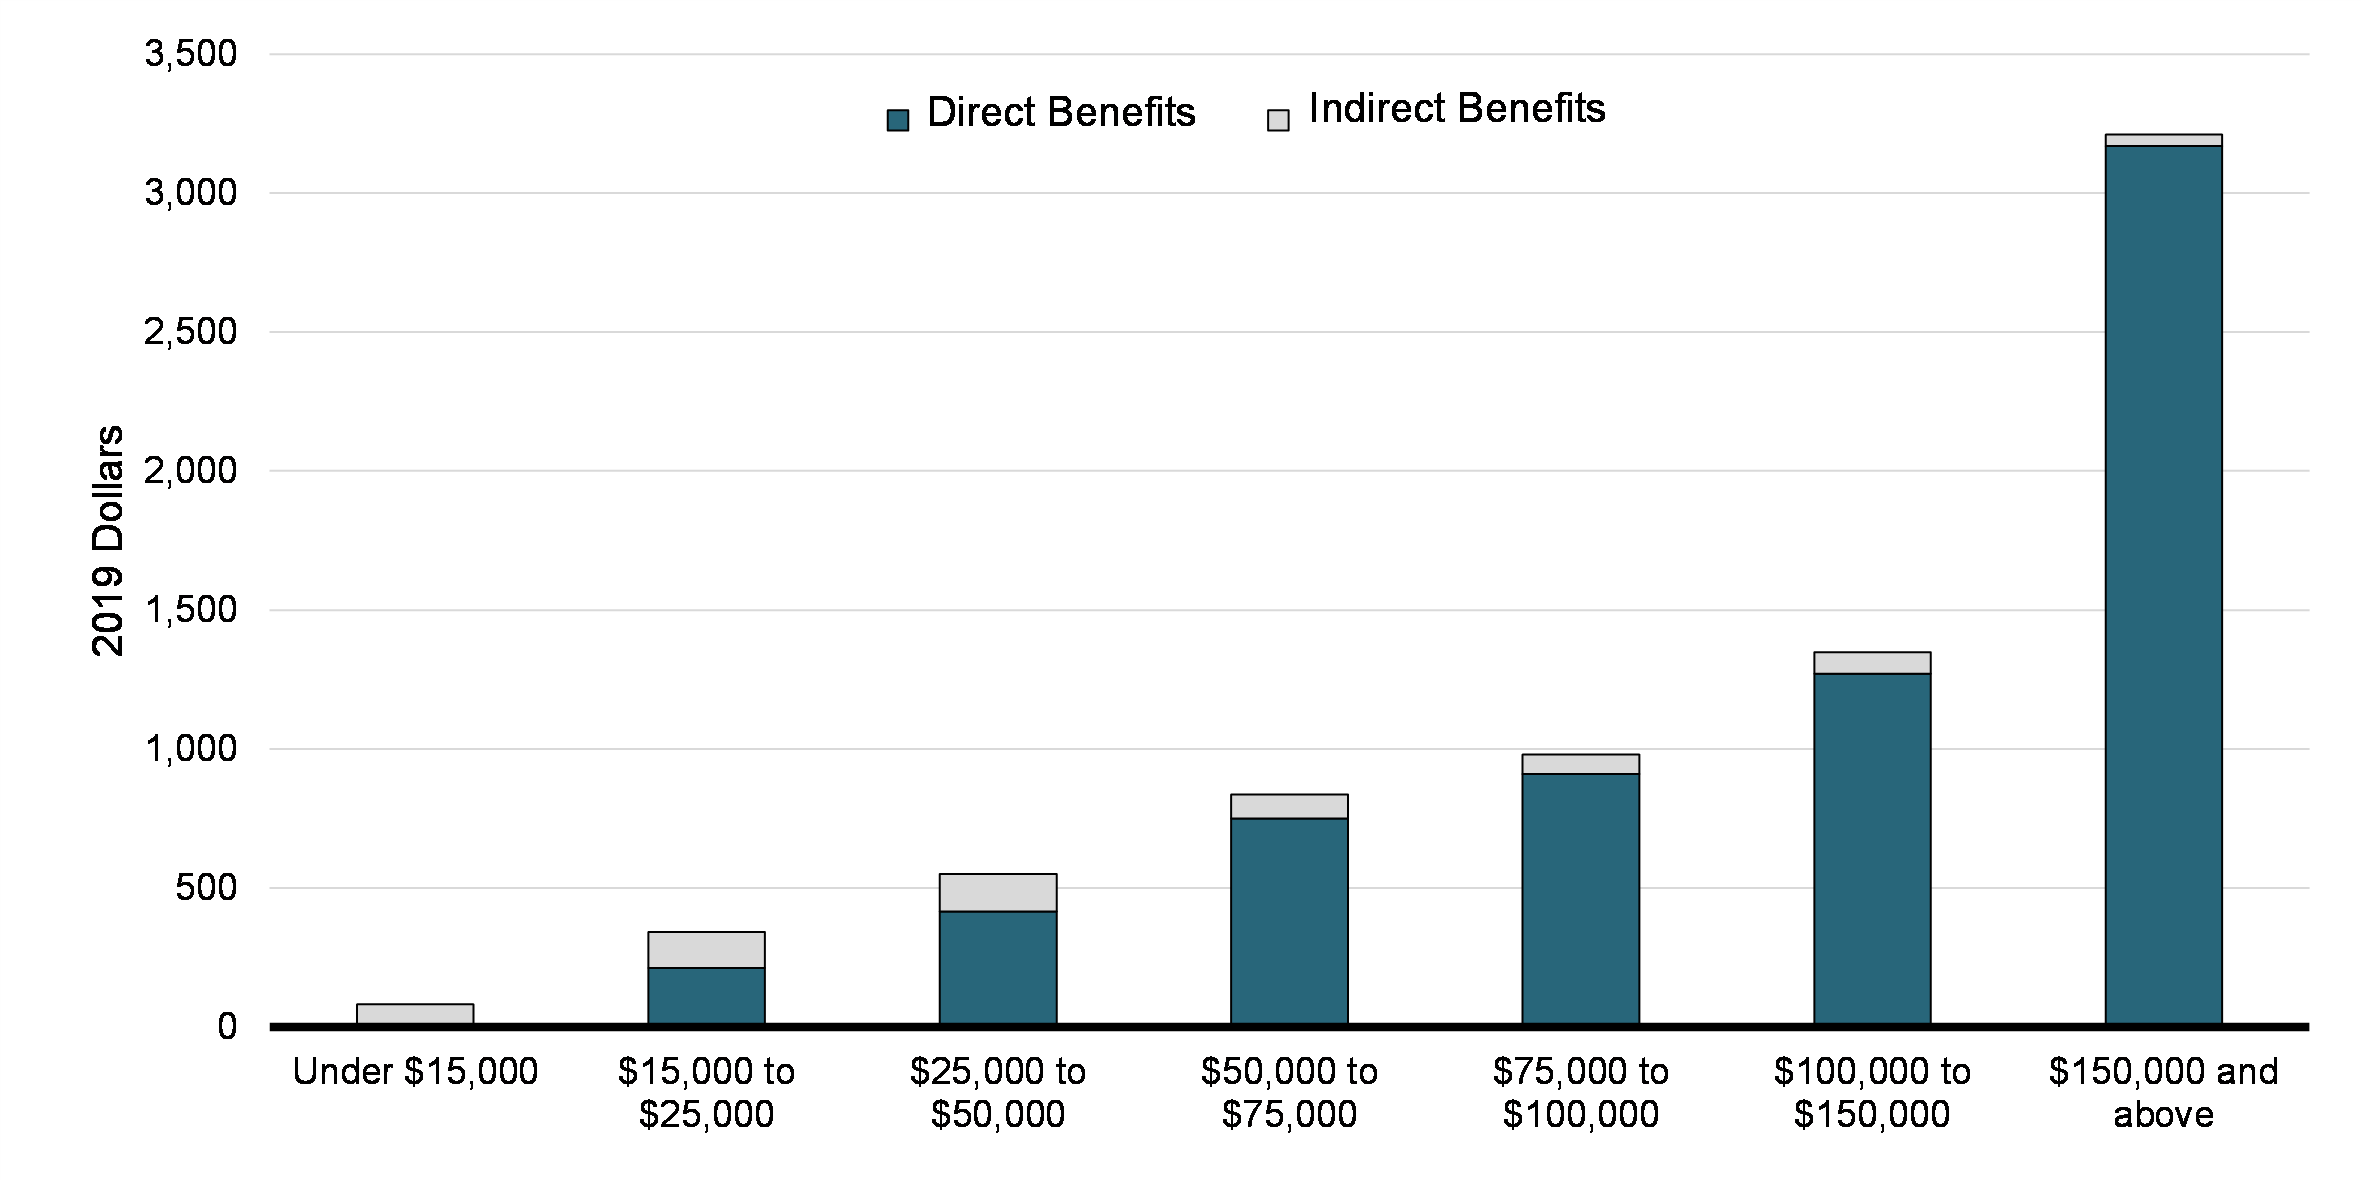
Taxfilers in higher income groups claim larger UPD deductions (Chart 4). In 2019, UPD claimants with total income $150,000 and over claimed an average of $1,445, while those with incomes under $15,000 claimed an average of $184. Average amounts claimed also grew faster between 2000 and 2019 in the higher income groups.
Average UPD Amount Claimed, by Income Group (2000 and 2019)
4.2. Share of UPD Claimants by Demographic Group
Shares by Gender
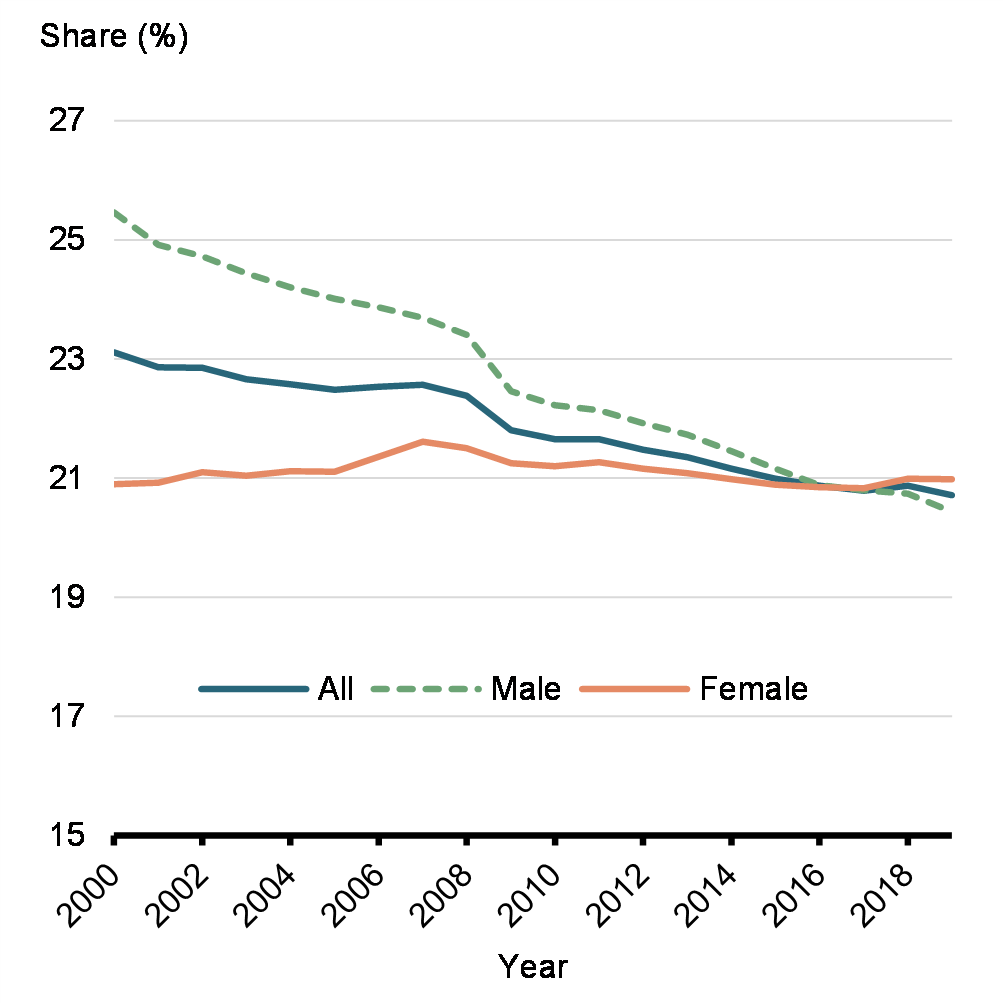
The previous section detailed how the share of taxfilers claiming the UPD deduction decreased from 23.1% in 2000 to 20.7% in 2019. This decrease is mostly explained by a decrease in the share of men claiming the UPD deduction, from 25.5% in 2000 to 20.4% in 2019. For women, the share was constant at about 21.0% throughout the period (Chart 5). A consequence of these differing trends is that while in 2000, a larger share of men were claimants of this deduction than women, the shares are similar for both genders in 2019. These trends mirror the ones in the unionization rate in Canada.Footnote 10
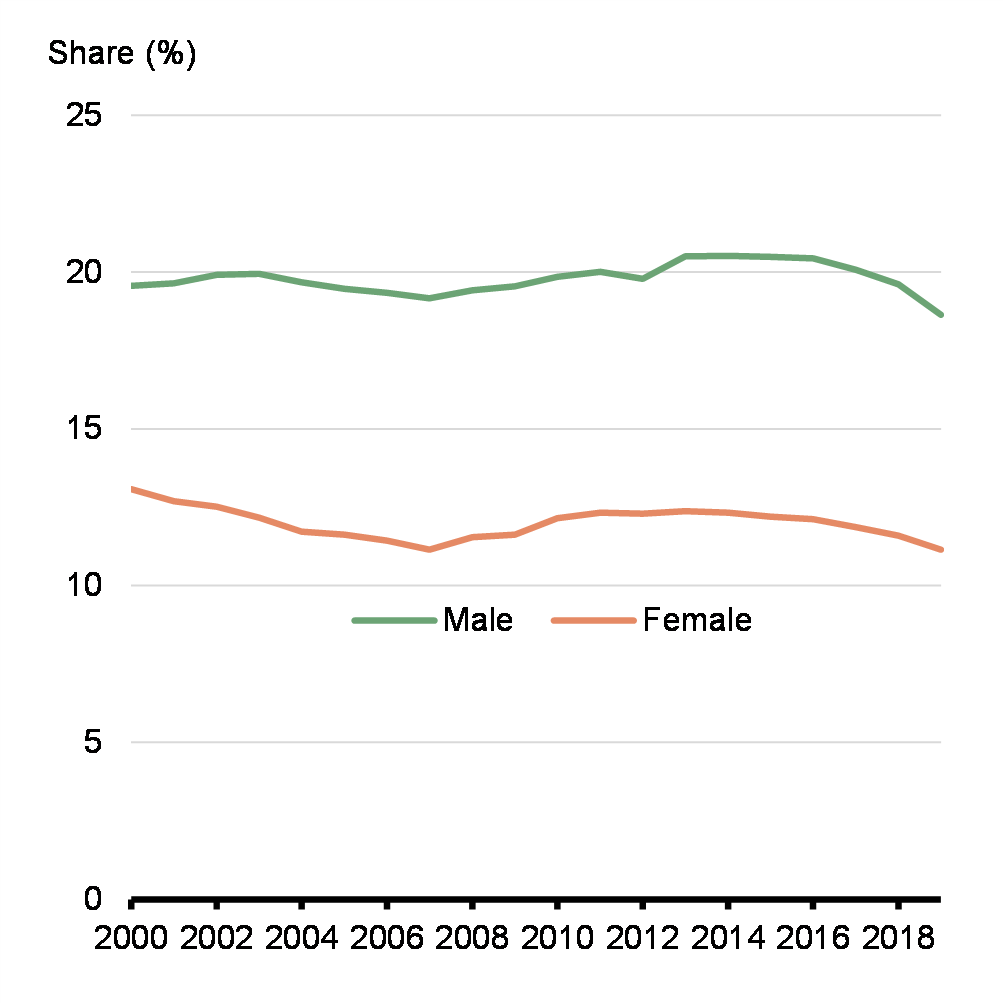
From the population of UPD claimants in 2019, 14.7% are claimants of professional dues only (more precisely, have no T4 slips that report union dues). Chart 6 shows that this share is much higher among men (18.6%) than women (11.1%) over the whole period. Among men, the share of claimants of professional dues only is relatively constant over the 2000-2019 period, but decreases in the most recent years. For women, the share of claimants of professional dues only decreases between 2000 and 2007, before increasing again until 2013. In the most recent few years, it has decreased again.
Share of UPD Claimants among Taxfilers
Estimated Share of Claimants of Professional Dues Only among All UPD Claimants
Shares by Age Group
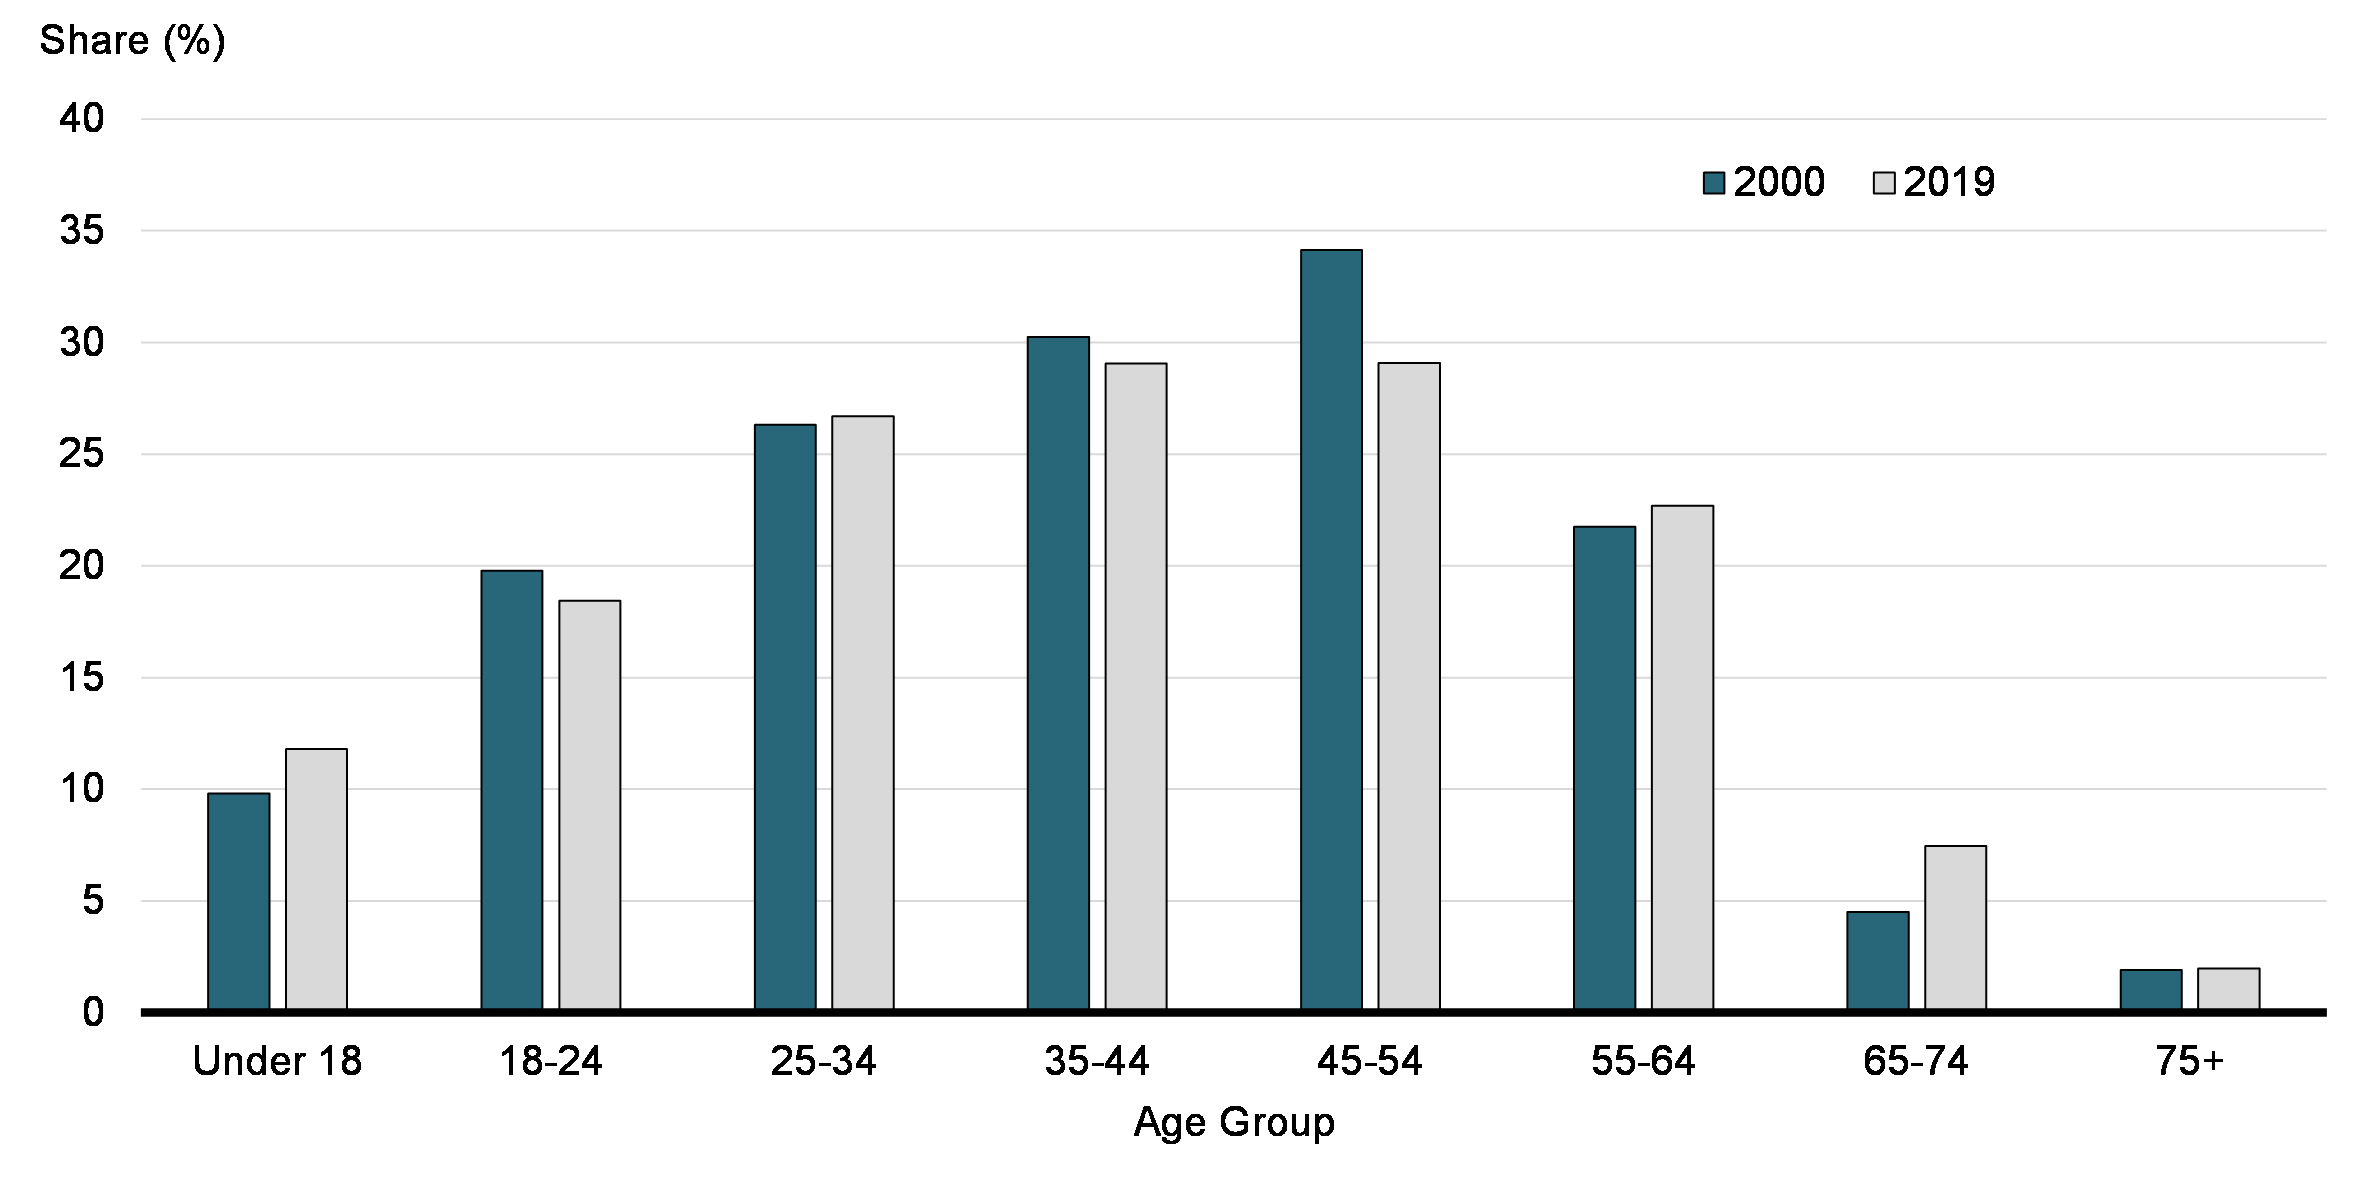
Looking at age groups in Chart 7, the share of taxfilers claiming the UPD deduction increases with age, until reaching a plateau for Canadians aged 25 to 54, and then decreasing for older individuals. More precisely, the share of taxfilers aged 25 to 54 claiming this deduction lies between 26% and 29% of taxfilers in those age ranges. In contrast, only 11.8% of Canadians aged under 18 years old and 18.4% of those between 18 and 24 years old were claimants. This share then declines for older Canadians, down to 2.0% for those aged 75 and over.
The share of claimants of professional dues only also increases with age, reaching 79.6% of UPD claimants aged 75 years old and over. This age trend may reflect the fact that older workers are more likely, after retirement, to be in non-unionized roles, such as management or freelance work, for example. Some of these roles may require professional dues.
Share of UPD Claimants among Taxfilers, by Age Group (2000 and 2019)
Shares by Industry
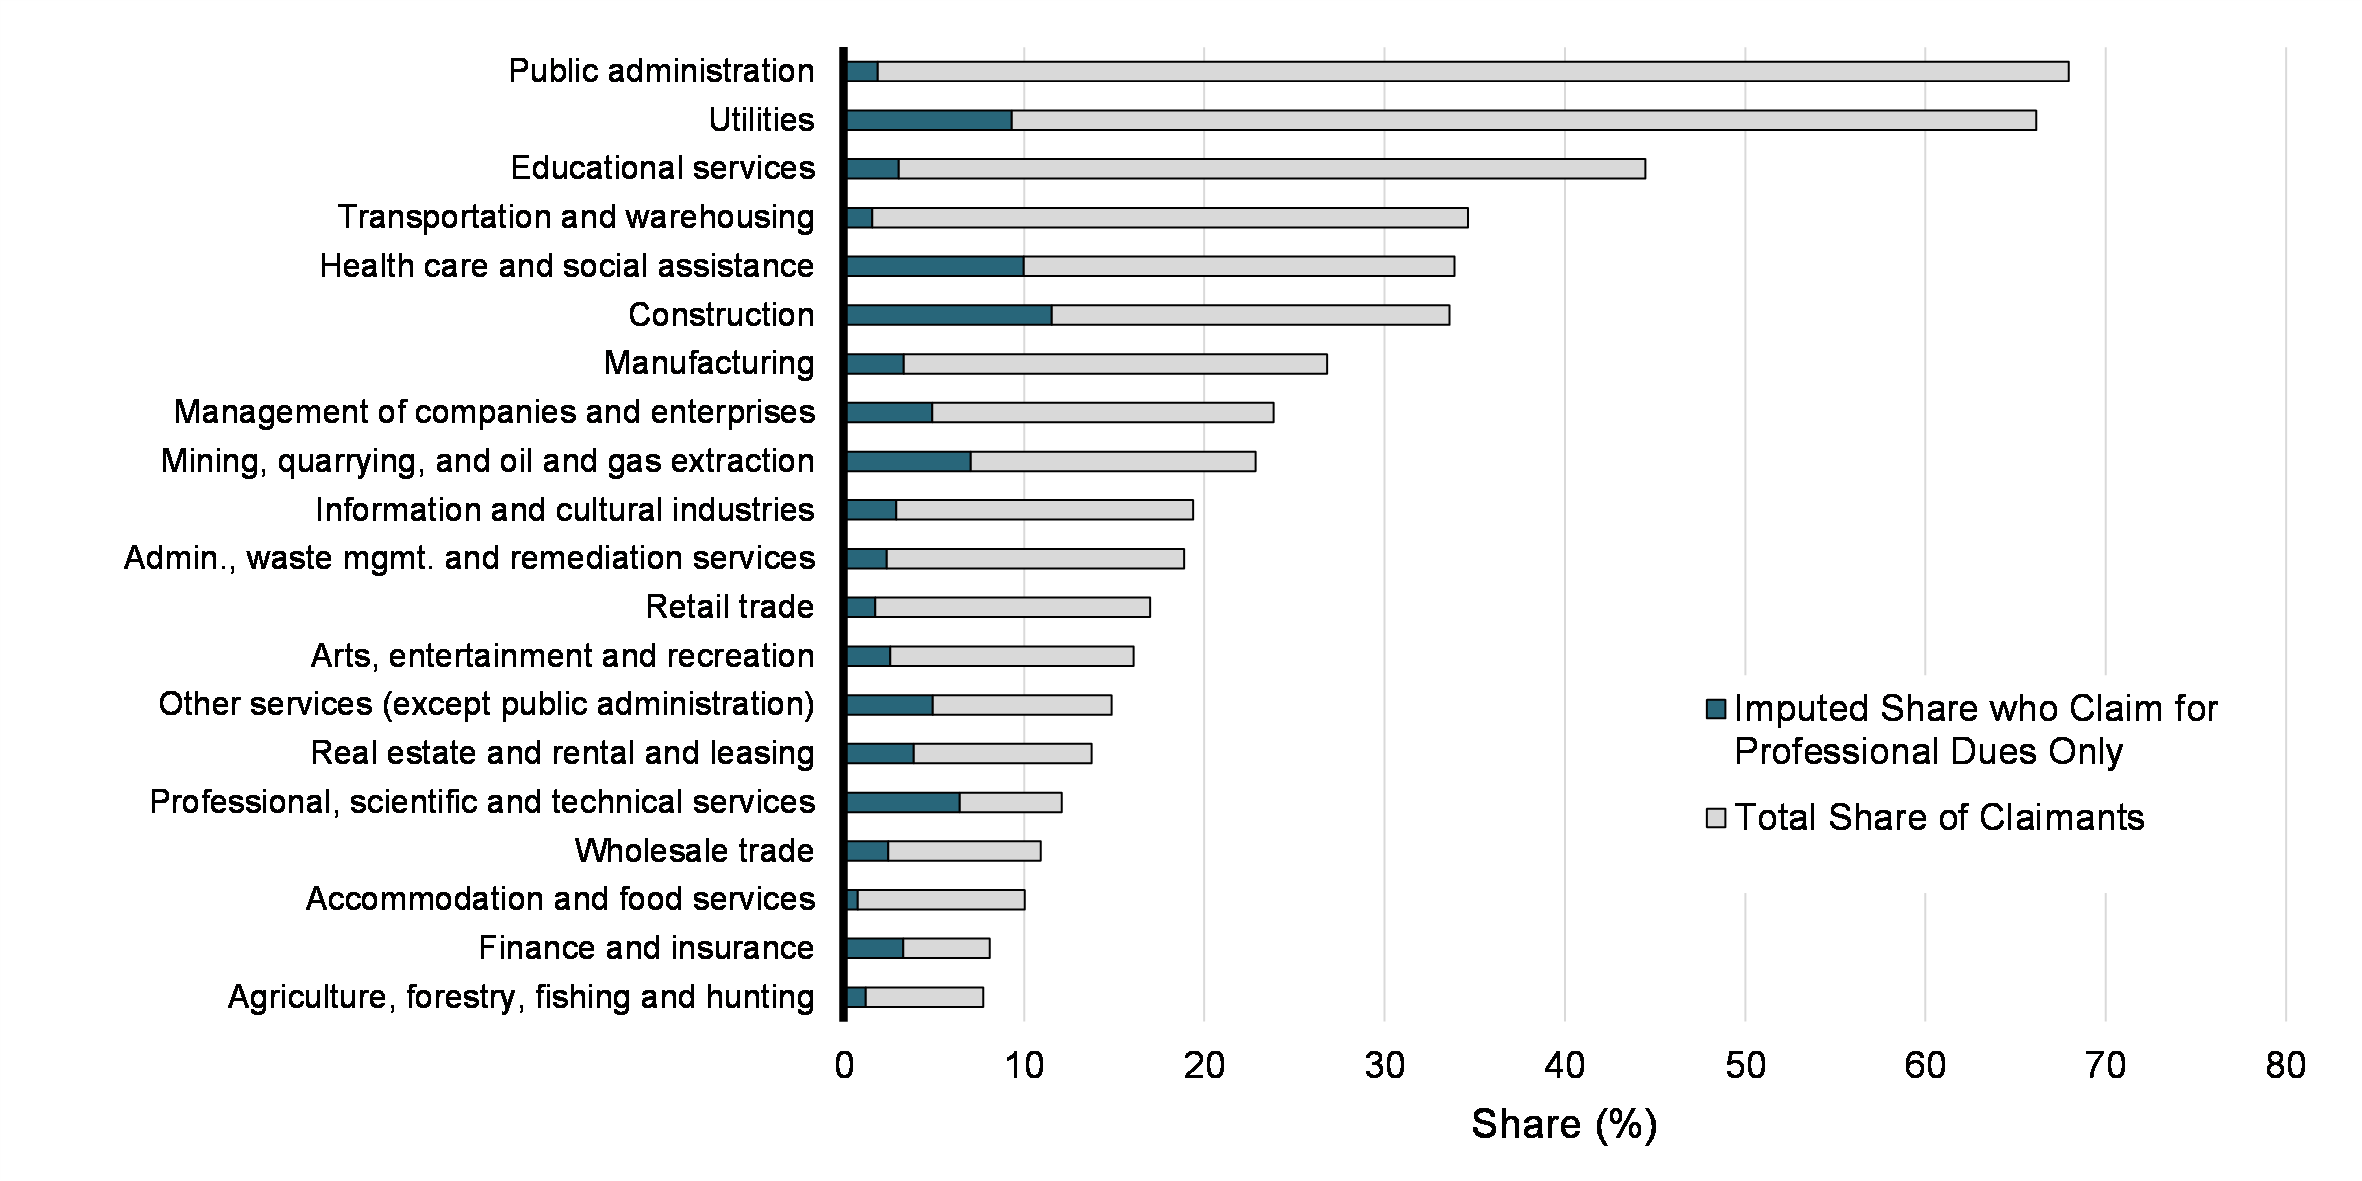
As one would expect, there is a large inter-industry variance in the share of taxfilers making use of the UPD deduction. Chart 8 shows the shares by industry in 2019. The 2-digit NAICS industry with the largest share of claimants was public administration, with about 68.0% of all workers claiming the UPD deduction. In this industry, the high share of claimants may reflect a high degree of unionization. Other industries with a high share of claimants included utilities (66.2%), educational services (44.5%), transportation and warehousing (34.6%), and construction (33.6%). In contrast, only 7.7% of workers in the agriculture, forestry, fishing and hunting sector claimed the deduction, and 8.1% in the finance and insurance sector.
Chart 8 also illustrates the estimated share of claimants of professional dues only. Perhaps unsurprisingly, over half of UPD claimants in the professional, scientific and technical services industry are claiming the UPD solely for fees other than union dues. Other industries that feature a large share of claimants of professional dues only are finance and insurance (40.7% of claimants), and construction (33.2% of claimants). On the other hand, in the public administration industry (where the share of claimants among taxfilers is the highest), only a small portion of claimants do so solely for professional dues. This observation reflects the high degree of unionization in that sector.
Share of UPD Claimants among Taxfilers, by 2-Digit NAICS Industry (2019)
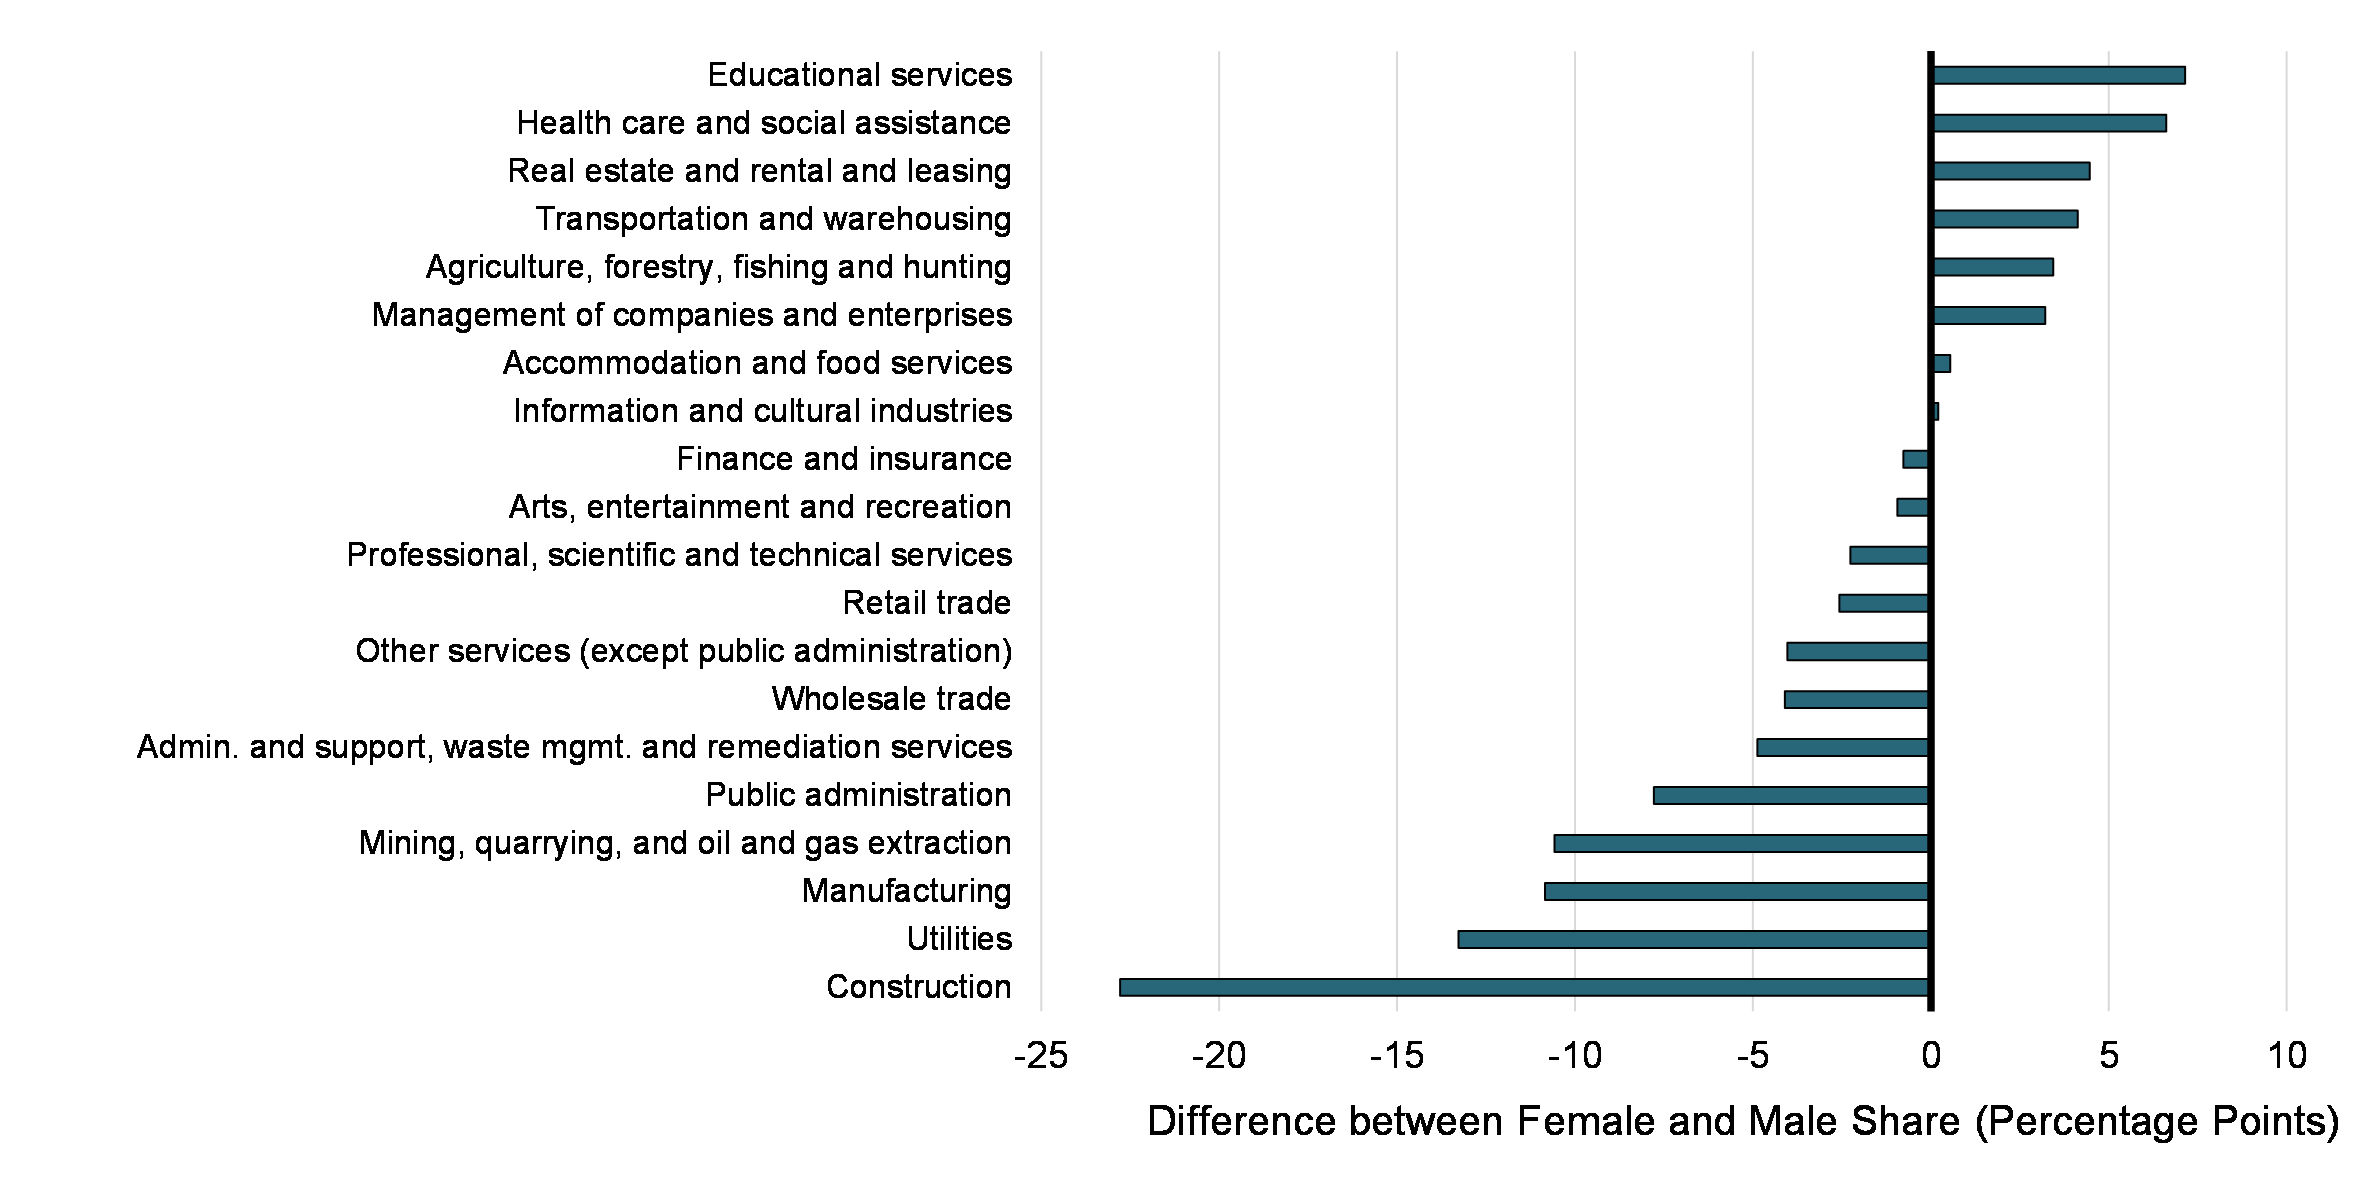
Interestingly, within industries, we observe some variance in the share of taxfilers claiming the UPD deduction between genders. Chart 9 shows the difference in the claimant rate between men and women in each industry. The largest difference is in the construction sector, where 33.4% of male workers claim this deduction but only 10.6% of female workers do. This discrepancy might capture a difference in the types of jobs worked by men and women within that industry (e.g., trades vs. office work). We observe similar differences in many industries, although in a few sectors a slightly higher share of women are claiming the deduction. In the health care and social assistance sector, 32.4% of female workers claim this deduction, compared to 25.8% of male workers. Similarly, in the educational services sector, 44.8% of women claim these fees, compared to 37.7% of men.
Difference between the Female and Male Shares of UPD Claimants, by Industry (2019)
Shares by Income Group
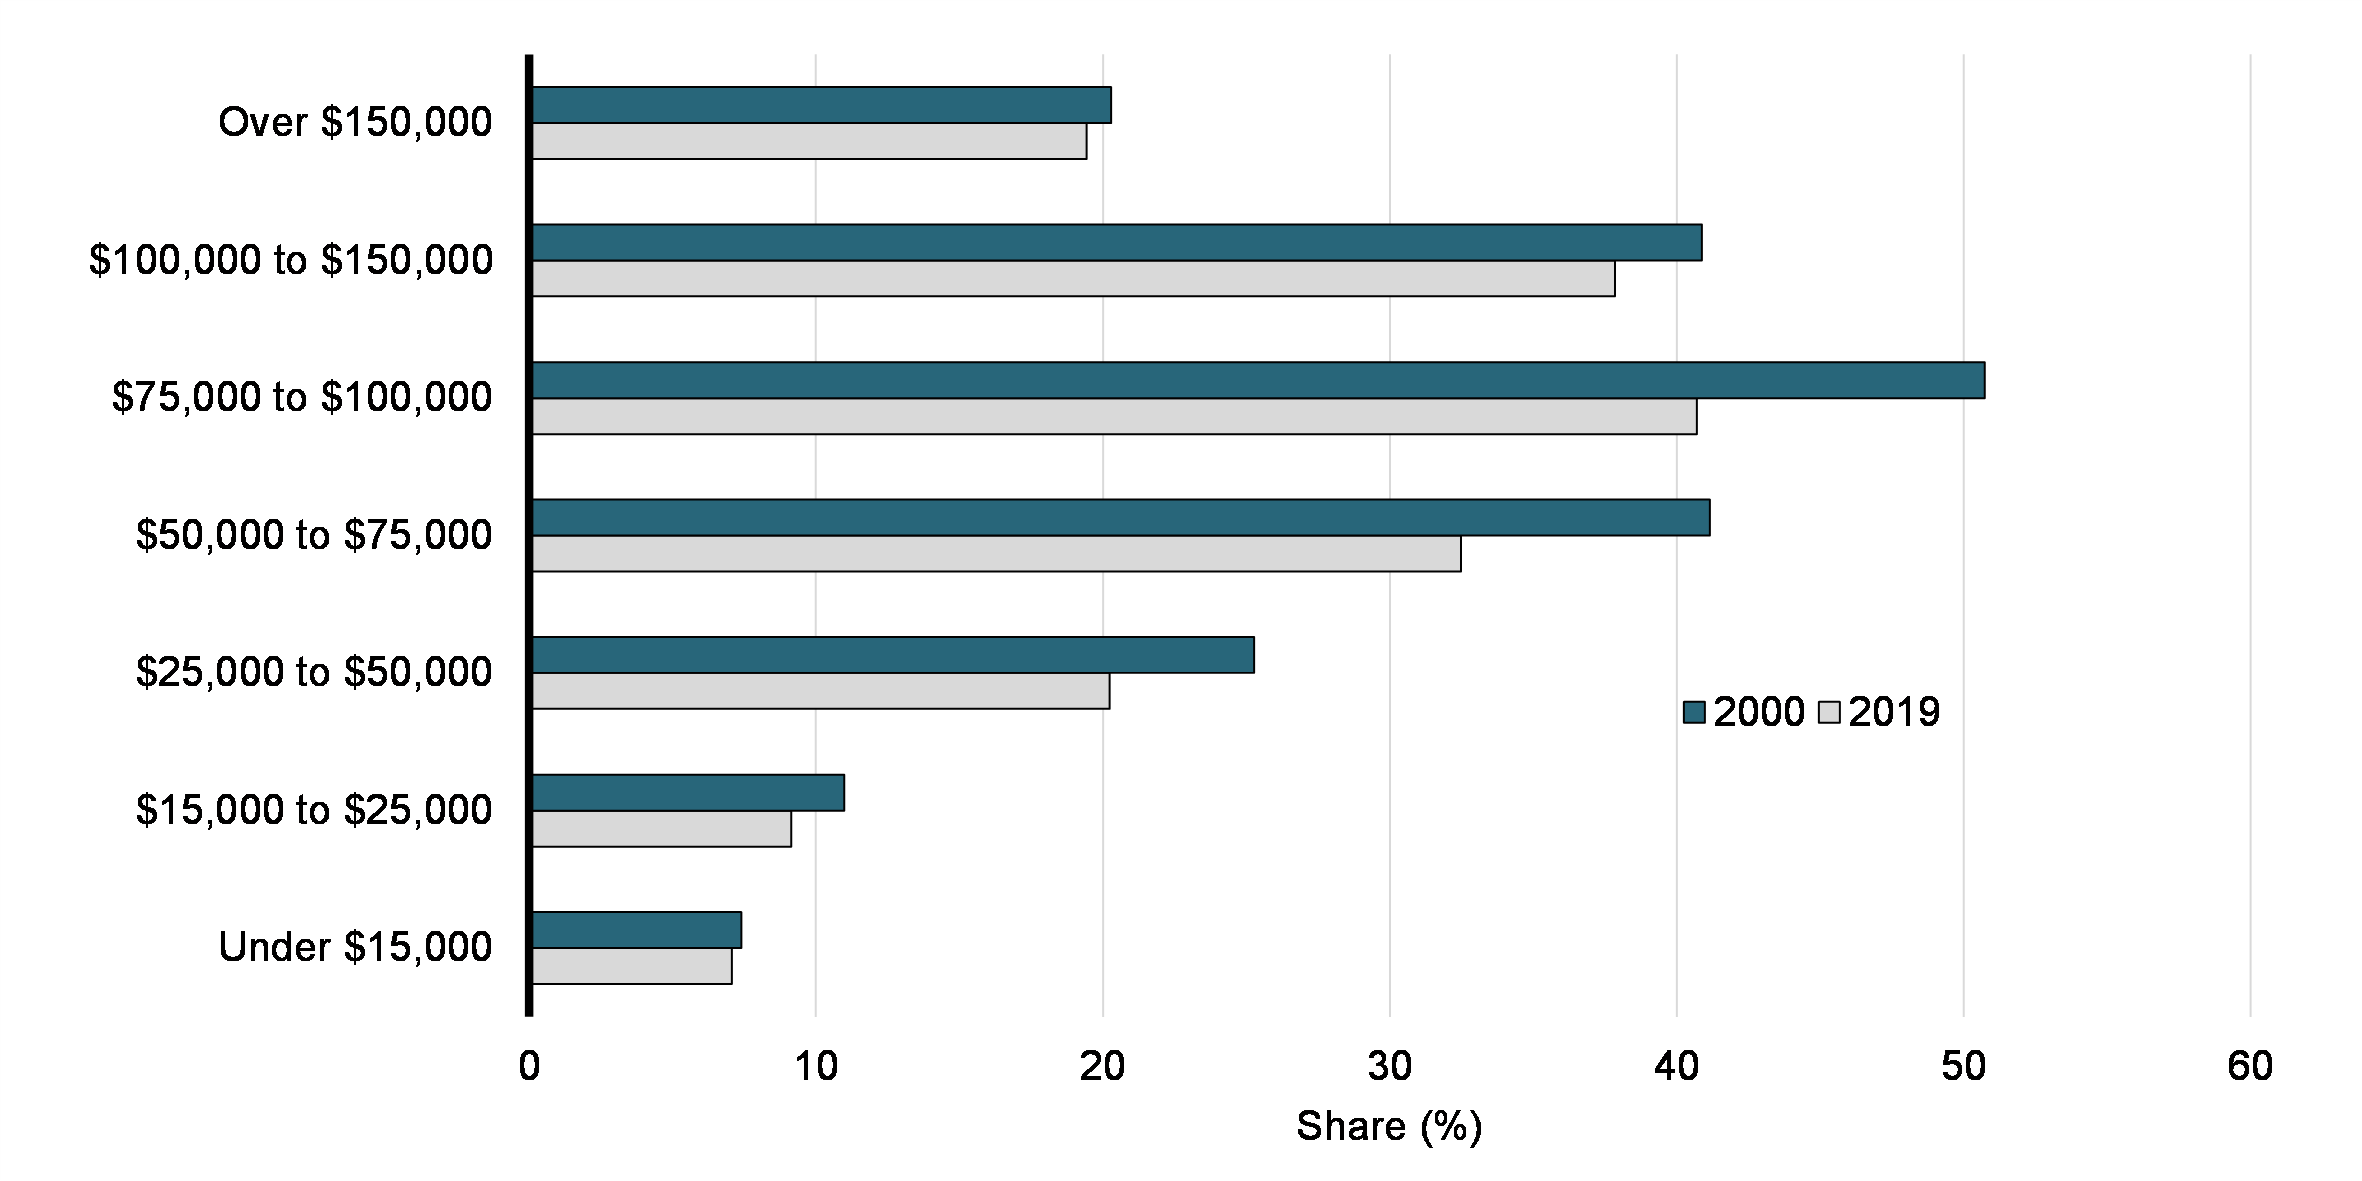
We also observe a large variation in the share of taxfilers claiming the UPD deduction between income groups. Looking at total income (including earnings and all other sources of income) in Chart 10, we see that the highest share of individuals claiming the UPD deduction in 2019 is in the $75,000 to $100,000 range, at above 40%. The share of claimants is also above 30% in the $50,000 to $75,000 category and in the $100,000 to $150,000 category, but much lower in every other category. In every category, we observe a decrease in the share of taxfilers claiming the UPD deduction since 2000, reflecting the decrease in unionization in the country.
Share of UPD Claimants among Taxfilers, by Income Group (2000 and 2019), in 2019 Dollars
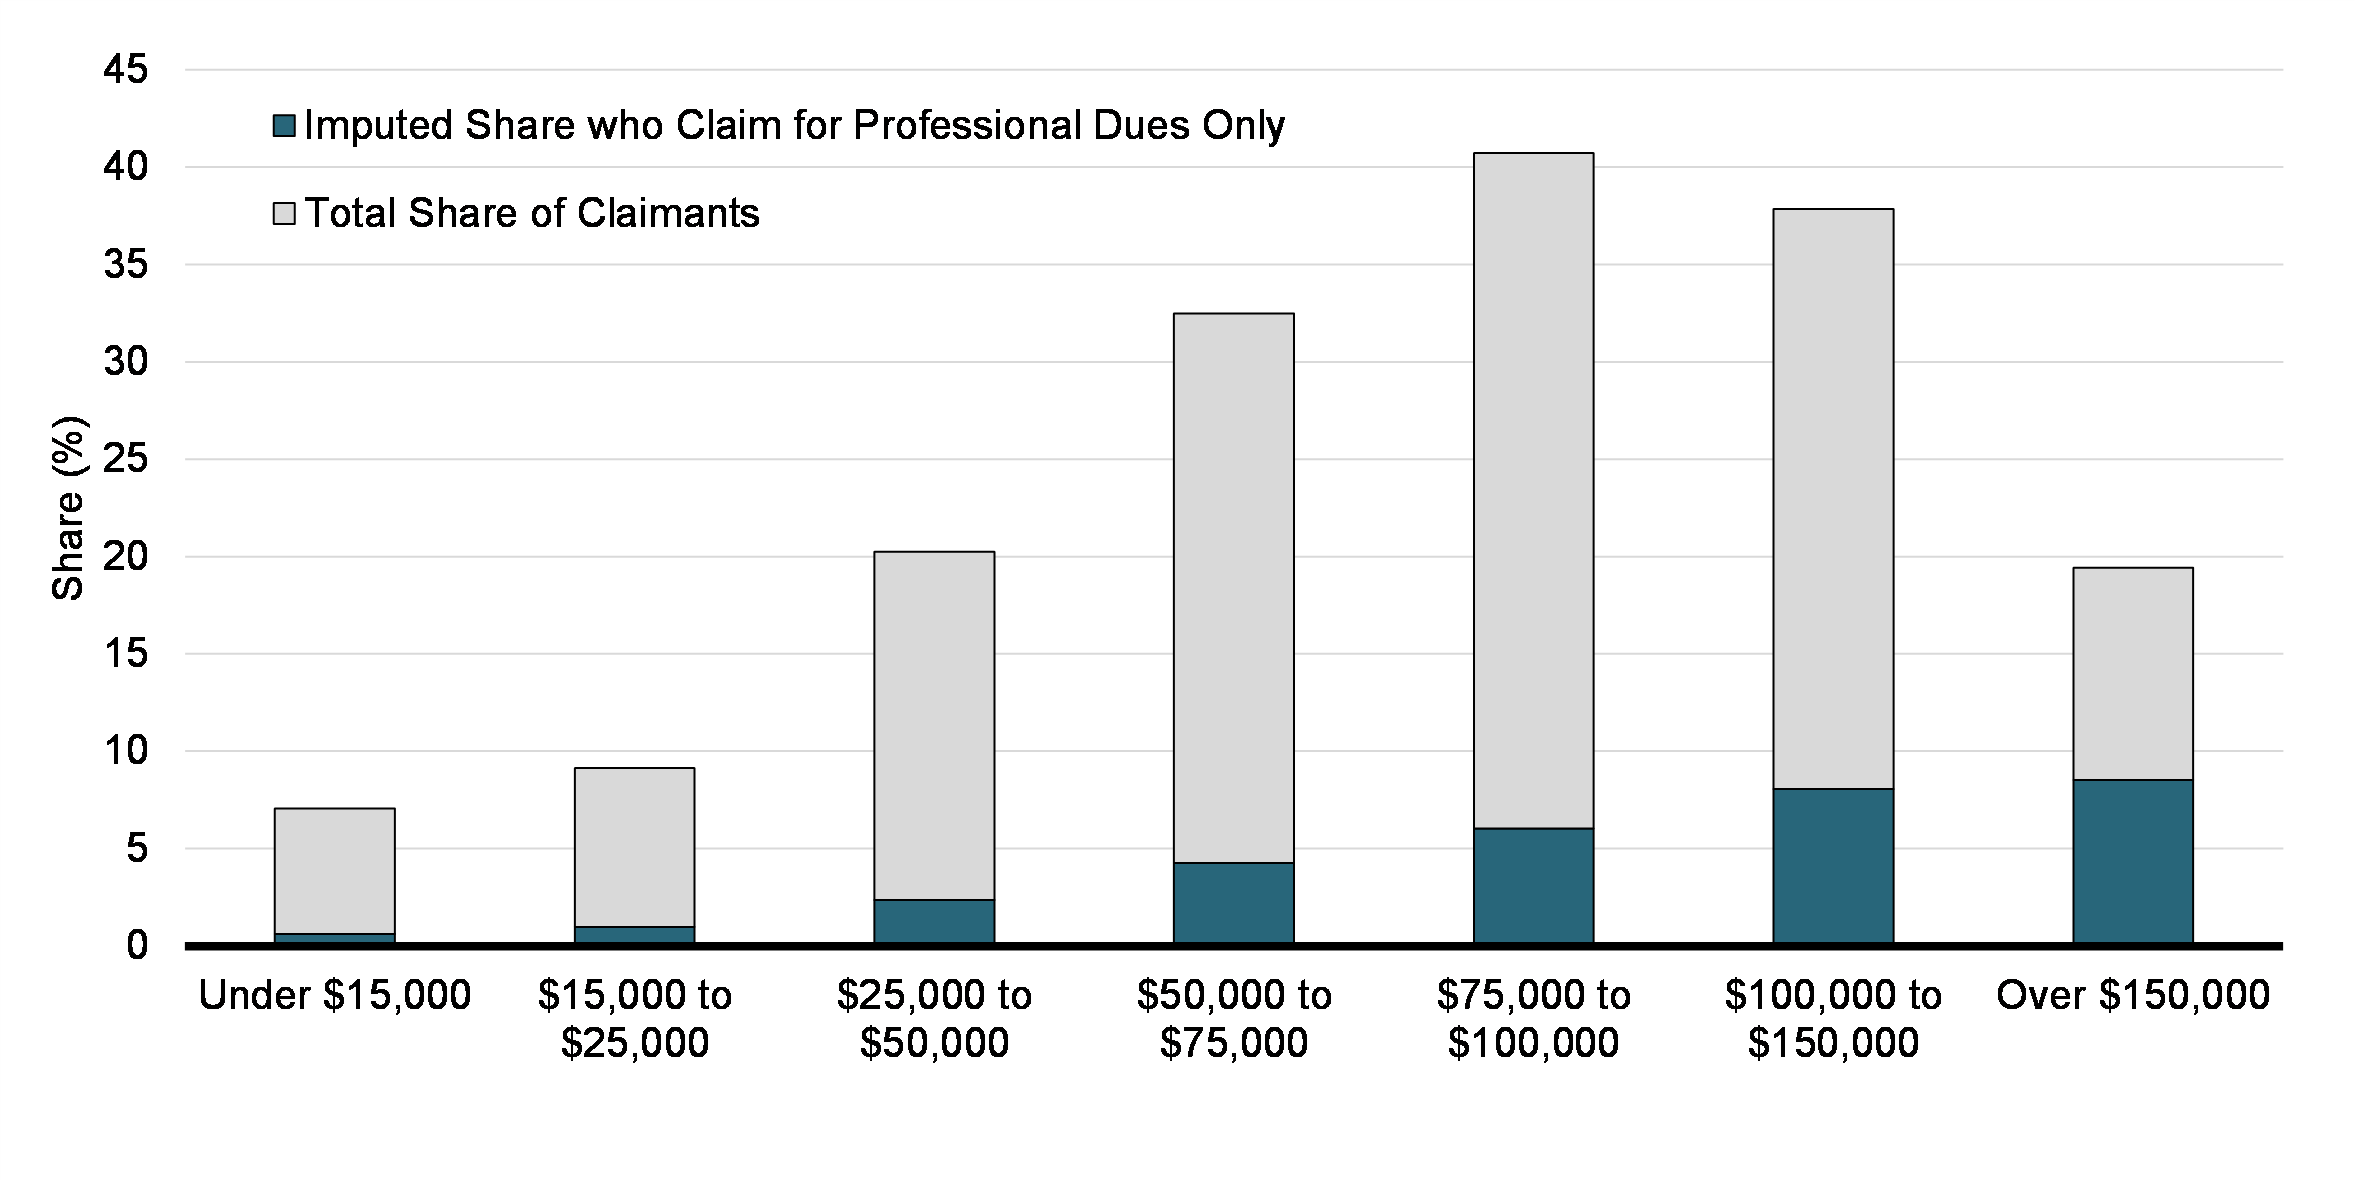
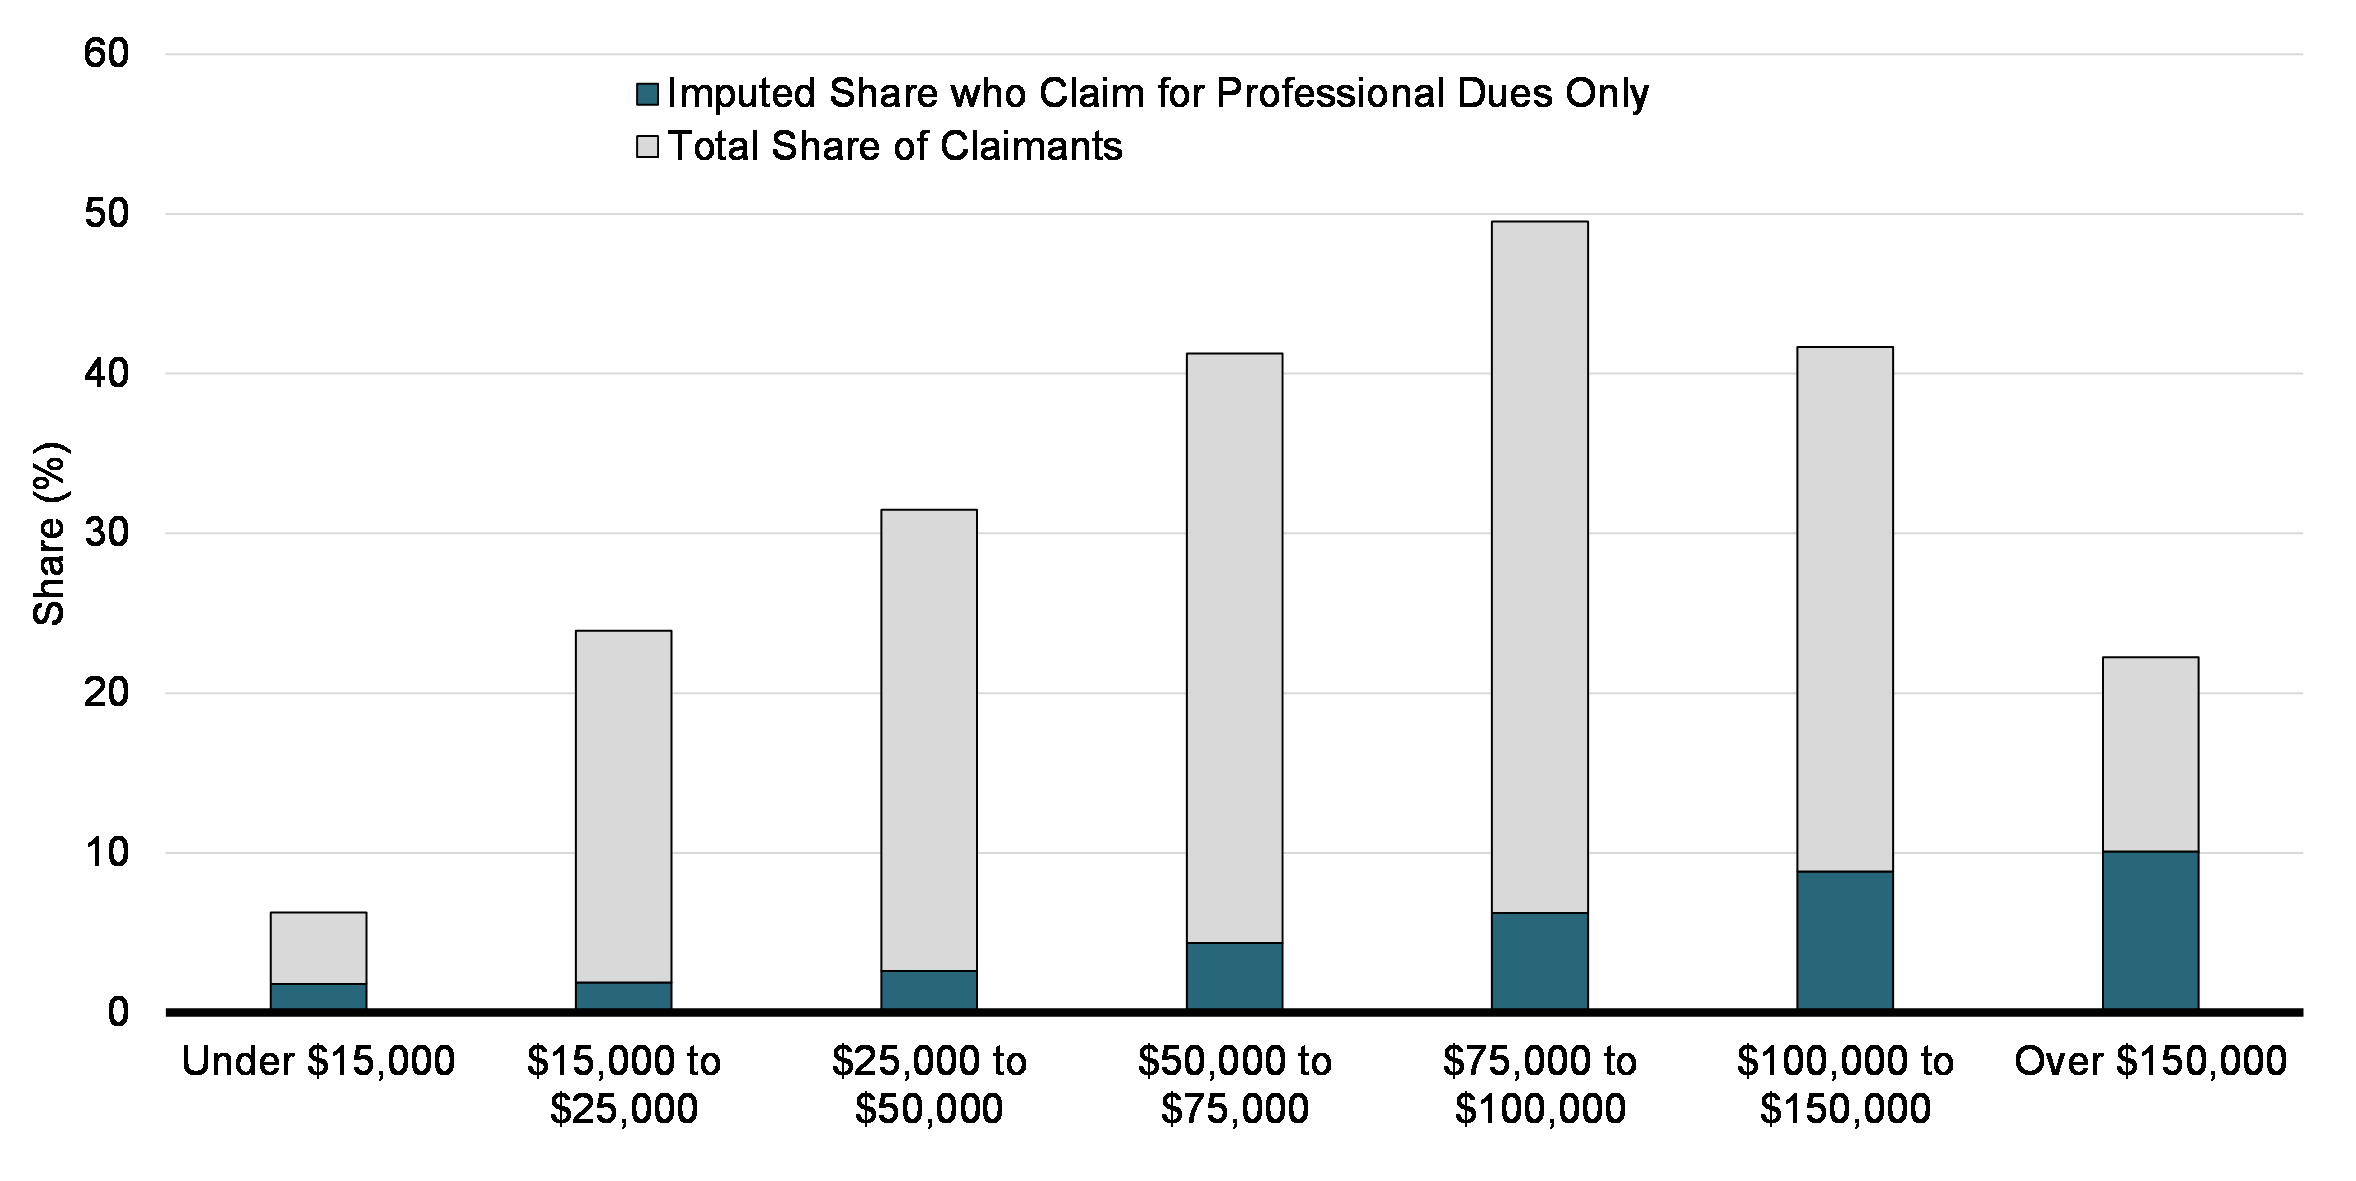
High-income claimants of the UPD deduction are much more likely to be claimants of professional dues only. In fact, in 2019, 45.3% of claimants with earnings of $150,000 and above were claiming solely for professional dues, as well as 43.9% of claimants with total income above $150,000. Taxfilers with incomes at this level may be more likely to be professionals such as doctors, lawyers, or accountants who have high incomes and for whom professional dues are required to exercise their occupation. Looking at the lower end of the income distribution (Chart 11), there is a lower share of claimants of professional dues only when using total income, but earnings show a different picture (Chart 12). Among claimants with earnings below $15,000, about 28.7% were claimants of professional dues only. This observation may reflect the fact that some taxfilers in the category of claimants of professional dues only have low earnings but large incomes from, for example, dividends and capital gains. In fact, many high-income professionals such as doctors and lawyers (who would deduct professional fees) may establish small-business corporations and declare their earnings as business income instead of personal income.
Share of UPD Claimants among Taxfilers and Imputed Share of Claimants of Professional Dues Only among Claimants, by Income Group (2019)
Share of UPD Claimants among Taxfilers and Imputed Share of Claimants of Professional Dues Only among Claimants, by Earnings Group (2019)
4.3 Comparison of Claimants and Non-Claimants
Number of Jobs Worked
We start by analyzing whether those who claim the UPD deduction are working at more or fewer jobs than non-claimants.Footnote 11 Workers who claim the UPD deduction tend to work a larger number of jobs than those who do not claim that deduction (Chart 13). In 2019, claimants worked on average 1.5 jobs (counting a single T4 received as one job), while non-claimant employees (i.e., all other taxfilers that receive at least one T4) worked 1.4 jobs on average.
Average Number of Jobs Worked by UPD Claimants and Non-Claimants, by Gender and Age (2019)
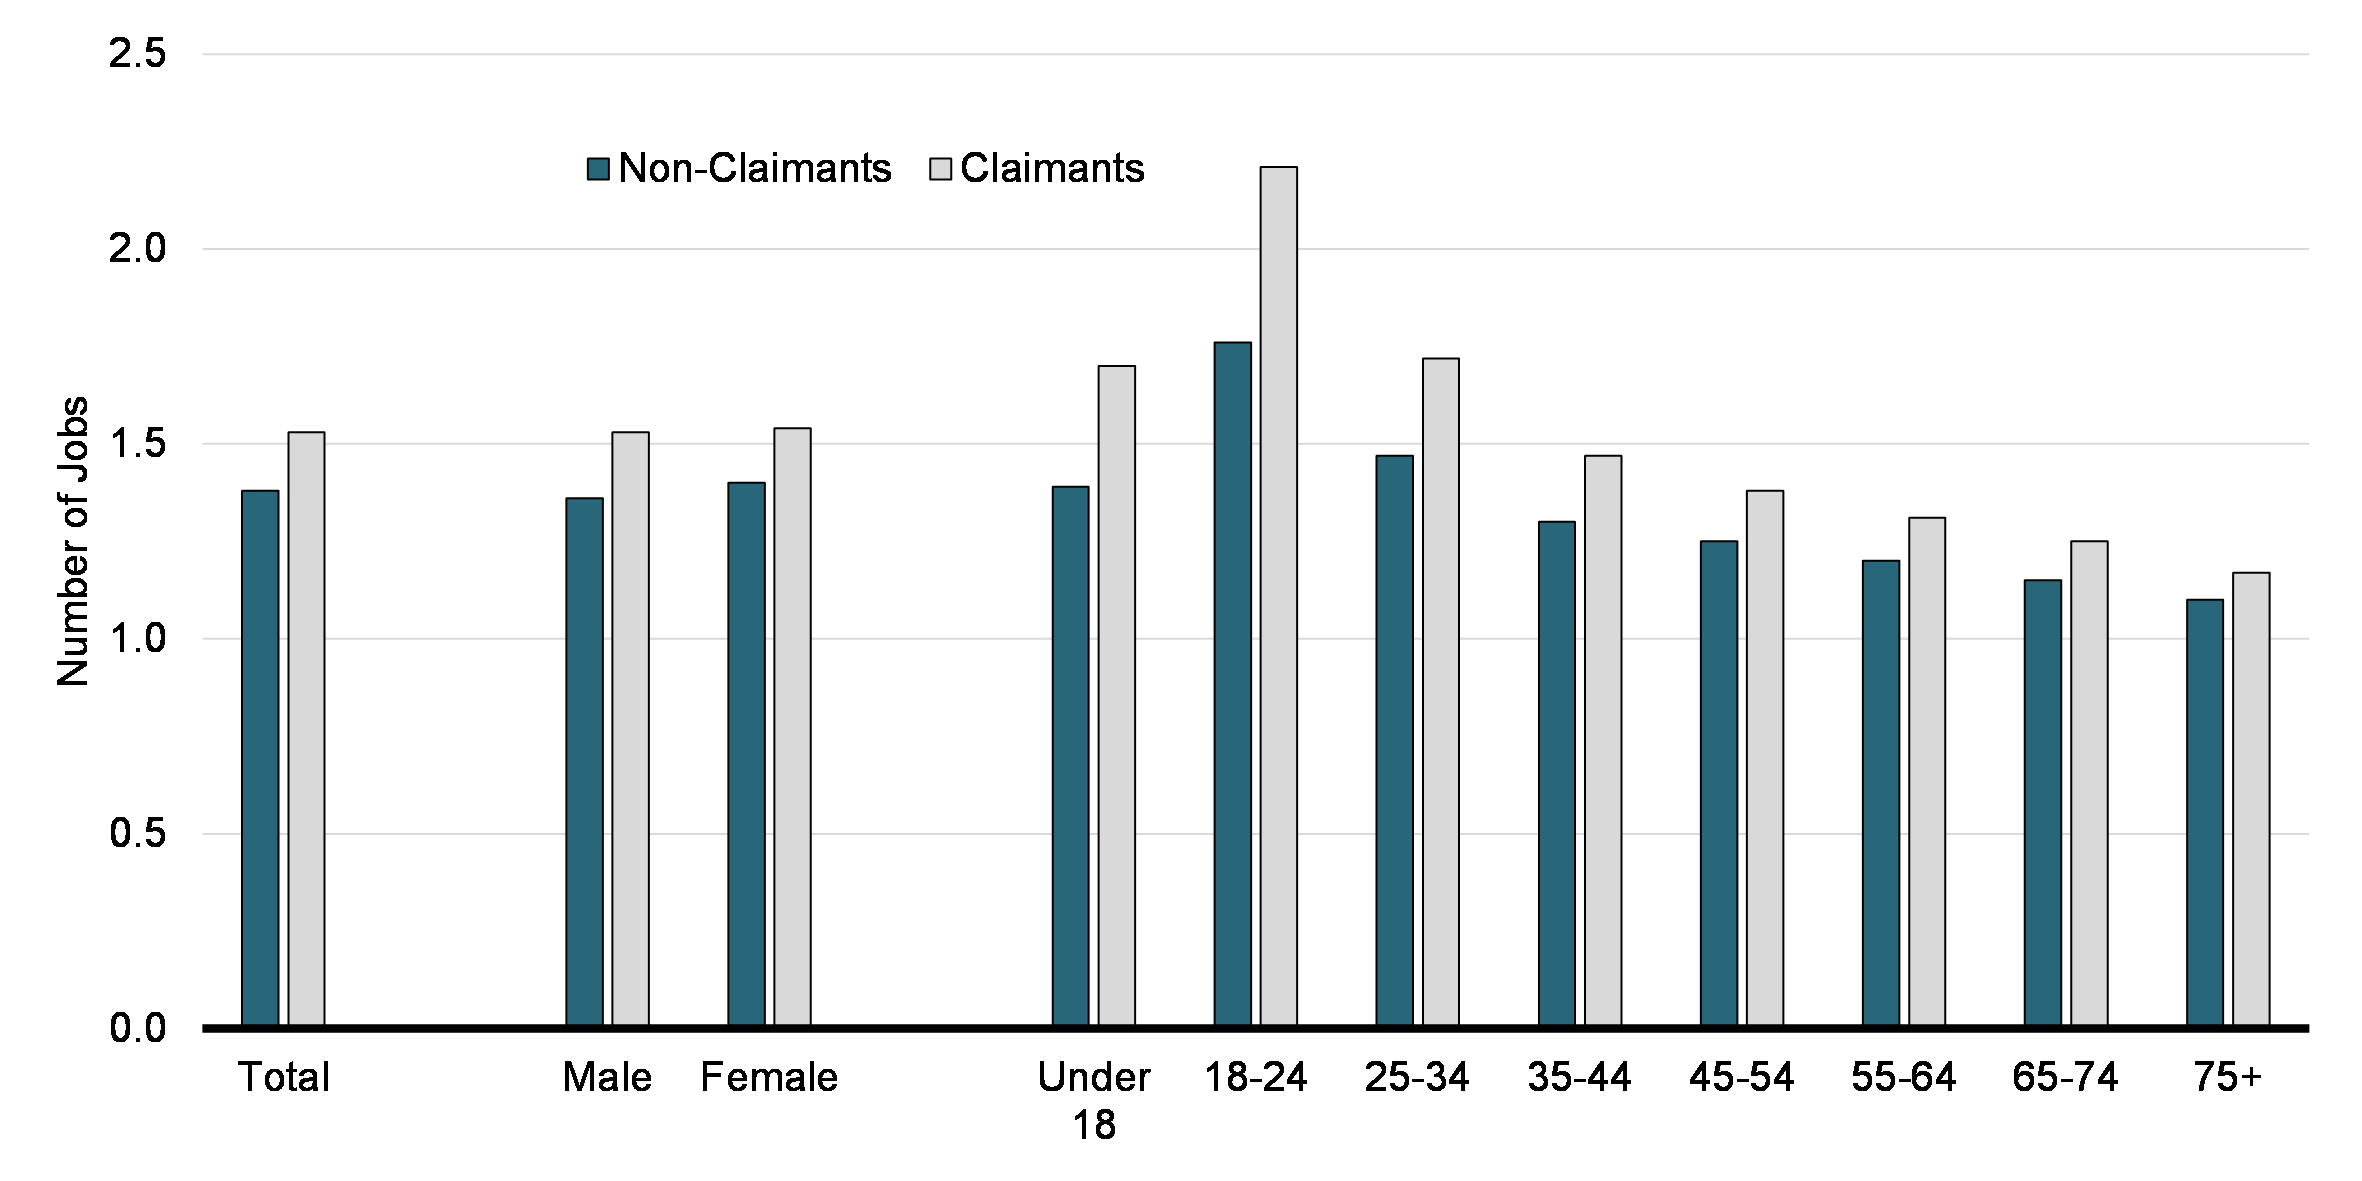
We find no difference in the average number of jobs worked between men and women. Looking at age groups, we find that younger workers tend to work more jobs on average. In addition, there is a larger difference between claimants and non-claimants in the younger group. For example, UPD claimants between the ages of 18 and 24 have over two jobs on average, while non-claimants have about 1.8 jobs on average.
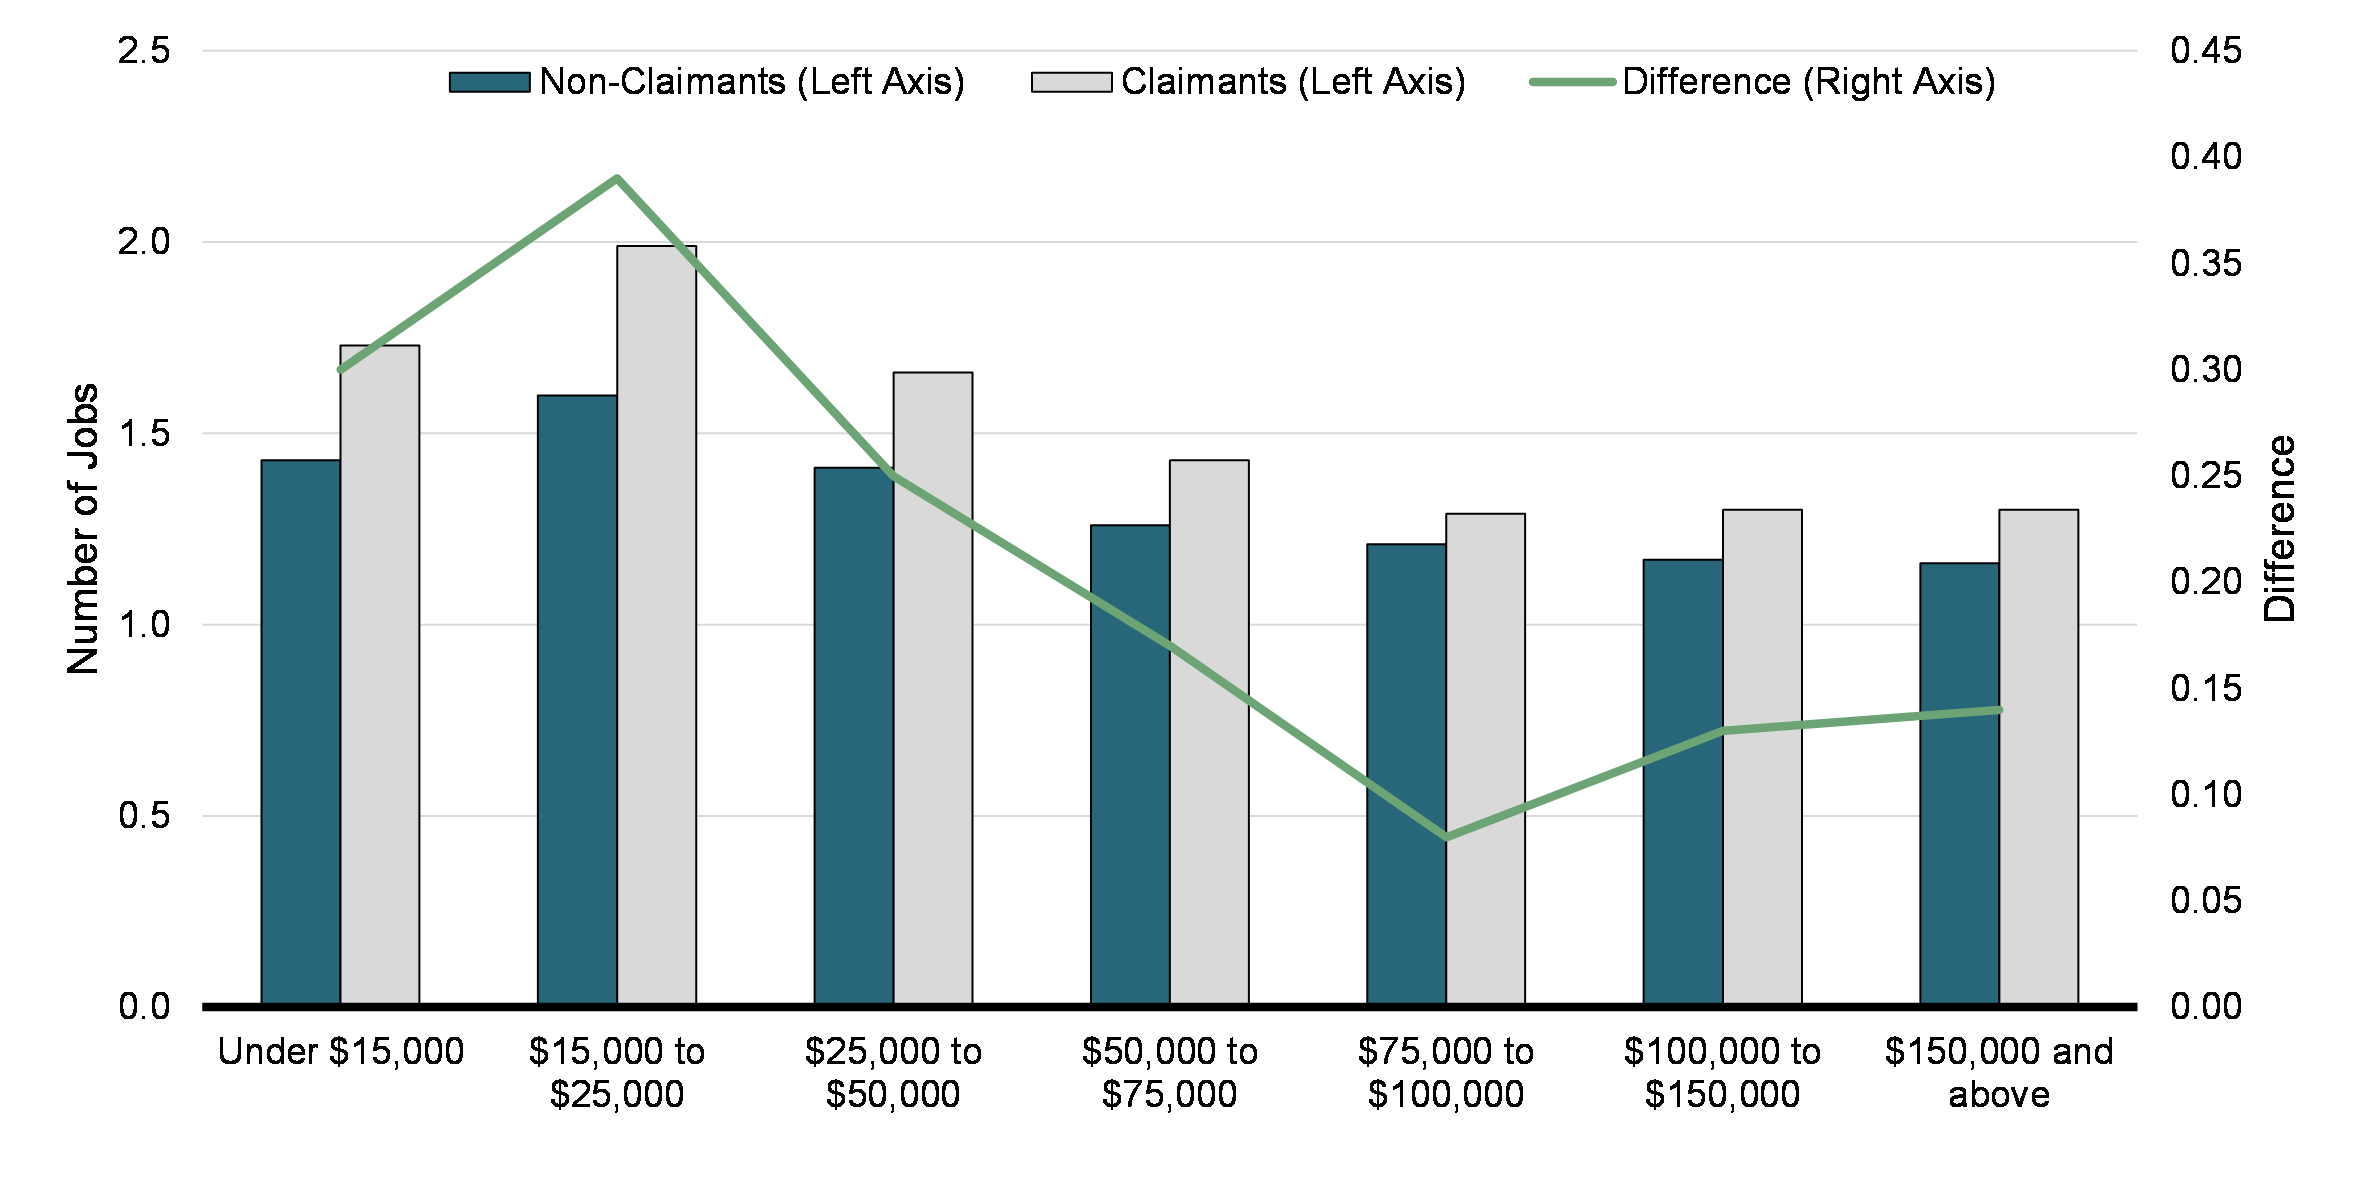
While the number of jobs worked differs between industries, we do not find interesting patterns when comparing UPD claimants and non-claimants. However, we do find a pattern looking at the number of jobs worked by earnings category. In particular, we first find that higher-earning taxfilers work fewer jobs on average. In addition, among higher-earning individuals, there are smaller differences between claimants and non-claimants (Chart 14).
Average Number of Jobs by Earnings Group, for UPD Claimants and Non-Claimants (2019)
Average Earnings and Income
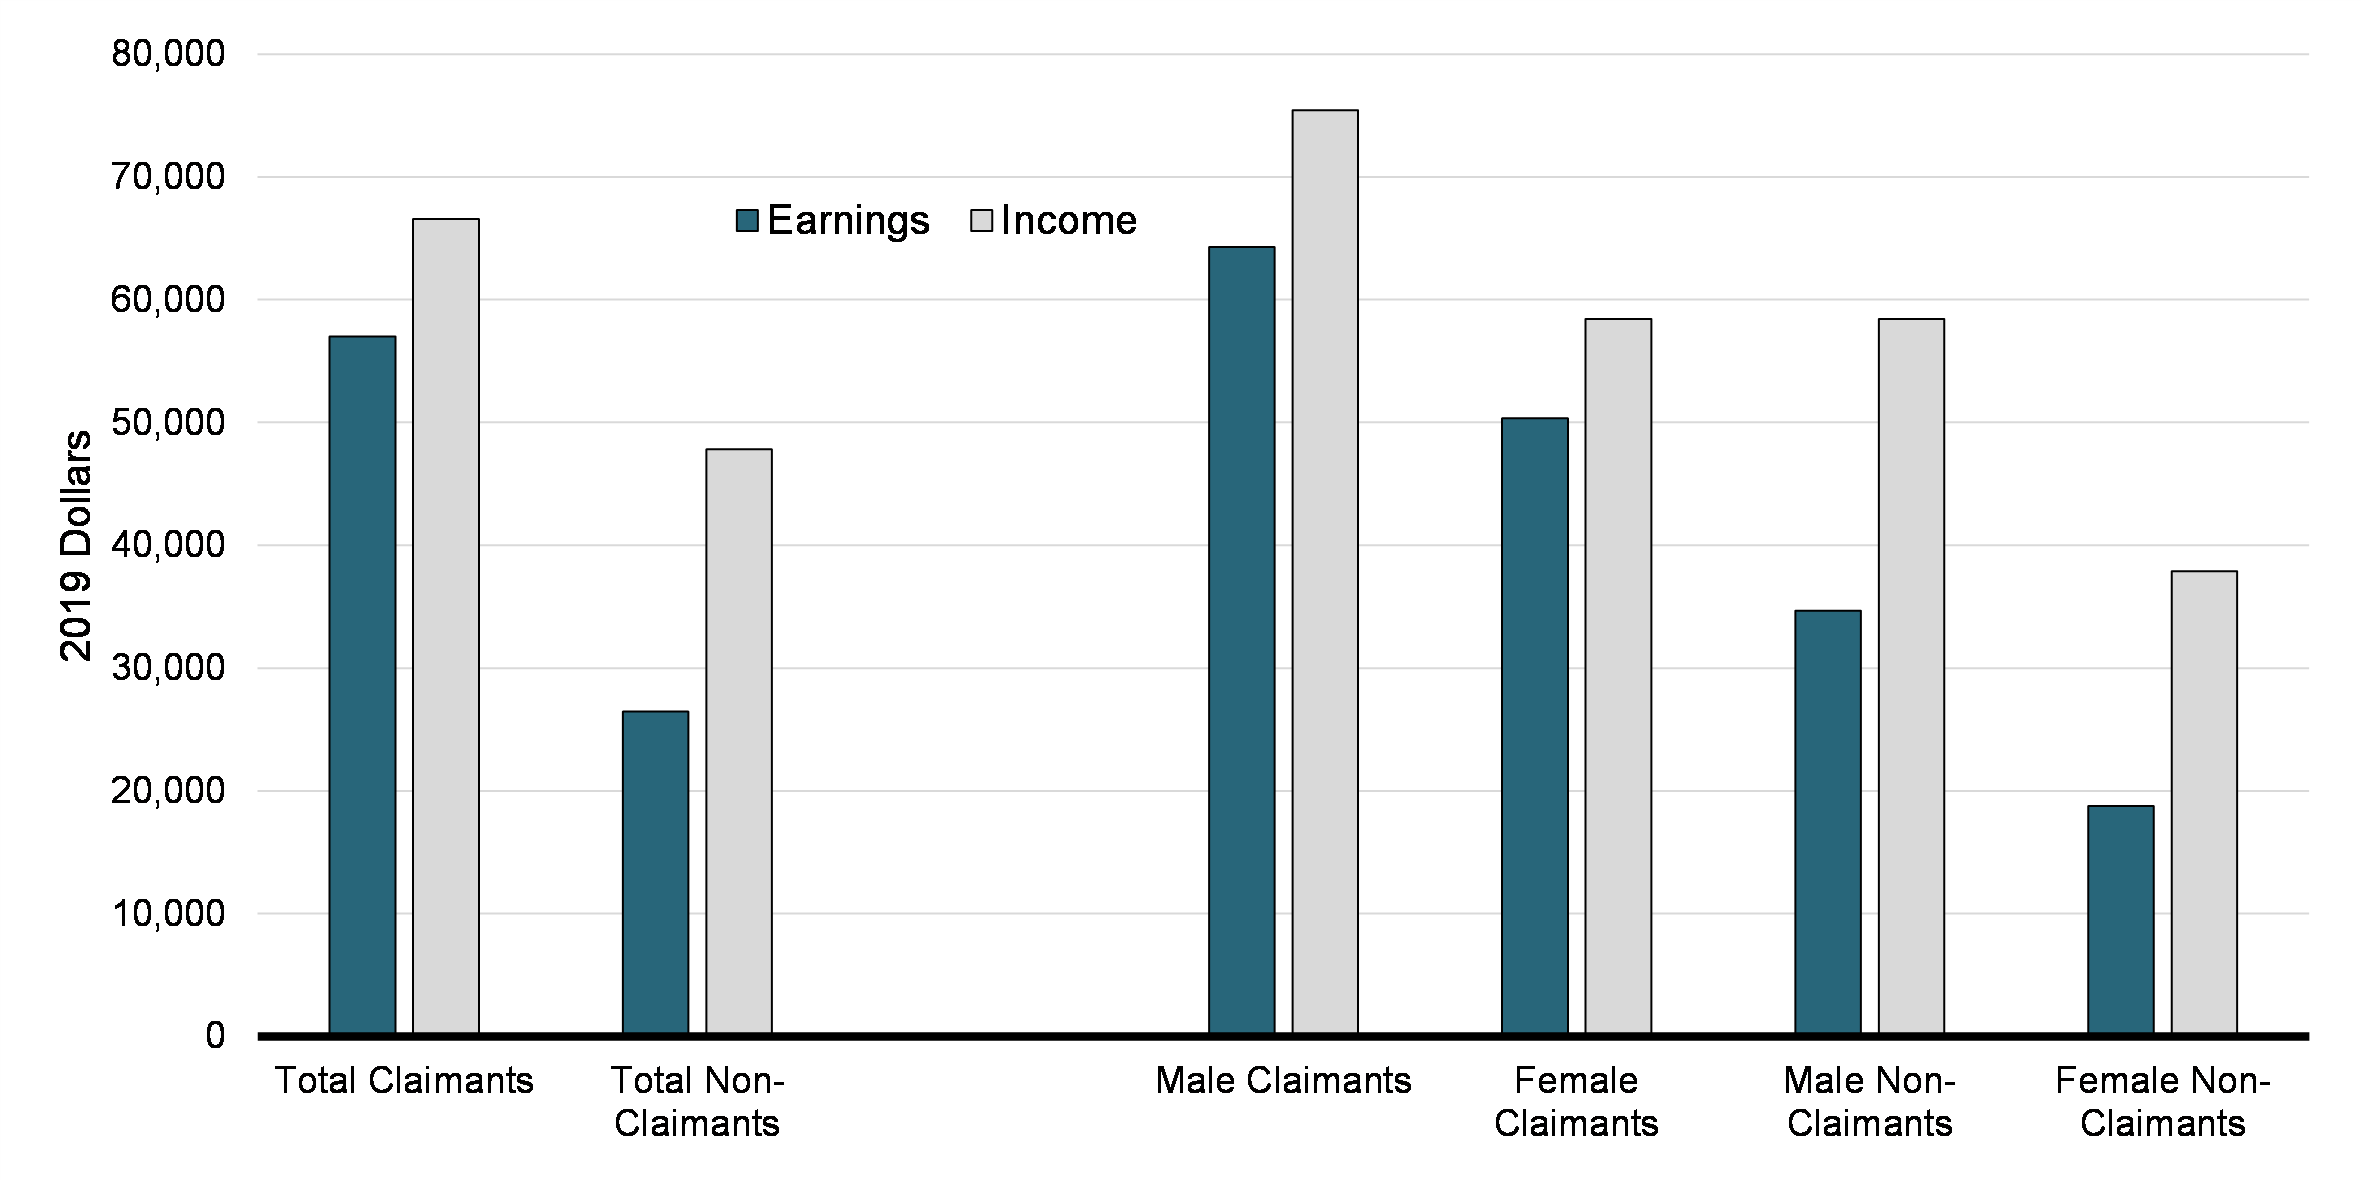
On average, in 2019, taxfilers who claim the UPD have higher earnings and total income than those who do not. In terms of total income, claimants have an average of $66,564 compared to $47,808 for non-claimants. In terms of earnings, claimants have an average of $57,012 compared to $26,464 for non-claimants. Interestingly, the gap between the two groups is larger when considering earnings only, indicating that among non-claimants, a larger share of their total income comes from sources other than earnings (e.g., government transfers). This pattern is true both for men and women, although income is lower for female taxfilers than for male taxfilers (Chart 15).
Average Earnings and Income, by UPD Claimant Status and Gender (2019)
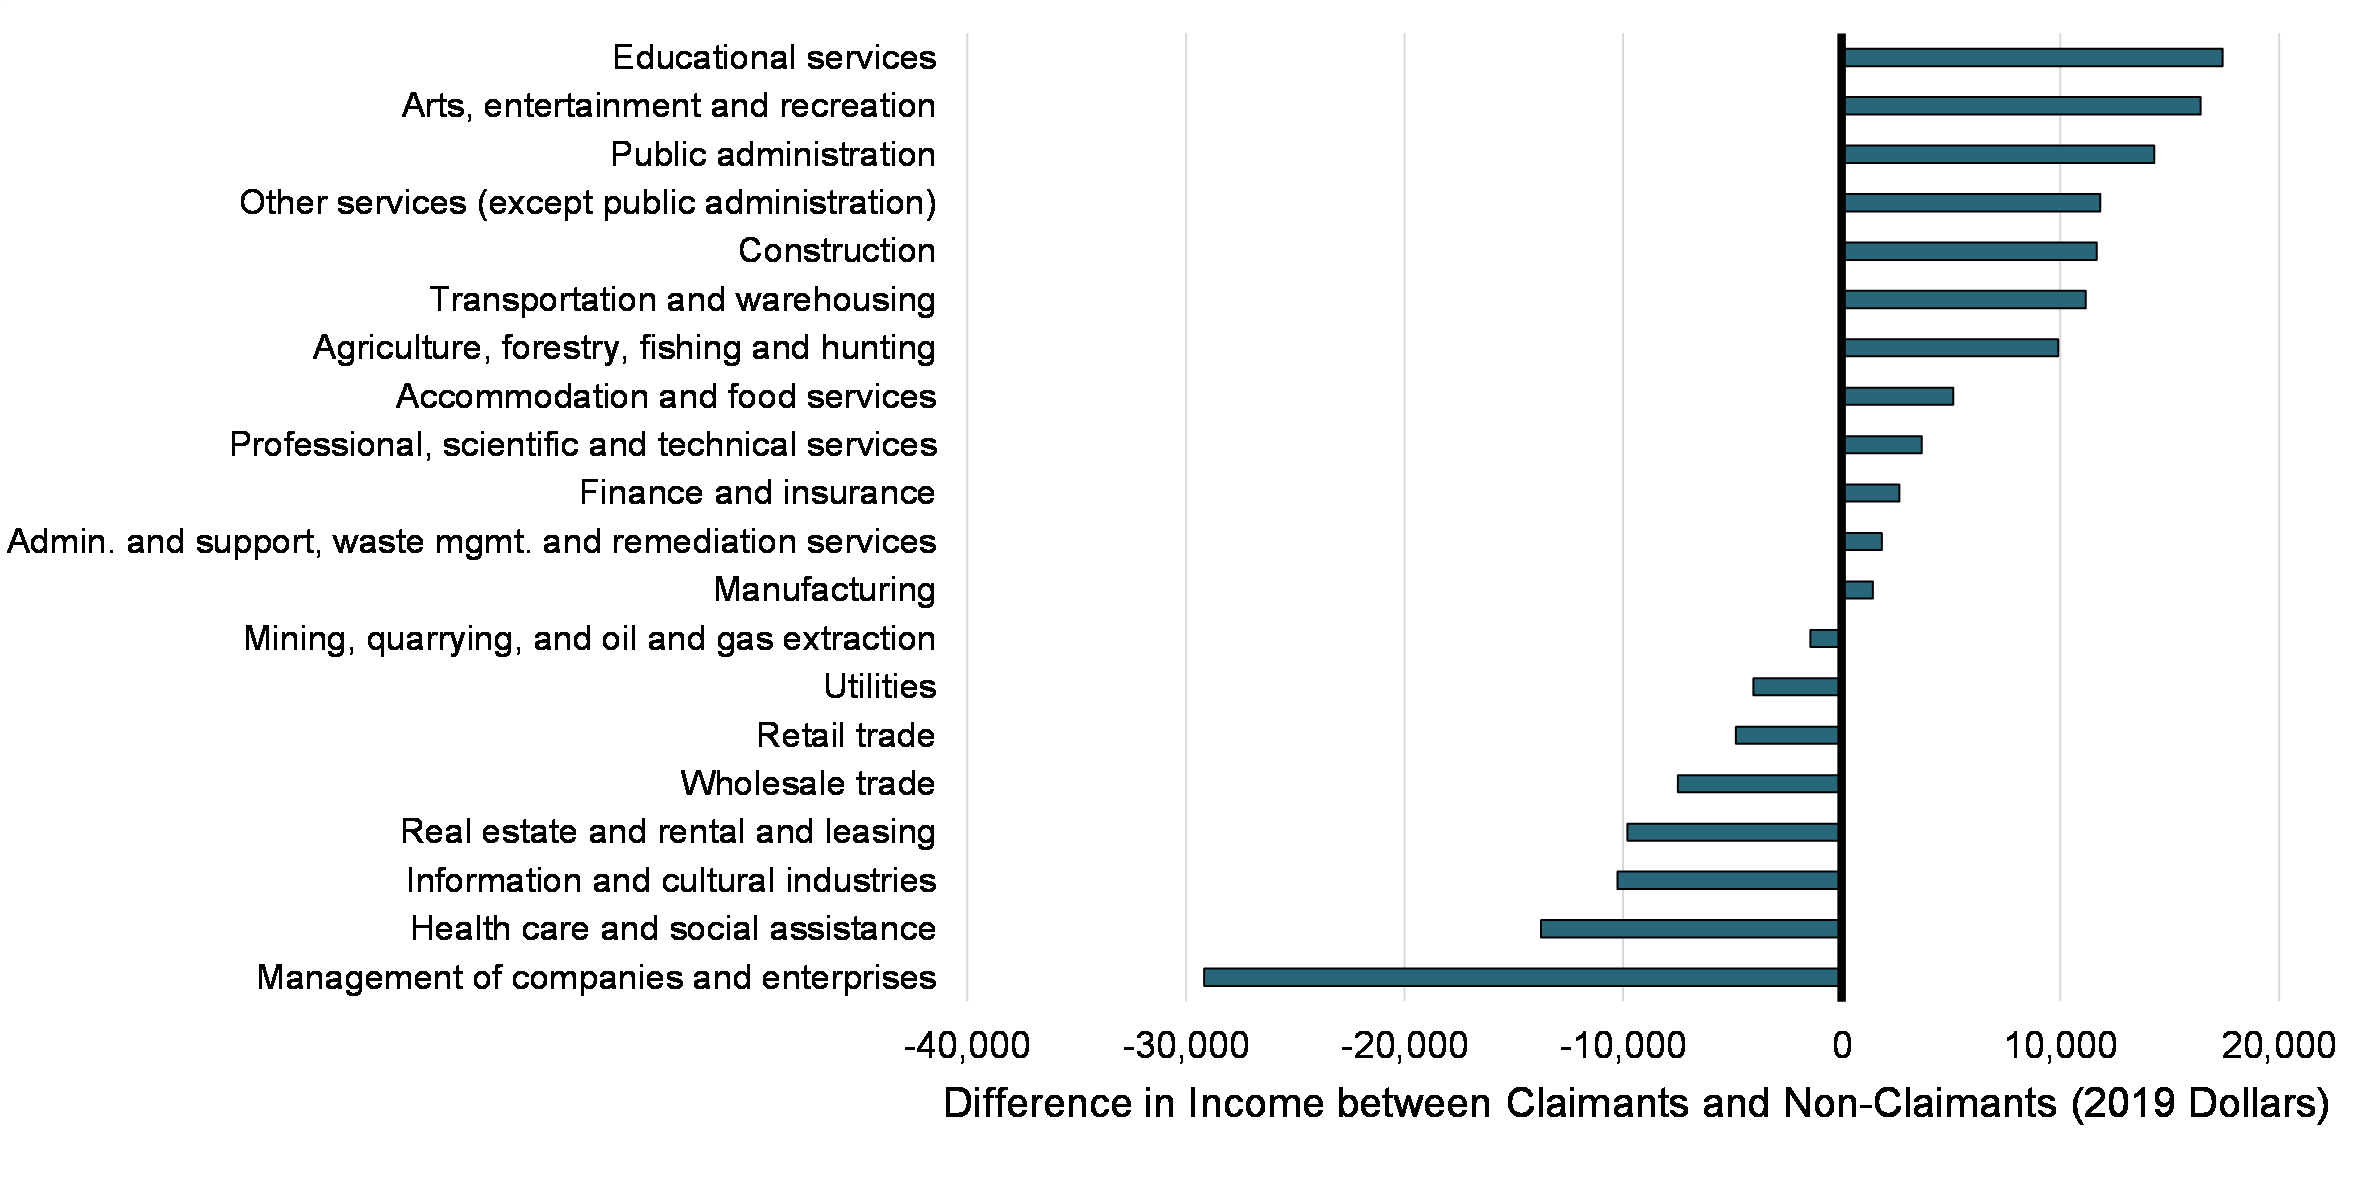
Similarly, we also find that both earnings and income are higher among claimants than non-claimants across age groups. It is also true in most industries, but the opposite is true in a large number of them. As shown in Chart 16, the largest difference is in the management of companies and enterprises sector. Non-claimants also have higher incomes than claimants in health care and social assistance, information and cultural industries, real estate and rental and leasing, both wholesale and retail trade, utilities, and in the mining, quarrying, and oil and gas extraction sector. The reason for the difference between industries is unclear and might differ for individual industries.
Difference in Average Incomes between UPD Claimants and Non-Claimants, by 2-Digit NAICS Industry (2019)
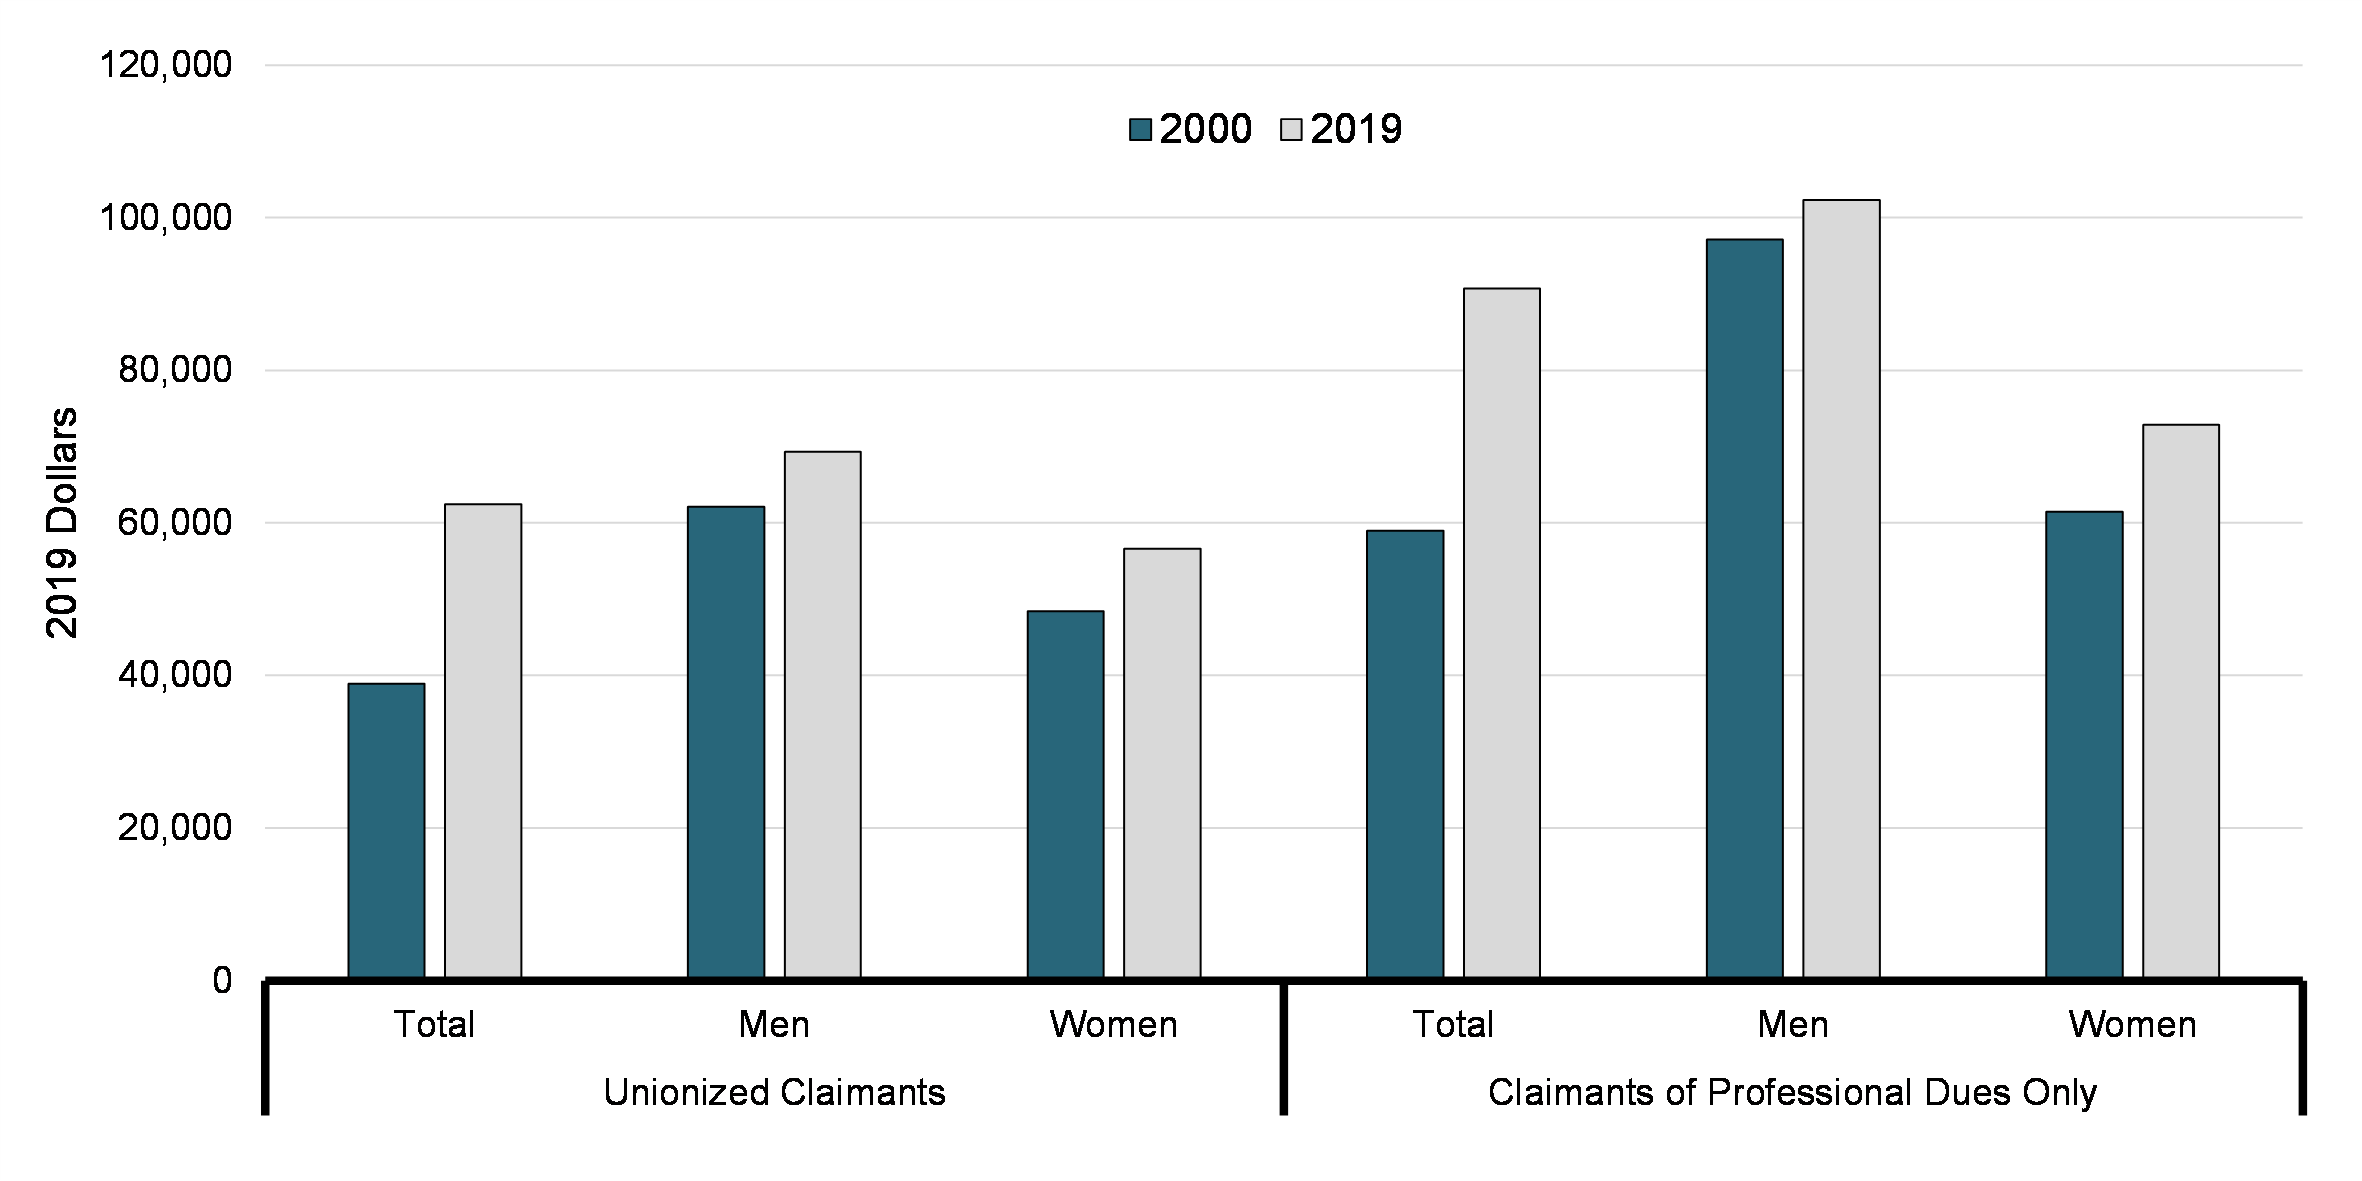
Finally, average total income varies according to the type of claimant. Looking at Chart 17, we see that among UPD claimants, the average income among those who claim solely for professional dues (i.e., that have no union dues reported in T4 slips) is equal to $90,689 in 2019, compared to $62,398 among unionized claimants. The difference is particularly high for male taxfilers, at $102,316 vs. $69,283.
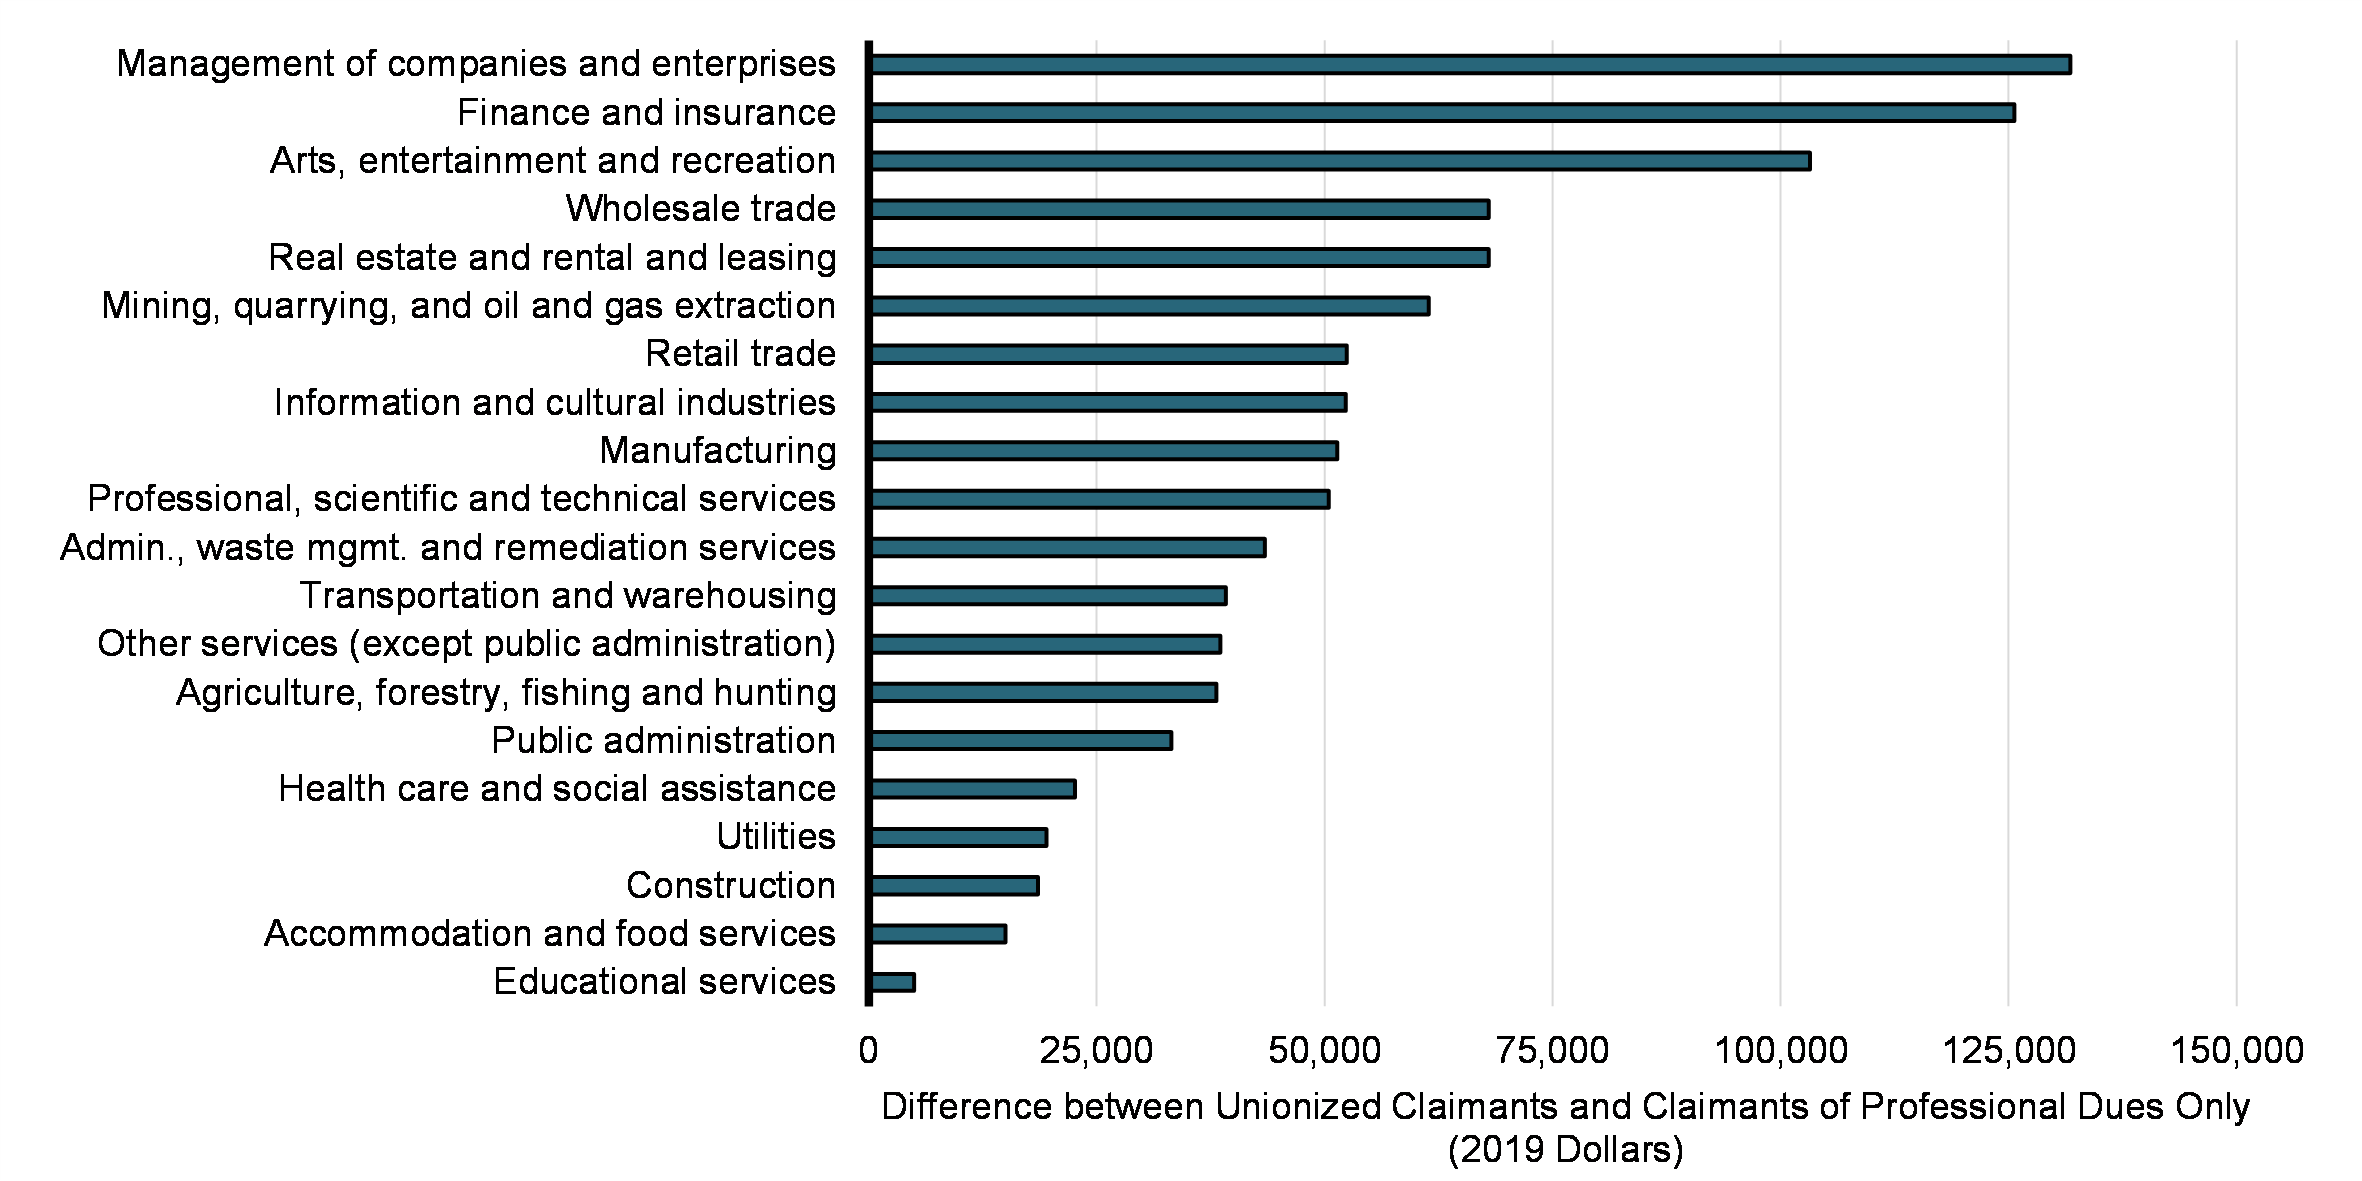
Chart 18 also shows that the difference in average income between the two types of claimants varies by industry. In the management of companies and enterprises as well as finance and insurance sectors, for example, claimants of professional dues only have an average income of more than $125,000 higher than their unionized counterparts. The difference is also relatively large in the arts, entertainment and recreation sector, at above $100,000. By contrast, unionized claimants and claimants of professional dues only in the educational services sector have similar total incomes.
Average Total Income by Gender and Claimant Type (2000 and 2019), in 2019 Dollars
Difference in Average Incomes between Unionized Claimants and Claimants of Professional Dues Only, by 2-Digit NAICS Industry (2019),
4.4. Benefits
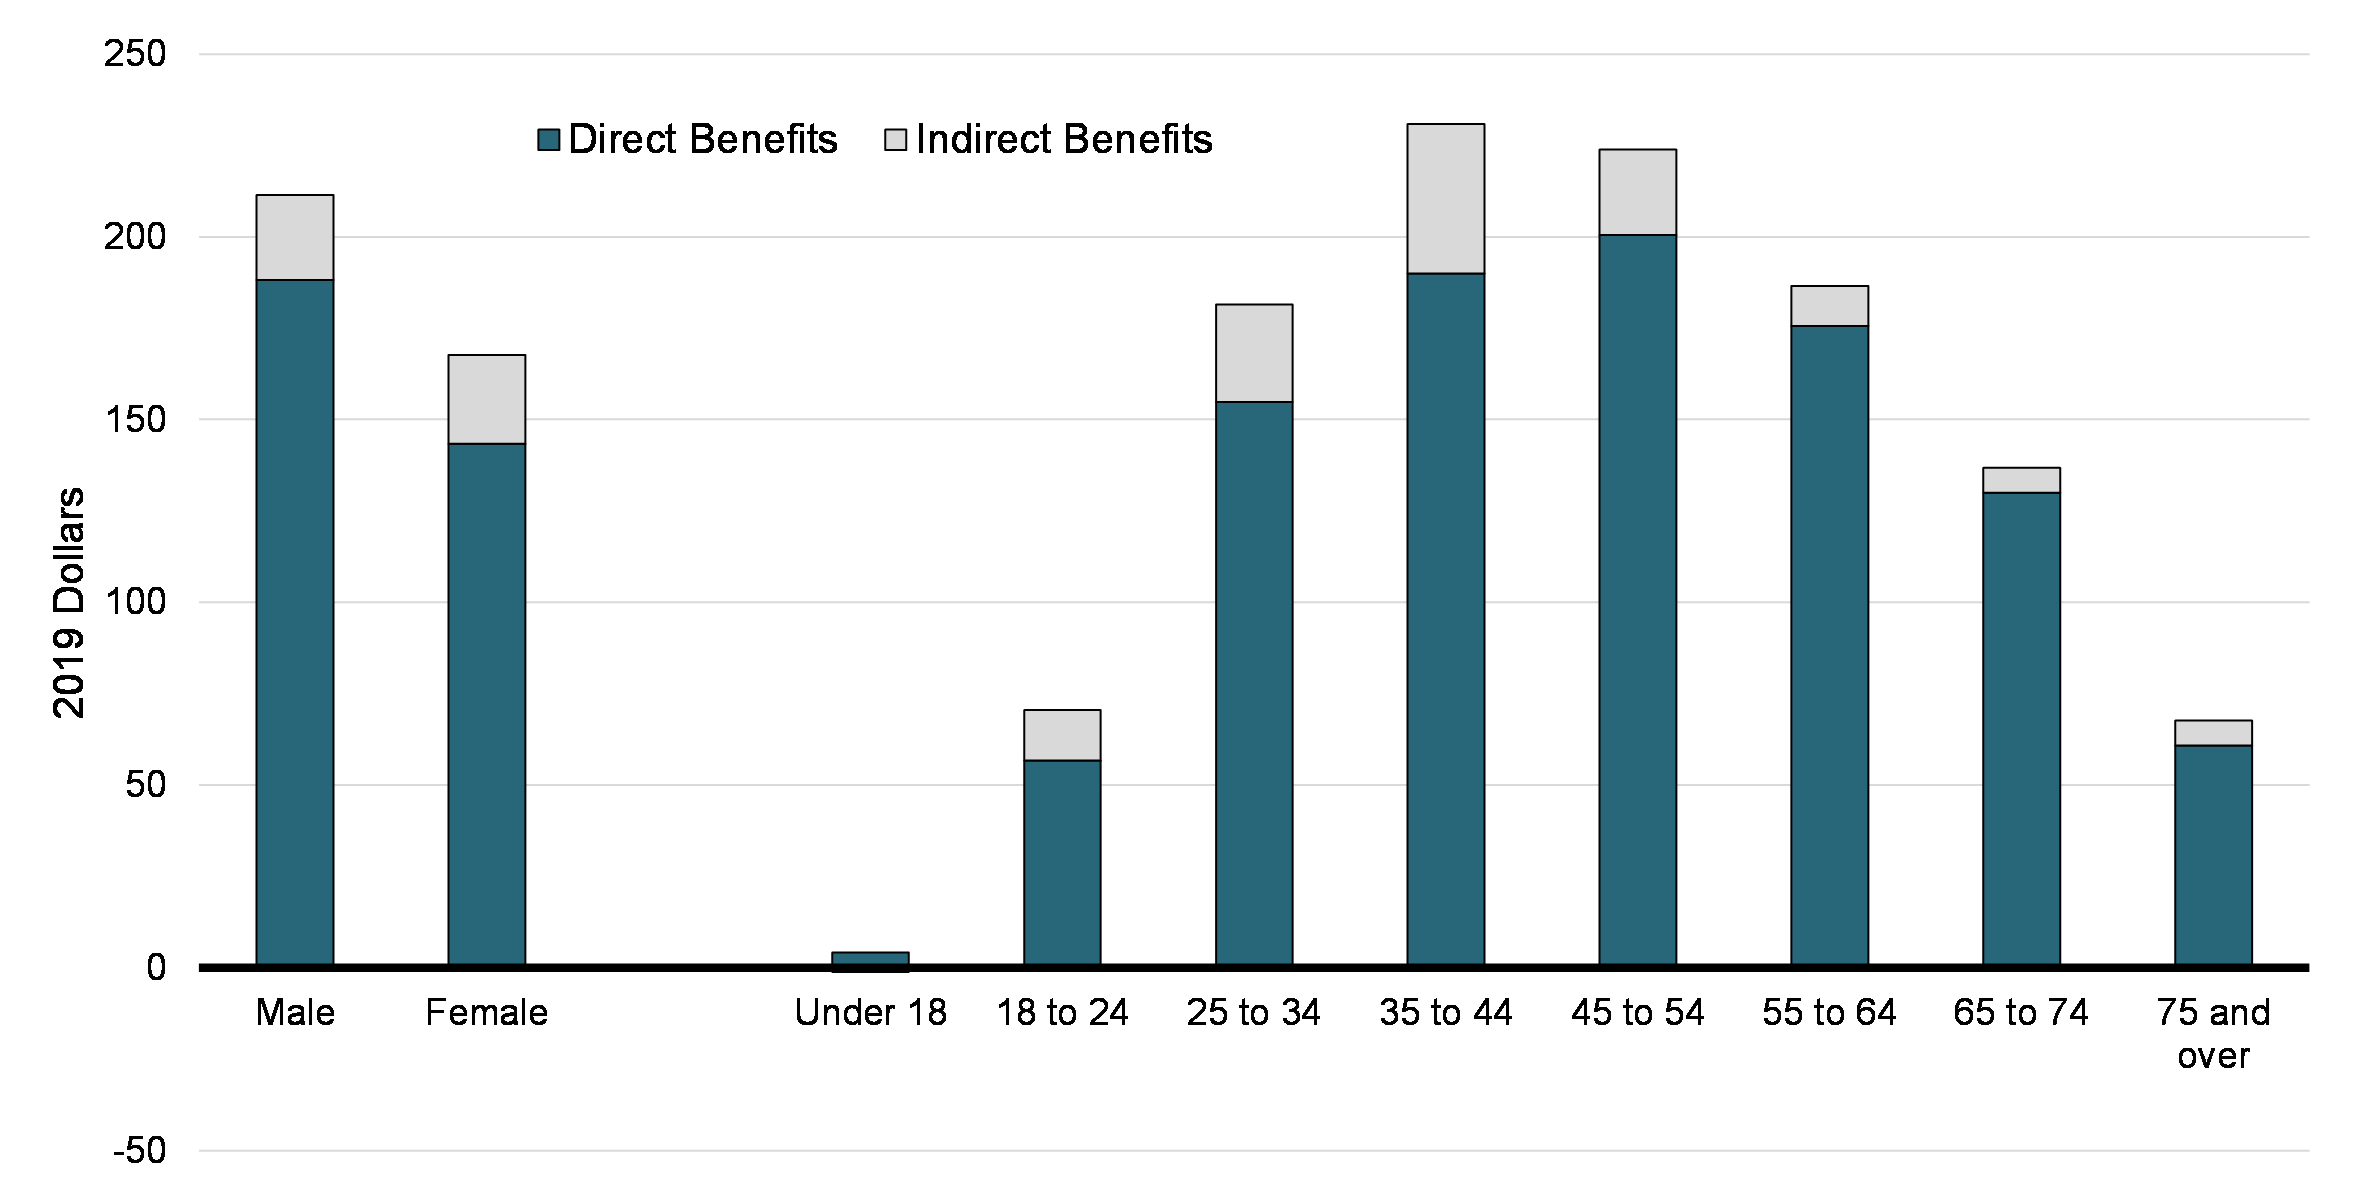
Among beneficiaries of the UPD deduction, average benefits stand at about $185 in 2018 (in 2019 dollars). About 87% of these benefits were direct benefits.Footnote 12 In general, the CCB and the GST credit make up most of the indirect benefits. Looking at beneficiaries by gender, men tend to receive larger benefits than women, which is expected since men claimed larger amounts on average. However, Chart 19 shows that for both genders, direct benefits made up most of the benefits (89% for men and 86% for women).
The age profile of benefits also follows a similar pattern to that found for average claims. In particular, benefits are larger among the population of prime working age (between 25 and 64 years old). The share of indirect benefits varies with age: they represent a larger share of total benefits for beneficiaries aged between 35 and 44 years old, and tend to be smaller for those aged above 55 years old. Part of the explanation is that indirect benefits include the CCB, aimed at parents with children under 18 years old. For example, for individuals aged 35 to 44, the CCB makes up about 85% of indirect benefits.
Direct and Indirect Benefits of UPD Deduction, by Gender and Age Group (2018), in 2019 Dollars
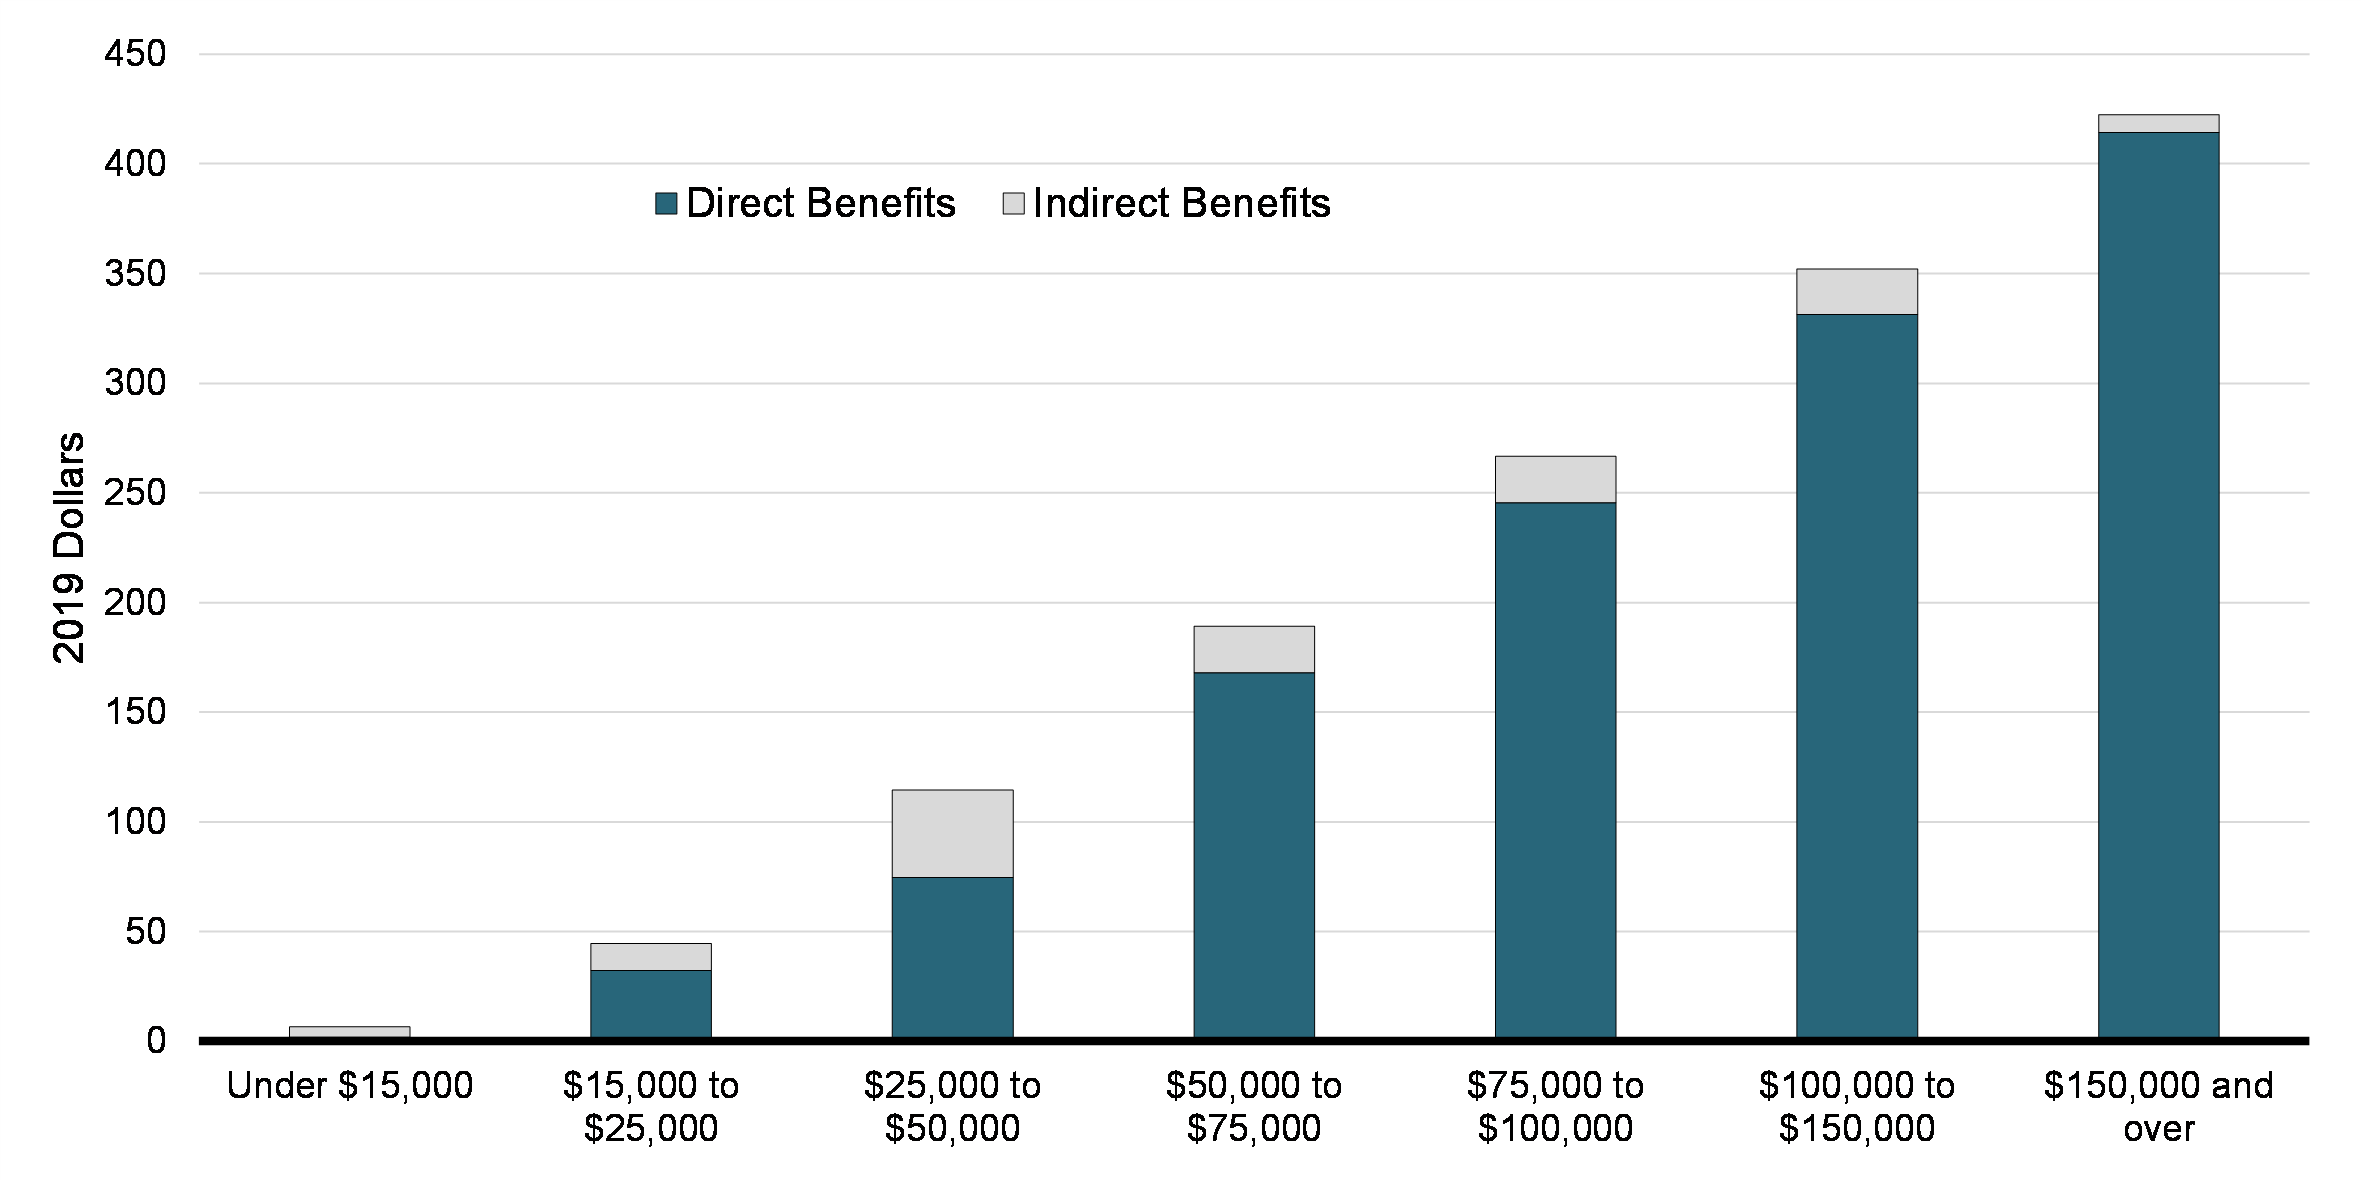
Looking at the distribution of benefits by income group, total benefits are much higher among high-income individuals (Chart 20). However, indirect benefits represent a larger share of total benefits for individuals in the lower income groups. For example, indirect benefits represent about 28% of benefits in the $15,000 to $25,000 group and about 35% in the $25,000 to $50,000 group, compared to only 2% in the $150,000 and above group.
Direct and Indirect Benefits of UPD Deduction, by Income Group (2018), in 2019 Dollars
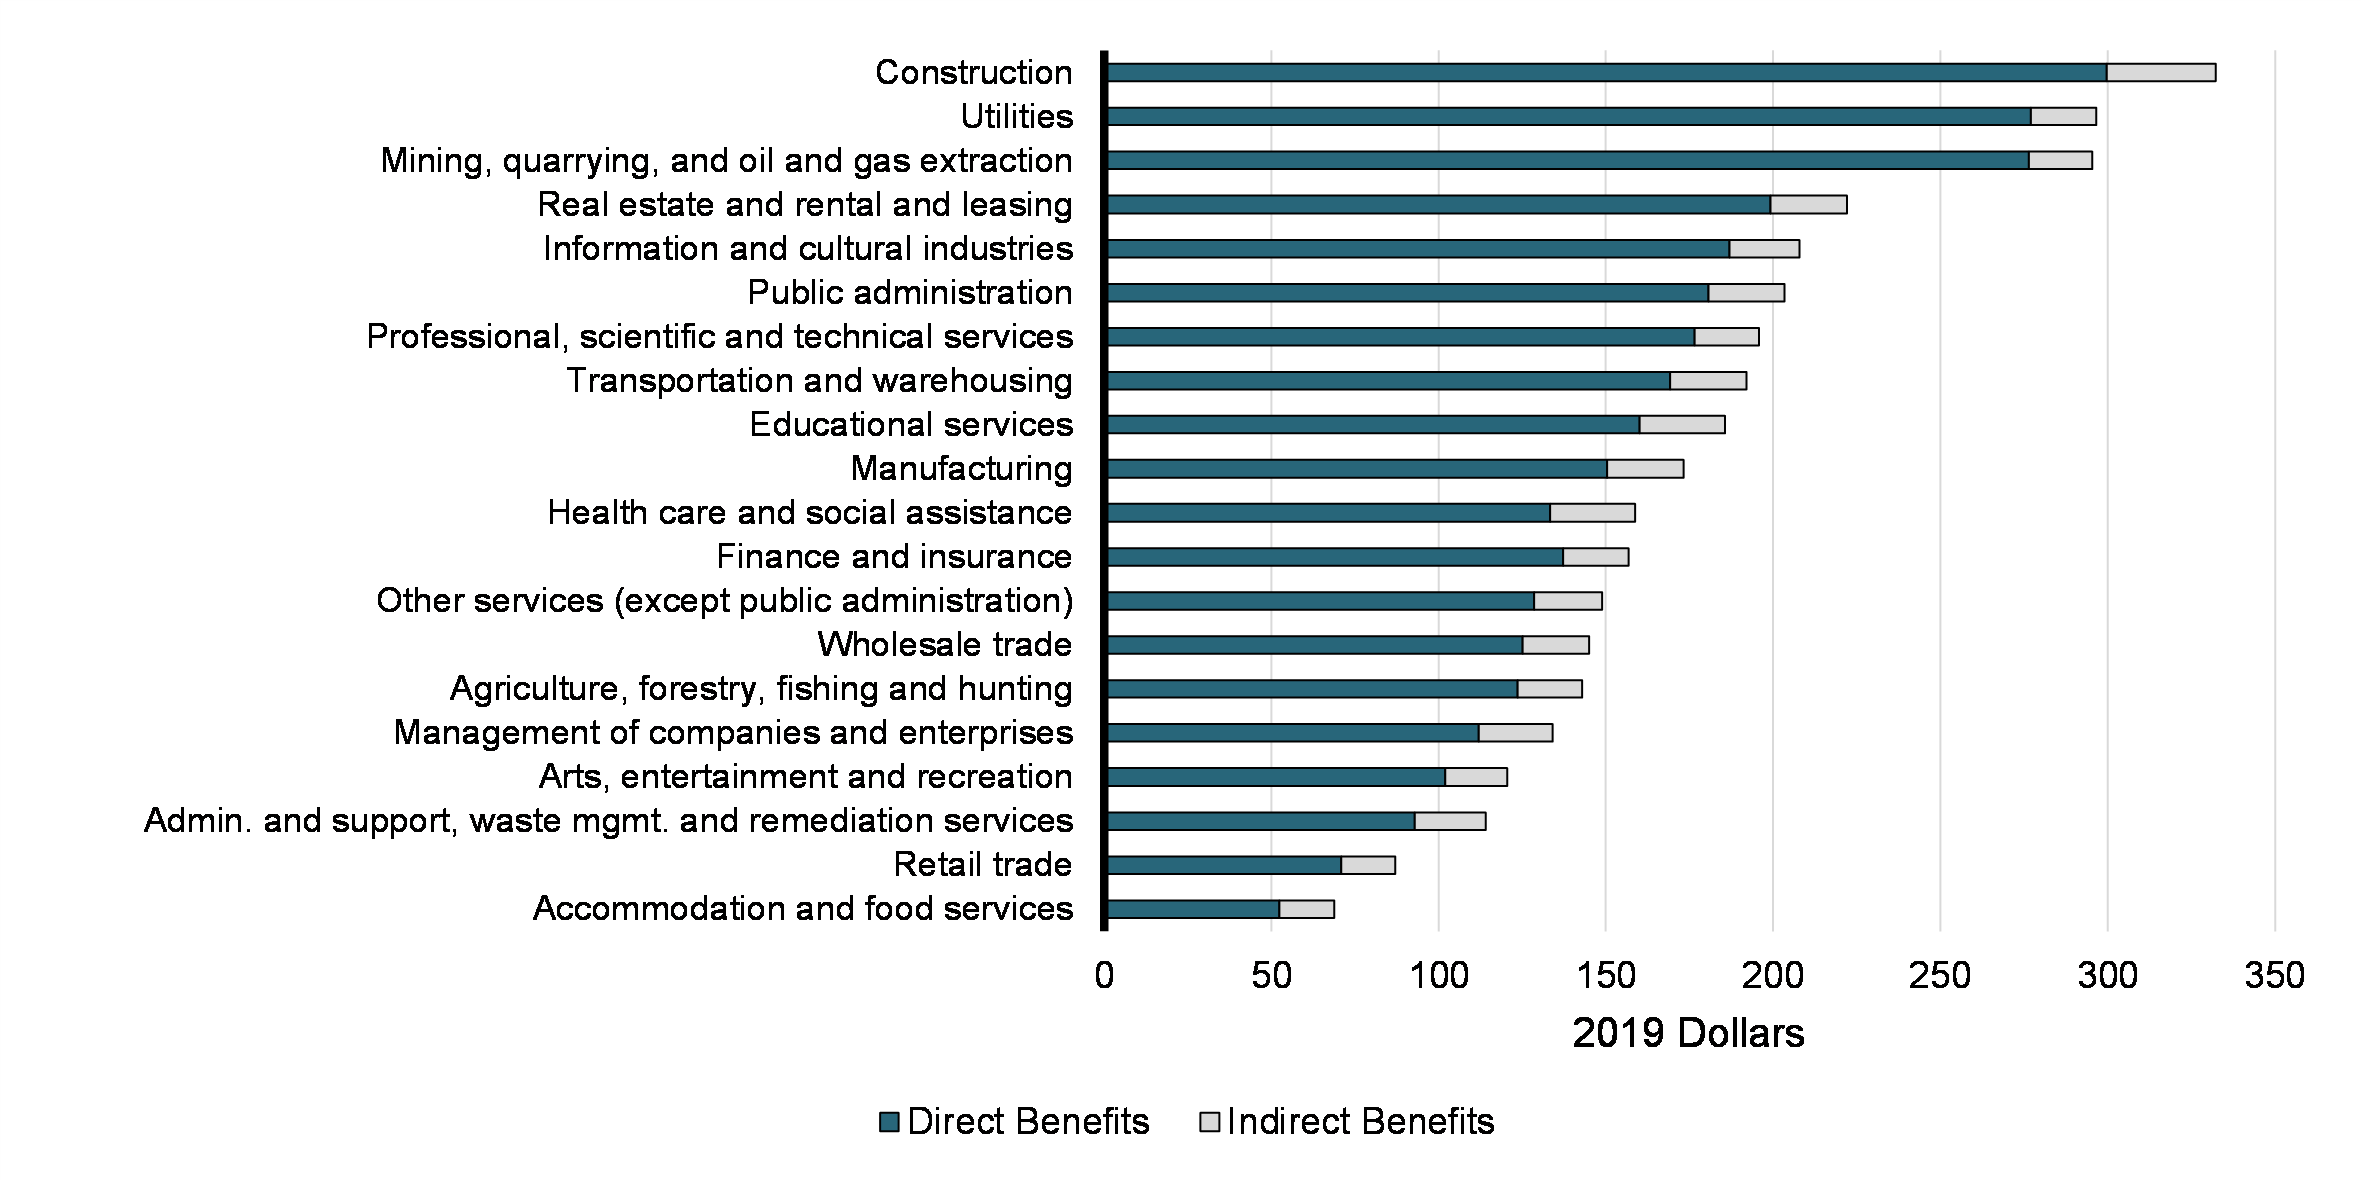
Finally, Chart 21 shows that benefits also vary by industry of occupation. Unsurprisingly, benefits are largest in the construction industry, which also had the largest average claims. Direct benefits represent the majority of benefits in all industries. However, the share of indirect benefits varies between about 6% in the mining, quarrying, and oil and gas extraction sector and 24% in the accommodation and food services sector.
Direct and Indirect Benefits of UPD Deduction, by 2-Digit NAICS Industry (2018), in 2019 Dollars
5. Other Employment Expenses
5.1 Number of Claimants and Amounts Claimed
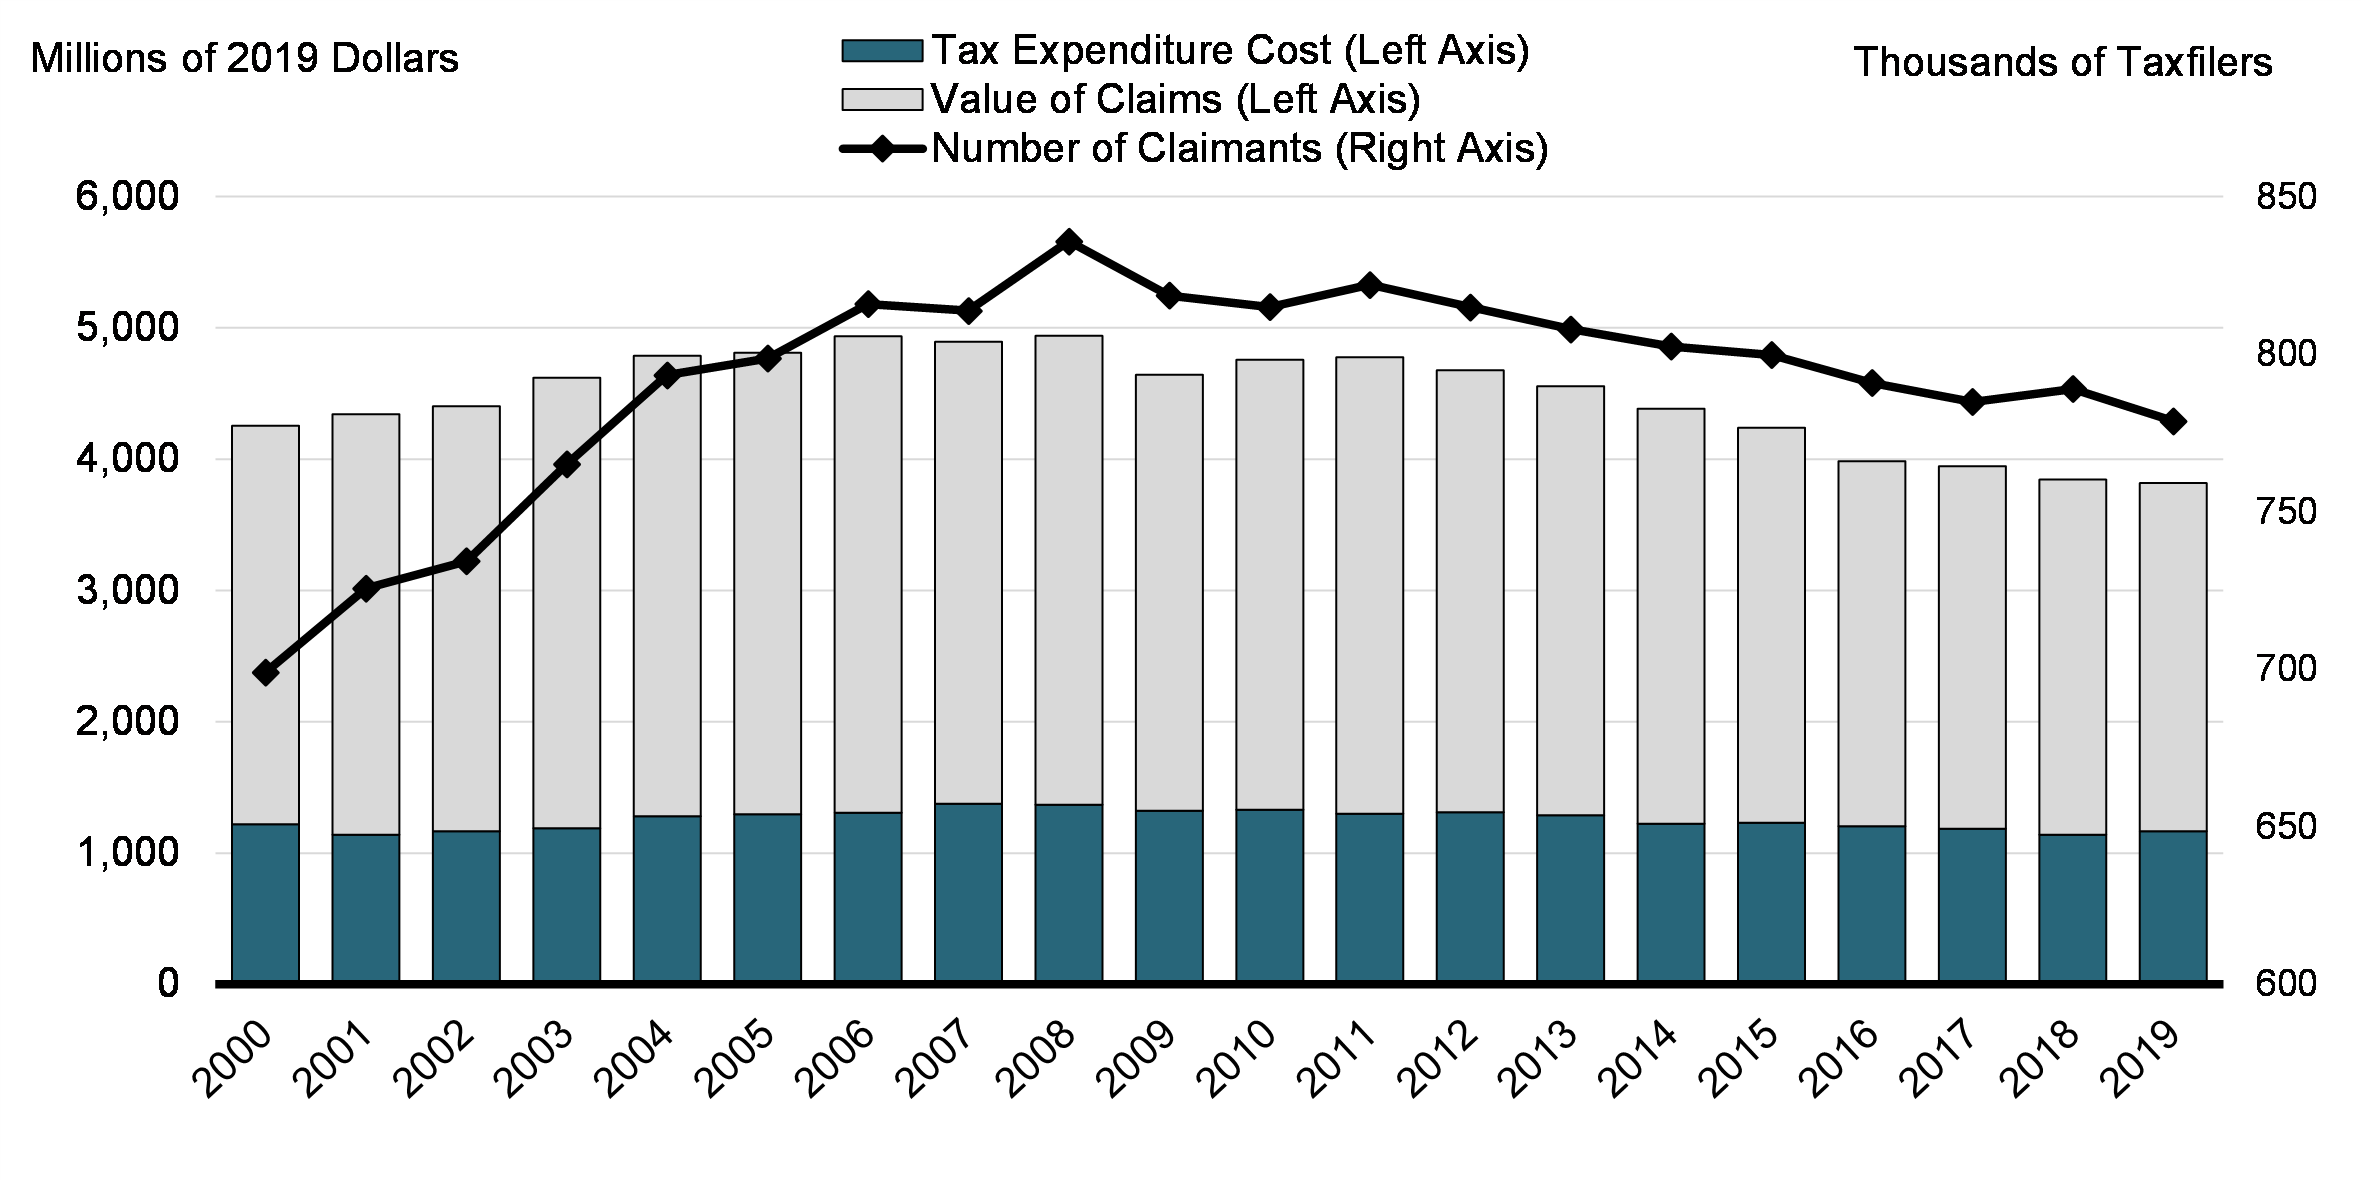
As shown in Chart 22, in 2019, 779,000 individual taxfilers claimed a total $3.82 billion in OEE. This marks a decline from the peak of 836,000 filers claiming $4.94 billion in 2008 (in constant 2019 dollars). The estimated tax expenditure cost of the measure, meanwhile, reached a low of $1.14 billion in 2018, down from $1.37 billion in 2007.
Value of OEE Claims, Associated Tax Expenditure Cost, and Number of Claimants (2000-2019)
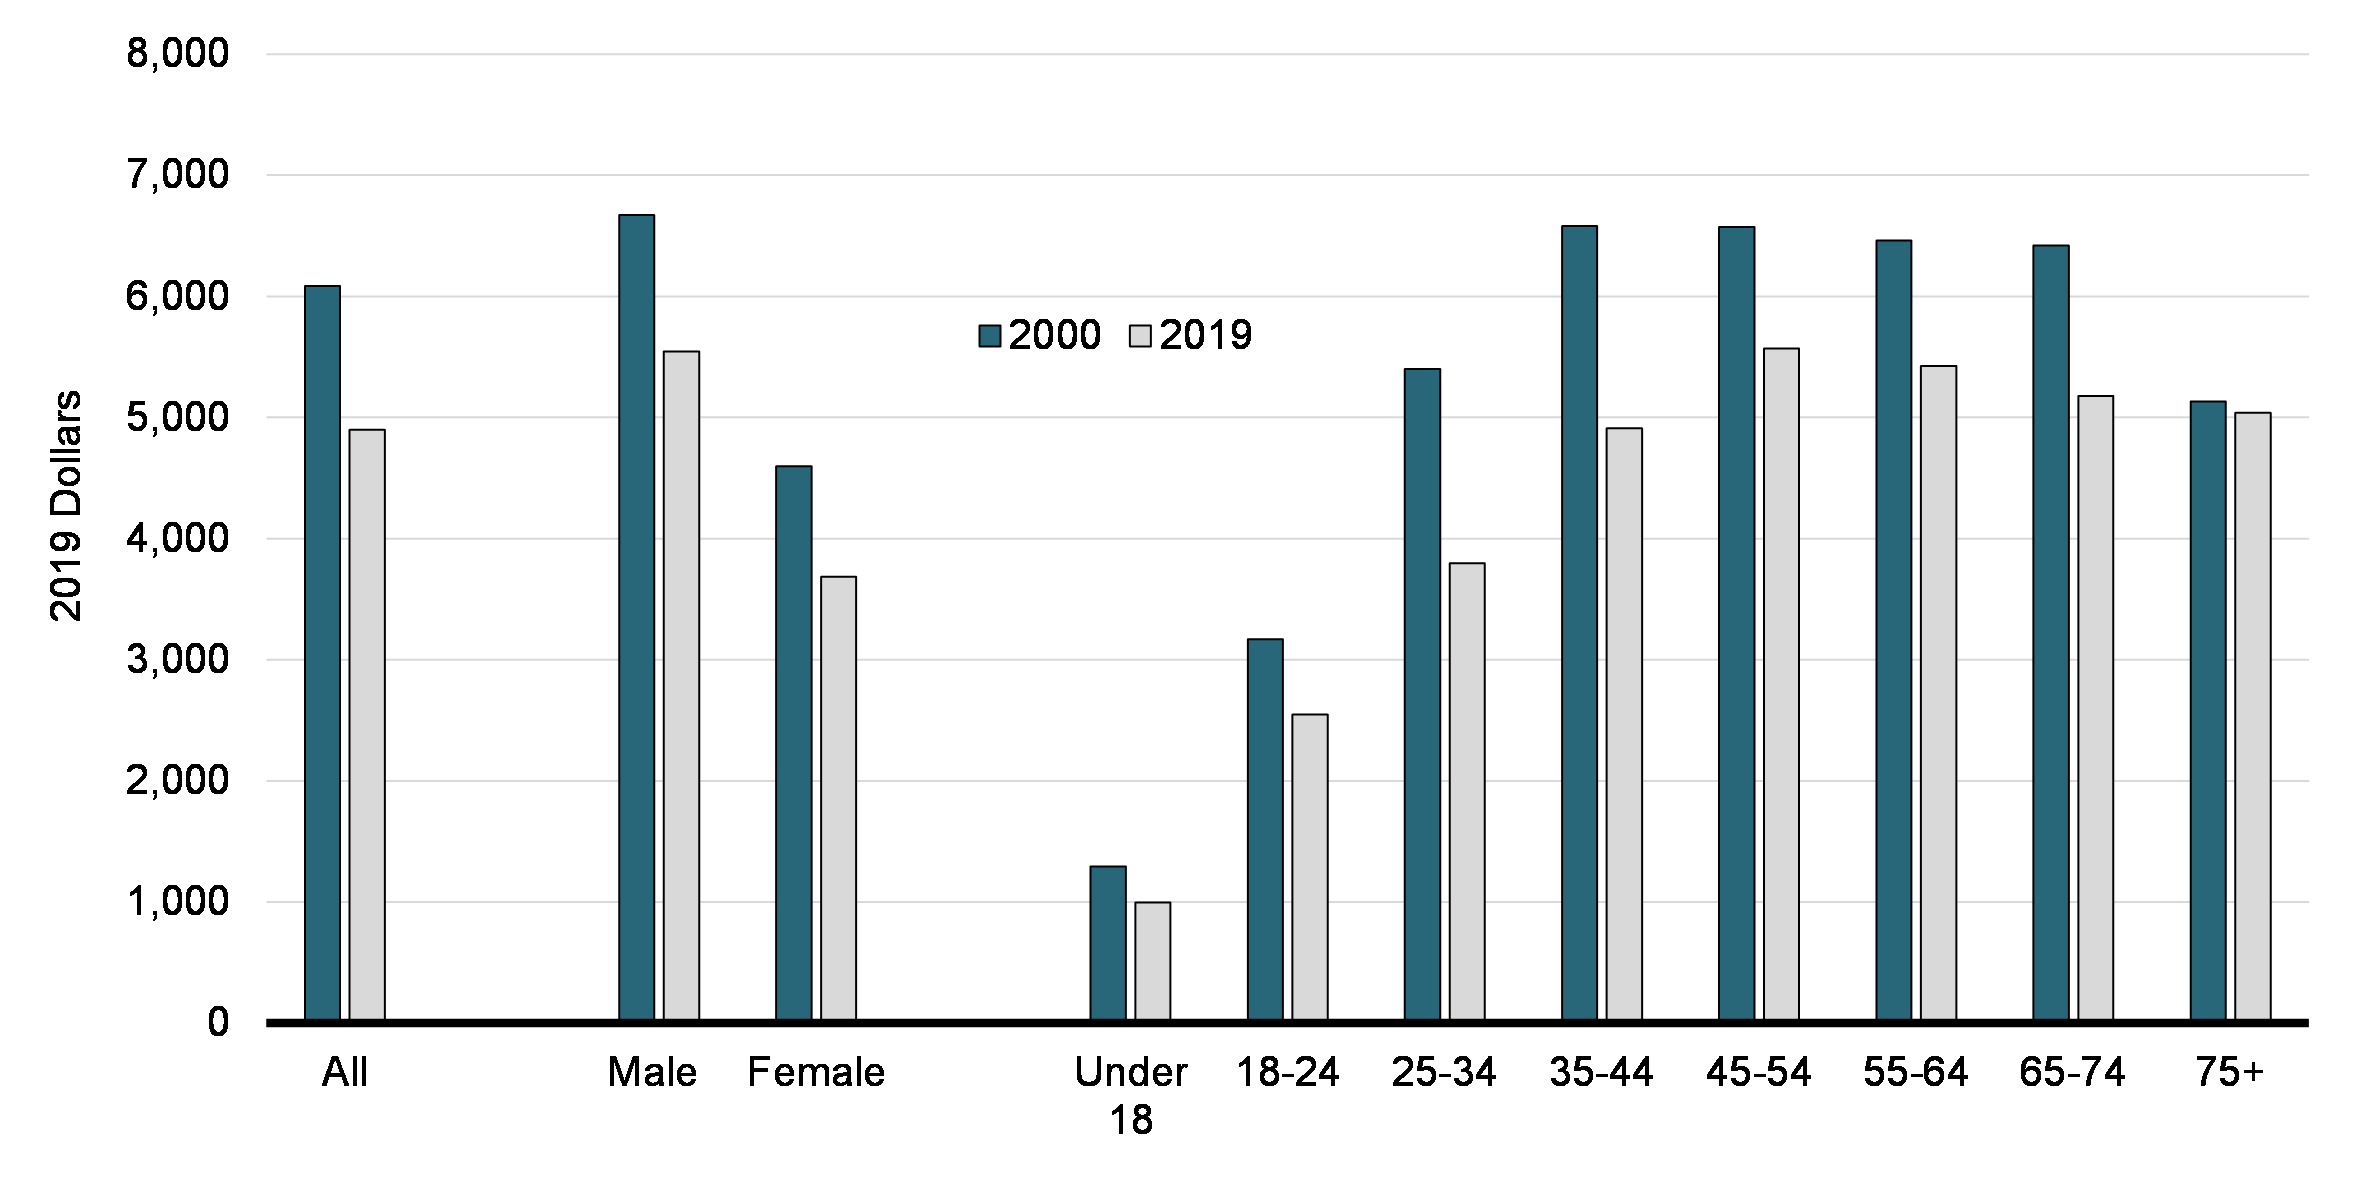
As shown in Chart 23, in 2019, the average amount of OEE claimed was $4,900, an amount that has been in decline since 2000 (then $6,088) and across the dimensions considered in this section – gender, age, industry (except agriculture, forestry, fishing and hunting; transportation and warehousing; and public administration) and total income (except those earning less than $15,000). Men claimed 50.5% more than women ($5,546 vs. $3,686). Average claim amounts increase sharply with age, with those under 18 claiming $997 compared to a maximum of $5,569 among the 45-54 cohort. Of note, the decline is modest among older claimants, with those 75 and above still claiming $5,040.
Average OEE Amount Claimed in 2000 and 2019, by Gender and Age Group (Constant 2019 Dollars)
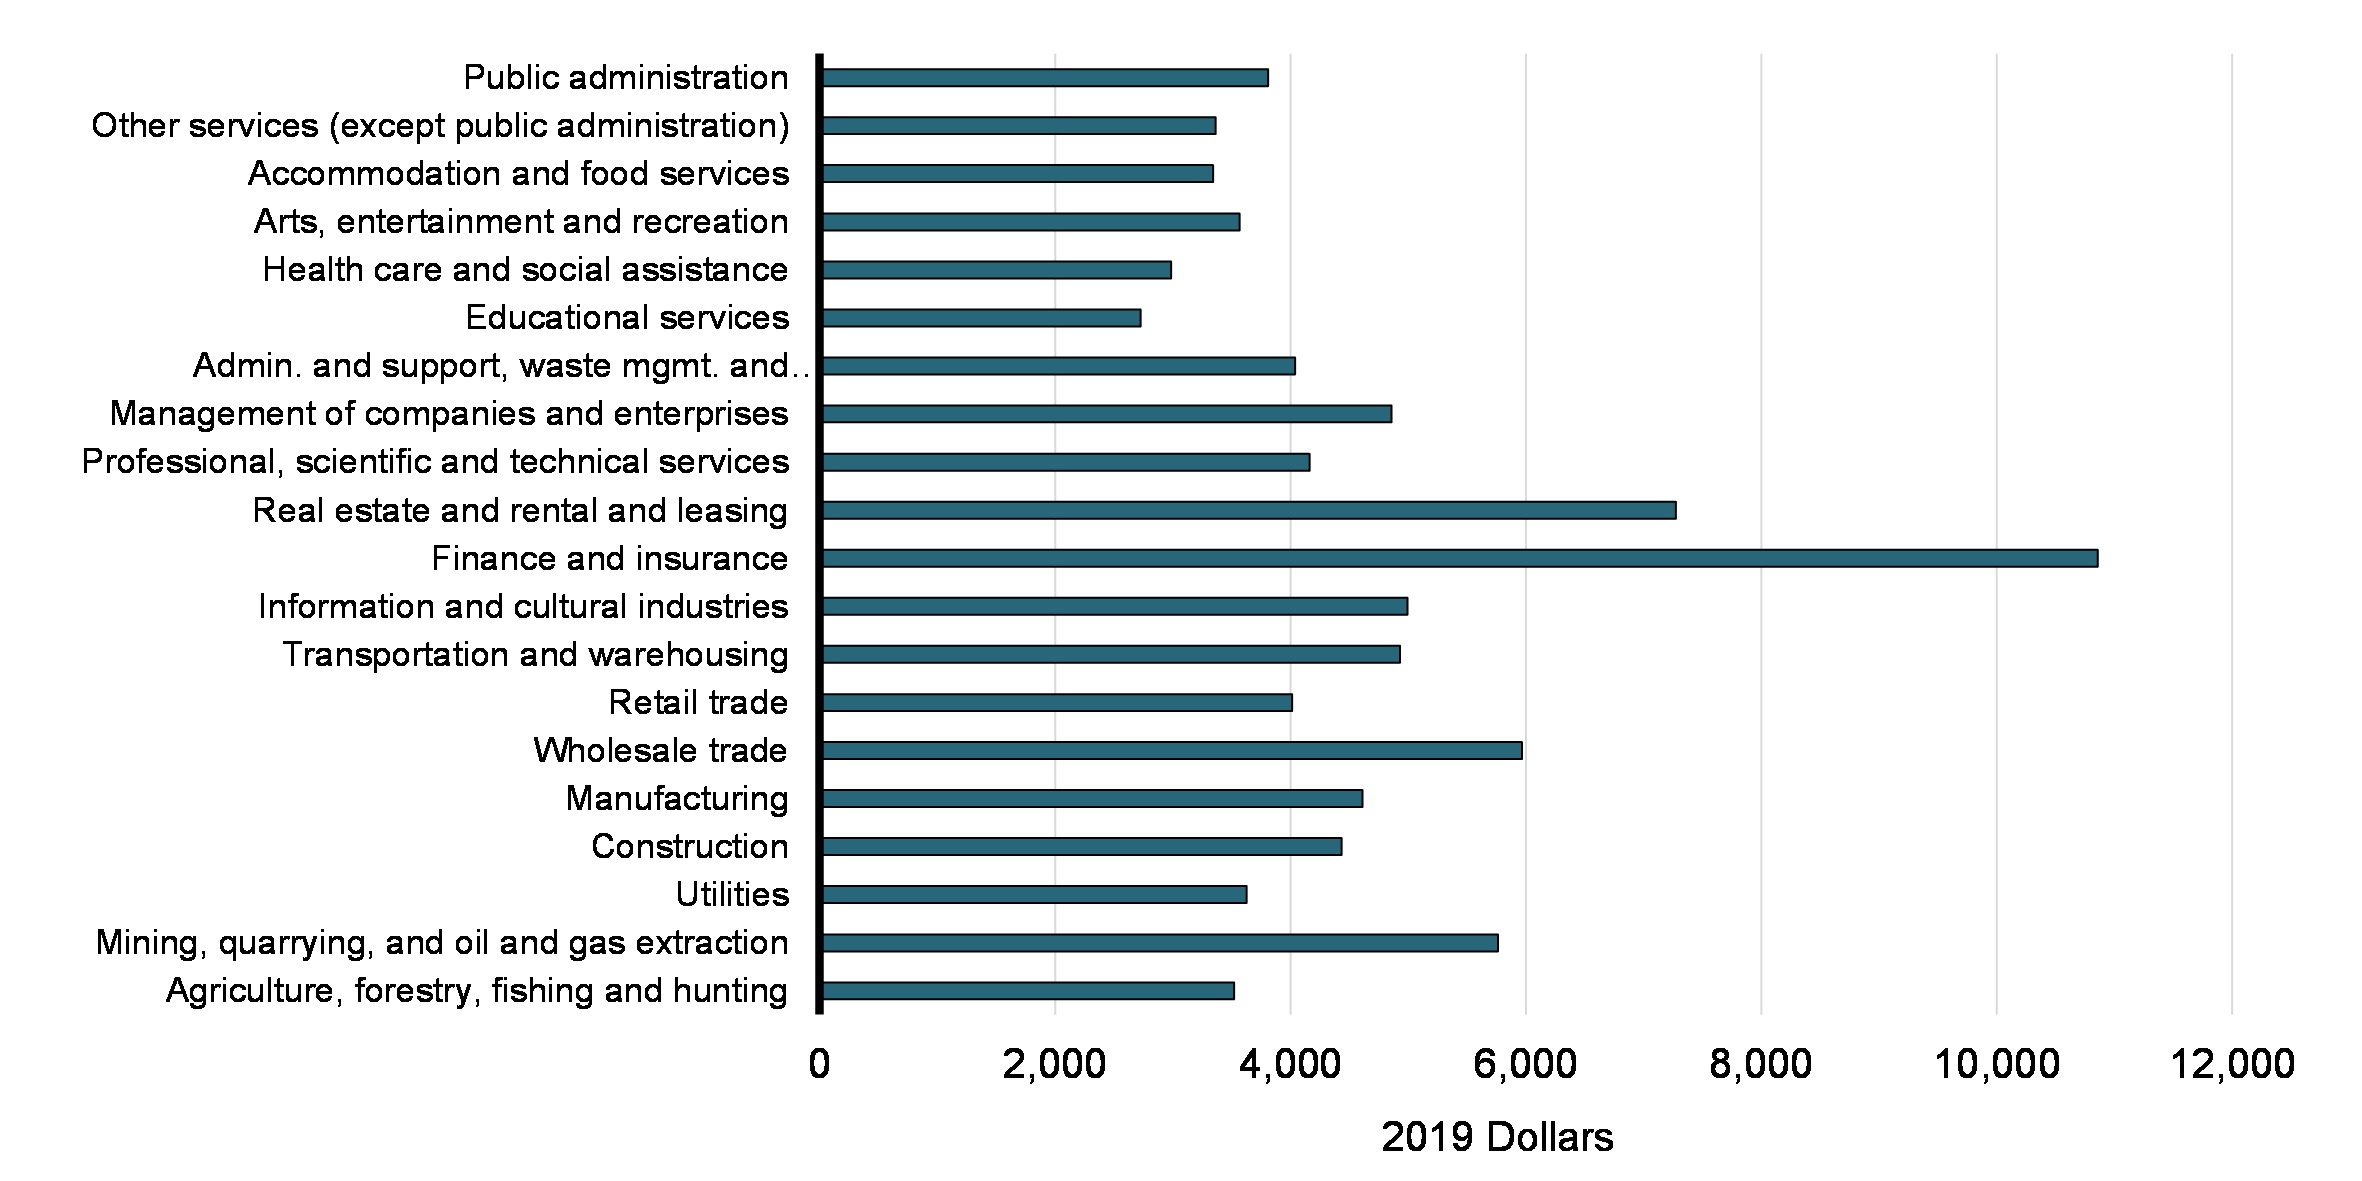
By industry, the variation is more substantial, ranging from a low of $2,728 in educational services to a high of $10,860 in finance and insurance (Chart 24). Average claim amounts in transportation and warehousing – where the greatest share of taxfilers report OEE – tracked the overall average at $4,931. It should also be noted that average amounts claimed decreased over the 2000-2019 period across most industries, with the exceptions of agriculture, forestry, fishing and hunting, transportation and warehousing, and in particular public administration, where it increased from $2,922 to $3,812, or by 30%. In percentage terms, the steepest decline was observed in information and cultural industries, where the average claim amount decreased from $8,407 to $4,995, or by 41%.
Average OEE Amount Claimed, by Industry (2019)
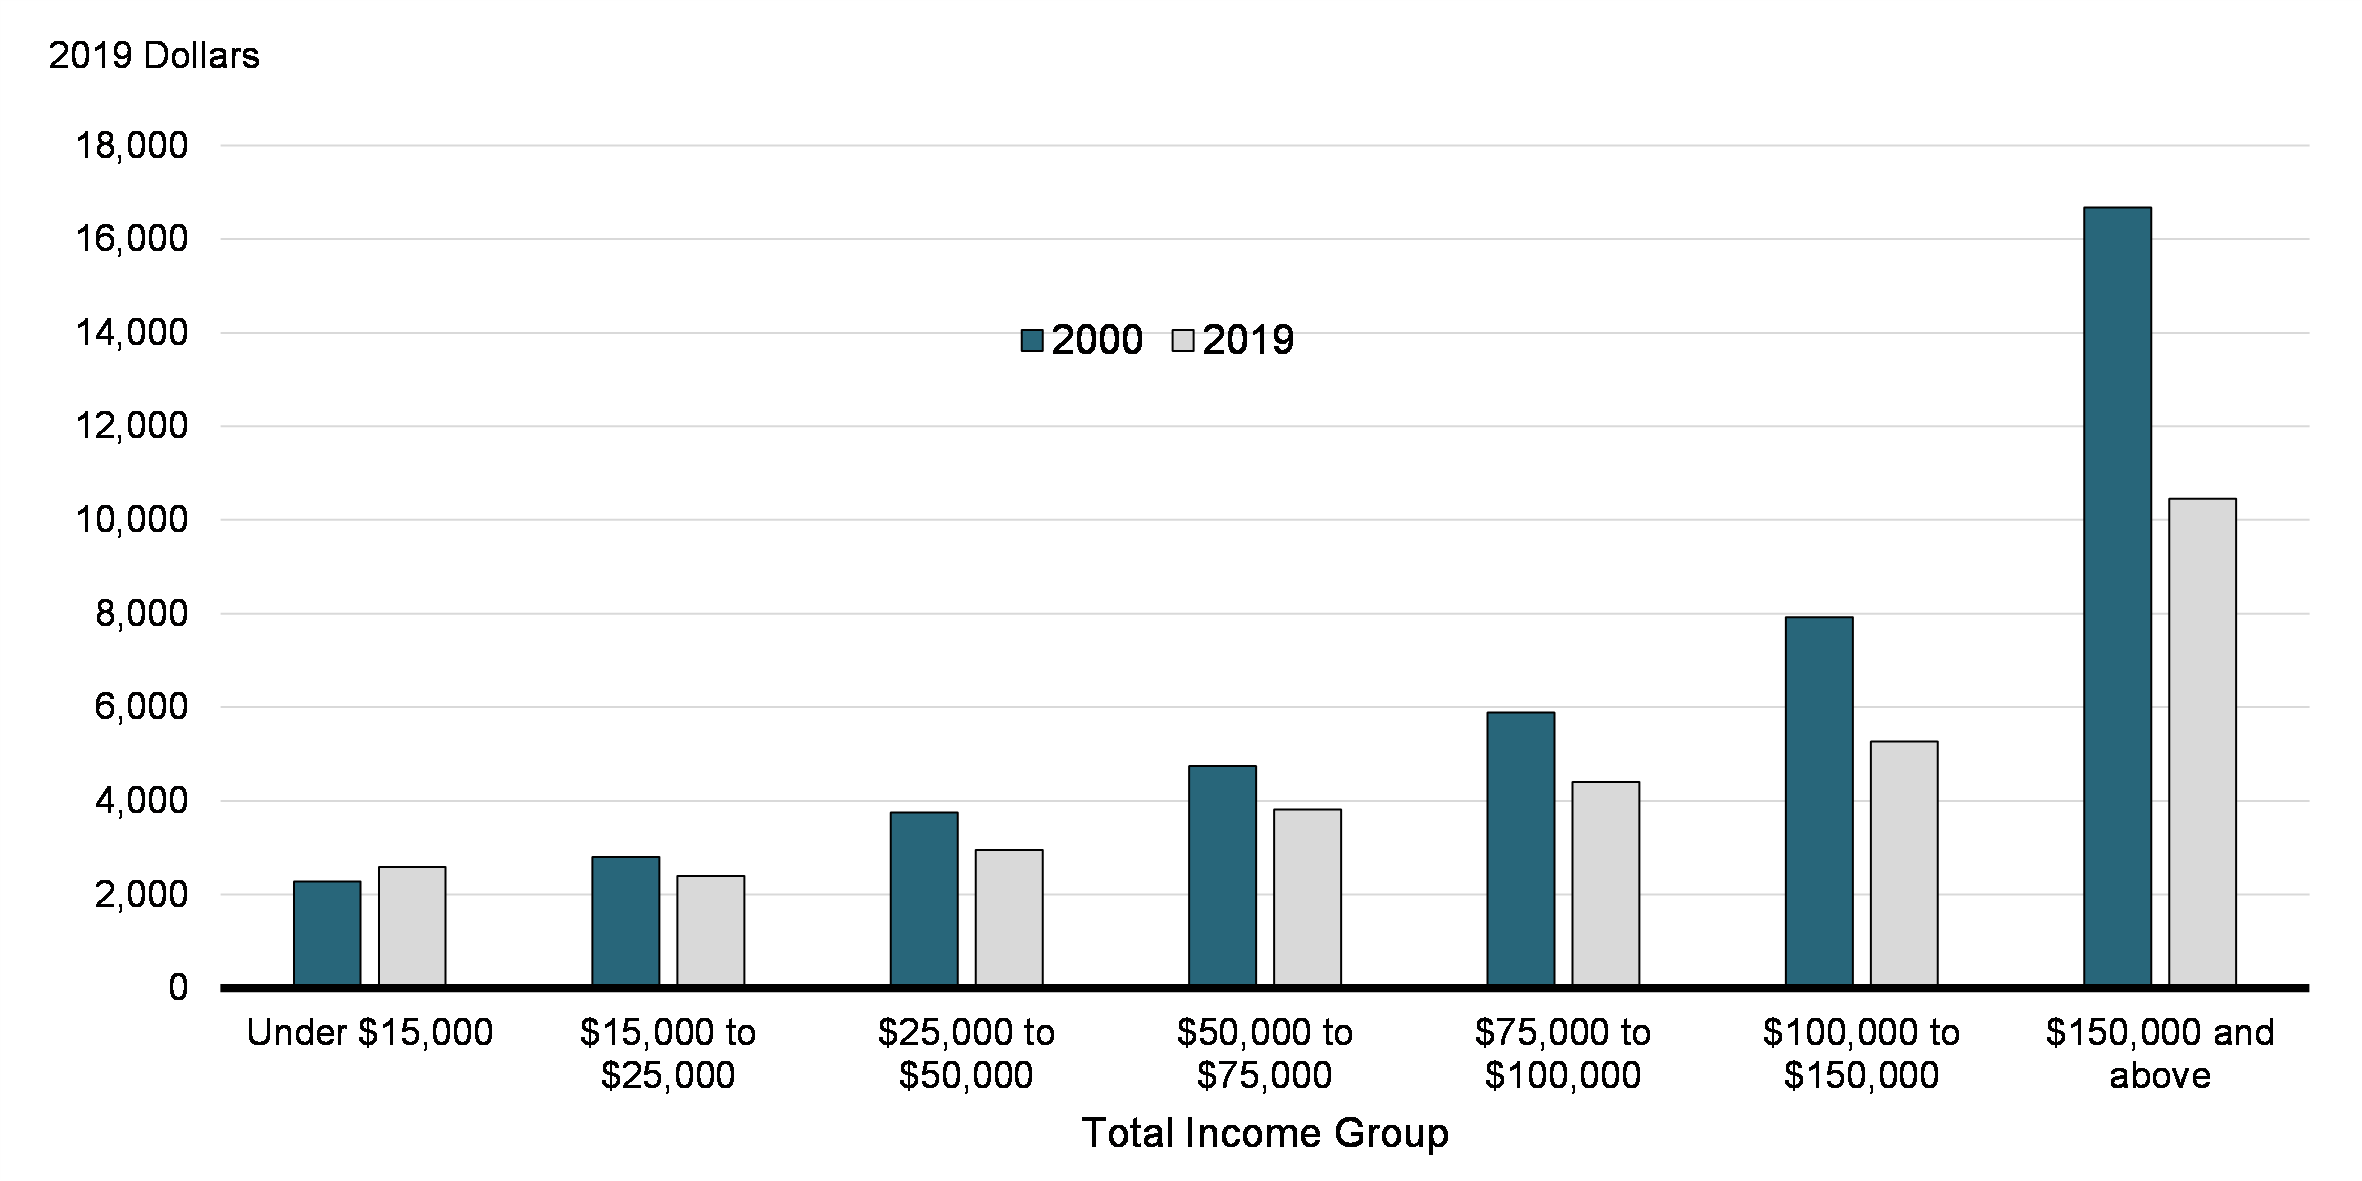
As shown in Chart 25, the average amount claimed for the OEE deductions increases substantially by total income group. In 2019, those with less than $15,000 of total income claimed an average of $2,585, compared to $10,457 for those with total income in excess of $150,000. Moreover, between 2000 and 2019, the average amount claimed declined among all those earning $15,000 or more. The greatest reduction was seen among those with total income greater than $150,000, whose average claim fell by $6,215.
Average OEE Amount Claimed, by Income Group (2000 and 2019)
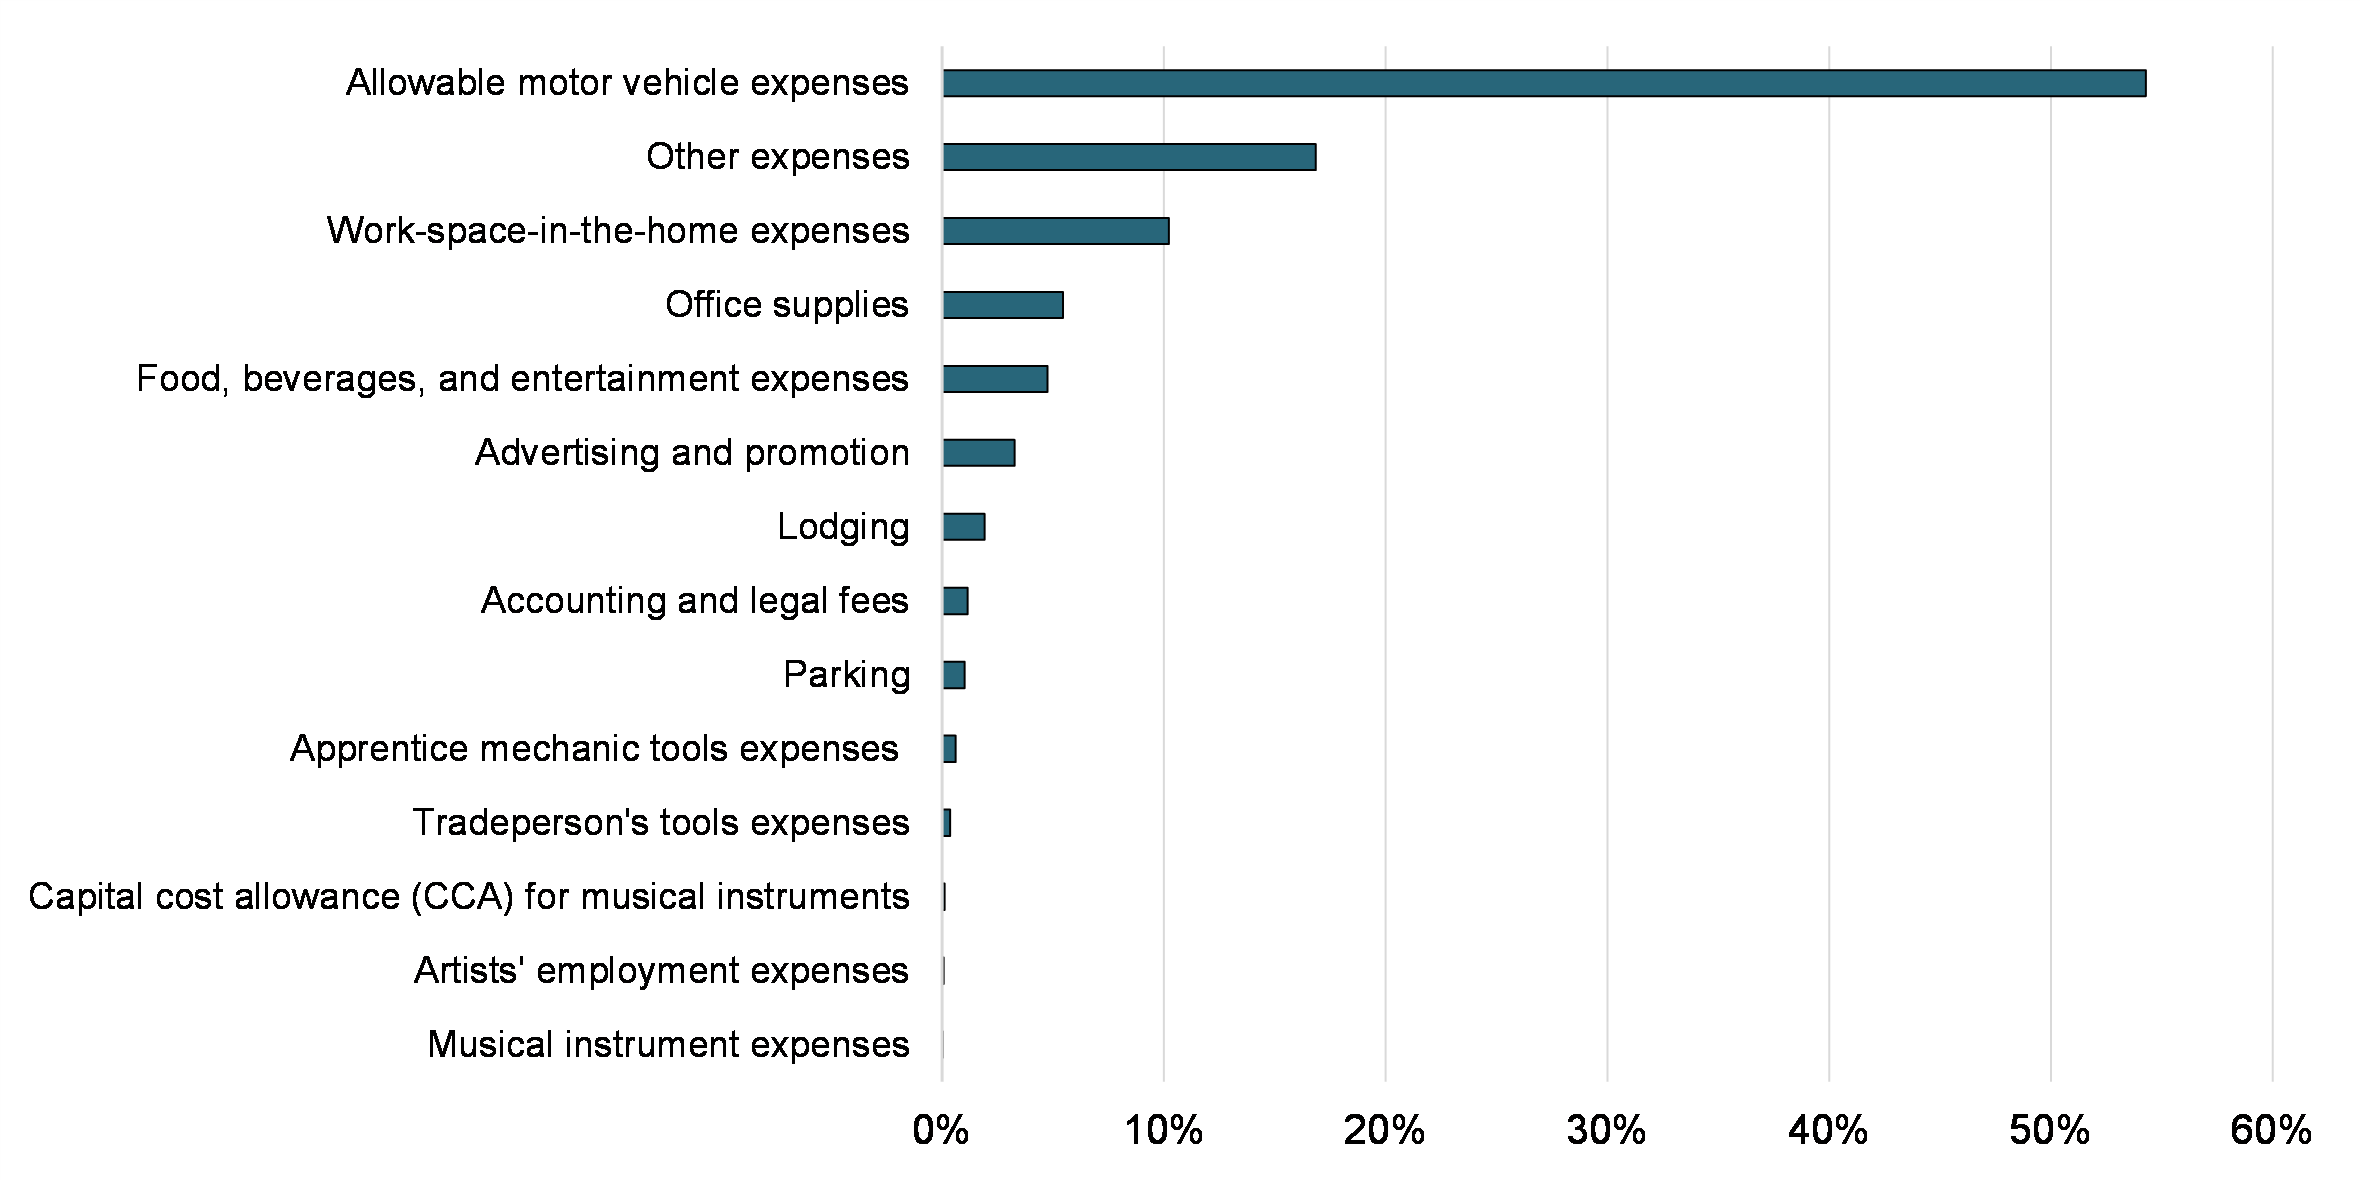
In 2019, a completed T777 form was available for 76.8% of OEE claimants, providing details on the type(s) of expenses incurred throughout the year. Chart 26 provides a breakdown of the total amounts claimed via this form. Overall, 54.3% of the value of all detailed claims related to allowable motor vehicle expenses, 16.9% related to the other expenses heading, and a further 10.2% were for work-space-in-the-home costs. Meanwhile, musical instrument expenses (including capital cost allowance), artists’ employment expenses and tradesperson’s tools expenses together accounted for less than 1% of the total value claimed on the T777.
Percentage Breakdown of the Value of OEE Claims, among Those Filing T777 (2019
5.2. Share of Taxfilers by Demographic Group
Shares by Gender
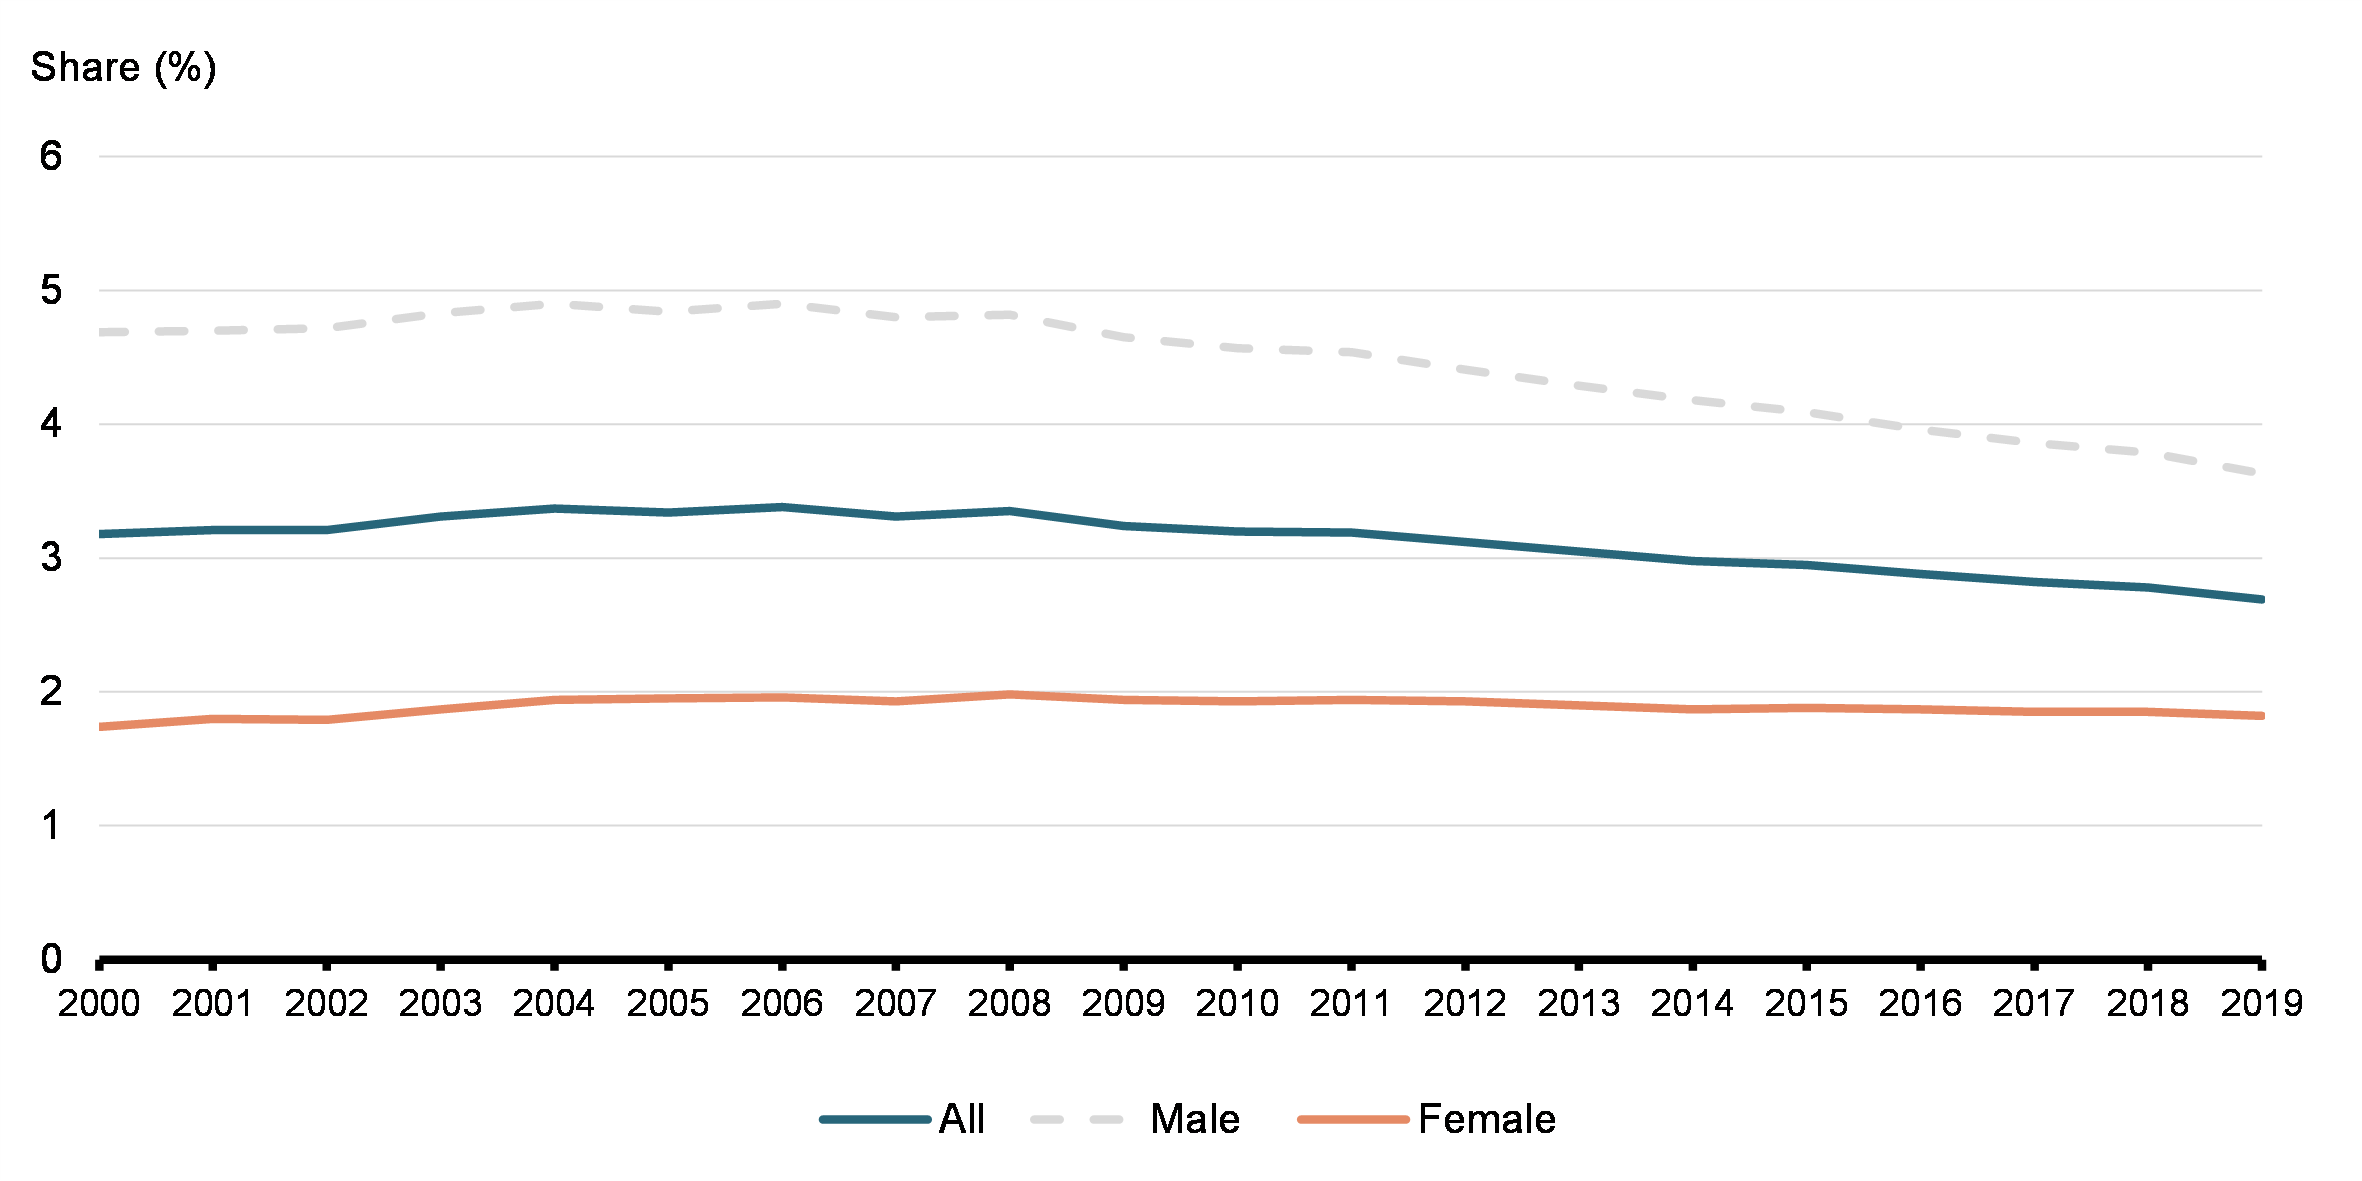
As shown in Chart 27, the proportion of taxfilers claiming OEE was 2.7% in 2019, down from a peak of 3.38% in 2006. This proportion varies significantly across a number of dimensions. In 2019, men were approximately twice as likely as women to claim (3.63% vs. 1.82%). However, the share of men claiming OEE has declined over time, and the difference between the share of men and women claiming has narrowed. For men, the maximum share was observed in 2006 (4.9%) while for women this occurred in 2008 (1.98%).
Share of OEE Claimants among Taxfilers (2019)
Shares by Age Group
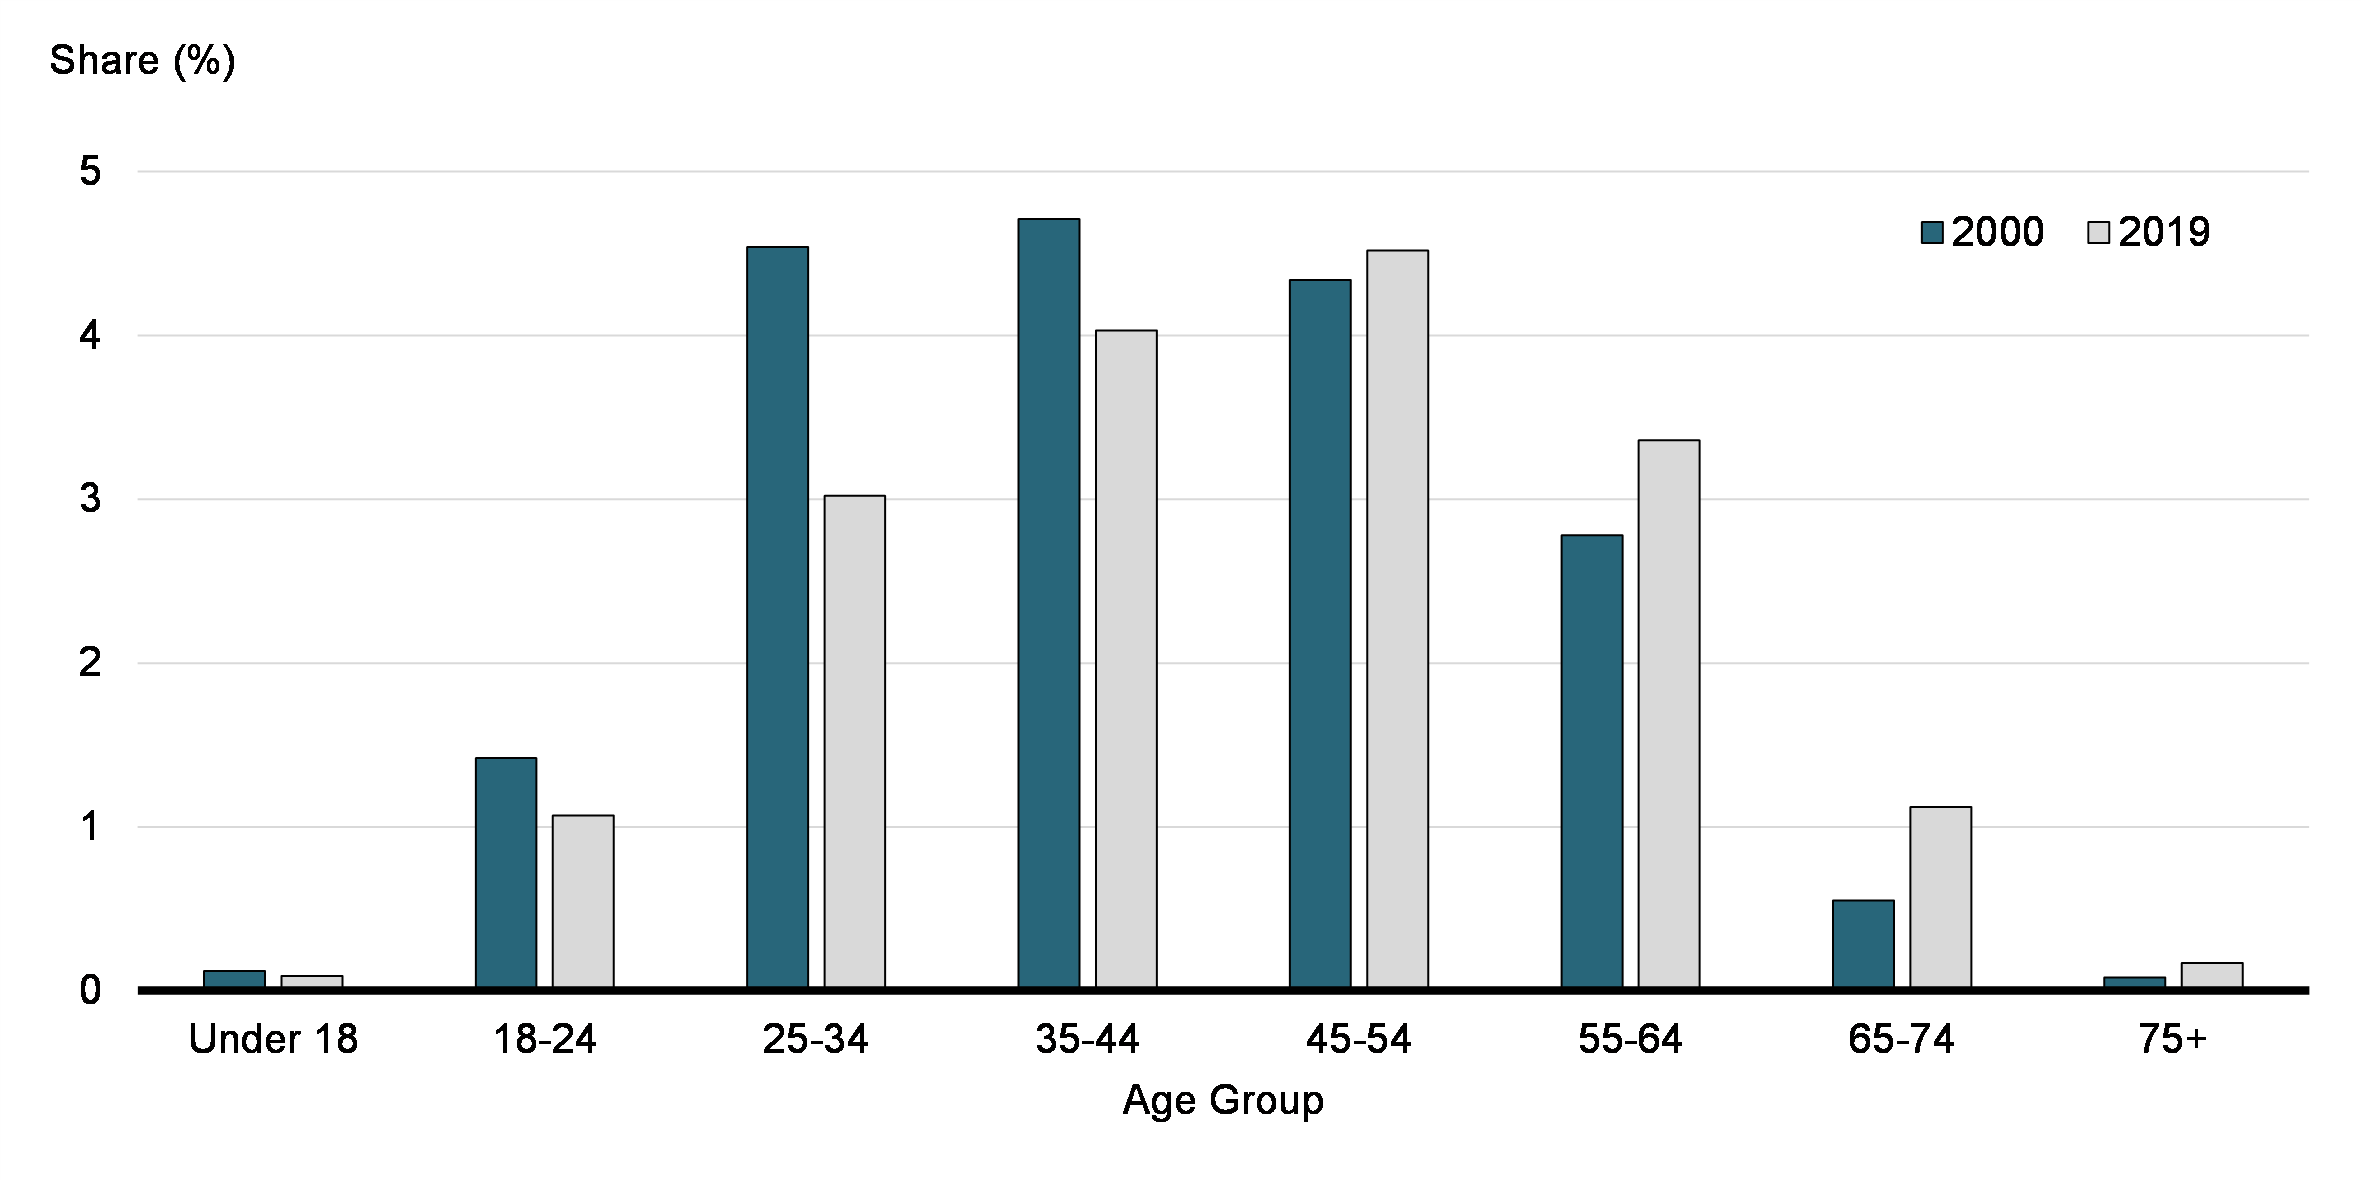
Filers between the ages 45 and 54 were more than four times as likely as those between 18 and 24 to claim (4.52% vs. 1.07% in 2019). As shown in Chart 28, filers 45 and above were more likely to claim OEE in 2019 as compared to 2000. On the other hand, filers up to age 44 were less likely to claim in 2019 as compared to 2000. There was also a marked decrease in the share of claimants aged 25-34 between 2000 and 2019.
Share of OEE Claimants among Taxfilers, by Age Group (2000 and 2019)
Shares by Industry
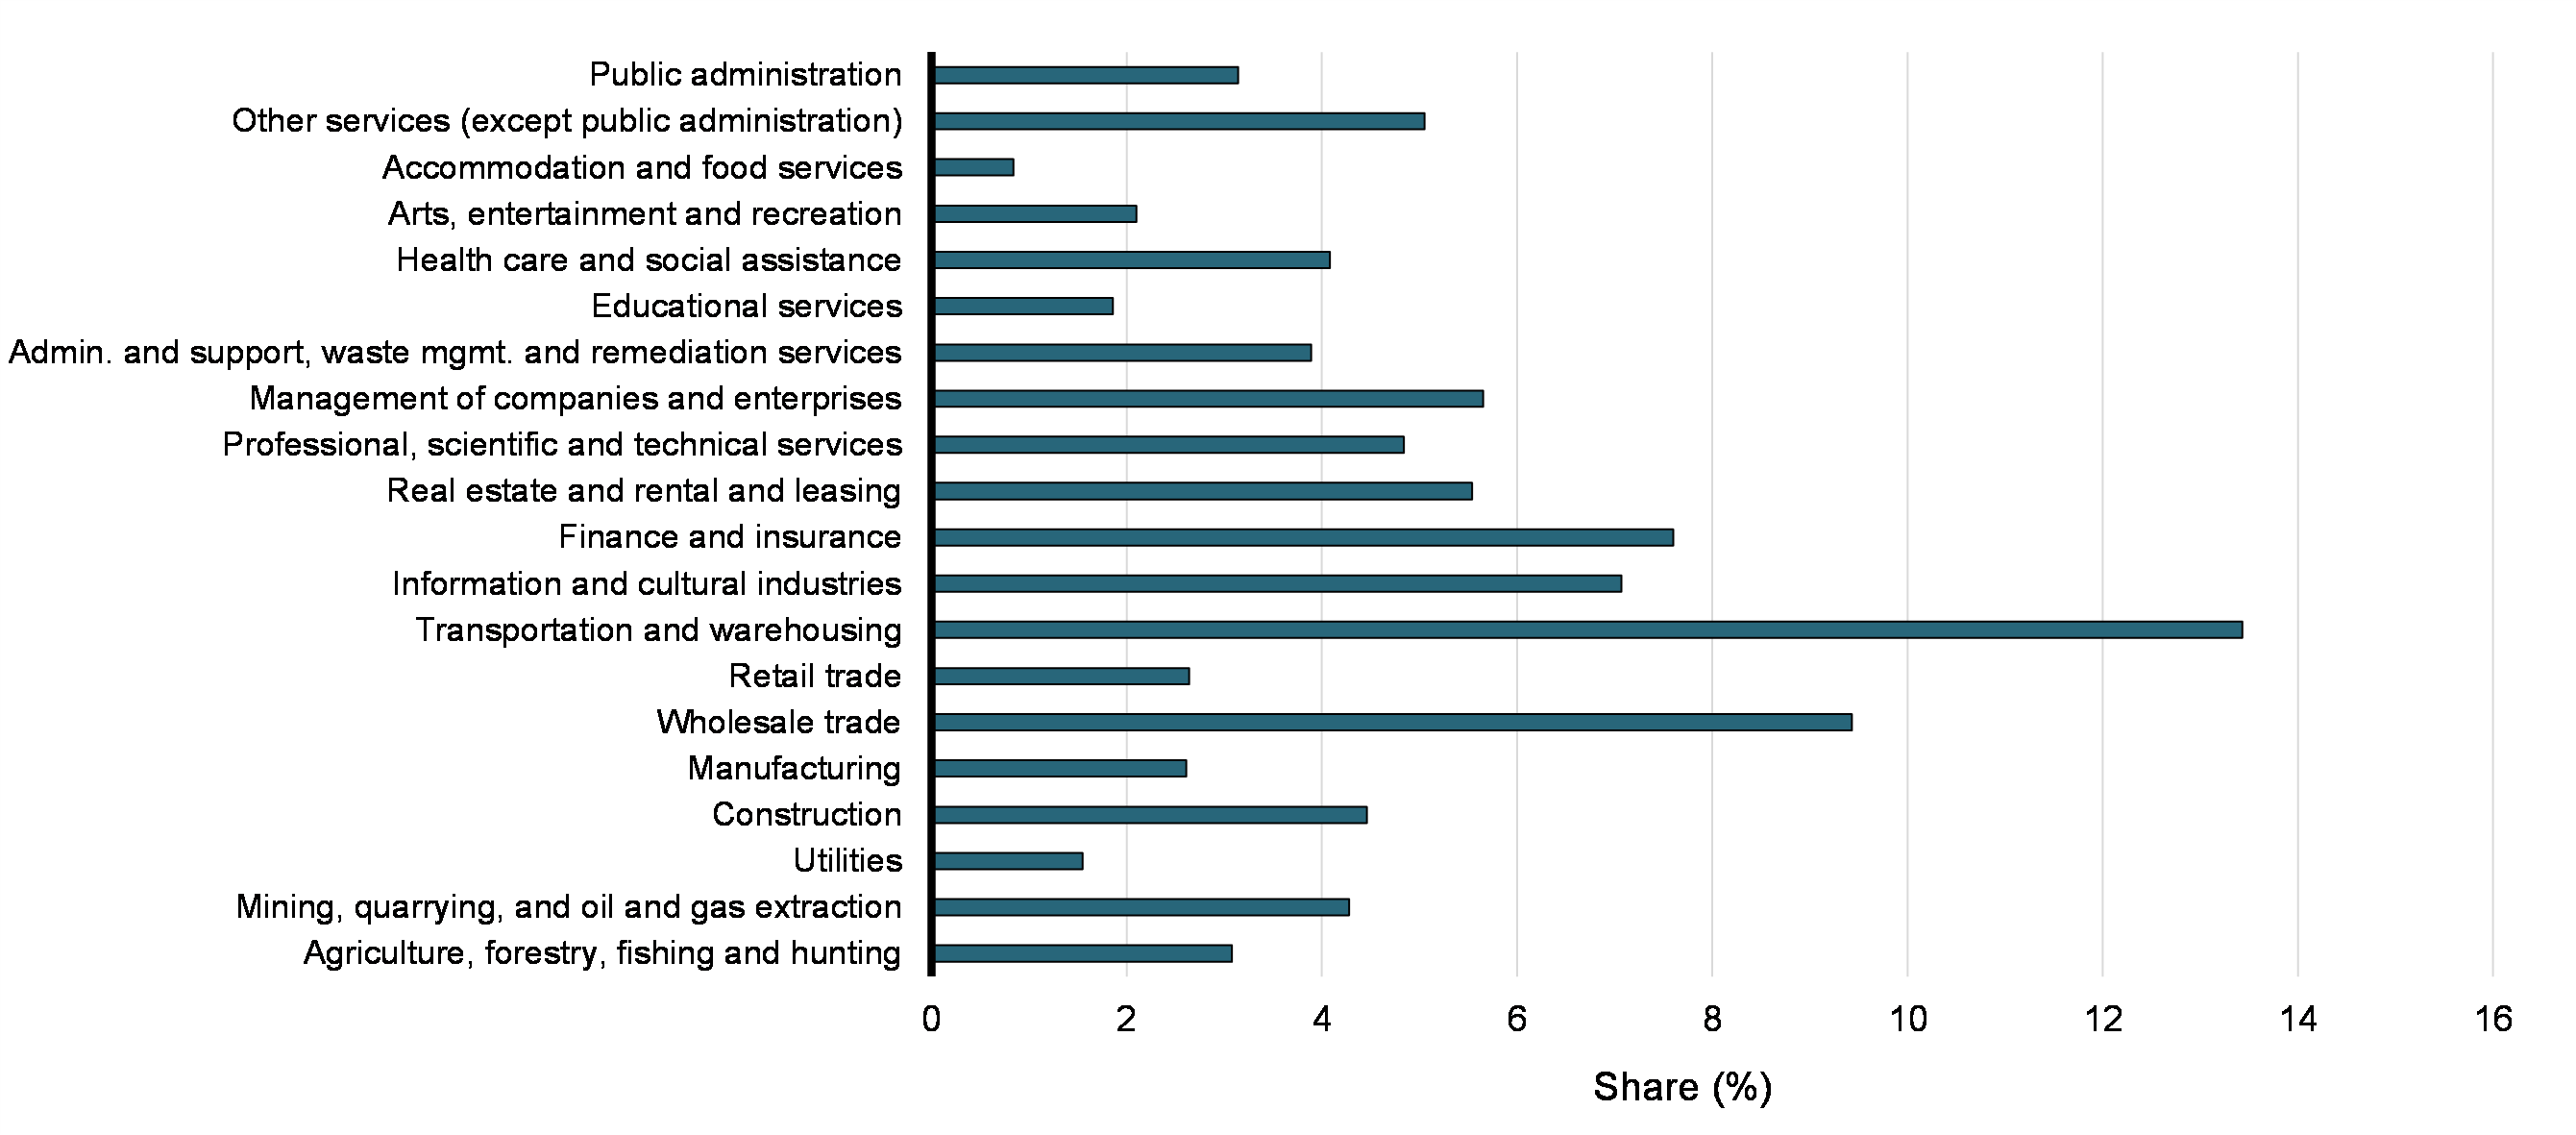
The share of taxfilers claiming OEE also varies significantly according to industry of employment, as seen in Chart 29. The highest claim rates were seen in transportation and warehousing (13.4%) and wholesale trade (9.4%), while the lowest were in accommodation and food services (0.8%) and utilities (1.6%). The aforementioned gender disparity in claim rates is also seen in many industries (not shown). For instance, the share of male taxfilers working in transportation and warehousing is more than three times that of female taxfilers (16.7% vs. 5.4%); similar discrepancies are seen in mining, quarrying, and oil and gas extraction (4.8% vs. 1.7%) and agriculture, forestry, fishing and hunting (3.9% vs. 1.1%). On the other hand, claim rates are more balanced in health care and social assistance (4% vs. 4.1%) and public administration (3.4% vs. 3%).
Share of OEE Claimants among Taxfilers, by 2-Digit NAICS Industry (2019)
Shares by Income Group
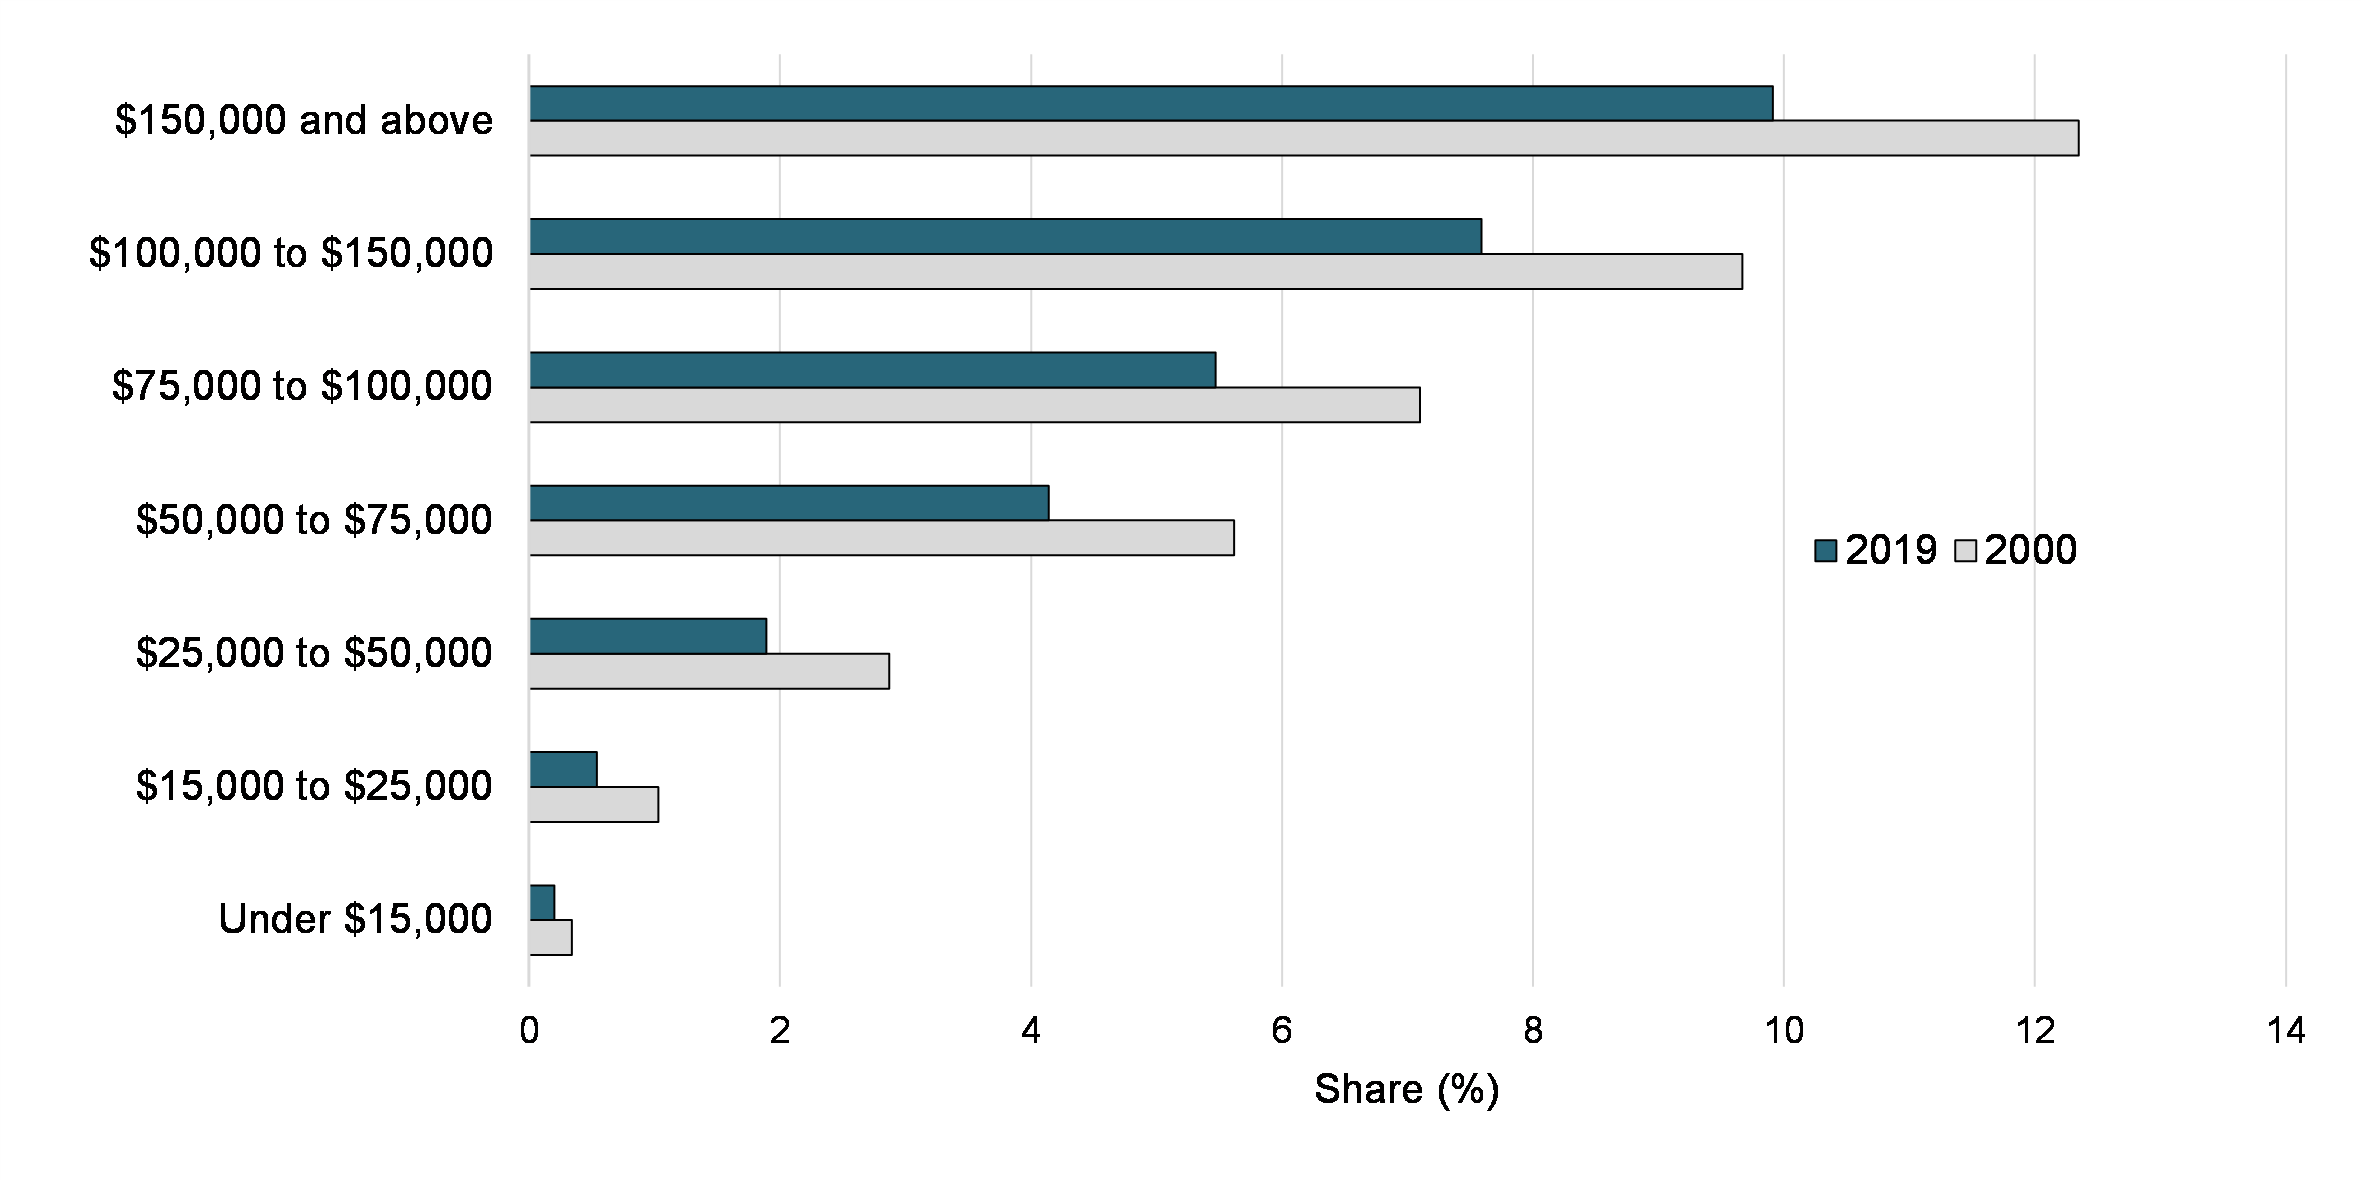
Claim rates also increase with total income (Chart 30), ranging from a low of 0.2% for those with income less than $15,000 to 9.91% among those earning more than $150,000. Across all income groups, the share claiming fell between 2000 and 2019. Similarly, when examining employment income, 14.56% of those with greater than $150,000 in T4 earnings claimed OEE, compared to just 0.31% of those with under $15,000 in T4 earnings (not shown).
Share of OEE Claimants among Taxfilers, by Income Group(2000 and 2019)
5.3. Comparison of Claimants and Non-Claimants
Number of Jobs Worked
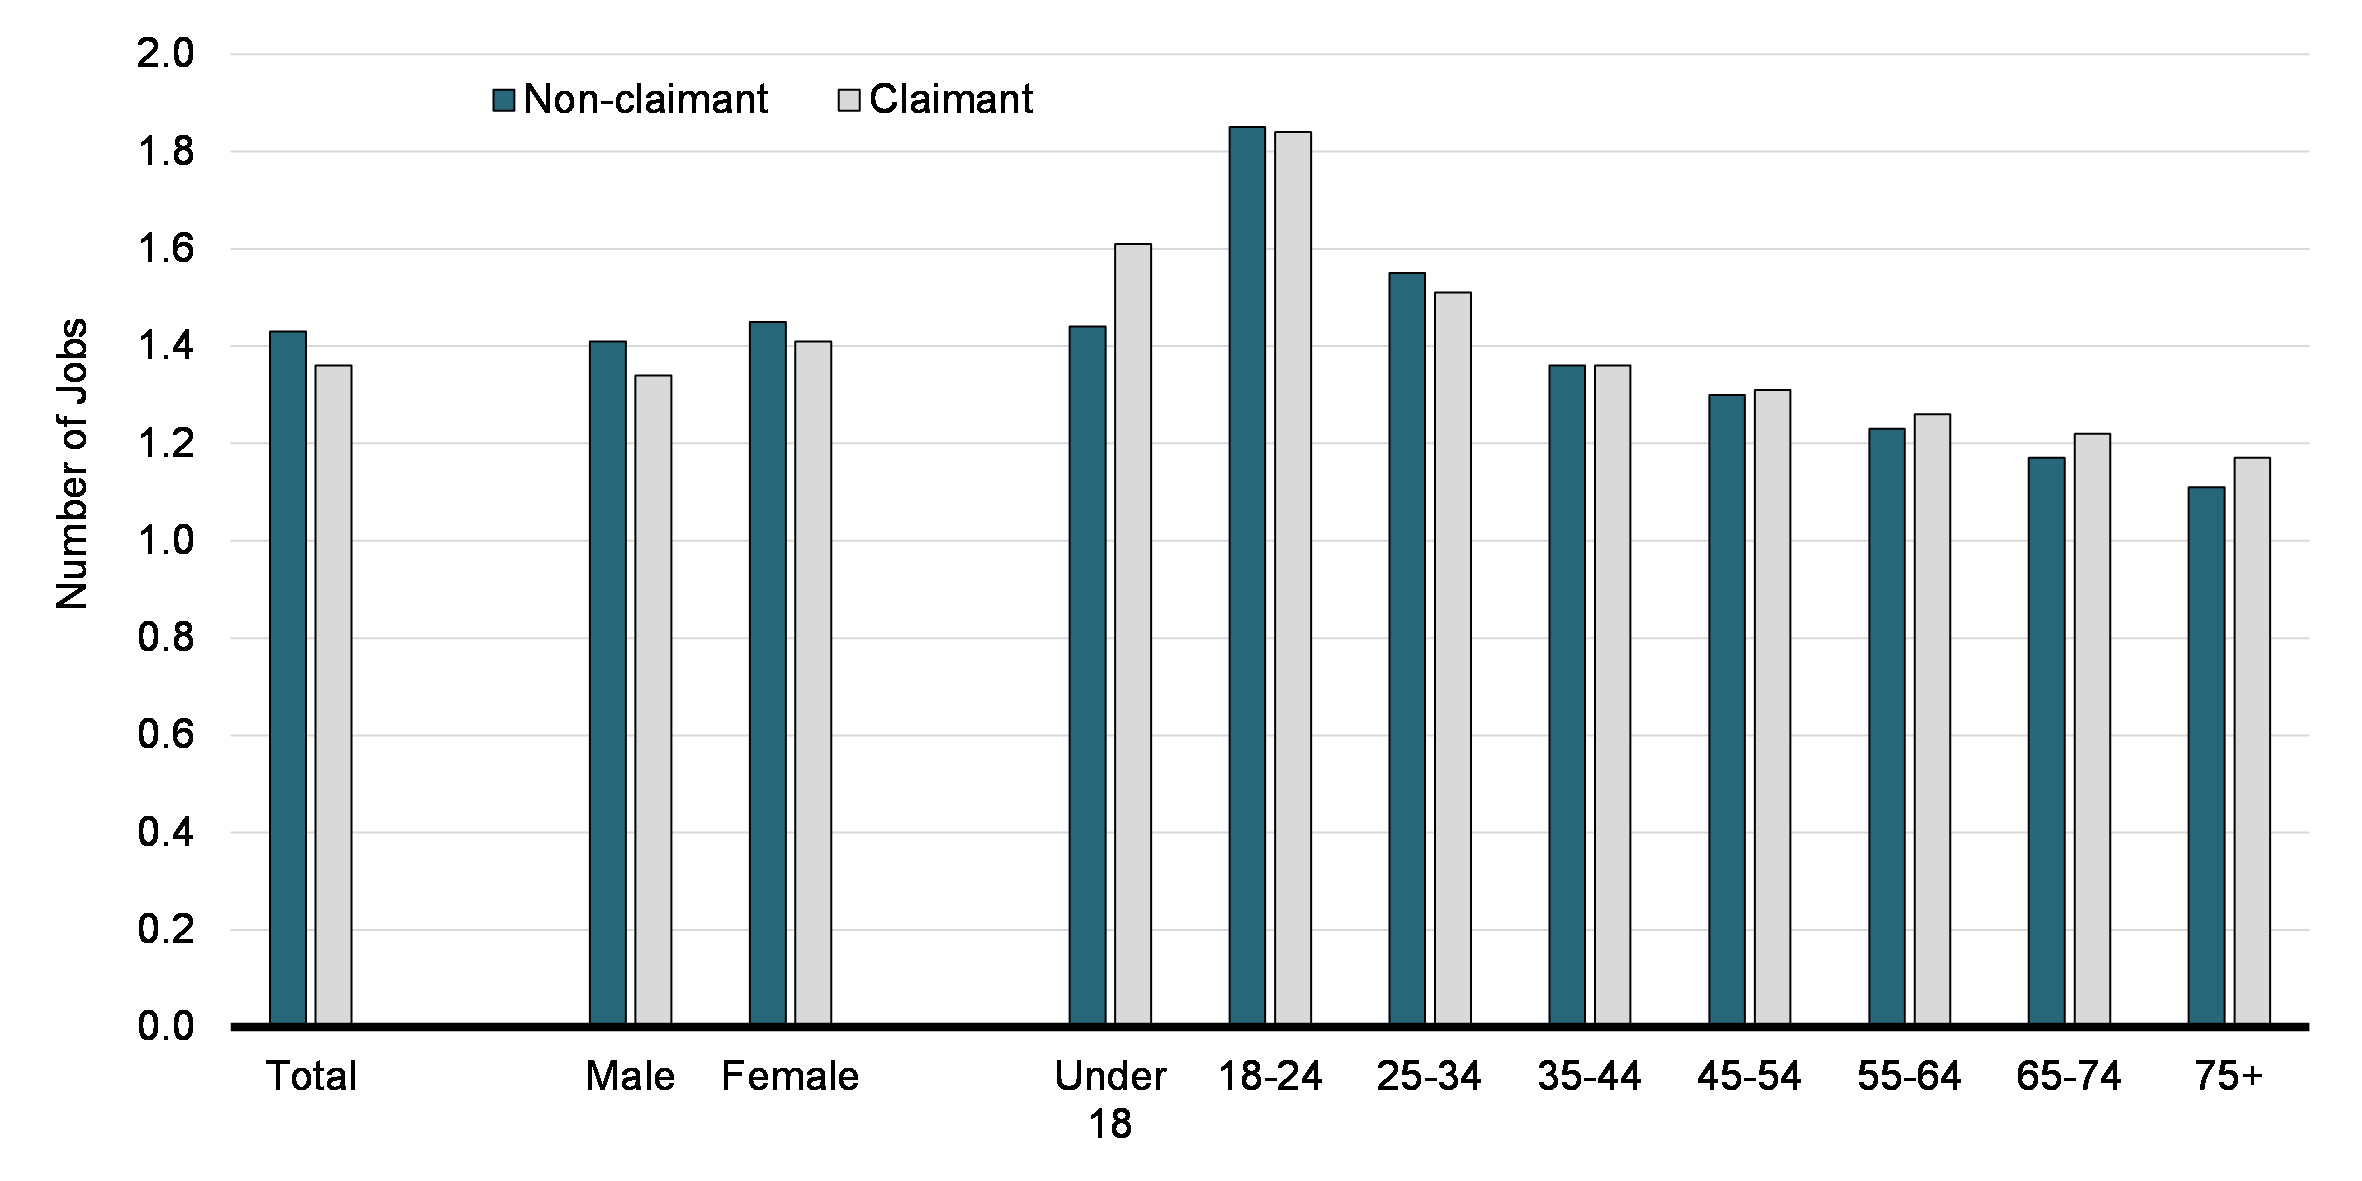
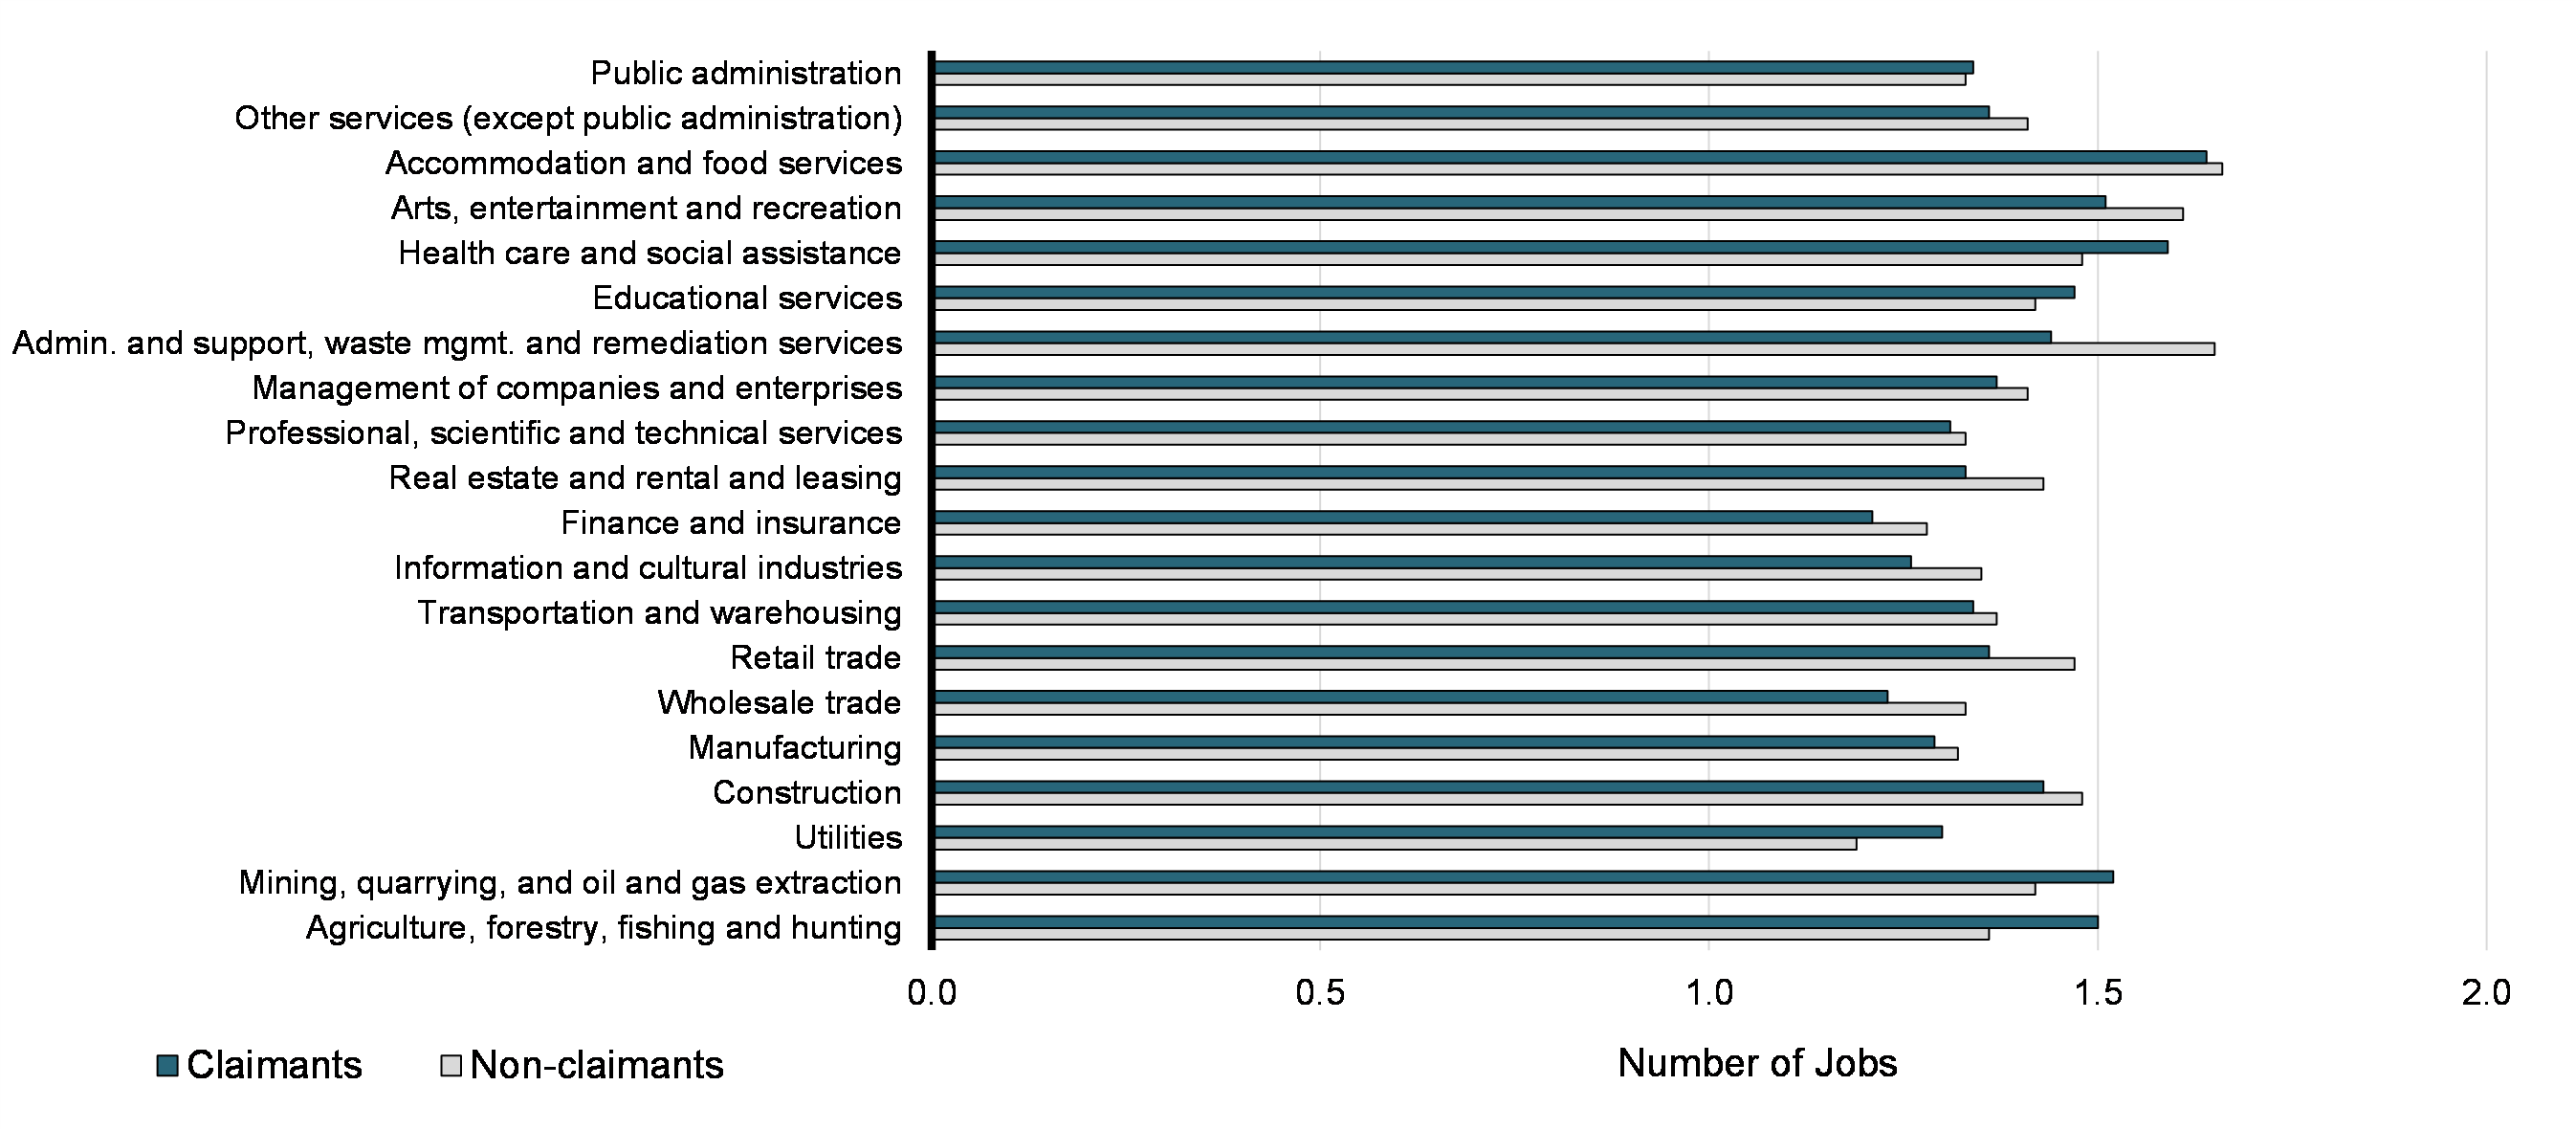
Taxfilers claiming the OEE deductions worked an average of 1.36 jobs in 2019, compared to 1.43 for their non-claimant counterparts (i.e., all other taxfilers).Footnote 13 This represents an overall decline and widening since 2000, when claimants and non-claimants worked 1.65 and 1.67 jobs, respectively. Claimant men worked relatively fewer jobs than claimant women in 2019 (1.34 vs 1.41), as did non-claimant men compared to non-claimant women (1.41 vs. 1.45). As shown in Chart 31, the number of jobs worked was greater among claimants under 18 compared to their non-claimant counterparts, with this difference narrowing among core-age workers (25-54), and growing again among workers 55 and above.
Average Number of Jobs Worked by OEE Claimants and Non-Claimants, by Gender and Age (2019)
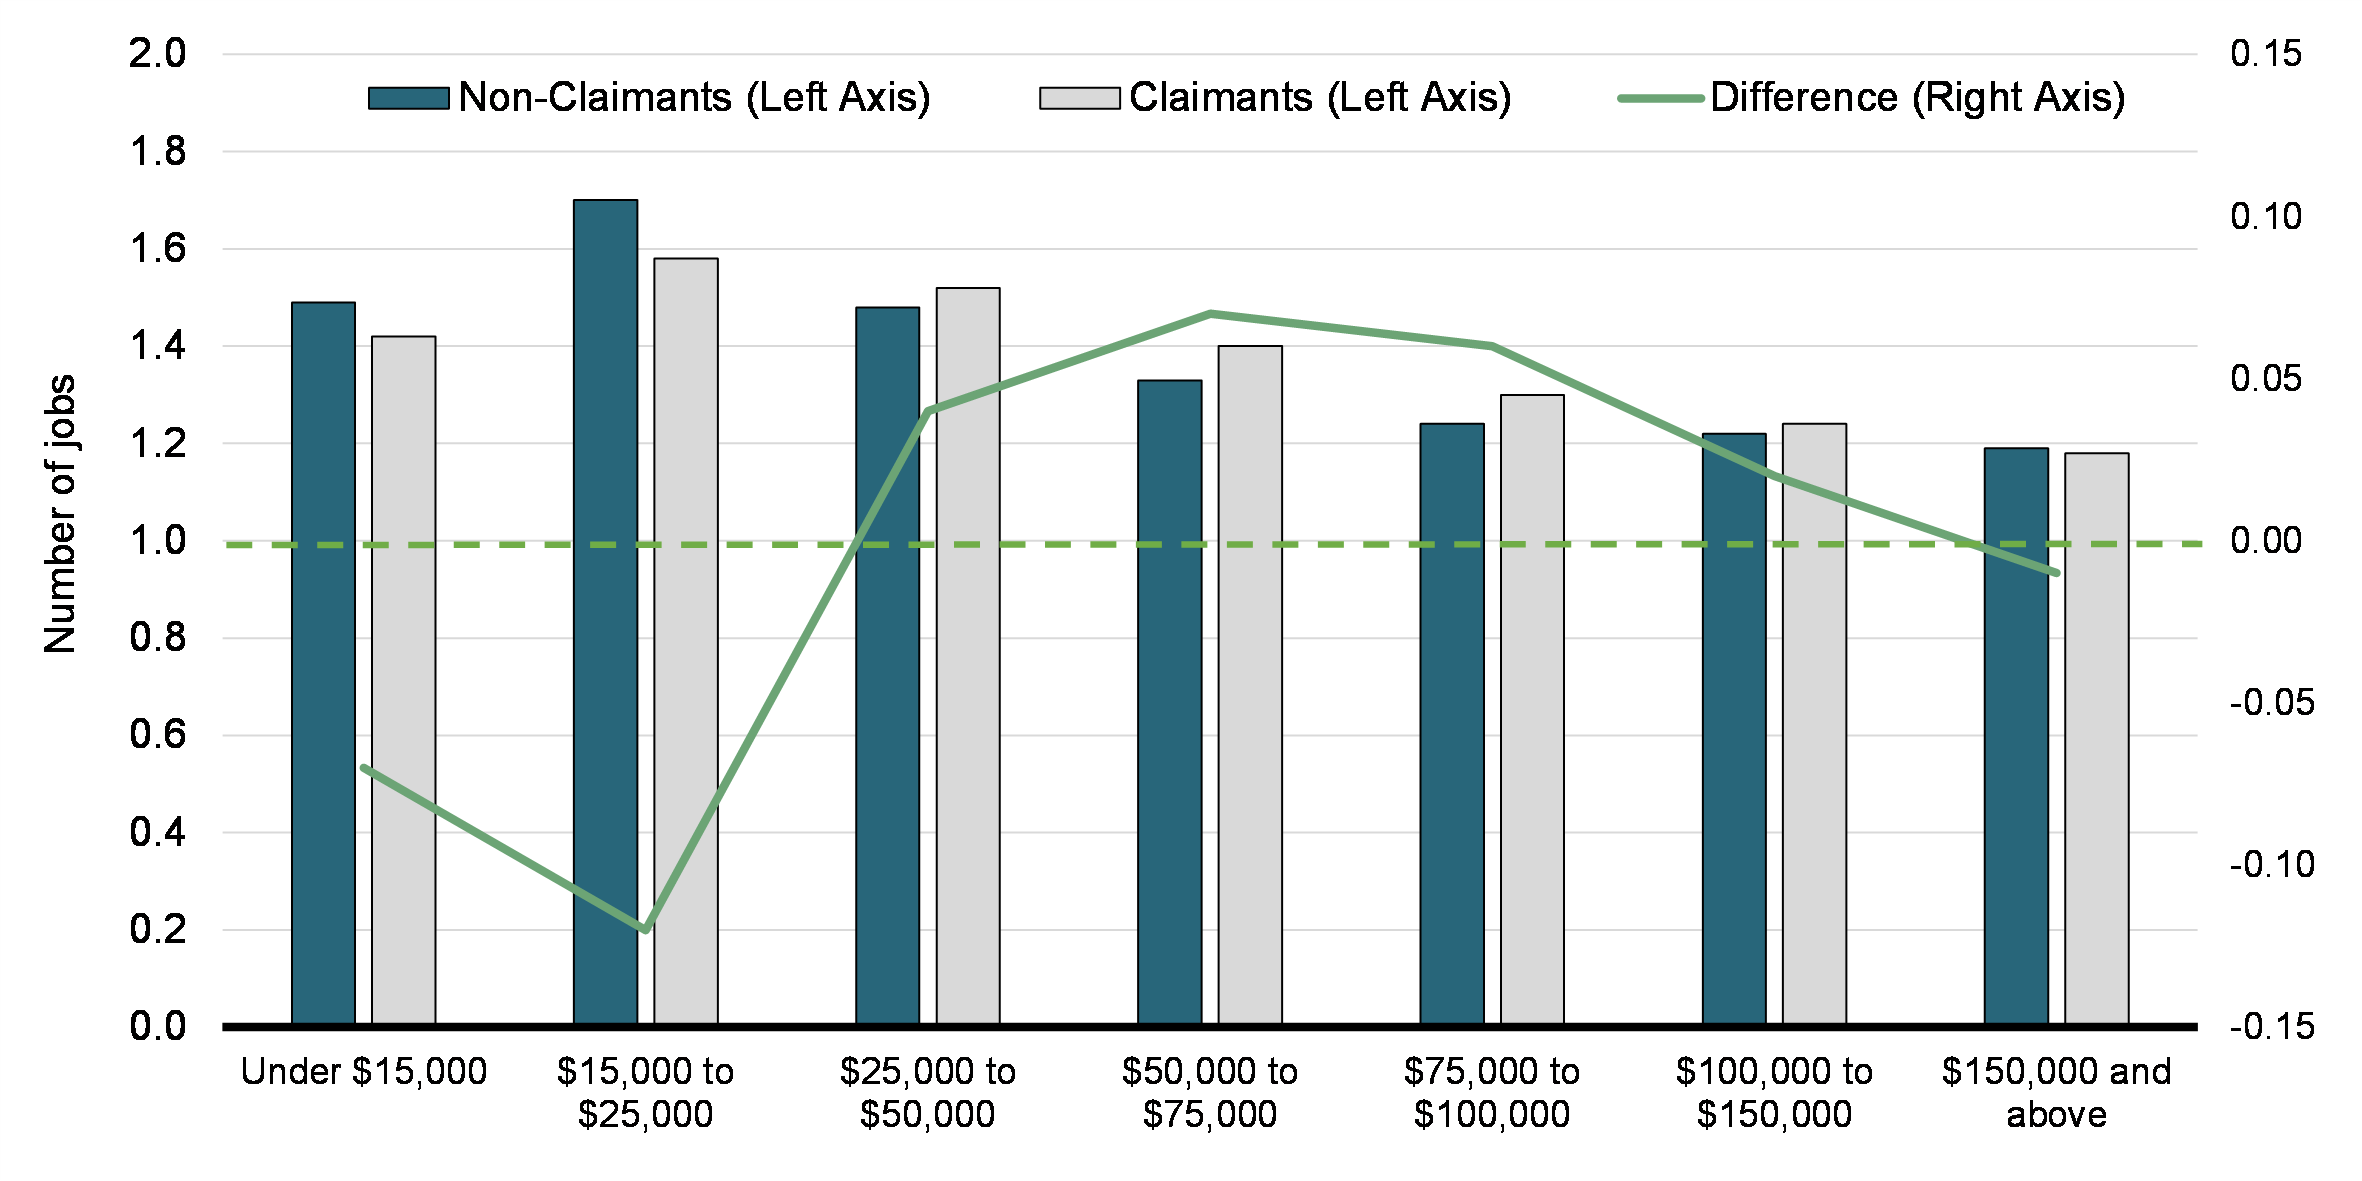
The number of jobs worked varies with T4 earnings (Chart 32). Among those earning $15,000 to $25,000 in employment income, claimants worked 1.58 jobs compared to 1.7 among non-claimants. However, among those earning more than $150,000 in employment income, claimants and non-claimants worked similar averages of 1.18 and 1.19 jobs, respectively.
Average Number of Jobs by Earnings Group, for OEE Claimants and Non-Claimants (2019)
By industry, the number of jobs worked by claimants ranged from a low of 1.21 in finance and insurance, to a high of 1.64 in accommodation and food services (Chart 33). Among non-claimants, the range was from 1.19 in utilities to 1.66 in accommodation and food services. The largest differences between claimants and non-claimants were observed in administrative and support, waste management and remediation services (1.44 vs.1.65) and agriculture, forestry, fishing and hunting (1.50 vs 1.36).
Average Number of Jobs by 2-Digit NAICS Industry, for OEE Claimants and Non Claimants (2019)
Average Earnings and Income
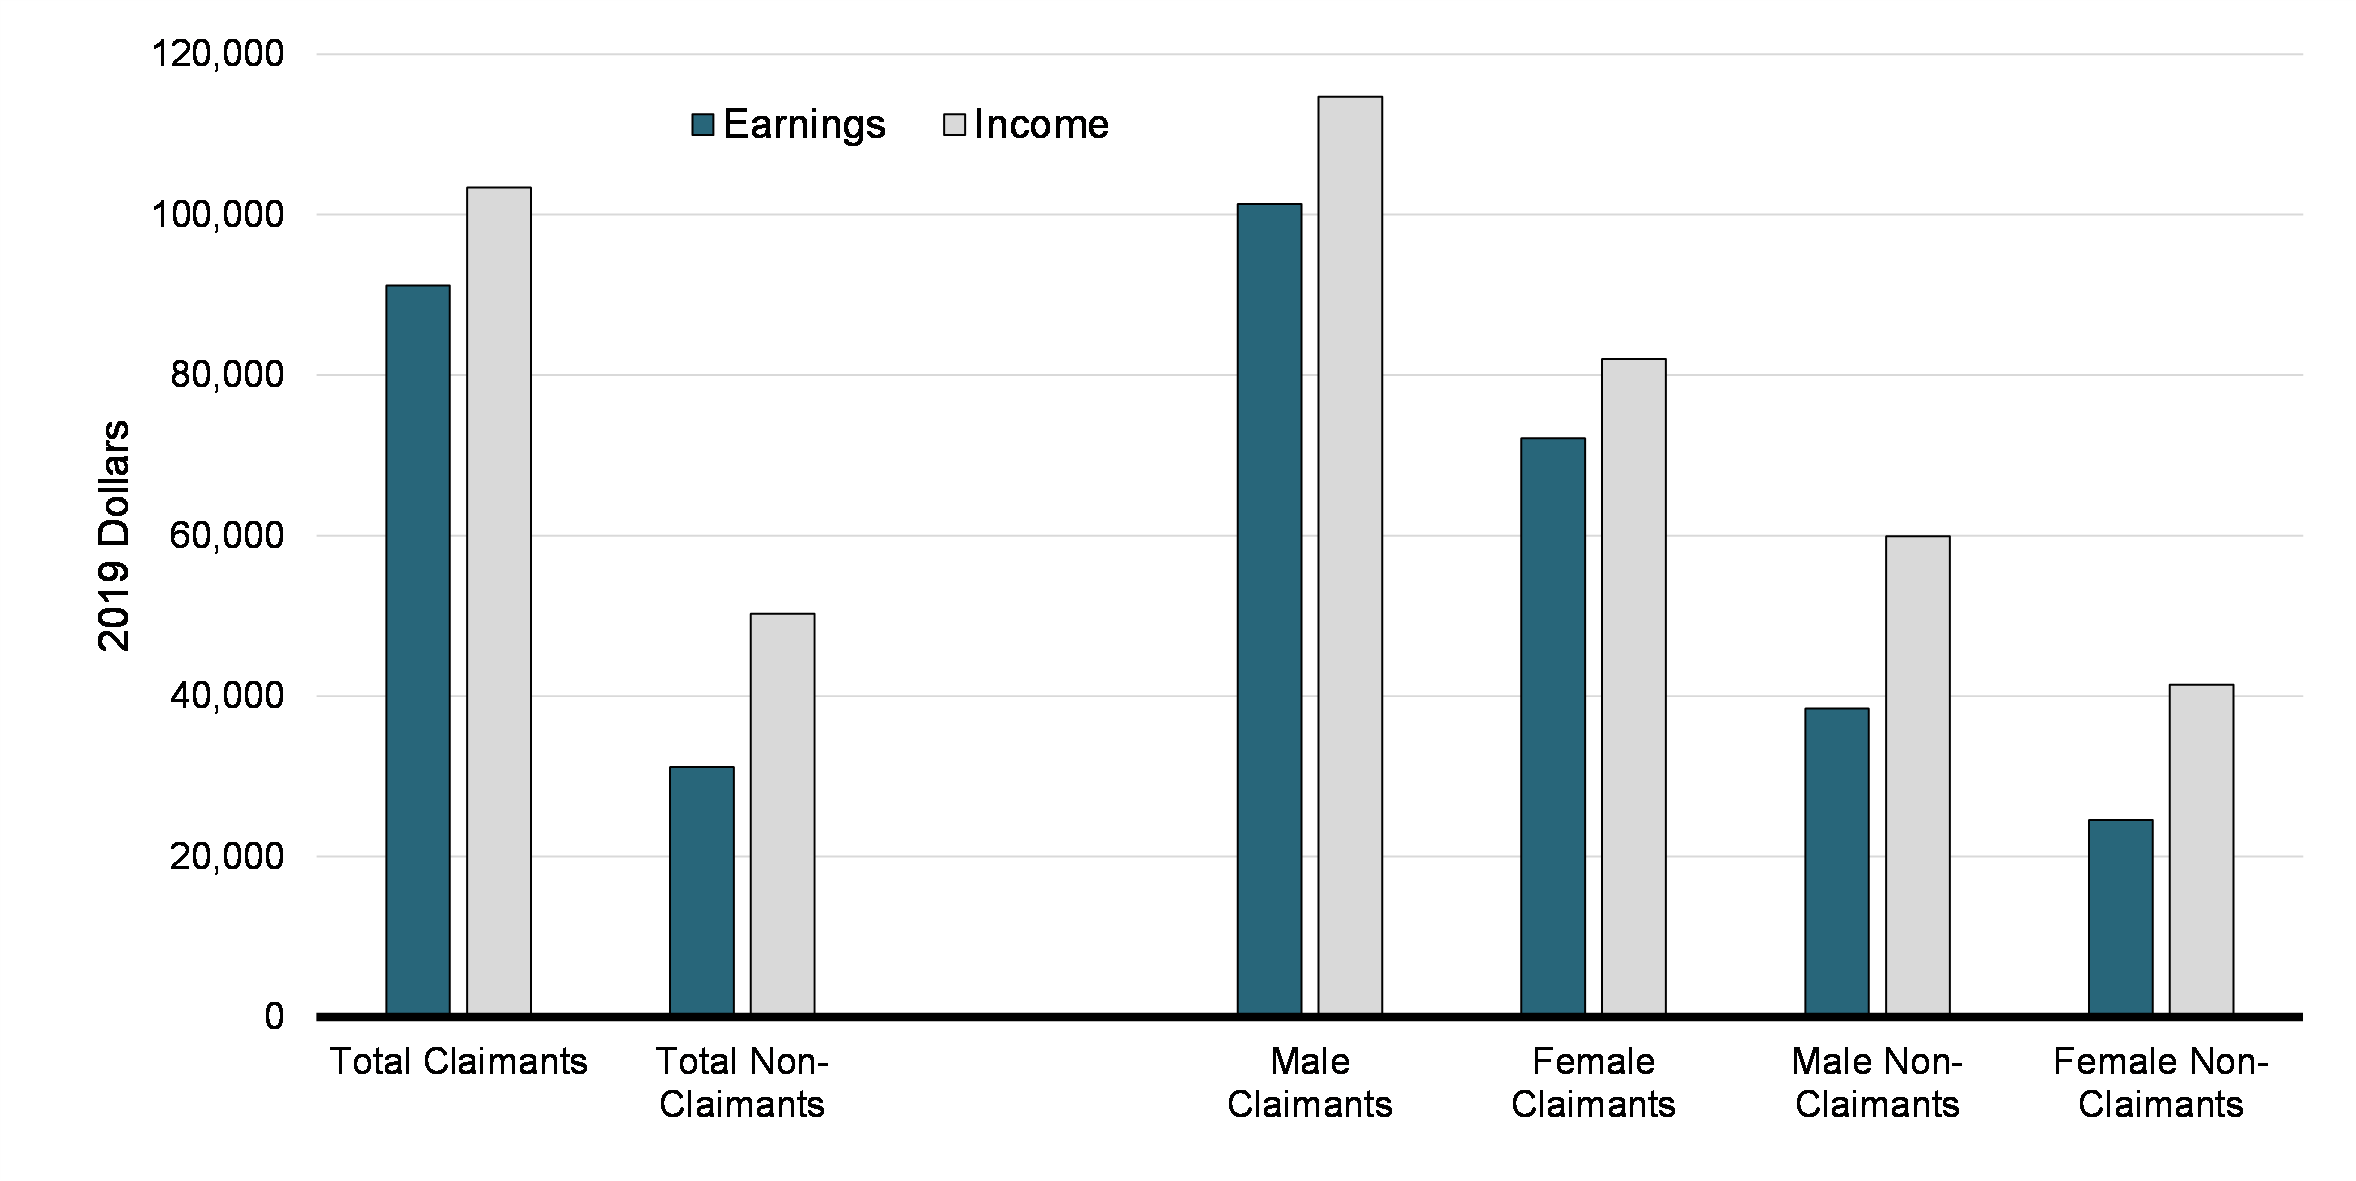
As shown in Chart 34, claimants were found to have twice as much total income in 2019 as their non-claimant counterparts ($103,365 vs. $50,255). In addition, the share of employment income within total income was greater for those claiming OEE (88.5% vs. 55.9%). This was true among both men and women, though women typically reported less total income than men ($82,009 vs. $114,732 among claimants, and $41,447 vs. $59,910 among non-claimants).
Average Earnings and Income, by OEE Claimant Status and Gender (2019)
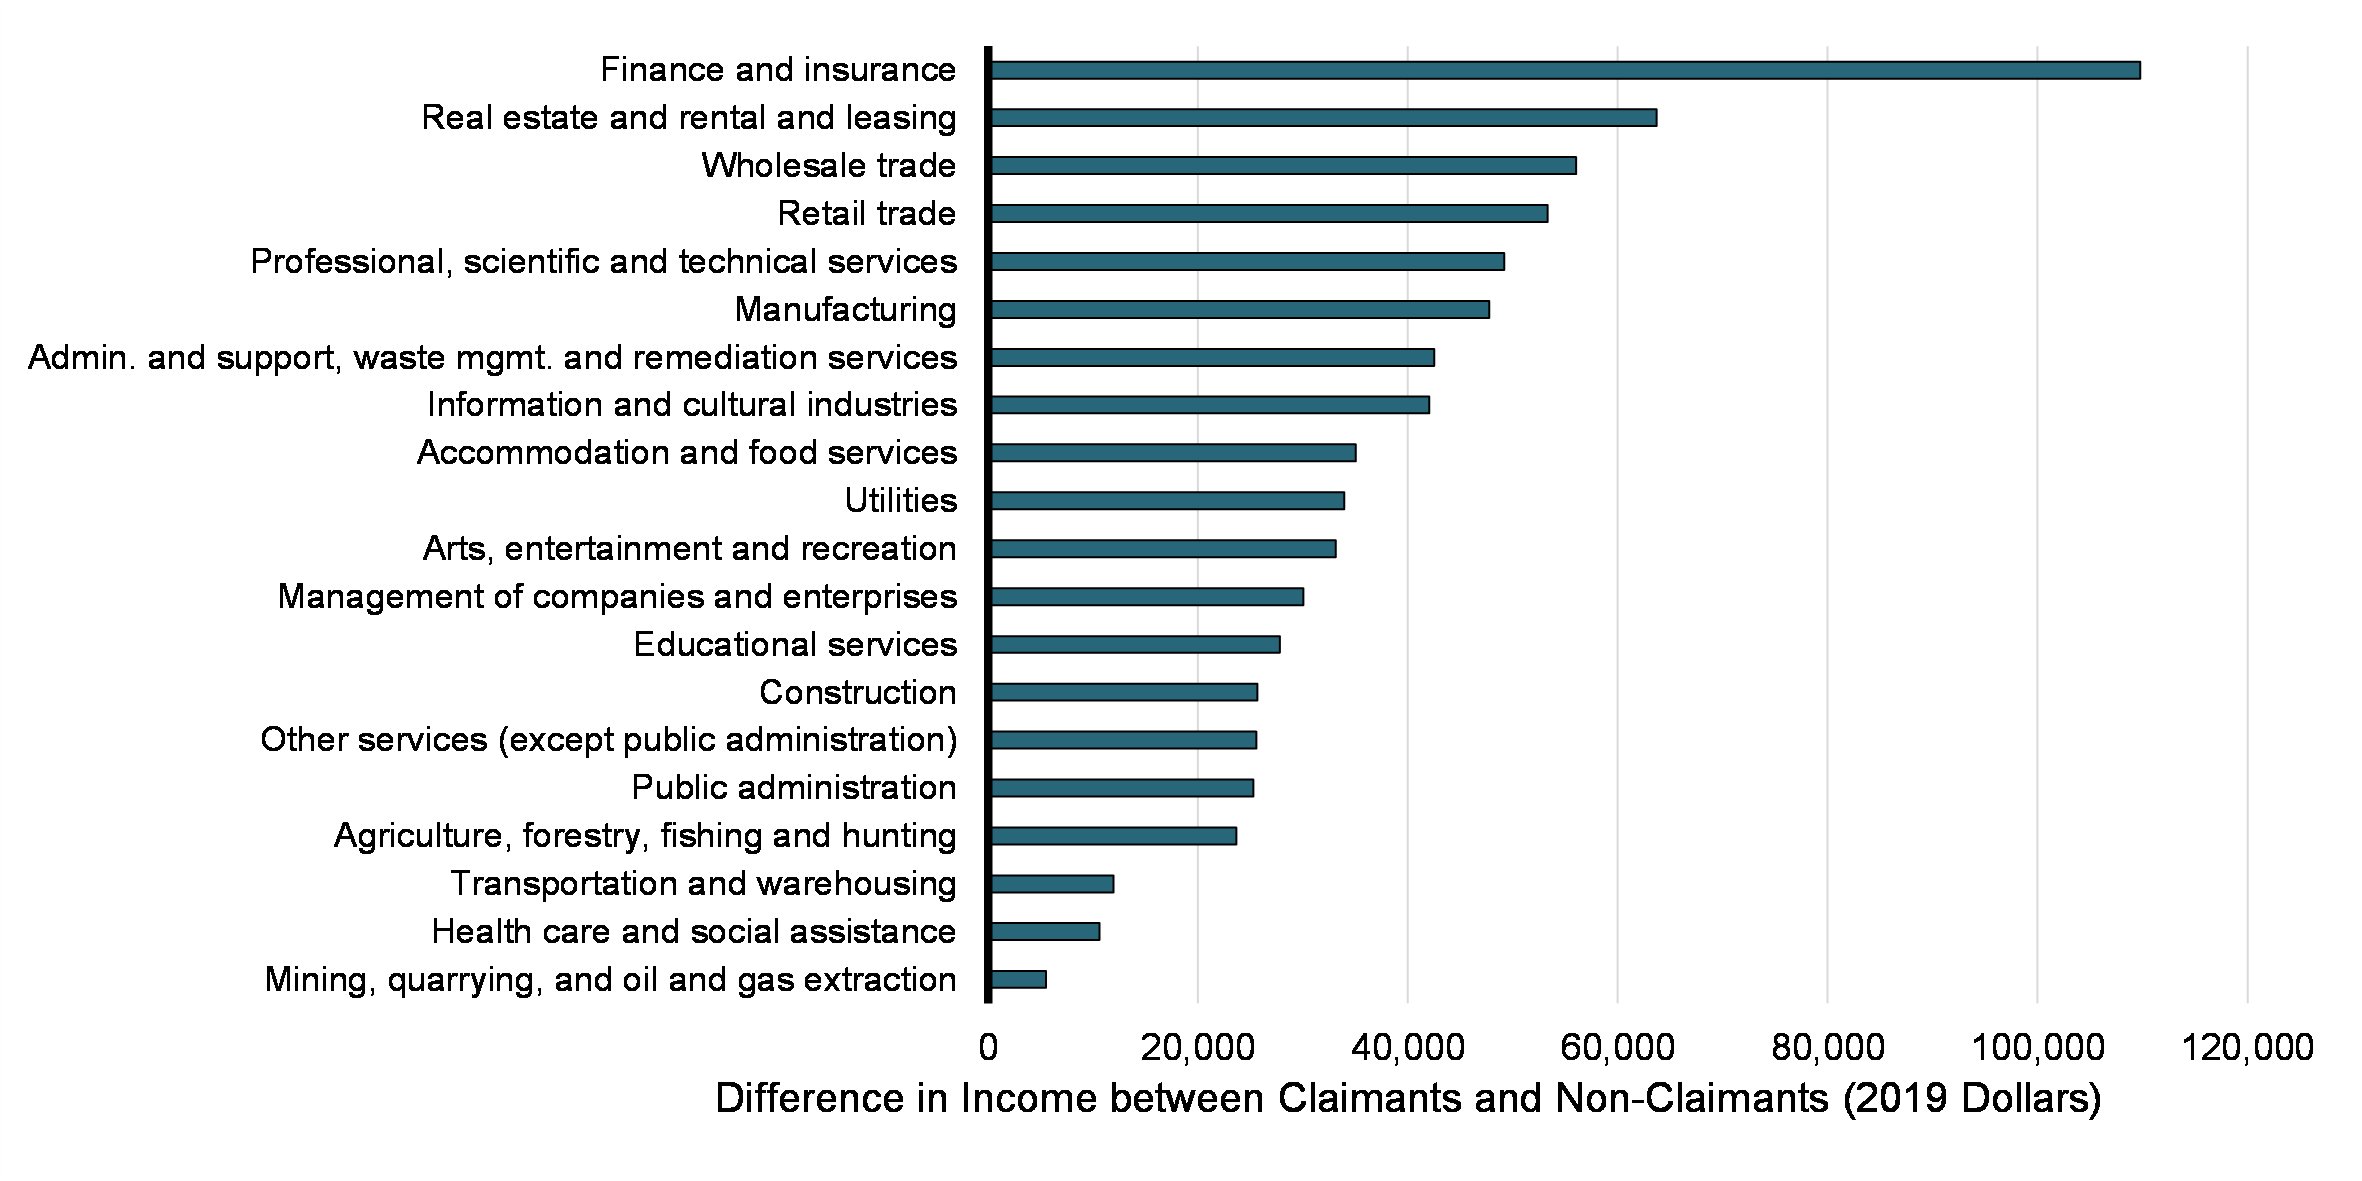
At the industry level, OEE claimants had greater total income than their non-claimant counterparts. The gap in total income between claimants and non-claimants was largest in finance and insurance ($206,971 vs $97,190), and narrowest in mining, quarrying, and oil and gas extraction ($129,663 vs. $124,169). The difference in total income between OEE claimants and non-claimants by industry is shown in Chart 35.
Difference in Average Incomes between OEE Claimants and Non-Claimants, by 2-Digit NAICS Industry (2019)
Taken together, these results suggest that the presence of employment expenses may promote attachment to an individual job: across many of the dimensions considered, claimants worked somewhat fewer jobs on average. Moreover, the jobs in question tend to be better remunerated and form a greater part of a claimant’s overall income.
5.4 Benefits
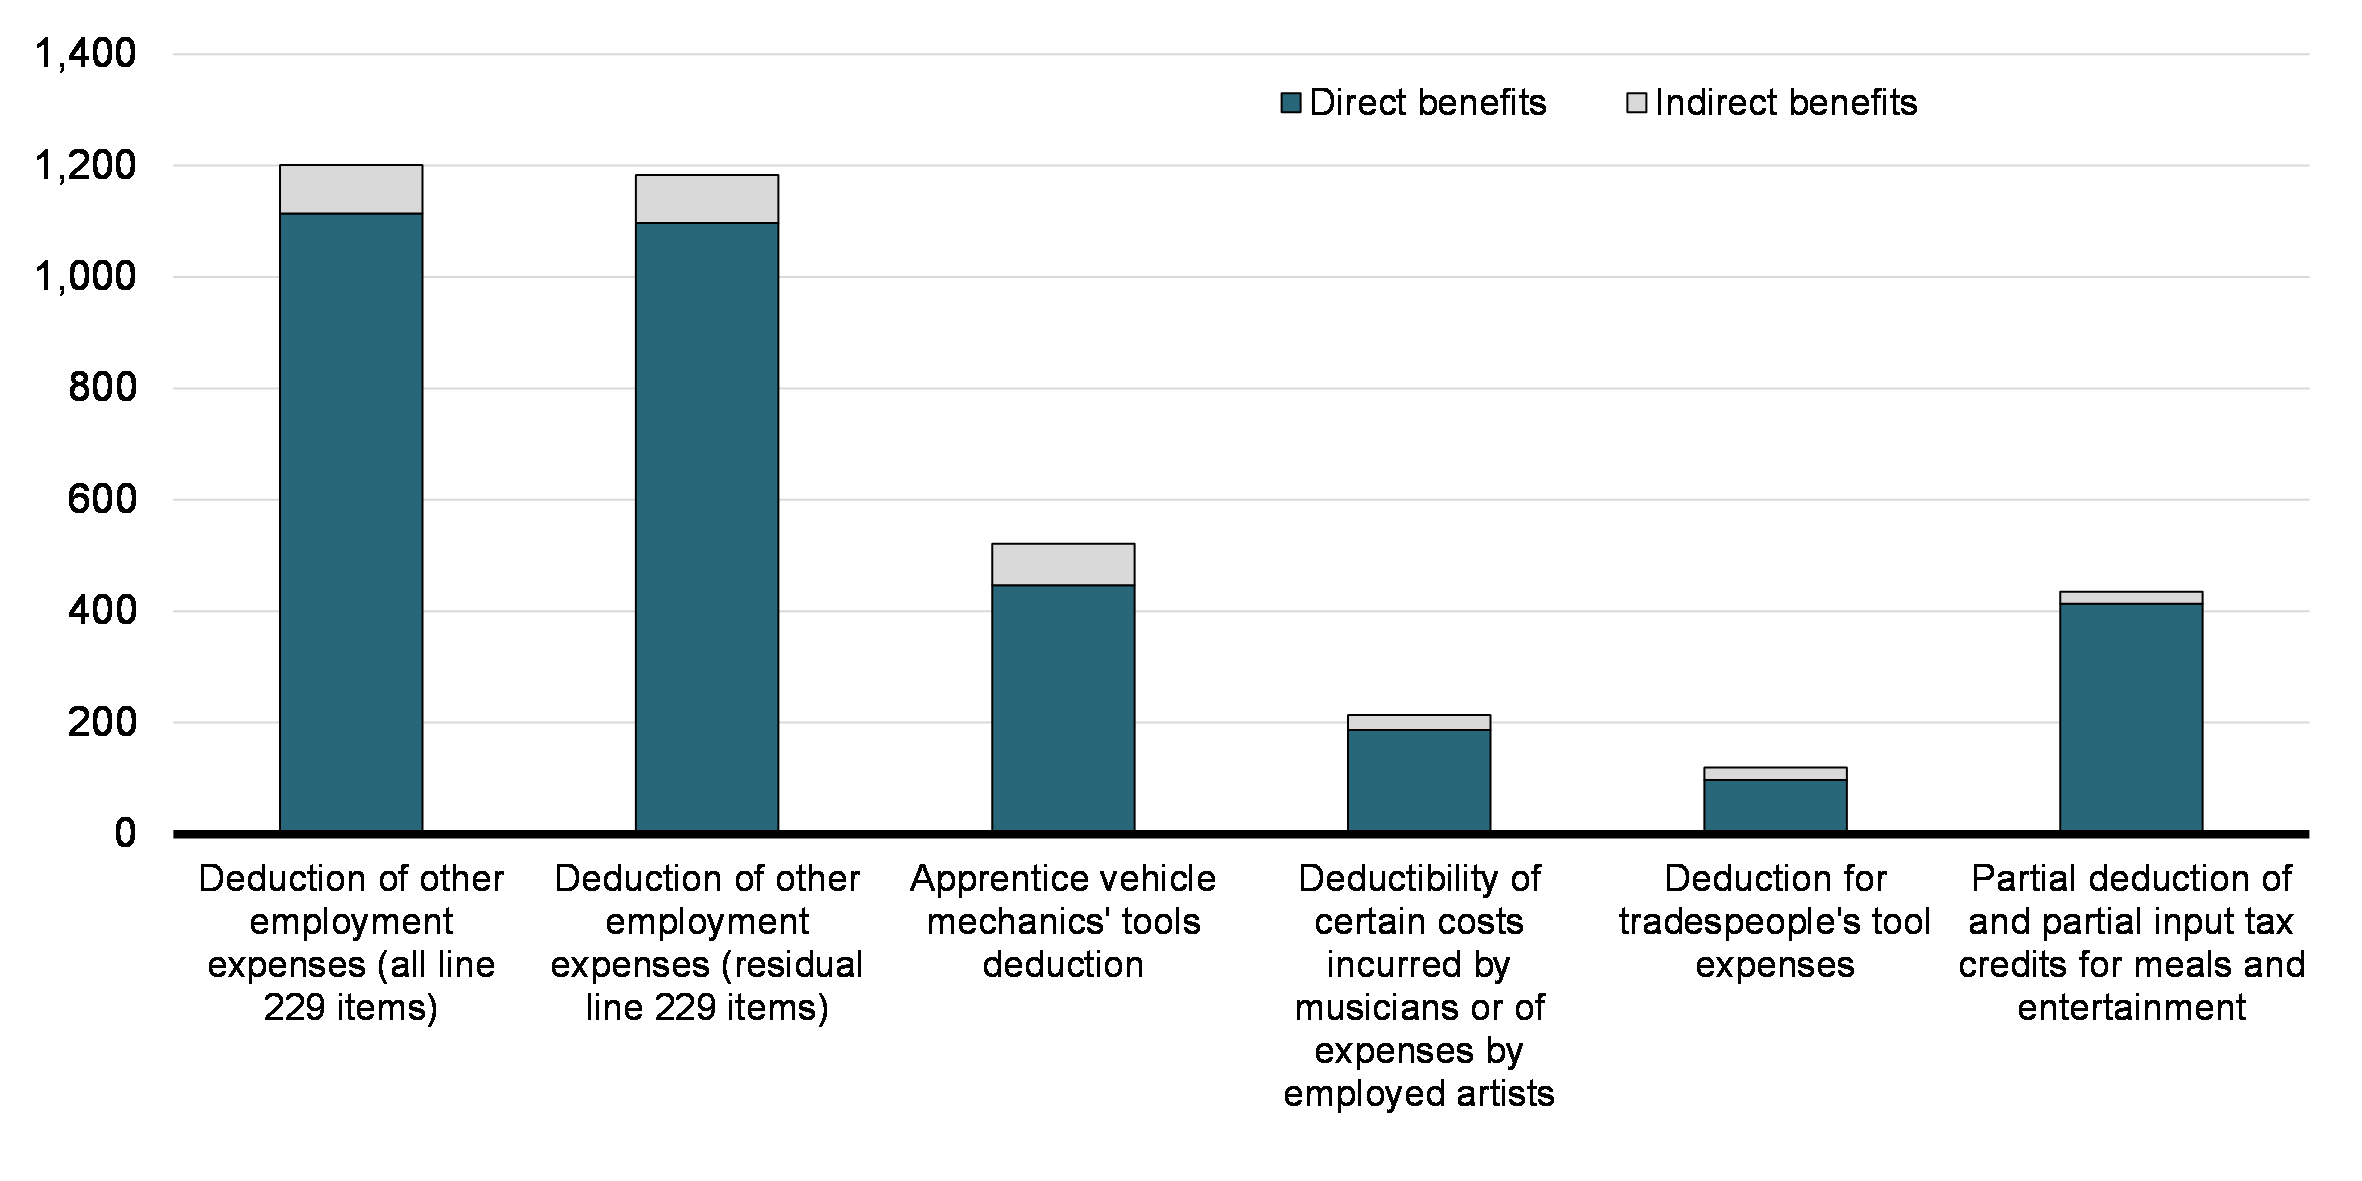
Benefits are calculated as the difference in tax payable that results from claiming OEE – see Section 3 for more detail. Chart 36 presents the mean direct and indirect benefits.Footnote 14 for the OEE deductions as a whole and for the component measures (see footnote 2). The overall mean benefit stood at $1,201 in 2018, 93% of which was direct. With respect to its components, the average total benefit was $521 for the apprentice vehicle mechanics’ tools deduction, $214 for the deductibility of certain costs incurred by musicians or of expenses by employed artists, $120 for the deduction for tradespeople’s tool expenses, $435 for the partial deduction of and partial input tax credits for meals and entertainment, and $1,183 for the remaining items of line 229 (i.e., the deduction of other employment expenses measure described elsewhere in this report).
Direct and Indirect Benefits of OEE Deductions, Overall and by Component (2018), in 2019 Dollars
As shown in Chart 37, men received larger benefits than women on average ($1,392 vs. $832). Although the vast majority of benefits were direct for both genders, the indirect share was slightly higher for women compared to men (9% vs. 6.7%). Benefits were also found to be larger among the population aged 35 and over, but there are no significant differences in benefits between the different age groups beyond this cut-off. However, the share of indirect benefits varied with age: they represented a larger share of total benefits for beneficiaries aged between 25 and 54 years old, but an insignificant share among other age groups.
Direct and Indirect Benefits of OEE Deductions, by Gender and Age Group (2018), in 2019 Dollars
By income group, there was wide variation in total benefits received. As shown in Chart 38, beneficiaries with $150,000 or more of total income received $3,211 in total benefits on average, while those with less than $15,000 in total income received an average of $81. However, indirect benefits were a negligible share of the overall benefits received by high-income beneficiaries, but the vast majority of total benefits for individuals is in the lower income groups.
Direct and Indirect Benefits of OEE Deductions, by Income Group (2018), in 2019 Dollars
Finally, Chart 39 shows that benefits also varied considerably by industry of occupation. Benefits were found to be largest in the finance and insurance industry, which also had the largest average claims. There was, however, little variation in the shares of direct and indirect benefits, with direct benefits always representing the majority of benefits.
Direct and Indirect Benefits of OEE Deductions, by 2-Digit NAICS Industry (2018), in 2019 Dollars
6. Conclusion
To summarize the findings, the average UPD deduction claimed increased slightly between 2000 and 2019, while the share of claimants in the overall population of taxfilers decreased. Claims are generally associated with higher incomes, and made by workers between 35 and 54 years old. In 2019, men and women were as likely to claim this deduction, but men were more likely to claim it in the past. Workers in the public administration sector are the most likely to claim it. Among claimants, the large majority have at least one job where they pay union dues. However, that share varies widely between industries. For example, more than half of workers in the professional, scientific and technical services industry who claim the UPD deduction are claimants of professional dues only. Finally, UPD claimants tend to have higher earnings and total income than non-claimants. Among the group of claimants, those who claim professional dues only tend to have higher incomes. Among beneficiaries of the UPD, average benefits stood at about $185 in 2018 (in 2019 dollars). About 87% of these benefits were direct benefits on average.
For its part, the average claim for OEE has declined somewhat over the period of observation. Claims are generally associated with higher income, and are more likely to be made by men, workers aged 25 and above, and those working in transportation and warehousing. When a T777 is filed, the most common expenses are for allowable motor vehicles. The evidence also suggests that claimants worked somewhat fewer jobs on average than their non-claimant counterparts. On average, OEE beneficiaries received $1,201 in benefits, 93% of which were direct, though this share varies with income and age.