
Report on Federal Tax Expenditures - Concepts, Estimates and Evaluations 2024: part 8
Archived - Report on Federal Tax Expenditures - Concepts, Estimates and Evaluations 2024: part 8
Gender-Based Analysis Plus of Federal Tax Expenditures Related to Pension and Retirement Savings PlansFootnote 1
1. Introduction
Federal tax expenditures include several measures that encourage and assist Canadians to save for retirement. Deferrals of tax are provided on savings in Registered Pension Plans (RPP), Pooled Registered Pension Plans (PRPP), Registered Retirement Savings Plans (RRSP), and the Saskatchewan Pension Plan (SPP).Footnote 2 Contributions to one of these private pension and retirement savings plans are deductible from income. Investment income is not taxed as it accrues in these plans, but withdrawals and benefit payments are generally included in income for tax purposes. The main objective of these tax measures is to help Canadians generate sufficient retirement income to maintain pre-retirement living standards. These measures also aim to improve the efficiency of the tax system by providing greater neutrality in the tax treatment of consumption and saving, while also encouraging investment and economic growth.
Recent T1 return data provides information on current-year deductible contributions made to, and taxable withdrawals made from, registered plans. However, no information is available on investment income earned over time in such plans. Because of this data limitation, previous Gender-based Analysis Plus (GBA Plus) studies of federal personal income tax (PIT) expenditures excluded the analysis of measures related to pension and retirement savings plans. This project attempts to fill this gap by examining the profile of individuals who claim the available tax exemptions and deductions for their contributions to RPPs and RRSPs,Footnote 3 and by proposing assumptions to estimate the lifetime tax benefitsFootnote 4 associated with these contributions. Such estimations enable us to identify the groups that especially benefit from these tax expenditures from a taxation standpoint and verify whether a particular genderFootnote 5 or other identity groups benefit proportionally more or less than others.
The study begins in Section 2 by providing background information on Canada's retirement income system and on the available federal PIT expenditures related to pension and retirement savings plans. Section 3 continues by presenting the data source used in this analysis and by examining the profile of taxfilers who claimed available tax exemptions and deductions for their contributions to RPPs and RRSPs in 2019 (i.e., before the coronavirus pandemic hit the economy). Section 4 then discusses a methodology to estimate the lifetime tax benefits of current-year RPP/RRSP contributions, examine the distribution of such benefits between groups, and identify the groups that especially benefit from these tax expenditures.
2. Background information
The general objectives of Canada's retirement income system are to prevent seniors from experiencing a significant drop in their standard of living after retirement and to prevent them from living in poverty. The system comprises three pillars. The first pillar consists of the Old Age Security and Guaranteed Income Supplement public programs, both of which are paid to eligible recipients using general federal government revenues. The second consists of Canada Pension Plan or Québec Pension Plan pension benefits, which are mandatory public workplace pension plans that are paid for by employers and workers. The third pillar, which is the focus of the current study, includes retirement savings in workplace pension plans (e.g., RPPs) that are paid for by employers or workers, as well as retirement savings in other voluntary private savings vehicles, such as RRSPs.Footnote 6
The federal government encourages private retirement savings by providing tax relief (through exemptions and deductions) on current-year contributions to private pension and retirement savings plans. Investment income in those plans is also generally not subject to individual income taxes when it is earned. Instead, taxes are paid when withdrawals are made from the plans. Taxes are thus generally deferred to retirement years. The contribution limits in those plans are designed to permit most individuals to save enough, over a 35-year career, to obtain a pension equal to about 70% of pre-retirement earnings.
Short descriptions of the private pension and retirement savings plans through which the federal tax system encourages retirement savings are provided in Table 1 below.
| Tax expenditures | Description | Contribution limits |
|---|---|---|
| Registered Pension Plans (RPP) | An RPP is a pension plan that is set up by an employer and registered by the Canada Revenue Agency, to provide employees with a pension when they retire. | For defined contribution RPP members, contributions are limited to 18% of employment earnings up to a specified dollar amount ($27,230 for 2019). For defined benefit RPP members, pension benefits are limited to 2% of employment earnings per year of service up to a specified dollar amount ($3,025.56 for 2019) |
| Registered Retirement Savings Plans (RRSP) | An RRSP is a retirement savings plan that individuals establish, that is registered by the government, and to which the individual or their spouse or common-law partner can contribute. | RRSP contribution limits are determined as 18% of prior-year earned income up to a specified dollar limit ($26,500 for 2019), less an adjustment for contributions made to an RPP and/or a Deferred Profit-Sharing Plan, plus unused contribution room carried forward from previous years. |
| Pooled Registered Pension Plans (PRPP) | A PRPP is a retirement savings option for individuals, including self-employed individuals, which provides investment options similar to those for other RPPs. A PRPP enables its members to benefit from lower administration costs that result from participating in a large plan, and it is portable from one job to another. | Contributions to PRPPs must be made within a PRPP member's available RRSP contribution limit. |
| Saskatchewan Pension Plan (SPP) | The SPP is a voluntary defined contribution pension plan created by the Government of Saskatchewan. | While the tax rules permit SPP contributions to be made within an SPP member's available RRSP contribution limit, the SPP restricts annual contributions to a specified maximum ($6,200 for 2019). |
|
Note: In the T1 return, RRSP, PRPP and SPP contributions are grouped together and claimed on the same line. Sources: Government of Canada websites, Government of Saskatchewan website and Department of Finance Canada, Report on Federal Tax Expenditures: Concepts, Estimates and Evaluations 2021, Section 2. |
||
The RPP and RRSP limits are integrated to provide comparable retirement savings opportunities whether an individual saves in an RPP, an RRSP or both. Unused RRSP room may be fully carried forward to future years. The more an individual earns during their working life, the more they will need to save in private savings vehicles to reach a sufficiently high income replacement rate in retirement.
3. Statistical profile of taxfilers who claim RPP/RRSP contributions
3.1 Data source
This GBA Plus is primarily based on 2019 T1 return data – the Income Tax and Benefit Return and schedule 7. T1 return data represents the most complete source of information on Canadian taxfilers, and 2019 is the most recent tax year before the coronavirus pandemic hit the economy.Footnote 7 While taxfilers can contribute to several available pension and retirement savings plans, T1 return data captures contributions made to these plans in only two distinct categories. They can claim a deduction for their personal contributions made to an RPP as well as for their total contributions made to their personal RRSP, PRPP, or SPP, or the RRSP or SPP of their spouse or common-law partner.Footnote 8 Because employers' contributions to taxfilers' RPP and PRPP are non-taxable benefits, they are not accounted for in the calculation of taxfilers' taxable income. However, these amounts must be reported for information purposes in the taxfilers' T1 returns. It is thus possible to also consider the fiscal impact of these tax-exempt employer contributions.
3.2 General profile of taxfilers who claim RPP/RRSP contributions
Among the 28.9 million Canadians who filed a T1 return for the 2019 tax year, about 10 million (or 34.5%) claimed positive amounts of RPP and/or RRSP-PRPP-SPP contributions to which a tax deduction or exemption was appliedFootnote 9 (in this study, these taxfilers are called RPP/RRSP claimants). According to Table 2, more than 6.7 million taxfilers claimed RPP contributions and about 6.2 million claimed RRSP contributions. As Figure 1 indicates, there is an overlap between RPP and RRSP claimants.
The amount of claimed contributions made to RPPs/RRSPs totaled $119,831 million. Of this total, 61.7% were RPP contributions, including both employer and employee contributions. The average amount of contributions claimed by the 6.7 million RPP claimants was $11,000. In comparison, the 6.2 million RRSP claimants claimed an average amount of $7,500. In Table 2, a distinction between employer and employee RPP contributions indicates that employer contributions represent the largest part of total RPP claimed amounts (65.9%). Figure 2 suggests that about three quarters of taxfilers who claimed RPP contributions claimed both employer and employee contributions (75.7%).
| RPP or RRSP claimants | RPP – employer | RPP – employee | Total RPP claimants | PRPP – employer | RRSP -individual | Total RRSP claimants | |
|---|---|---|---|---|---|---|---|
| Total number (#) | 9,960,100 | 6,622,500 | 5,232,200 | 6,747,100 | 11,000 | 6,150,900 | 6,153,800 |
| Percentage (%) of all taxfilers | 34.5 | 22.9 | 18.1 | 23.3 | 0.04 | 21.3 | 21.3 |
| Total amount of claims ($ million) | 119,831 | 48,729 | 25,183 | 73,911 | 36 | 45,883 | 45,920 |
| Average amount of claims per claimant ($) | 12,000 | 7,400 | 4,800 | 11,000 | 3,300 | 7,500 | 7,500 |
|
Note: Totals may not add up due to rounding or overlaps between groups. Source: T1 return data. |
|||||||
Distribution of taxfilers by RPP/RRSP claimed contributions, 2019

Distribution of RPP claimants by employer-employee contributions, 2019
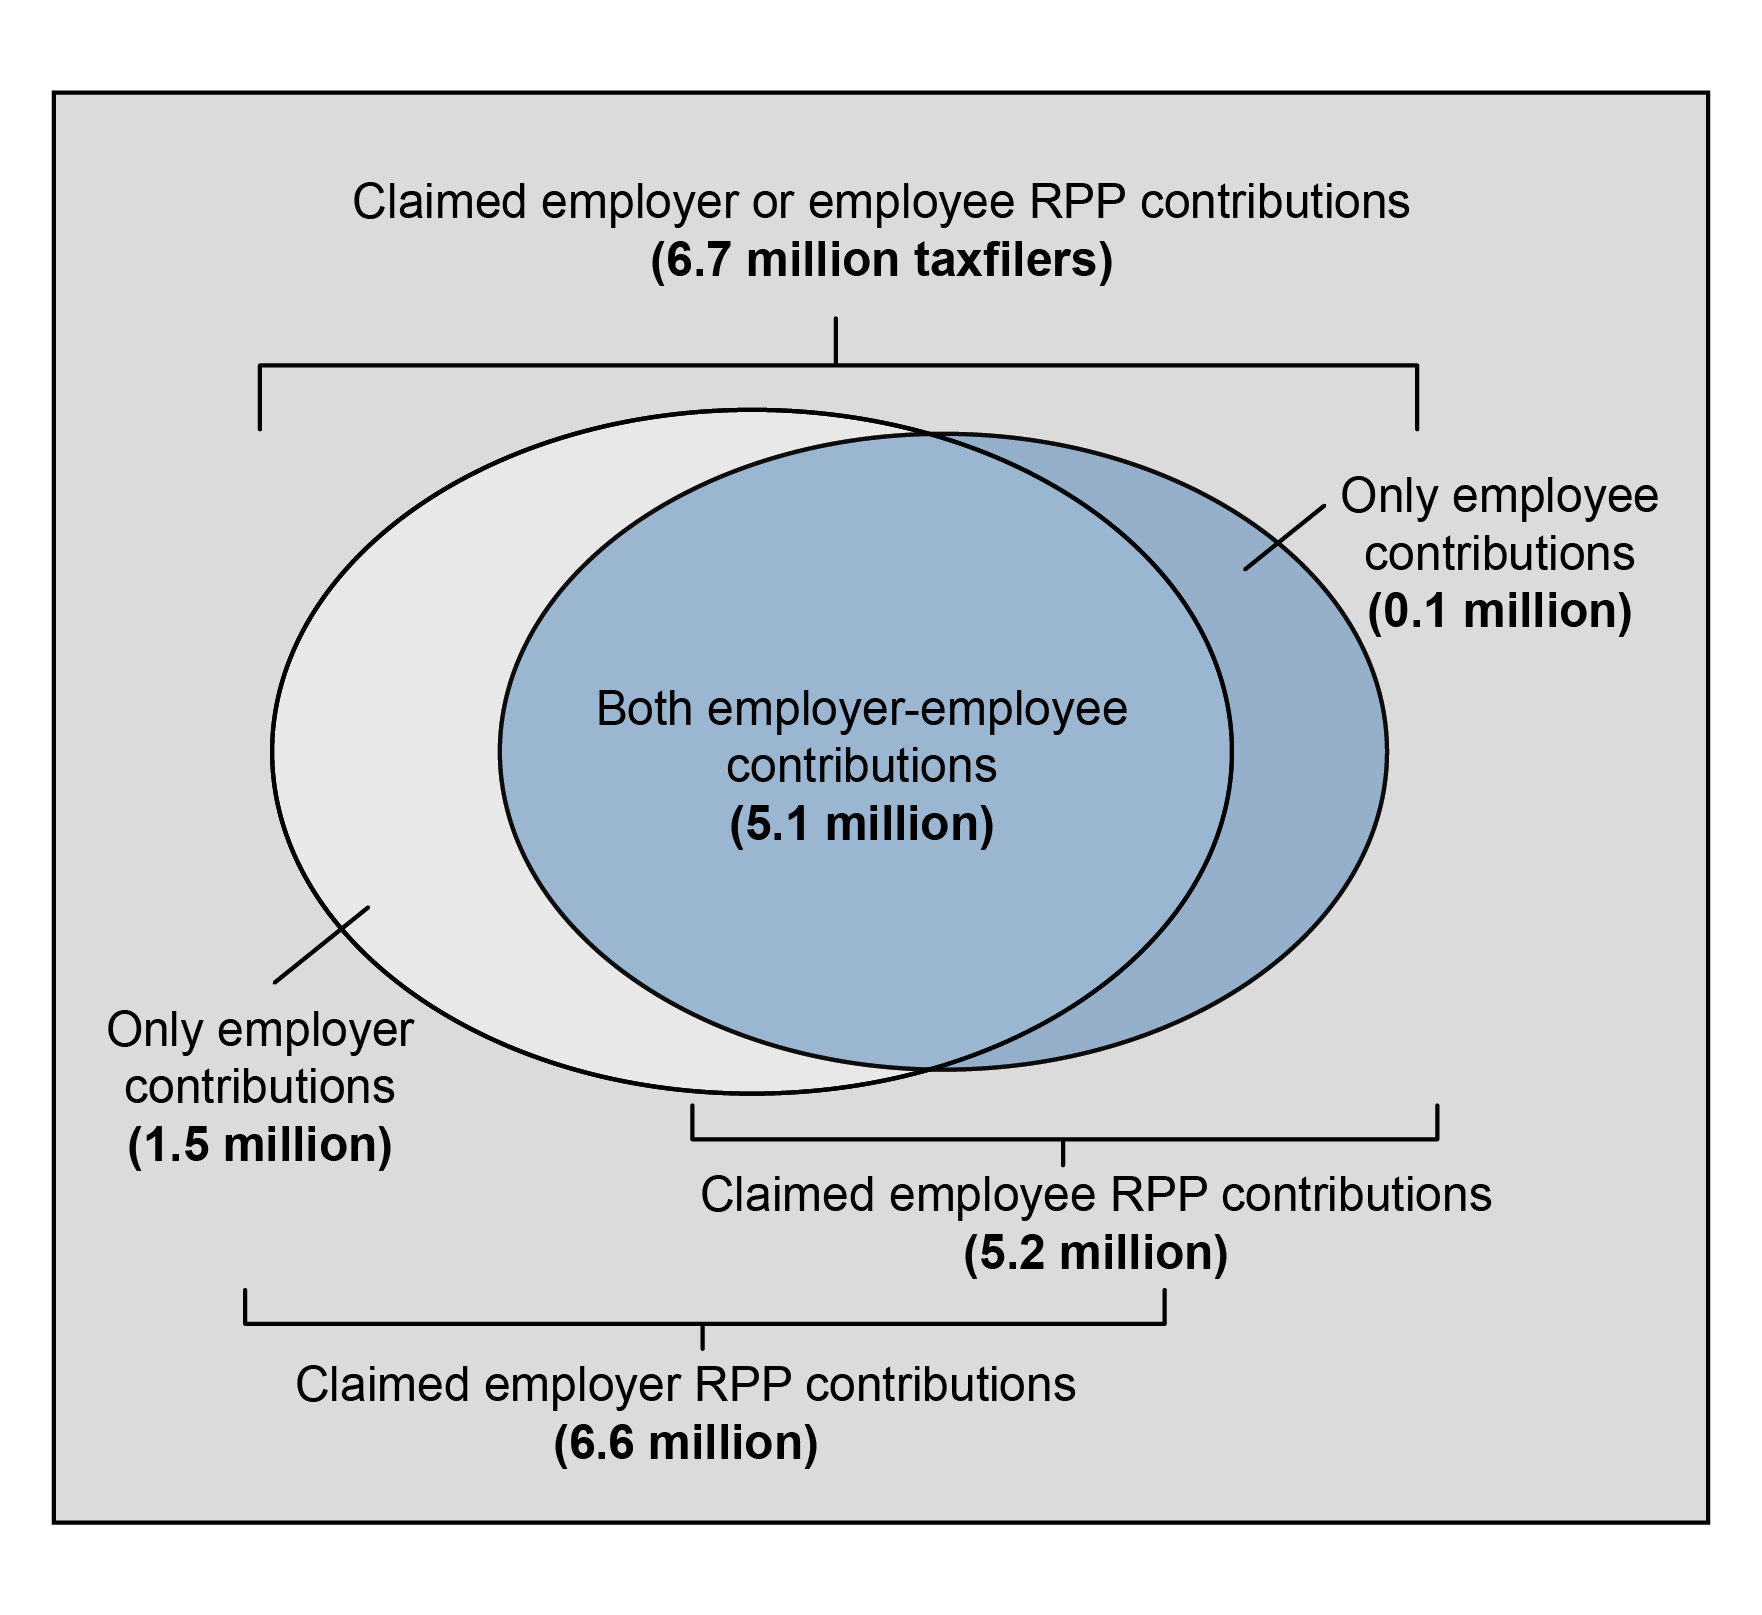
Table 3 compares the demographic and socioeconomic profile of taxfilers who claimed RPP/RRSP contributions to that of all taxfilers. It suggests that men were slightly overrepresented among RPP/RRSP claimants. This is attributed to the relatively more important proportion of men who claimed RRSP contributions, since the gender distribution of RPP claimants is similar to that of all taxfilers.
The age profile of RPP/RRSP claimants differs considerably from that of all taxfilers. Both RPP and RRSP claimants were more highly concentrated in the 30 to 64 years age bracket, although RRSP claimants were slightly older on average than RPP claimants (46.3 years versus 43.7 years). In accordance with their age profile, unattached individuals were underrepresented among RPP/RRSP claimants whereas individuals in a couple with children were overrepresented among them.
Table 3 also highlights that, compared to all taxfilers, RPP/RRSP claimants have a distinctive socioeconomic profile. Their average pre-tax income (personal and family income) was more than 1.5 times higher than that of all taxfilers and they were more likely to be part of the top two income quintiles. They were also more likely to be salaried workers than other filers.
| All taxfilers | RPP or RRSP claimants | RPP claimants | RRSP claimants | |
|---|---|---|---|---|
| Distribution by gender* (%) | ||||
| Men | 48.5 | 51.0 | 48.8 | 53.5 |
| Women | 51.5 | 49.0 | 51.2 | 46.5 |
| Average age (yrs.) | 48.8 | 44.8 | 43.7 | 46.3 |
| Distribution by age group** (%) | ||||
| Under 30 years | 19.8 | 13.4 | 14.5 | 10.1 |
| From 30 to 39 years | 16.7 | 23.5 | 24.6 | 22.5 |
| From 40 to 49 years | 15.4 | 24.3 | 25.4 | 24.6 |
| From 50 to 64 years | 24.8 | 33.9 | 32.6 | 36.8 |
| 65 years or more | 23.3 | 5.0 | 2.9 | 6.1 |
| Distribution by family type (%) | ||||
| Sole filer (filer not in a couple) | 40.7 | 30.2 | 30.8 | 28.0 |
| Sole parent | 3.5 | 4.0 | 4.6 | 3.2 |
| In a couple without children | 36.5 | 35.0 | 32.4 | 38.3 |
| In a couple with children | 19.3 | 30.7 | 32.2 | 30.6 |
| Average amount of personal pre-tax income ($) | 51,800 | 85,600 | 81,000 | 95,700 |
| Distribution by personal pre-tax income group*** (%) | ||||
| 1st quintile (under $13,563) | 20.0 | 2.4 | 2.5 | 1.1 |
| 2nd quintile (from $13,563 to $26,376) | 20.0 | 5.1 | 4.5 | 3.9 |
| 3rd quintile (from $26,377 to $45,246) | 20.0 | 17.2 | 15.8 | 15.2 |
| 4th quintile (from $45,247 to $73,732) | 20.0 | 32.1 | 32.8 | 31.0 |
| 5th quintile (above $73,732) | 20.0 | 43.2 | 44.3 | 48.8 |
| Average amount of adjusted family pre-tax income ($) | 60,000 | 90,100 | 84,700 | 100,400 |
| Distribution by adjusted family pre-tax income group**** (%) | ||||
| 1st quintile (under $18,348) | 20.0 | 3.0 | 3.4 | 1.2 |
| 2nd quintile (from $18,348 to $33,637) | 20.0 | 7.6 | 7.2 | 5.8 |
| 3rd quintile (from $33,638 to $54,148) | 20.0 | 19.7 | 19.1 | 17.7 |
| 4th quintile (from $54,149 to $83,918) | 20.0 | 30.8 | 31.7 | 30.4 |
| 5th quintile (above $83,918) | 20.0 | 39.0 | 38.5 | 44.9 |
| Distribution by working status (%) | ||||
| Salaried workers | 62.4 | 93.8 | 98.5 | 91.5 |
| Self-employed workers only | 5.9 | 2.8 | 0.1 | 4.5 |
| Non-workers (i.e., no employment income) | 31.8 | 3.3 | 1.4 | 4.0 |
|
Notes: *Data includes a few cases for which the taxfiler's gender is unknown. The distributions by gender were calculated excluding these missing observations. ** In Canada, the age limit for RRSP contributions is 71 years old. ***Pre-tax income includes all income for federal tax purposes plus the non-taxable portion of capital gains, less the gross-up of dividends received, the split income amounts transferred from a spouse, the net capital losses incurred during the year and those carried over from prior years. **** Adjusted family income is a more appropriate indicator of the socioeconomic status of individuals since it accounts for the fact that family needs increase with family size. In the current study, the adjusted family income of an individual was obtained by dividing their total pre-tax family income by the square root of their family size. Results may not add up to 100% due to rounding. Source: T1 return data. |
||||
However, due to the progressivity of the federal personal income tax system, the ratio of the average amount of net federal tax payable by RPP/RRSP claimants relative to that of all taxfilers (see Table 4) is larger than the 1.5 ratio of average incomes noted in Table 3. The percentage of RPP/RRSP claimants with a non-zero amount of net federal tax payable in 2019 was not only considerably higher than among all taxfilers (95.1% compared to 67.1%), but the average amount of net federal tax payable by this last group was also significantly higher ($11,400 versus $8,200).
| All taxfilers | RPP or RRSP claimants |
RPP claimants | RRSP claimants | |
|---|---|---|---|---|
| Average amount of net federal tax payable per taxfiler ($) | 5,500 | 10,900 | 10,100 | 12,500 |
| Percentage of filers with positive amounts of net federal tax payable (%) | 67.1 | 95.1 | 95.2 | 96.9 |
| Average amount of net federal tax payable among those with positive amounts ($) | 8,200 | 11,400 | 10,600 | 12,900 |
| Share of total net federal tax payable relative to total income (%) | 11.7 | 12.9 | 12.7 | 13.3 |
|
Source: T1 return data. |
||||
3.3 Gender profile of taxfilers who claim RPP/RRSP contributions
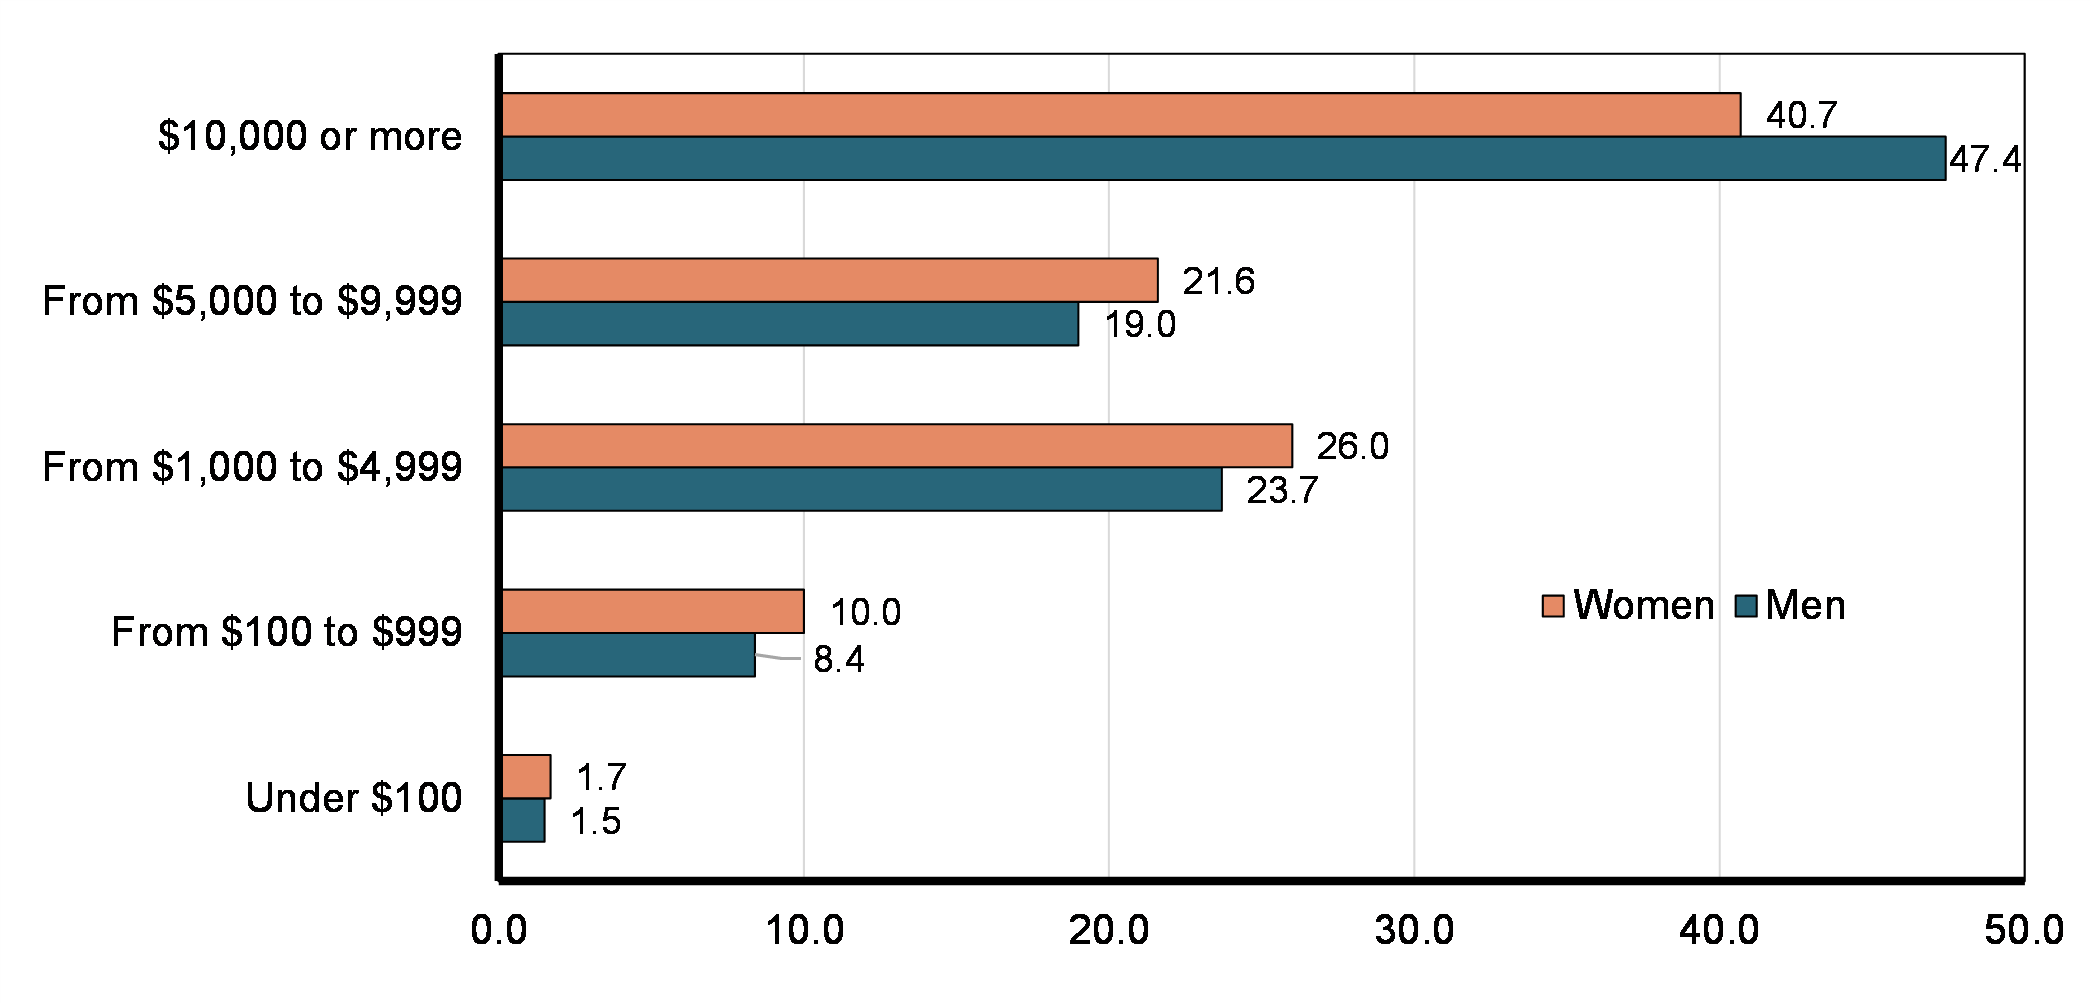
According to Table 5, men were more likely to claim RRSP contributions, while both genders were almost as likely to claim RPP contributions. Although men and women contributed to an RPP almost equally (3.3 million versus 3.5 million individuals), the average amount of contributions was slightly lower among women ($10,400 versus $11,600 among men). The gender difference in the average amount of RRSP contributions was even more pronounced ($6,300 versus $8,500). As Chart 1 indicates, the proportion of men who claimed $10,000 or more in RPP/RRSP contributions (47.4%) was significantly higher than that of women (40.7%). As a result, men claimed the largest part of RPP/RRSP contributions (55.1%) although they represented less than half of all taxfilers.
| Men | Women | |||||
|---|---|---|---|---|---|---|
| RPP or RRSP claimants |
RPP claimants | RRSP claimants | RPP or RRSP claimants |
RPP claimants | RRSP claimants | |
| Total number (#) | 5,075,300 | 3,293,800 | 3,293,400 | 4,883,900 | 3,452,600 | 2,860,200 |
| Percentage (%) of all male/female taxfilers | 36.2 | 23.5 | 23.5 | 32.9 | 23.3 | 19.9 |
| Total amount of claims ($ million) | 66,050 | 38,105 | 27,645 | 53,773 | 35,799 | 17,974 |
| Average amount of claims per claimant ($) | 13,000 | 11,600 | 8,500 | 11,000 | 10,400 | 6,300 |
|
Note: Results in this table exclude a small number of filers with missing gender information. Source: T1 return data. |
||||||
Distribution of RPP/RRSP claimants by amount of claims, 2019
In Table 6, we can see that the demographic profiles of male and female RPP/RRSP claimants do not differ substantially. While female taxfilers are, on average, slightly older than males, the average age of RPP/RRSP claimants is similar for both genders. The proportion of female RPP/RRSP claimants who are lone parents was greater than that of male claimants. However, this is consistent with the greater proportion of lone parents among female taxfilers in general.
If women who contribute to an RPP/RRSP appear to have a distinctive economic profile compared to their male counterparts, this gender distinction is quite consistent with that observed among all taxfilers. Men who claimed RPP/RRSP contributions reported an average amount of pre-tax personal income that was 1.4 times above that of women ($100,800 versus $69,700). In comparison, the average personal income of all male taxfilers was 1.5 times that of all female taxfilers. The average family income gap between male and female RPP/RRSP claimants was less pronounced than their personal income gap, but this pattern is also aligned with that seen among all taxfilers.
As the first GBA Plus study of federal PIT expendituresFootnote 10 pointed out, the federal PIT system is globally redistributive towards women in a given tax year. In comparison to men, women generally pay less in net federal income tax relative to what they earn, which makes the gender gap in after-tax income smaller than the gender gap in pre-tax income. This trend remains true among taxfilers who claimed RPP/RRSP contributions in 2019.
| Men | Women | |||||||
|---|---|---|---|---|---|---|---|---|
| All | RPP or RRSP claimants |
RPP claimants | RRSP claimants | All | RPP or RRSP claimants | RPP claimants | RRSP claimants | |
| Average age (yrs.) | 48.1 | 45.0 | 43.8 | 46.5 | 49.4 | 44.6 | 43.7 | 46.2 |
| Distribution by age group (%) | ||||||||
| Under 30 years | 20.6 | 13.4 | 14.8 | 10.2 | 19.2 | 13.3 | 14.3 | 10.0 |
| From 30 to 39 years | 16.9 | 23.3 | 24.5 | 22. 3 | 16.6 | 23.7 | 24.6 | 22.8 |
| From 40 to 49 years | 15.5 | 23.8 | 25.0 | 24.2 | 15.2 | 24.8 | 25.9 | 25.1 |
| From 50 to 64 years | 25.0 | 34.0 | 32.6 | 36.6 | 24.6 | 33.9 | 32.6 | 36.8 |
| 65 years or more | 22.1 | 5.5 | 3.2 | 6.7 | 24.5 | 4.4 | 2.6 | 5.3 |
| Distribution by family type (%) | ||||||||
| Sole filer (filer not in a couple) | 41.2 | 30.6 | 32.0 | 27.0 | 40.2 | 29.8 | 29.6 | 29.2 |
| Sole parent | 1.0 | 1.3 | 1.5 | 1.1 | 5.8 | 6.9 | 7.6 | 5.5 |
| In a couple without children | 38.0 | 35.6 | 32.6 | 38.9 | 35.1 | 34.4 | 32.2 | 37.4 |
| In a couple with children | 19.8 | 32.8 | 33.9 | 33.0 | 18.9 | 28.9 | 30.6 | 27.9 |
| Percentage (%) of total personal pre-tax income | 58.5 | 34.2 | 20.8 | 24.5 | 41.5 | 22.8 | 15.8 | 14.8 |
| Average amount of personal pre-tax income ($) | 62,400 | 100,800 | 94,300 | 111,300 | 41,800 | 69,700 | 68,300 | 77,600 |
| Distribution by personal pre-tax income group (%) | ||||||||
| 1st quintile (under $13,563) | 15.9 | 1.6 | 1.9 | 0.7 | 23.5 | 3.2 | 3.2 | 1.7 |
| 2nd quintile (from $13,563 to $26,376) | 17.2 | 3.4 | 3.0 | 2.5 | 22.8 | 6.9 | 5.9 | 5.6 |
| 3rd quintile (from $26,377 to $45,246) | 18.7 | 12.1 | 10.6 | 10.7 | 21.3 | 22.6 | 20.8 | 20.5 |
| 4th quintile (from $45,247 to $73,732) | 21.9 | 29.9 | 29.9 | 28.2 | 18.3 | 34.5 | 35.6 | 34.2 |
| 5th quintile (above $73,732) | 26.2 | 53.1 | 54.6 | 58.0 | 14.2 | 32.9 | 34.5 | 38.0 |
| Average amount of adjusted family pre-tax income ($) | 62,400 | 94,400 | 88,000 | 104,100 | 57,900 | 85,700 | 81,400 | 96,200 |
| Distribution by adjusted family pre-tax income group (%) | ||||||||
| 1st quintile (under $18,348) | 19.4 | 2.4 | 2.8 | 1.0 | 20.4 | 3.6 | 4.0 | 1.5 |
| 2nd quintile (from $18,348 to $33,637) | 18.2 | 6.4 | 6.0 | 4.9 | 21.7 | 8.9 | 8.4 | 6.9 |
| 3rd quintile (from $33,638 to $54,148) | 20.2 | 18.7 | 18.3 | 16.7 | 19.9 | 20.6 | 20.0 | 18.8 |
| 4th quintile (from $54,149 to $83,918) | 20.9 | 31.4 | 32.5 | 30.6 | 19.2 | 30.2 | 31.0 | 30.3 |
| 5th quintile (above $83,918) | 21.3 | 41.1 | 40.4 | 46.9 | 18.9 | 36.7 | 36.7 | 42.5 |
| Distribution by working status (%) | ||||||||
| Salaried workers | 65.8 | 94.0 | 98.8 | 91.7 | 59.3 | 93.7 | 98.2 | 91.4 |
| Self-employed workers only | 6.7 | 3.0 | 0.1 | 4.5 | 5.1 | 2.7 | 0.1 | 4.5 |
| Non-workers (i.e., no empl. inc.) | 27.5 | 3.0 | 1.1 | 3.7 | 35.6 | 3.7 | 1.7 | 4.1 |
| Average amount of net federal tax paid ($) | 7,300 | 14,000 | 12,900 | 15,700 | 3,800 | 7,700 | 7,500 | 8,800 |
| Share of total net federal tax paid relative to total income (%) | 11.9 | 14.0 | 13.8 | 14.2 | 9.1 | 11.0 | 10.9 | 11.4 |
| Average amount of personal income after net federal tax paid* ($) | 55,100 | 86,800 | 81,400 | 95,700 | 38,000 | 62,100 | 60,800 | 68,800 |
|
Notes: *Before tax withholdings transfers and refundable credits. Results in this table exclude a small number of filers with missing gender information. Results may not add up to 100% due to rounding. Source: T1 return data. |
||||||||
4. Lifetime tax benefits associated with claimed RPP/RRSP contributions
4.1 Methodology to identify the lifetime tax benefits associated with current-year RPP/RRSP contributions
Like for any other tax expenditures, not all claimants of RPP/RRSP contributions ultimately benefit from them from a taxation standpoint. The "number of beneficiaries" refers to the number of RPP/RRSP claimants who, in the absence of the available exemptions and deductions for their RPP/RRSP contributions, would have had to pay a higher amount of net federal tax over their life course, all else being equal (or, in other words, assuming no behavioural change by taxfilers). The "total amount of benefits" refers to the lifetime amount of net federal tax saved by RPP/RRSP claimants due to the claim of these tax deferrals in 2019, all else being equal.Footnote 11
Identifying the beneficiaries and estimating the tax benefits of annual contributions to RPPs/RRSPs can be challenging because money invested into people's pension and retirement savings plans may grow over several decades. The possible benefits in terms of tax savings in the contributing year are supplemented by the benefits associated with the tax deferral on contributions and investment income accruing in the savings plans. These benefits can also be, partly or entirely, counterbalanced by the taxes due when the accumulated money is withdrawn from the plans. Notwithstanding the level of return on investment income, contributors paying higher PIT rates in their working lives (when most contributions are made) than in retirement years (when accumulated retirement savings are usually withdrawn) will generally benefit from a positive lifetime tax savings on their annual RPP/RRSP claims. The opposite situation (paying higher tax rates in retirement than in working years) is possible, especially among younger or low-income RPP/RRSP contributors, but less likely as income is generally lower among taxfilers in retirement years than in prime working years.Footnote 12
Because individuals' income and savings trajectories over years cannot be observed based on a single year of data, the current analysis uses a present-value method.Footnote 13 The present-value method is an approach that uses assumptions to estimate the tax benefits of current-year RPP/RRSP contributions over a taxpayer's lifetime rather than in a single year. The cash-flow method used in the previous sections of the Report on Federal Tax Expenditures is more appropriate for estimating the overall current-year budgetary effect of PIT expenditures related to pension and retirement savings plans. However, the present-value method is more suitable for conducting distributional analyses of these tax expenditures because it considers the issue from an individual's perspective rather than the government's perspective.Footnote 14 As opposed to the cash-flow method which considers the annual tax savings on contributions and annual taxes collected on withdrawals, the present-value method does not account for taxes collected on withdrawals from these plans made in the current year. Therefore, the present-value method does not imply that taxfilers in retirement are necessarily better off in the absence of the tax expenditure. Instead, the present-value method estimates the eventual taxation of the deferred income accumulated in the plans, by calculating the lifetime tax benefits of RPP/RRSP contributions claimed in a given year. All details on the methodology used to estimate these lifetime tax benefits are discussed in Annex A.
4.2 Gender-impact analysis of lifetime tax benefits associated with current-year RPP/RRSP contributions
This section uses the estimated amounts of lifetime tax benefits of current-year RPP/RRSP contributions to assess the redistributive impact between men and women of the PIT expenditures related to pension and retirement savings plans. Table 7 indicates that women received a smaller proportion (43.7%) of total RPP/RRSP lifetime tax benefits than men (56.3%). It also suggests that the total amount of RPP lifetime benefits is more equally distributed between male and female taxfilers than total RRSP lifetime benefits.
| RPP/RRSP | RPP | RRSP | ||||
|---|---|---|---|---|---|---|
| Men | Women | Men | Women | Men | Women | |
| Estimated RPP/RRSP lifetime tax benefits when marginal tax rate is 5 percentage points lower in retirement than at contribution, in 2019 | ||||||
| Average amount per beneficiary ($) | 2,500 | 2,000 | 2,200 | 1,900 | 1,600 | 1,100 |
| Total amount (million $) | 12,299 | 9,535 | 7,035 | 6,335 | 5,227 | 3,167 |
| Percentage of lifetime tax benefits as a share of total 2019 RPP/RRSP claimed contributions (%) | 18.6 | 17.7 | 18.5 | 17.7 | 18.7 | 17.6 |
|
Notes: All money amounts are in 2019 dollars. Source: T1 return data. |
||||||
However, as the 2019 GBA Plus study pointed out, it is not sufficient to examine the distribution of beneficiaries and benefits by gender to assess the redistributive impact of specific tax expenditures.Footnote 15 It is also necessary to look at how each measure contributes to reducing pre-existing income inequality between men and women. To control for pre-existing income inequality (i.e., before the application of the federal tax system) and draw conclusions on the gender impact of each tax expenditure, a ratio of the share of total current-year benefits received relative to the share of total current-year pre-tax income reported was used in all previously released GBA Plus studies. A similar ratio was selected this time even though benefits of annual RPP/RRSP contributions materialize over a longer period than the tax expenditures studied before. In the current study, the ratio captures the importance of the lifetime tax benefits associated with current-year RPP/RRSP claims relative to the current-year distribution of pre-tax income between groups. Like in most previous GBA Plus studies, a ratio higher than 1.05 indicates that a group of taxfilers benefits from the tax expenditure proportionally more than others, while a ratio lower than 0.95 indicates that it benefits proportionally less.
The overall 1.05 ratio presented in Table 8 suggests that women and men benefit relatively equally from the various federal tax expenditures related to pension and retirement savings plans. However, ratios specific to RPP and RRSP claims reveal different redistributive impacts between genders. Like for most deductions, male taxfilers tend to benefit relatively more from the RRSP deduction. On the other hand, the RPP deduction is one of the few deductions that benefit women relatively more, along with the child care expense deduction and the deduction of union and professional dues, for instance. The advantage for women from the RPP deduction is, however, far from being as important as the child care expense deduction. The 0.91 and 1.14 ratios suggest that, even if these measures had been included with the set of tax expenditures examined in the first GBA Plus study, neither of them would have been part of the top five federal PIT expenditures in favour of men or women.Footnote 16
| Share of lifetime beneficiaries among all taxfilers (%) |
Average lifetime tax benefits per claimant ($) | Distribution of lifetime tax benefits between men and women (%) | Ratio of the share of lifetime tax benefits received by women relative to their share of current-year pre-tax income (41.5%*) | ||||
|---|---|---|---|---|---|---|---|
| Men | Women | Men | Women | Men | Women | Ratio | |
| RPP/RRSP claimants | 35.4 | 31.4 | 2,400 | 2,000 | 56.3 | 43.7 | 1.05 |
| RPP claimants | 22.9 | 22.2 | 2,100 | 1,800 | 52.6 | 47.4 | 1.14 |
| RRSP claimants | 23.2 | 18.7 | 1,600 | 1,100 | 62.3 | 37.7 | 0.91 |
|
Note: *This 41.5% represents the share of total pre-tax income received by female taxfilers in 2019. Ratios of tax expenditures benefiting women relatively more (i.e., their share of total lifetime tax benefits is greater than their share of current-year pre-tax income) are in bold, those that benefit women relatively less are in italics, whereas other ratios benefit women and men relatively equally. Source: T1 return data. |
|||||||
Table 9 shows the ratios of the share of lifetime tax benefits received by women relative to their share of pre-tax income in 2019, within other identity groups. This table indicates that when the distributional impacts of RPP and RRSP claims are examined separately, the gender results just discussed generally remain relatively unchanged within the different age groups, family types and family income quintiles. In most of them, female taxfilers benefit relatively more from RPP contributions, while the reverse is true for RRSP contributions. Only female taxfilers aged 65 or more and those who are not in a couple do not benefit proportionally more from their RPP claims relative to their male counterparts.
Interestingly, the redistributive impact of both RPP and RRSP contributions between genders becomes more clearly to the advantage of women when income groups are accounted for. Overall, male and female taxfilers appear to benefit relatively equally from their RPP/RRSP claims, as mentioned before. However, both measures turn slightly to the advantage of women when considering taxfilers in the same family income quintile.Footnote 17 This is also the case among taxfilers in the prime working-age categories (i.e., from 30 to 64 years) as well as among those in a couple. Such a trend underlines the importance of considering income categories, or other intersecting identity factors, when analyzing the impact of elements of the tax system by gender.Footnote 18
| RPP or RRSP claimants | RPP claimants | RRSP claimants | |
|---|---|---|---|
| All women | 1.05 | 1.14 | 0.91 |
Under 30 years |
1.02 | 1.09 | 0.89 |
From 30 to 39 years |
1.07 | 1.17 | 0.90 |
From 40 to 49 years |
1.10 | 1.19 | 0.92 |
From 50 to 64 years |
1.08 | 1.17 | 0.97 |
65 years or more |
0.89 | 0.91 | 0.88 |
Sole filer (filer not in a couple) |
0.94 | 0.98 | 0.87 |
Sole parent |
0.98 | 1.00 | 0.95 |
In a couple without children |
1.15 | 1.26 | 1.01 |
In a couple with children |
1.12 | 1.24 | 0.89 |
1st quintile (under $18,348) |
1.09 | 1.12 | 0.97 |
2nd quintile (from $18,348 to $33,637) |
1.07 | 1.14 | 0.93 |
3rd quintile (from $33,638 to $54,148) |
1.09 | 1.14 | 0.96 |
4th quintile (from $54,149 to $83,918) |
1.07 | 1.13 | 0.92 |
5th quintile (above $83,918) |
1.12 | 1.23 | 0.98 |
|
Note: Ratios of tax expenditures benefiting women relatively more (i.e., their share of total lifetime tax benefits is greater than their share of current-year pre-tax income) are in bold, those that benefit women relatively less are in italics, whereas other ratios indicate those benefiting women and men relatively equally. Source: T1 return data. |
|||
4.3 Impact analysis of lifetime tax benefits associated with current-year RPP/RRSP contributions, by identity groups other than gender
Table 10 identifies some identity groups, other than gender, that benefit proportionally more or less over their lifetime from their claimed contributions to pension and retirement savings plans in 2019. It suggests that taxfilers under 50 years, those who are part of a family with children (sole parents and those in a couple with children), and those who are part of the highest two family income quintiles (quintiles 4 and 5) are the groups that benefit the most from these tax expenditures. While these groups benefit relatively more from RPP contributions, RRSP contributions appear also beneficial to taxfilers between 50 and 64 years. They are also more narrowly beneficial to parents who live in a couple and taxfilers who are members of the top quintile (quintile 5 only).
It is expected that younger claimants would ultimately benefit more from RPP/RRSP contributions in terms of accumulated pension savings. The earlier a person starts saving for retirement, the more income this individual will accumulate in savings plans due to compounding interest. However, the extent to which young contributors will globally save in tax relative to those in other age groups is not as clear because tax deferral over a longer period of time may not necessarily compensate for the more limited tax relief they get at contribution due to their generally lower income levels and tax rates. If taxfilers with children (either sole parents or those in a couple) benefit relatively more from these measures, it may be because taxfilers in these family types tend to be younger on average. Also, if the advantage for those in couple with children tend to be more pronounced than for sole parents, it may be because taxfilers in a couple can claim contributions to the RRSP or SPP of their spouse or common-law partner.Footnote 19
Moreover, it is intuitive to observe that RPP/RRSP contributions are more beneficial to higher-income taxfilers as deductions reduce taxable income and provide tax savings based on the taxfilers' marginal tax rate or, in other words, tax savings that increase with income. Higher income taxfilers are also more likely to work for employers who offer private pension plans, and the generosity of such plans generally increases with income.
| Share (%) of all taxfilers by group | Share (%) of total current-year pre-tax personal income | Share (%) of total RPP/RRSP lifetime tax benefits | Ratios of the share of lifetime tax benefits received by groups relative to their share of current-year pre-tax income | Benefited from their RPP/RRSP contributions proportionally more (>) or less (<) | |
|---|---|---|---|---|---|
| Age Group | |||||
| Under 30 years | 19.8 | 10.3 | 12.0 | 1.17 | > |
| From 30 to 39 years | 16.7 | 17.4 | 29.2 | 1.68 | > |
| From 40 to 49 years | 15.4 | 19.7 | 29.0 | 1.47 | > |
| From 50 to 64 years | 24.8 | 31.1 | 28.4 | 0.91* | < |
| 65 years or more | 23.3 | 21.5 | 1.4 | 0.07 | < |
| Family type | |||||
| Sole filer (filer not in a couple) | 40.7 | 31.2 | 26.7 | 0.85 | < |
| Sole parent | 3.5 | 2.8 | 3.5 | 1.28* | > |
| In a couple without children | 36.5 | 41.2 | 32.0 | 0.77 | < |
| In a couple with children | 19.3 | 24.8 | 37.8 | 1.53 | > |
| Adjusted family pre-tax income group | |||||
| 1st quintile (under $18,348) | 20.0 | 3.6 | 0.2 | 0.06 | < |
| 2nd quintile (from $18,348 to $33,637) | 20.0 | 9.2 | 2.0 | 0.22 | < |
| 3rd quintile (from $33,638 to $54,148) | 20.0 | 15.3 | 9.7 | 0.64 | < |
| 4th quintile (from $54,149 to $83,918) | 20.0 | 22.7 | 26.0 | 1.15* | > |
| 5th quintile (above $83,918) | 20.0 | 49.3 | 62.0 | 1.26 | > |
|
Note: A ratio higher than 1.05 indicates that a group of taxfilers benefits from the tax expenditure proportionally more (>) than others, while a ratio lower than 0.95 indicates that it benefits proportionally less (<). *The positive or negative RPP/RRSP redistributive impacts toward these groups are driven by the impact of RPP lifetime benefits (for claimants between 50 to 64 years, the ratio is 0.82 for RPPs vs. 1.06 for RRSPs; for claiming lone parents, the ratio is 1.55 for RPPs vs. 0.85 for RRSPs; for claimants in Q4, the ratio is 1.33 for RPPs vs. 0.86 for RRSPs). Source: T1 return data. |
|||||
The impact analysis could have been different if another set of modelling parameters had been chosen to estimate the lifetime tax benefits of current-year RPP/RRSP claimed contributions. As the results in Annex B indicate, the estimated amounts of RPP/RRSP lifetime tax benefits may vary depending on the selected withdrawals scenario, annual inflation rate, tax rate applied at withdrawals and annual rates of return on investments. However, they also suggest that the distributional impacts of RPP/RRSP lifetime benefits between groups are quite robust to changes in modelling parameters. Compared to the baseline scenario, almost all the same identity groups are identified as benefiting proportionally more, less or equally under the various alternative scenarios examined. All tested alternative scenarios suggest a relatively proportional distribution of RPP/RRSP lifetime tax benefits between men and women. A slight advantage for women can be perceived. However, this advantage generally does not exceed our selected significance threshold (i.e., a ratio in favour of women above 1.05). The only notable exceptions are taxfilers under 30 years and taxfilers between 50 and 64 years who, according to the baseline model, are found to benefit relatively more and less, respectively, from their 2019 RPP/RRSP claims, while under some alternative scenarios, their advantage and disadvantage are not as conclusive.
The impact analysis would have also been slightly different if only current-year benefits had been accounted for instead of lifetime benefits (see comparative results in Annex C). The main lifetime beneficiaries of current-year RPP/RRSP contributions are taxfilers under 50 years, including those under 30 years. In comparison, the main current-year beneficiaries are those in the 30-64 age range. Because taxfilers under 30 years generally face lower tax rates, the immediate tax saving they get from their current-year RPP/RRSP contributions is relatively lower. In addition, with current-year benefits, quintile 5 is the only income group that benefits relatively more from RPP/RRSP contributions while with lifetime benefits, quintiles 4 and 5 benefit relatively more. It is also interesting to note that while men and women are found to benefit from their RPP/RRSP claims relatively equally in both the current year and over their lifetime, lifetime tax benefits tend to be slightly more to the advantage of women.
Furthermore, some results would have probably differed if the selected set of modelling parameters had varied by identity groups – for example, if a longer period of withdrawals had been selected for women than for men. It is known that women have a longer life expectancy than men, which may influence them to adopt dissaving strategies over a longer period than men. Accordingly, Annex D tests an alternative scenario where women adopt an RPP/RRSP dissaving strategy over a longer period than men (i.e., from 65 years to 87 years and 83 years respectively for women and men rather than to 85 years for both genders).Footnote 20 Results in this annex confirm that the lifetime tax benefit is slightly more in favour of women when the period of withdrawals is assumed longer for them. However, these types of group-differentiated assumptions are based on evidence that is unrelated to the federal tax system and outside the scope of the current study.
5. Conclusion
In this study, we use a present-value method to estimate the current and future amounts of tax savings resulting from claimed RPP/RRSP contributions in a given year. This estimation method allowed us to extend the scope of our previous GBA Plus studies by including the federal PIT expenditures related to pension and retirement savings plans.
Among the 28.9 million Canadians who filed a T1 return for the 2019 tax year, about 10 million (or 34.5%) claimed RPP/RRSP contributions, of which almost two thirds were RPP contributions from employers and employees. A calculation of the current-year tax savings resulting from these claims, as well as an approximation of the tax savings on future investment income and taxes paid at withdrawals, enabled us to identify the extent to which taxfilers ultimately benefit from these tax expenditures. The results showed that the estimated lifetime tax benefit associated with RPP/RRSP contributions made in 2019 averages about $2,200 per taxfiler. This amount – which is in large part explained by the tax deferralFootnote 21 – represents 18.2% of the total RPP/RRSP contributions for which a deduction or exemption was claimed in 2019.
The ratios of RPP/RRSP lifetime tax benefits received by specific identity groups relative to their share of pre-tax income in 2019 were used to verify whether a specific gender or other identity groups especially benefit from their RPP/RRSP contributions. These ratios suggest that, overall, men and women benefit relatively equally from the various federal PIT expenditures related to pension and retirement savings plans. However, RPP and RRSP contributions affect men and women slightly differently. As with most deductions, male taxfilers tend to benefit relatively more from their claimed RRSP contributions. On the other hand, the RPP deduction is part of the few deductions that benefit women relatively more.
While the present-value methodology is appropriate for conducting distributional analyses, the results may be sensitive to the modelling assumptions. A number of factors influencing lifetime RPP/RRSP benefits are considered fixed parameters in the model (including the number of years RPP/RRSP contributions and investment income stay in the plans, the annual inflation rate, the tax rates applied at withdrawals and the rates of return on investments), which introduces a certain degree of uncertainty. The various sensitivity tests conducted indicate that changing the modelling parameters indeed affects the estimated size of the lifetime benefits associated with RPP/RRSP claimed contributions. However, they also suggest that using alternative assumptions do not significantly influence the distribution of lifetime benefits across groups. While a very slight advantage for women is sometimes observed, men and women are generally found to benefit relatively equally from their RPP/RRSP contributions. Taxfilers between 30 and 50 years of age, those in a family with children and those in the top family income quintiles are the groups that are consistently found to benefit relatively more from these tax expenditures.
Annex A: Methodological Details for Identifying the Lifetime Tax Benefits of Current-Year RPP/RRSP Contributions
Under the present-value method, a taxfiler's lifetime tax benefits on current-year RPP/RRSP contributions are estimated using the following equation:
Lifetime benefits = (1) current-year tax savings + (2) tax savings on future investment income - (3) taxes paid at withdrawals
- Cross-sectional T1 return data provides the information to calculate the current-year tax savings component of the equation. As with all other tax expenditures included in previous GBA Plus studies, the current-year tax savings (direct benefits) refers to the net federal tax saved in 2019 due to the use of the available deductions and exemptions for their RPP/RRSP contributions. It is equivalent to the extra amounts of net federal taxes that would have been paid on their earnings if the deductions for employee RPP contributions and RRSP contributions had not existed, plus the amount of additional net federal taxes that would have been paid if employer RPP contributions had not been exempted from tax. In this study, net federal tax is calculated before the application of refundable tax credits; as such, possible changes in eligibility for refundable credits and benefit amounts that would occur in the absence of these tax expenditures are not accounted for in identifying RPP/RRSP beneficiaries and calculating RPP/RRSP tax benefits.Footnote 22 The current-year tax savings also do not account for the possible behavioural changes that would occur if the RPP/RRSP tax provisions were eliminated.
As Table A.1 indicates, almost all taxfilers who claim RPP/RRSP contributions benefit from a current-year tax savings due to this claim (96.5%). In 2019, the total amount of tax saved represented 23.5% of total claimed RPP/RRSP contributions, meaning that taxfilers who claimed $1,000 in RPP or RRSP contributions saved an average amount of $235 in net federal taxes that same year.
| RPP or RRSP claimants | RPP claimants | RRSP claimants | |
|---|---|---|---|
| % who benefit from current-year tax savings (direct benefits) as a result of 2019 RPP/RRSP contributions | 96.5 | 96.4 | 97.9 |
| Total current-year net federal tax saved as a % of total 2019 RPP/RRSP contributions | 23.5 | 22.8 | 24.3 |
|
Source: T1 return data. |
|||
- To estimate tax savings on future investment income, the number of years that the RPP/RRSP contributions stay in the pension accounts, the annual rate of return on investment income and the tax rates on investment income need to be estimated using multiple assumptions. In this study, it was assumed that:
- Current-year contributions entirely stay in the taxfilers' pension accounts until they reach 65 years of age (i.e., the standard age to start receiving public pension payments in Canada) and they start withdrawals in equal instalments between 65 and 85 years.Footnote 23,Footnote 24
- Contributions will earn annual nominal rates of return on investments that are equivalent to 5.6% for RPP contributions and 6.7% for RRSP contributions. These rates of return correspond to the average annual increases in pension assets, using employer-based pension plans and individual registered savings plans, respectively, at market value over the 20 years prior to 2020.Footnote 25 These rates were also adjusted for inflation using a 2% annual inflation rate.Footnote 26
- Investment income accruing during taxfilers' working years (i.e., until they reach 65 years) is assumed to be taxed at the same rate as the 2019 contributions, while investment income accruing during taxfilers' retirement years (i.e., when they are above 65 years) is assumed to be taxed at the same rate as withdrawals.
- It is difficult to predict the individual taxfiler's rate of taxation in retirement, i.e., when the contribution amounts saved and investment income accumulated in RPP/RRSP plans are generally withdrawn. This rate depends on multiple factors, including the taxfiler's level of income, composition of income and family situation in retirement. A taxfiler can also face different tax rates in retirement compared to during their working years because of tax policy changes, such as changes in income tax rates, thresholds, or available tax expenditures. Because the main objective of most pension savers is to accumulate enough money to replace a sufficiently high share of their pre-retirement income, and because of the progressivity of the tax system, facing a lower tax rate in retirement is the most likely scenario. For this reason, it was primarily assumed that each taxfiler would face a marginal tax rate in retirement 5 percentage points (pp) lower than the rate they faced in 2019.Footnote 27,Footnote 28
Because of the difference in timing between the periods when contributions are made, investment income accrues in the plans, and pension savings are withdrawn, some adjustments for inflation also needed to be made. By applying inflation-adjusted rates of return on investment income rather than nominal rates, the tax savings on investment income were adjusted for inflation and converted to 2019 dollars. To calculate the present value of taxes paid at withdrawals, initial contribution amounts that were saved in the plan also needed to be adjusted for inflation. Such adjustment was performed based on the number of years between taxfilers' age at contribution and withdrawals and considering a 2% annual inflation rate.
Table A.2 presents estimates for the various components of the above-described equation. It first shows that, in 2019, taxfilers benefited from a total $28,182 million in current-year tax savings due to their total $119,831 million in claimed RPP/RRSP contributions. On average, this represents a direct benefit of $2,800 per RPP/RRSP claimant (component (1)). That year, the largest part of the direct tax savings was the result of RPP contributions (from employers and employees). The average number of years that 2019 RPP/RRSP contributions were expected to stay in the plans between the contribution year and 65 years is 20.4 years. During this period, Table A.2 suggests that the investment income generated by these 2019 contributions could reach an average of $14,300 per claimant. It also indicates that the average net federal tax saved on this accumulated investment income could be $3,200 (component (2a)). Then, because the withdrawals assumption retained is that the accumulated money will be paid in equal instalments until taxfilers reach 85 years, the balance in the accounts will continue to grow after age 65. RPP/RRSP claimants could earn an average of $12,300 in additional investment income between 65 and 85 years, and the average net federal tax saved on this amount is estimated to be $2,200 (component (2b)). Finally, with marginal tax rates at withdrawals 5 pp lower than at contribution, it is estimated that the amount of net federal tax paid at withdrawals will be $6,100 on average (component (3)).
| RPP/RRSP claimants | RPP claimants | RRSP claimants | |
|---|---|---|---|
| (1) Estimated net federal tax saved on contributions in 2019 | |||
| Average amount ($) | 2,800 | 2,500 | 1,800 |
| Total amount (million $) | 28,182 | 16,865 | 11,146 |
| Estimated investment income generated by the 2019 contributions from the contribution year to 65 years | |||
| Average amount ($) | 14,300 | 12,300 | 9,600 |
| Total amount (million $) | 142,025 | 82,847 | 59,178 |
| (2a) Estimated net federal tax saved on accumulated investment income from the contribution year to 65 years | |||
| Average amount ($) | 3,200 | 2,700 | 2,200 |
| Total amount (million $) | 32,289 | 18,271 | 13,819 |
| Estimated income (2019 contributions and investment income) accumulated in the plans from the contribution year to 65 years | |||
| Average amount ($) | 26,300 | 23,200 | 17,100 |
| Total amount (million $) | 261,856 | 156,759 | 105,097 |
| Estimated investment income generated by the 2019 contributions after 65 years | |||
| Average amount ($) | 12,300 | 9,500 | 9,400 |
| Total amount (million $) | 122,020 | 64,368 | 57,651 |
| (2b) Estimated net federal tax saved on accumulated investment income after 65 years (when marginal tax rate is assumed to be 5 pp lower in retirement than in 2019) | |||
| Average amount ($) | 2,200 | 1,700 | 1,800 |
| Total amount (million $) | 22,333 | 11,255 | 10,898 |
| Estimated income (2019 contributions and investment income) accumulated in the plans after 65 years | |||
| Average amount ($) | 33,600 | 28,000 | 23,600 |
| Total amount (million $) | 334,396 | 189,161 | 145,335 |
| (3) Estimated net federal tax paid at withdrawals (when marginal tax rate is assumed to be 5 pp lower in retirement than in 2019) | |||
| Average amount ($) | 6,100 | 4,900 | 4,500 |
| Total amount (million $) | 60,970 | 33,021 | 27,469 |
|
Notes: All money amounts are in 2019 dollars. Totals may not add up due to rounding or overlaps between groups. Source: T1 return data. |
|||
Then, by subtracting the component (3) from the sum of components (1), (2a), and (2b), the taxfilers' lifetime tax benefits on RPP/RRSP contributions claimed in 2019 can be estimated. According to Table A.3, this lifetime tax benefit was $2,200 on average. This amount is lower than the estimated current-year benefits of $2,800 and represents 18.2% of total 2019 RPP/RRSP claimed contributions.
| RPP/RRSP claimants | RPP claimants | RRSP claimants | |
|---|---|---|---|
| Estimated RPP/RRSP lifetime tax benefits when marginal tax rate is 5 pp lower in retirement than in 2019 | |||
| Average amount ($) | 2,200 | 2,000 | 1,400 |
| Total amount (million $) | 21,835 | 13,370 | 8,393 |
| Percentage of lifetime benefits as a share of total 2019 RPP/RRSP claimed contributions (%) | 18.2 | 18.1 | 18.3 |
|
Notes: All money amounts are in 2019 dollars. Totals may not add up due to rounding or overlaps between groups. Source: T1 return data. |
|||
It is important to note that the estimated amount of lifetime tax benefits is sensitive to various factors. Like for taxfilers' current-year benefits, lifetime benefits will vary according to the 2019 amount of individuals' contributions and taxation rate at contributions. Taxfilers' age at contributions is an additional factor, not set by the model, that will influence the lifetime tax benefits estimation. This is simply due to the tax deferral – i.e., the fact that, because of inflation, an amount of tax paid later will be worth less than a similar amount of tax saved today. Among the set of modelling parameters, some may also influence taxfilers' lifetime benefits, including the selected withdrawals scenario, annual inflation rate, tax rate applied at withdrawals and annual rate of return on investments.Footnote 29 Accordingly, the following alternative scenarios were tested in Annex B:
- B.1: An alternative scenario where RRSP claimants make minimum Registered Retirement Income Fund (RRIF) withdrawals starting after age 71 and receive a lump sum payout upon death (i.e., at 85 years).Footnote 30
- B.2: An alternative scenario where the annual rate of inflation is first set at 1.5% rather than 2%, and then at 2.5%.
- B.3: A first alternative scenario where each taxfiler faces a marginal tax rate in retirement 2.5 pp lower than in 2019 rather than 5 pp lower; and a second alternative scenario where their relative marginal tax rates in retirement vary according to their personal income quintile in 2019.Footnote 31
- B.4: An alternative scenario where the annual nominal rate of return on investments is set at 6.15% (i.e., the average of 5.6% and 6.7%) for both RPP and RRSP contributions.
Results presented in Tables B.1.1, B.2.1, B.3.1 and B.4.1 of Annex B confirm that the average and total amounts of lifetime benefits are sensitive to the choice of modelling parameters. For instance, when it is alternatively considered that accumulated RRSP funds are withdrawn starting at age 72 with a lump sum payout at 85 years (Annex B.1), the average and total amounts of RPP/RRSP lifetime benefits are increased (e.g., from an average of $2,200 to $2,400 per claimant). Minimizing withdrawals or delaying withdrawals increases the lifetime tax benefits of RPP/RRSP contributions, because the tax deferral weights more. As Annexes B.2, B.3 and B.4 show, the amounts of tax savings also vary depending on the selected inflation rate, tax rate at withdrawals and rate of return on investment. The higher the inflation rate and the lower the taxation rate is relative to what RPP/RRSP claimants faced in the year they contribute, the greater the estimated lifetime tax benefit will be.
On the other hand, results presented in Tables B.1.2, B.2.2, B.3.2 and B.4.2 of Annex B indicate that changes in these last parameters do not significantly influence the distribution of lifetime tax benefits across groups. The only exceptions are for the "under 30 years" and "from 50 to 64 years" age groups.
Annex B: Testing Alternative Modelling Parameters
B.1 Alternative withdrawals scenario
| All | Men | Women | |
|---|---|---|---|
| Estimated RPP/RRSP lifetime tax benefits with withdrawals in equal instalments starting after age 65 (or the year after contributions) and ending at age 85 (Baseline) | |||
Average amount per claimant ($) |
2,200 | 2,400 | 2,000 |
Total amount (million $) |
21,835 | 12,299 | 9,535 |
| Percentage of lifetime tax benefits as a share of total 2019 RPP/RRSP claimed contributions (%) | 18.2 | 18.6 | 17.7 |
| Estimated RPP/RRSP lifetime tax benefits with minimum RRIF withdrawals starting at age 72 and a lump sum payout at 85 years (Alternative) | |||
Average amount per claimant ($) |
2,400 | 2,600 | 2,100 |
Total amount (million $) |
24,304 | 13,839 | 10,464 |
| Percentage of lifetime tax benefits as a share of total 2019 RPP/RRSP claimed contributions (%) | 20.3 | 21.0 | 19.5 |
|
Source: T1 return data. |
|||
| Baseline | Alternative scenario | |||
|---|---|---|---|---|
| Withdrawals in equal instalments starting after age 65 (or the year after contributions) and ending at age 85 | Minimum RRIF withdrawals starting at age 72 and a lump sum payout at age 85 | |||
| Ratios | Groups that benefit proportionally more, less or equally | Ratios | Groups that benefit proportionally more, less or equally | |
| Gender | ||||
| Men | 0.97 | ~ | 0.97 | ~ |
| Women | 1.05 | ~ | 1.04 | ~ |
| Age Group | ||||
| Under 30 years | 1.17 | > | 1.14 | > |
| From 30 to 39 years | 1.68 | > | 1.63 | > |
| From 40 to 49 years | 1.47 | > | 1.44 | > |
| From 50 to 64 years | 0.91 | < | 0.94 | < |
| 65 years or more | 0.07 | < | 0.10 | < |
| Family type | ||||
| Sole filer (filer not in a couple) | 0.85 | < | 0.85 | < |
| Sole parent | 1.28 | > | 1.23 | > |
| In a couple without children | 0.77 | < | 0.80 | < |
| In a couple with children | 1.53 | > | 1.49 | > |
| Adjusted family pre-tax income group | ||||
| 1st quintile (under $18,348) | 0.06 | < | 0.06 | < |
| 2nd quintile (from $18,348 to $33,637) | 0.22 | < | 0.22 | < |
| 3rd quintile (from $33,638 to $54,148) | 0.64 | < | 0.62 | < |
| 4th quintile (from $54,149 to $83,918) | 1.15 | > | 1.11 | > |
| 5th quintile (above $83,918) | 1.26 | > | 1.28 | > |
|
Note: A ratio higher than 1.05 indicates that a group of taxfilers benefits from the tax expenditure proportionally more (>), while a ratio lower than 0.95 indicates that it benefits proportionally less (<). Source: T1 return data. |
||||
B.2 Alternative annual rate of inflation
| All | Men | Women | |
|---|---|---|---|
| Estimated RPP/RRSP lifetime tax benefits when the inflation rate is 2% (Baseline) | |||
Average amount per claimant ($) |
2,200 | 2,400 | 2,000 |
Total amount (million $) |
21,835 | 12,299 | 9,535 |
| Percentage of lifetime benefits as a share of total 2019 RPP/RRSP claimed contributions (%) | 18.2 | 18.6 | 17.7 |
| Estimated RPP/RRSP lifetime tax benefits when the inflation rate is 1.5% (Alternative 1) | |||
Average amount per claimant ($) |
2,200 | 2,400 | 1,900 |
Total amount (million $) |
21,639 | 12,144 | 9,494 |
| Percentage of lifetime benefits as a share of total 2019 RPP/RRSP claimed contributions (%) | 18.1 | 18.4 | 17.7 |
| Estimated RPP/RRSP lifetime tax benefits when the inflation rate is 2.5% (Alternative 2) | |||
Average amount per claimant ($) |
2,200 | 2,400 | 2,000 |
Total amount (million $) |
21,973 | 12,416 | 9,557 |
| Percentage of lifetime benefits as a share of total 2019 RPP/RRSP claimed contributions (%) | 18.3 | 18.8 | 17.8 |
|
Source: T1 return data. |
|||
| Baseline | Alternative scenarios | |||||
|---|---|---|---|---|---|---|
| Inflation rate at 2% | Inflation rate at 1.5% | Inflation rate at 2.5% | ||||
| Ratios | Groups that benefit proportionally more, less or equally | Ratios | Groups that benefit proportionally more, less or equally | Ratios | Groups that benefit proportionally more, less or equally | |
| Gender | ||||||
| Men | 0.97 | ~ | 0.96 | ~ | 0.97 | ~ |
| Women | 1.05 | ~ | 1.06 | > | 1.05 | ~ |
| Age Group | ||||||
| Under 30 years | 1.17 | > | 1.29 | > | 1.07 | > |
| From 30 to 39 years | 1.68 | > | 1.74 | > | 1.61 | > |
| From 40 to 49 years | 1.47 | > | 1.44 | > | 1.48 | > |
| From 50 to 64 years | 0.91 | < | 0.86 | < | 0.96 | ~ |
| 65 years or more | 0.07 | < | 0.06 | < | 0.08 | < |
| Family type | ||||||
| Sole filer (filer not in a couple) | 0.85 | < | 0.88 | < | 0.83 | < |
| Sole parent | 1.28 | > | 1.29 | > | 1.28 | > |
| In a couple without children | 0.77 | < | 0.76 | < | 0.79 | < |
| In a couple with children | 1.53 | > | 1.53 | > | 1.52 | > |
| Adjusted family pre-tax income group | ||||||
| 1st quintile (under $18,348) | 0.06 | < | 0.07 | < | 0.06 | < |
| 2nd quintile (from $18,348 to $33,637) | 0.22 | < | 0.24 | < | 0.21 | < |
| 3rd quintile (from $33,638 to $54,148) | 0.64 | < | 0.67 | < | 0.61 | < |
| 4th quintile (from $54,149 to $83,918) | 1.15 | > | 1.17 | > | 1.12 | > |
| 5th quintile (above $83,918) | 1.26 | > | 1.23 | > | 1.28 | > |
|
Note: A ratio higher than 1.05 indicates that a group of taxfilers benefits from the tax expenditure proportionally more (>), while a ratio lower than 0.95 indicates that it benefits proportionally less (<). Source: T1 return data. |
||||||
B.3 Alternative tax rate in retirement years
| All | Men | Women | |
|---|---|---|---|
| Estimated RPP/RRSP lifetime tax benefits when marginal tax rate is 5 pp lower in retirement than in 2019 (Baseline) | |||
Average amount per claimant ($) |
2,200 | 2,400 | 2,000 |
Total amount (million $) |
21,835 | 12,299 | 9,535 |
| Percentage of lifetime tax benefits as a share of total 2019 RPP/RRSP claimed contributions (%) | 18.2 | 18.6 | 17.7 |
| Estimated RPP/RRSP lifetime tax benefits when marginal tax rate is 2.5 pp lower in retirement than in 2019 (Alternative 1) | |||
Average amount per claimant ($) |
1,700 | 1,900 | 1,500 |
Total amount (million $) |
16,759 | 9,489 | 7,270 |
| Percentage of lifetime tax benefits as a share of total 2019 RPP/RRSP claimed contributions (%) | 14.0 | 14.4 | 13.5 |
| Estimated RPP/RRSP lifetime tax benefits when marginal tax rate in retirement varies by income quintile in 2019 (Alternative 2) | |||
Average amount per claimant ($) |
2,700 | 3,100 | 2,300 |
Total amount (million $) |
26,678 | 15,499 | 11,178 |
| Percentage of lifetime tax benefits as a share of total 2019 RPP/RRSP claimed contributions (%) | 22.3 | 23.5 | 20.8 |
|
Source: T1 return data. |
|||
| Baseline | Alternative scenarios | |||||
|---|---|---|---|---|---|---|
| 5 pp lower than in 2019 | 2.5 pp lower than in 2019 | Varies by income quintile in 2019 | ||||
| Ratios | Groups that benefit proportionally more, less or equally | Ratios | Groups that benefit proportionally more, less or equally | Ratios | Groups that benefit proportionally more, less or equally | |
| Gender | ||||||
| Men | 0.97 | ~ | 0.97 | ~ | 0.99 | ~ |
| Women | 1.05 | ~ | 1.04 | ~ | 1.01 | ~ |
| Age Group | ||||||
| Under 30 years | 1.17 | > | 1.07 | > | 1.04 | ~ |
| From 30 to 39 years | 1.68 | > | 1.62 | > | 1.71 | > |
| From 40 to 49 years | 1.47 | > | 1.49 | > | 1.50 | > |
| From 50 to 64 years | 0.91 | < | 0.94 | < | 0.92 | < |
| 65 years or more | 0.07 | < | 0.11 | < | 0.06 | < |
| Family type | ||||||
| Sole filer (filer not in a couple) | 0.85 | < | 0.83 | < | 0.82 | < |
| Sole parent | 1.28 | > | 1.28 | > | 1.24 | > |
| In a couple without children | 0.77 | < | 0.79 | < | 0.78 | < |
| In a couple with children | 1.53 | > | 1.53 | > | 1.57 | > |
| Adjusted family pre-tax income group | ||||||
| 1st quintile (under $18,348) | 0.06 | < | 0.05 | < | 0.01 | < |
| 2nd quintile (from $18,348 to $33,637) | 0.22 | < | 0.20 | < | 0.09 | < |
| 3rd quintile (from $33,638 to $54,148) | 0.64 | < | 0.61 | < | 0.48 | < |
| 4th quintile (from $54,149 to $83,918) | 1.15 | > | 1.12 | > | 1.10 | > |
| 5th quintile (above $83,918) | 1.26 | > | 1.28 | > | 1.36 | > |
|
Note: A ratio higher than 1.05 indicates that a group of taxfilers benefits from the tax expenditure proportionally more (>) than other groups, while a ratio lower than 0.95 indicates that it benefits proportionally less (<). Source: T1 return data. |
||||||
B.4 Alternative RPP/RRSP rate of return on investments
| All | Men | Women | |
|---|---|---|---|
| Estimated RPP/RRSP lifetime tax benefits when annual rates of return on investments are 5.6% for RPP and 6.7% for RRSP contributions (Baseline) | |||
| Average amount per claimant ($) | 2,200 | 2,400 | 2,000 |
| Total amount (million $) | 21,835 | 12,299 | 9,535 |
| Percentage of lifetime tax benefits as a share of total 2019 RPP/RRSP claimed contributions (%) | 18.2 | 18.6 | 17.7 |
| Estimated RPP/RRSP lifetime tax benefits when annual rates of return on investments are 6.15% for both RPP and RRSP contributions (Alternative) | |||
| Average amount per claimant ($) | 2,200 | 2,500 | 2,000 |
| Total amount (million $) | 22,322 | 12,494 | 9,827 |
| Percentage of lifetime tax benefits as a share of total 2019 RPP/RRSP claimed contributions (%) | 18.6 | 18.9 | 18.3 |
|
Source: T1 return data. |
|||
| Baseline | Alternative scenario | |||
|---|---|---|---|---|
| Annual rates of return on investments are 5.6% for RPP and 6.7% for RRSP contributions | Annual rates of return on investments are 6.15% for both RPP and RRSP contributions | |||
| Ratios | Groups that benefit proportionally more, less or equally | Ratios | Groups that benefit proportionally more, less or equally | |
| Gender | ||||
| Men | 0.97 | ~ | 0.96 | ~ |
| Women | 1.05 | ~ | 1.06 | > |
| Age Group | ||||
| Under 30 years | 1.17 | > | 1.20 | > |
| From 30 to 39 years | 1.68 | > | 1.69 | > |
| From 40 to 49 years | 1.47 | > | 1.46 | > |
| From 50 to 64 years | 0.91 | < | 0.90 | < |
| 65 years or more | 0.07 | < | 0.07 | < |
| Family type | ||||
| Sole filer (filer not in a couple) | 0.85 | < | 0.86 | < |
| Sole parent | 1.28 | > | 1.31 | > |
| In a couple without children | 0.77 | < | 0.77 | < |
| In a couple with children | 1.53 | > | 1.53 | > |
| Adjusted family pre-tax income group | ||||
| 1st quintile (under $18,348) | 0.06 | < | 0.06 | < |
| 2nd quintile (from $18,348 to $33,637) | 0.22 | < | 0.23 | < |
| 3rd quintile (from $33,638 to $54,148) | 0.64 | < | 0.65 | < |
| 4th quintile (from $54,149 to $83,918) | 1.15 | > | 1.16 | > |
| 5th quintile (above $83,918) | 1.26 | > | 1.24 | > |
|
Note: A ratio higher than 1.05 indicates that a group of taxfilers benefits from the tax expenditure proportionally more (>) than other groups, while a ratio lower than 0.95 indicates that it benefits proportionally less (<). Source: T1 return data. |
||||
Annex C: Comparing the Distribution of RPP/RRSP Lifetime Benefits to the Distribution of RPP/RRSP Current-Year Benefits
| All | Men | Women | |
|---|---|---|---|
| Estimated RPP/RRSP lifetime tax benefits on current-year RPP/RRSP contributions (Baseline) | |||
| Average amount per claimant ($) | 2,200 | 2,400 | 2,000 |
| Total amount (million $) | 21,835 | 12,299 | 9,535 |
| Percentage of lifetime tax benefits as a share of total 2019 RPP/RRSP claimed contributions (%) | 18.2 | 18.6 | 17.7 |
| Estimated RPP/RRSP current-year tax benefits on current-year RPP/RRSP contributions (Comparison) | |||
| Average amount per claimant ($) | 2,800 | 3,200 | 2,500 |
| Total amount (million $) | 28,182 | 16,205 | 11,976 |
| Percentage of current-year tax benefits as a share of total 2019 RPP/RRSP claimed contributions (%) | 23.5 | 24.5 | 22.3 |
|
Source: T1 return data. |
|||
| Lifetime tax benefits (Baseline) | Current-year tax benefits (Comparison) | |||
|---|---|---|---|---|
| Ratios | Groups that benefit proportionally more, less or equally | Ratios | Groups that benefit proportionally more, less or equally | |
| Gender | ||||
| Men | 0.97 | ~ | 0.98 | ~ |
| Women | 1.05 | ~ | 1.02 | ~ |
| Age Group | ||||
| Under 30 years | 1.17 | > | 0.59 | < |
| From 30 to 39 years | 1.68 | > | 1.15 | > |
| From 40 to 49 years | 1.47 | > | 1.40 | > |
| From 50 to 64 years | 0.91 | < | 1.31 | > |
| 65 years or more | 0.07 | < | 0.26 | < |
| Family type | ||||
| Sole filer (filer not in a couple) | 0.85 | < | 0.75 | < |
| Sole parent | 1.28 | > | 1.14 | > |
| In a couple without children | 0.77 | < | 0.96 | ~ |
| In a couple with children | 1.53 | > | 1.36 | > |
| Adjusted family pre-tax income group | ||||
| 1st quintile (under $18,348) | 0.06 | < | 0.03 | < |
| 2nd quintile (from $18,348 to $33,637) | 0.22 | < | 0.14 | < |
| 3rd quintile (from $33,638 to $54,148) | 0.64 | < | 0.49 | < |
| 4th quintile (from $54,149 to $83,918) | 1.15 | > | 0.99 | ~ |
| 5th quintile (above $83,918) | 1.26 | > | 1.39 | > |
|
Note: A ratio higher than 1.05 indicates that a group of taxfilers benefits from the tax expenditure proportionally more (>) than other groups, while a ratio lower than 0.95 indicates that it benefits proportionally less (<). Source: T1 return data. |
||||
Annex D: Gender-Differentiated Modelling Parameters
| All | Men | Women | |
|---|---|---|---|
| Estimated RPP/RRSP lifetime tax benefits with withdrawals in equal instalments starting after age 65 (or the year after contributions) and ending at age 85 for both genders (Baseline) | |||
| Average amount ($) | 2,200 | 2,400 | 2,000 |
| Total amount (million $) | 21,835 | 12,299 | 9,535 |
| Percentage of lifetime tax benefits as a share of total 2019 RPP/RRSP claimed contributions (%) | 18.2 | 18.6 | 17.7 |
| Estimated RPP/RRSP lifetime tax benefits with withdrawals in equal instalments starting after age 65 (or the year after contributions) and ending at age 83 for men and 87 for women (Comparison) | |||
| Average amount ($) | 2,200 | 2,400 | 2,000 |
| Total amount (million $) | 21,790 | 12,144 | 9,494 |
| Percentage of lifetime tax benefits as a share of total 2019 RPP/RRSP claimed contributions (%) | 18.2 | 18.4 | 17.9 |
|
Source: T1 return data. |
|||
| Withdrawals in equal instalments starting after age 65 (or the year after contributions) and ending at age 85 (Baseline) | Withdrawals in equal instalments starting after age 65 (or the year after contributions) and ending at age 83 for men and 87 for women (Comparison) | |||
|---|---|---|---|---|
| Ratios | Groups that benefit proportionally more, less or equally | Ratios | Groups that benefit proportionally more, less or equally | |
| Gender | ||||
| Men | 0.97 | ~ | 0.95 | ~ |
| Women | 1.05 | ~ | 1.06 | > |
| Age Group | ||||
| Under 30 years | 1.17 | > | 1.17 | > |
| From 30 to 39 years | 1.68 | > | 1.68 | > |
| From 40 to 49 years | 1.47 | > | 1.47 | > |
| From 50 to 64 years | 0.91 | < | 0.91 | < |
| 65 years or more | 0.07 | < | 0.07 | < |
| Family type | ||||
| Sole filer (filer not in a couple) | 0.85 | < | 0.85 | < |
| Sole parent | 1.28 | > | 1.29 | > |
| In a couple without children | 0.77 | < | 0.77 | < |
| In a couple with children | 1.53 | > | 1.53 | > |
| Adjusted family pre-tax income group | ||||
| 1st quintile (under $18,348) | 0.06 | < | 0.06 | < |
| 2nd quintile (from $18,348 to $33,637) | 0.22 | < | 0.22 | < |
| 3rd quintile (from $33,638 to $54,148) | 0.64 | < | 0.64 | < |
| 4th quintile (from $54,149 to $83,918) | 1.15 | > | 1.15 | > |
| 5th quintile (above $83,918) | 1.26 | > | 1.26 | > |
|
Note: A ratio higher than 1.05 indicates that a group of taxfilers benefits from the tax expenditure proportionally more (>) than other groups, while a ratio lower than 0.95 indicates that it benefits proportionally less (<). Source: T1 return data. |
||||