
Report on Federal Tax Expenditures - Concepts, Estimates and Evaluations 2024: part 9
Archived - Report on Federal Tax Expenditures - Concepts, Estimates and Evaluations 2024: part 9
Evaluation of the Rollovers of Investments in Small BusinessesFootnote 1
1. Introduction
The rollovers of investments in small businesses measure allows for the deferral of the capital gains resulting from dispositions of certain small business shares if replacement shares of another eligible small business are purchased during the year of disposition or within 120 days after the end of that year. The amount of the deferral is limited by the proportion of the proceeds invested in replacement shares.
This study presents an evaluation of the rollovers measure. Section 2 provides historical and other background information on the measure. Section 3 proceeds with the evaluation, following the four criteria: relevance, effectiveness, equity, and efficiency. Concluding remarks are presented in Section 4.
2. Background and Overview
2.1 Background
The rollovers measure was introduced in Budget 2000, as part of a set of measures designed to make the economy more internationally competitive, including a corporate rate reduction. The original goal of the measure was to promote innovation and growth by improving access to capital for start-up firms that may otherwise have difficulty accessing risk capital because venture capitalists often focus more on established businesses. The deferral directly increases the amount of capital available by allowing investors disposing of existing business investments to reinvest the full pre-tax amount in a new venture.
The deferral was modified twice after being introduced with Budget 2000. The October 2000 Economic Statement and Budget Update increased the size of an eligible investment from $500,000 to $2 million and the size of business eligible for the rollover from $10 million to $50 million (carrying value of assets). Budget 2003 eliminated the individual investor limits on the amount of the original investment and reinvestment eligible for the deferral (i.e., the $2 million limit) and allowed a reinvestment to be eligible for the rollover when made at any time in the year of disposition or within 120 days after the end of the year.
2.2 Context, Definitions and Rules
Found in section 44.1 of the Income Tax Act, the capital gains deferral is available to individuals (other than trusts)Footnote 2 when disposing of and purchasing new eligible small business corporation shares. To qualify, the following conditions must be met:
- The issuing corporation must be an eligible small business corporation, that is, a Canadian-controlled private corporation (CCPC) whose assets are primarily used in an active business within Canada by it or a related eligible small business corporation.Footnote 3 Excluded are professional corporations, specified financial corporations, corporations who primarily trade in or develop real property (i.e., property that cannot be moved, such as land or buildings), or for which most of the fair market value of its property owes to real property.
- The shares must be common shares issued by the corporation to the investor, and the issuing corporation must be an eligible small business corporation at the time the shares were issued. In addition, the total carrying value of the assets of the corporation and related corporations must not exceed $50 million immediately before and immediately after the share was issued.
- The individual may acquire shares from a spouse, common-law partner, or parent due to circumstances such as a death or the breakdown of a marriage or common-law partnership. In such cases, the individual is considered to have acquired such shares at the time and under the same circumstances that the related individual originally acquired them.
- During the holding period, the corporation must be an eligible active business corporation, i.e., a taxable Canadian corporation whose assets are principally used in an active business carried on primarily in Canada by the corporation or a related active business while the investor holds the shares, or for at least 730 days of the ownership period.Footnote 4
- Prior to disposition, the original shares must be held for more than 185 days.
- The replacement shares must then be acquired either within the year in which the disposition is made or within 120 days after the end of that year.
The deferral is calculated as: Capital gains deferral = A x (B ÷ C), where
- A = the total capital gain from the original sale
- B = the proceeds of disposition
- C = B or the total cost of all replacement shares, whichever is less
Example
Arrow Corp is an eligible small business corporation. An individual purchases common shares of Arrow Corp for $2 million and 3 years later sells the shares for $2.5 million, realizing a gain of $500,000. The individual uses $1.8 million of the proceeds to buy replacement shares in Balloon Corp before the end of the year. As the individual has reinvested 72% of the proceeds of disposition ($1,800,000/$2,500,000 = 72%), they can defer $360,000 (72%*$500,000) of the gain.
3. Evaluation
3.1 Relevance
The stated objective of the measure is to improve access to capital for small business corporations (Economic Statement and Budget Update, 2000; Budget 2003). In addition, as highlighted with its introduction in Budget 2000, the measure is intended to be targeted at businesses with "high growth potential" and is aimed to be "of particular benefit to the fast-growing high-technology industries".
The small business funding continuum, illustrated in Figure 1, suggests that in the earliest stages, funding is likely to be obtained directly from founders, their friends and family. This may be followed by equity investments from other private investors, some of which may be individual "angel" investors (i.e., individuals with a significant investment portfolio who are looking to invest in high-growth potential companies). Funding may later come from more organized sources, such as angel groups and venture capital funds.
Rollovers as part of the small business funding continuum
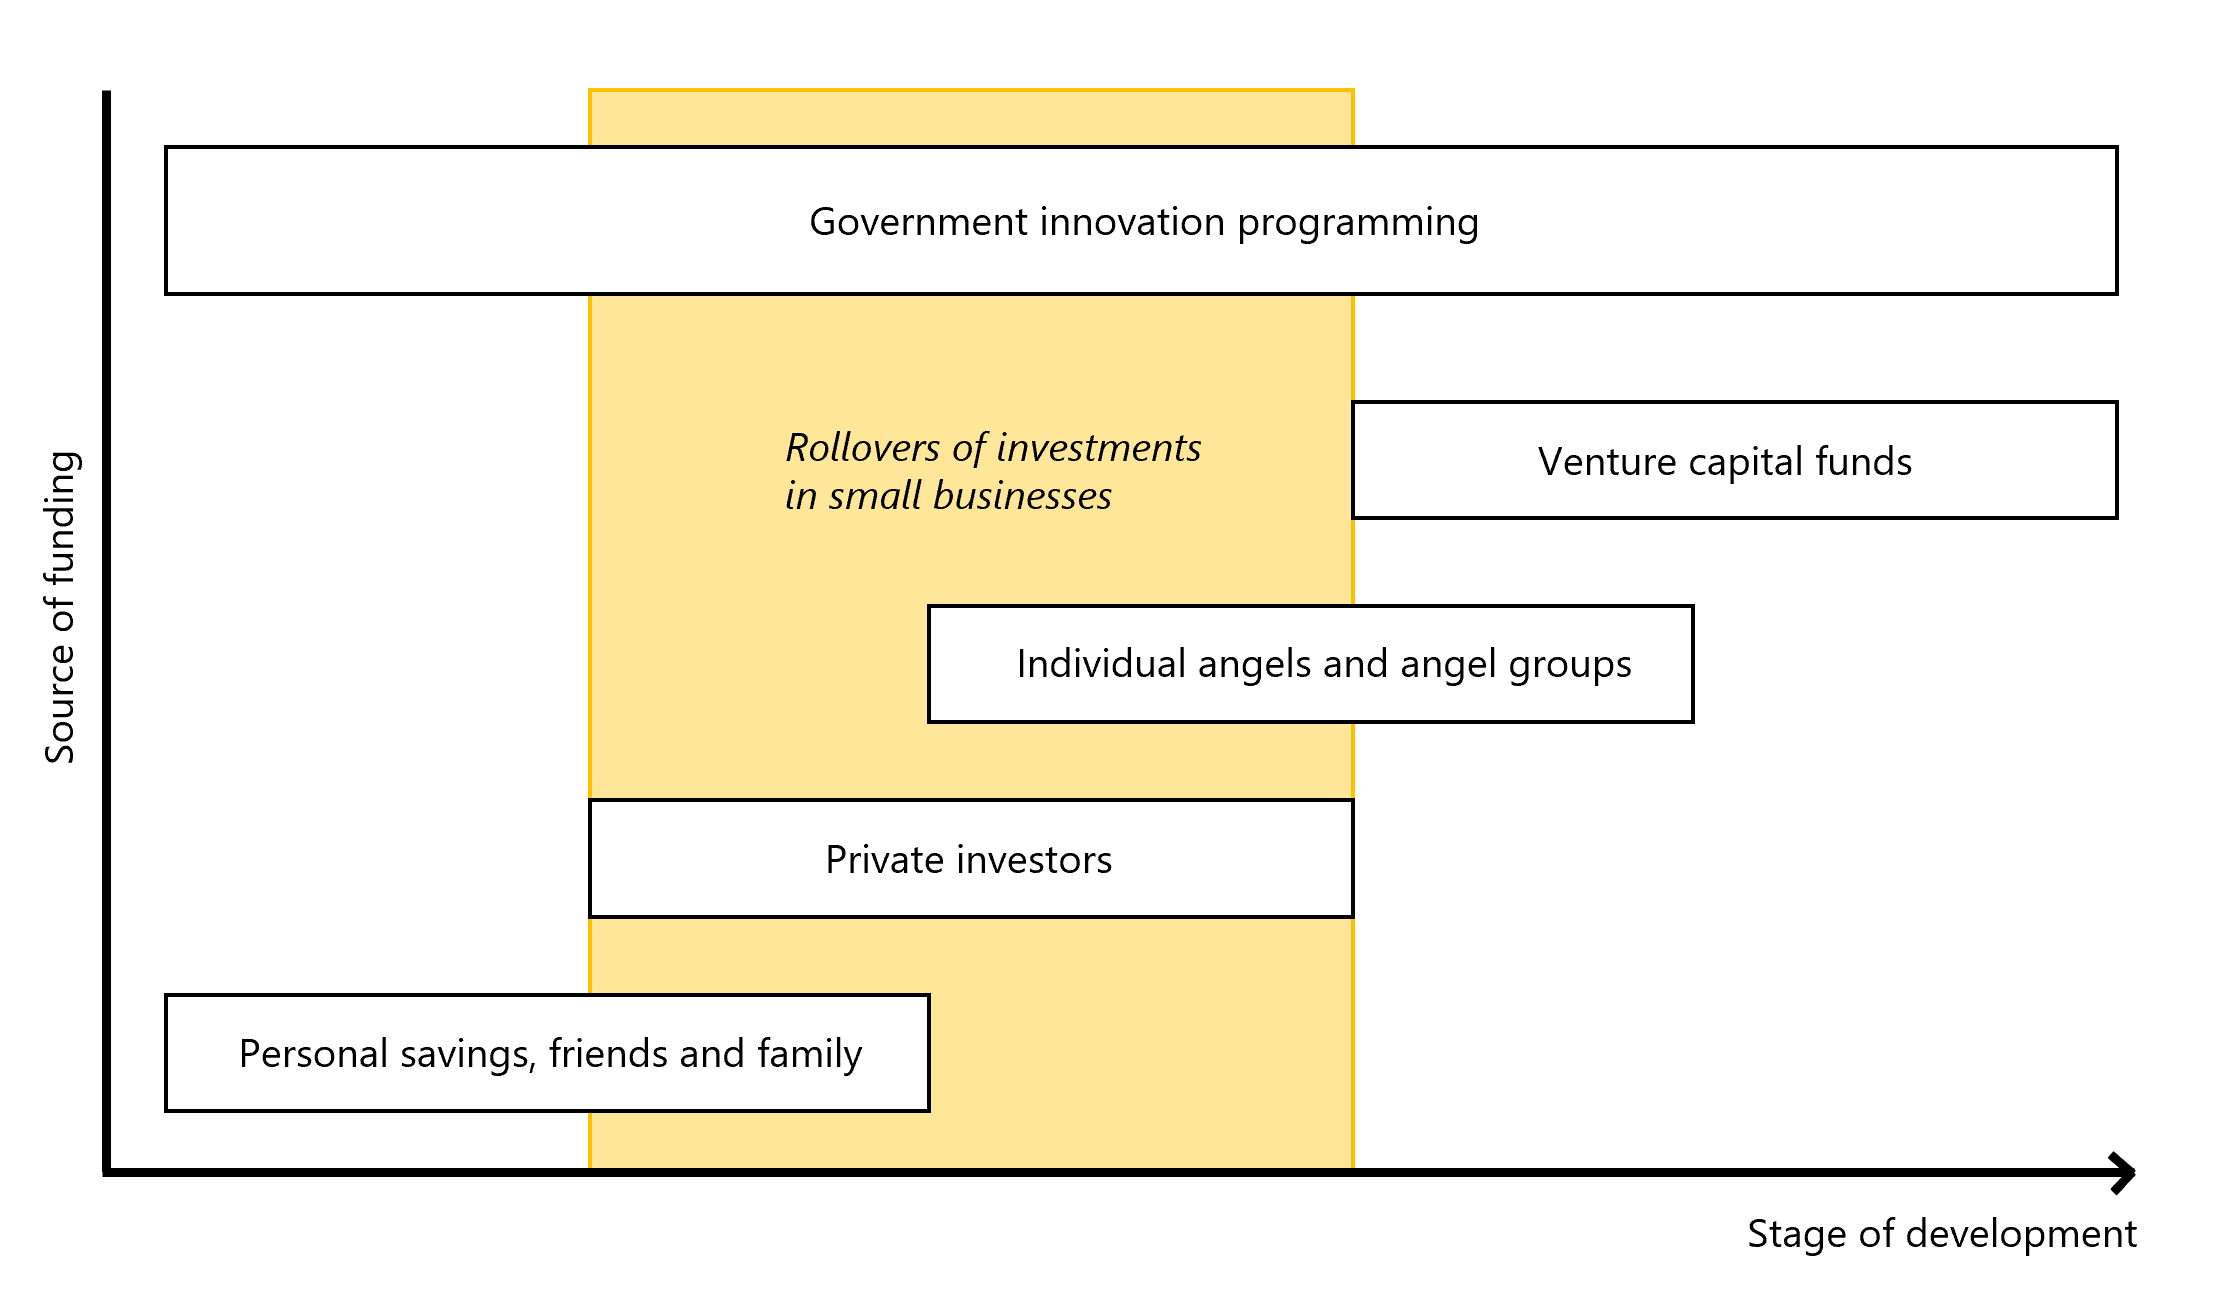
While the funding continuum suggests possible private sources of financing at all stages of business development, there may be challenges in accessing capital. Limited access to capital markets may be due to market failures relating to informational asymmetries, the lack of liquidity or collateral to secure debt-based financing (e.g., from commercial banks), and under-developed venture capital markets in Canada. In this context, the federal government plays a key role in small business financing, providing support in different forms throughout the development process. There are, for instance, loan and capital investment programs (e.g., the Canada Small Business Financing Program), tax credits for pre-commercialization activities (e.g., the Scientific Research and Experimental Development program), and indirect support measures such as the rollovers for investments in small businesses. The rollovers measure leverages the knowledge and expertise of private and angel investors, allowing them to reinvest a greater amount of proceeds from one eligible small business to another, and directing the capital towards enterprises they judge have the greatest growth potential.
More generally, the rollovers measure inscribes itself within a group of tax benefits that provide preferential treatment to capital gains and encourage investments in small businesses. These include, but are not limited to, the Lifetime Capital Gains Exemption (which provides a tax exemption for capital gains on qualified farm or fishing property and qualified small business shares) and the deduction of allowable business investment losses (which allows certain capital losses from small businesses to be offset against all sources of income).
Measures like the rollovers of investments in small businesses also exist in other jurisdictions. For example, in the United States there is an exclusion from taxable income of gains from the sale or exchange of a qualified small business stock (QSBS), and a rollover of gains from one QSBS to another. Similarly, in Australia it is possible for a taxpayer to rollover all or a portion of the gain from the sale of an active asset into a replacement active asset or into an investment that will improve another active asset. The deferred amount can be used to purchase multiple replacement active assets or to invest in multiple existing active assets. A comparison of the Canadian, American and Australian measures is provided in Table A1.
In sum, the rollovers measure is relevant: it fills potential gaps in the funding continuum by incentivizing private investors to efficiently allocate resources towards promising small businesses, sits alongside other tax benefits for capital gains and small businesses, and mirrors practices found in other developed economies.
3.2 Effectiveness
In this section, both elements of the objective, namely improved access to capital and the targeting of specific industries, are addressed. The data presented are for the 2010-2019 periodFootnote 5 and are derived from T1 returns, in particular line 161(00) of Schedule 3 "Capital Gains (or Losses)". In addition, Schedule 50 of the T2 "Shareholder Information" is used to identify claimants that are owners of eligible small business corporations.
Rollover claimant groups
By deferring the realization of capital gains on a previous investment, the rollovers measure leaves more of the proceeds of disposition available upon reinvestment in another eligible small business. In this sense, it is effective in enabling increased subsequent investment. However, it is of interest to assess whether the same reinvestment would have been made in the absence of the measure. That is, an investor facing the capital gains taxes upon the sale of the original shares could nevertheless draw from other income or wealth to ensure a given value is reinvested. While data limitations (i.e., a small and volatile sample) preclude a formal estimation of a no-rollover counterfactual, the claimant data can be leveraged to help determine whether the measure might encourage additional investments among certain claimants.
Value of deferrals, associated tax expenditure cost, and number of claimants (2010-2019)
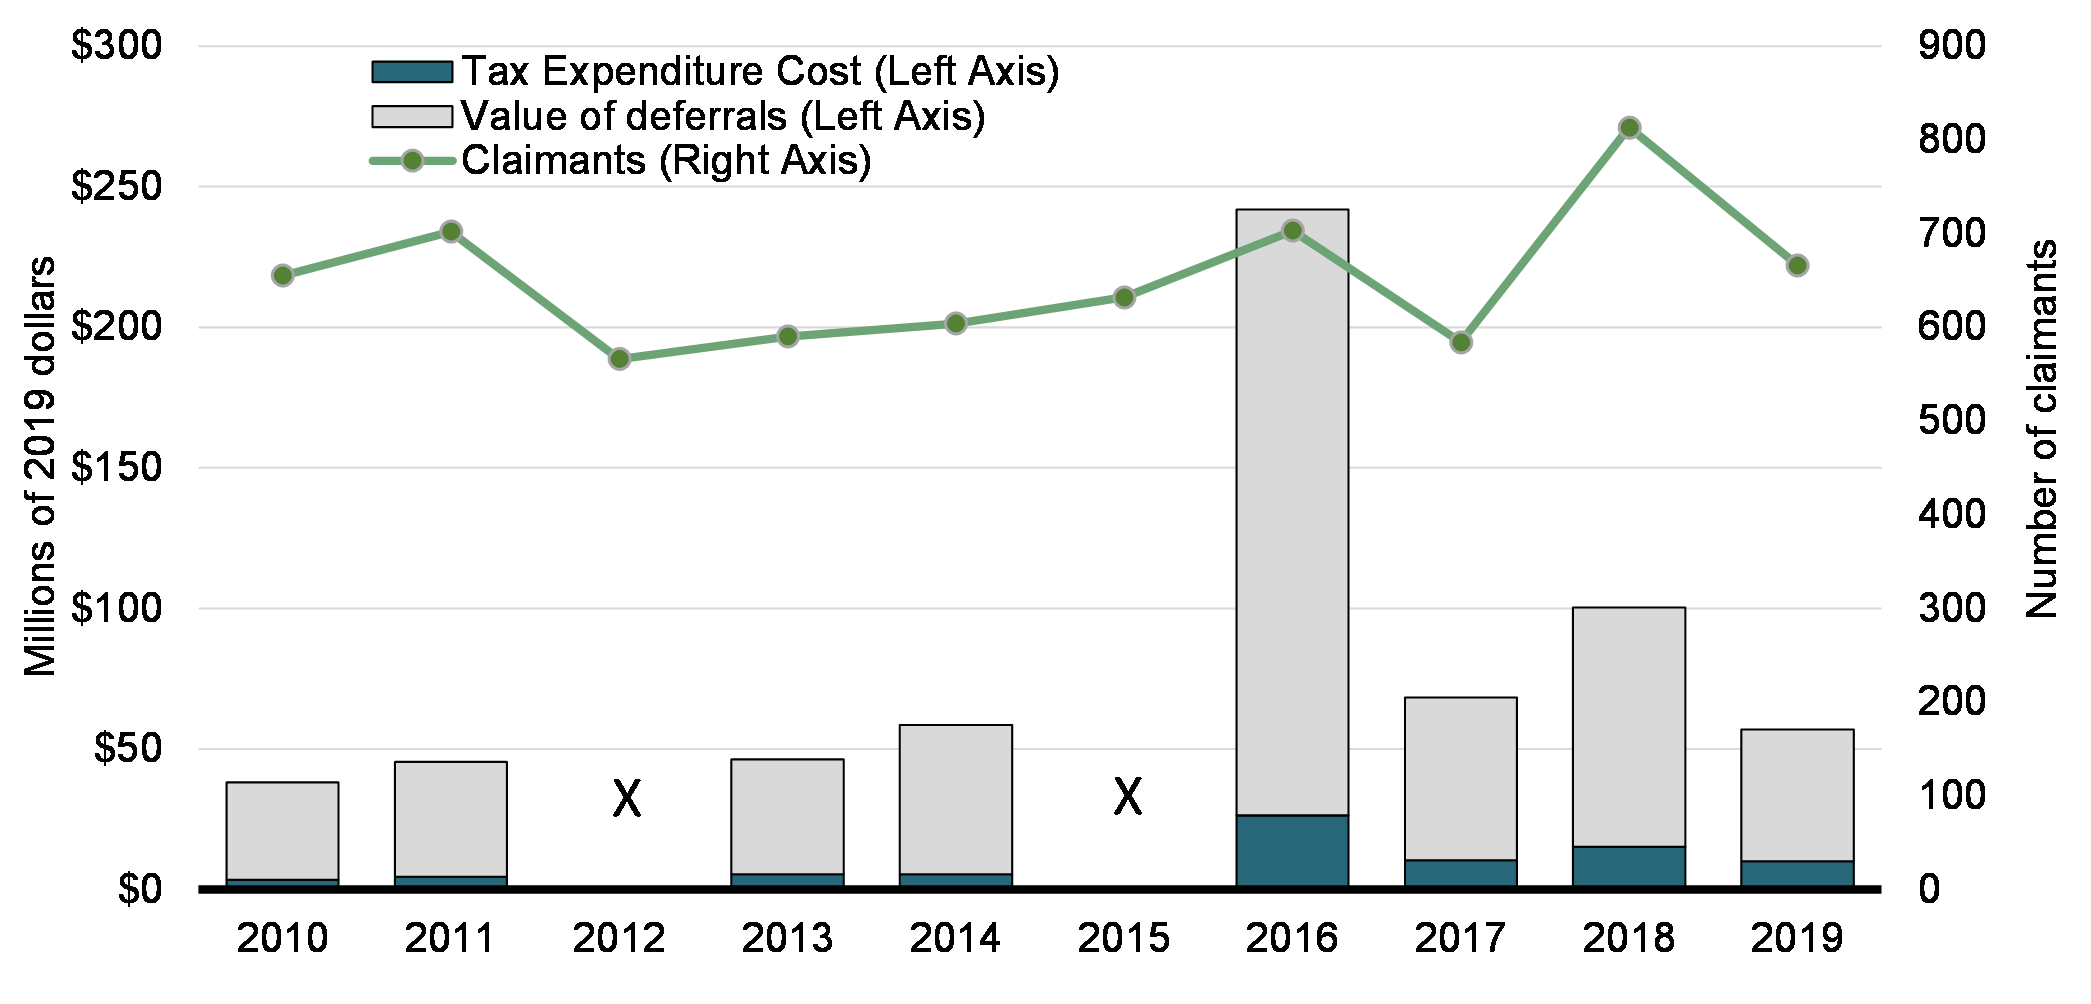
As shown in Chart 1, the number of claimants is small, varying between roughly 600 and 800 per year. The fiscal impact of the measure is similarly small, but varies significantly from year to year, as does the overall value of the deferrals. As it turns out, this volatility is driven by a small number of large claims. Table 1 provides a breakdown of the size of deferrals made by claimants, by year, and shows that a majority of claimants defer no more than $10,000 (with the exception of 2017). To emphasize the impact of large claims, the rightmost columns of Table 1 show the gap between the median deferral and the mean deferral. The former is comparatively stable and modest, ranging between $3,900 and $10,300, while the latter ranges from a low of $58,200 to $344,000.
| Size of deferral | Value of deferral | ||||||
|---|---|---|---|---|---|---|---|
| Under $1,000 | $1,000 to $10,000 | $10,000 to $100,000 | $100,000 and over | Under $10,000 | Median | Mean | |
| Tax year | N | N | N | N | % | $ | $ |
| 2010 | 169 | 222 | 179 | 85 | 59.7 | 5,800 | 58,200 |
| 2011 | 202 | 224 | 185 | 91 | 60.7 | 4,800 | 64,800 |
| 2012 | X | X | X | X | X | X | X |
| 2013 | 178 | 181 | 140 | 91 | 60.8 | 5,100 | 78,400 |
| 2014 | 147 | 210 | 151 | 96 | 59.1 | 6,000 | 96,800 |
| 2015 | X | X | X | X | X | X | X |
| 2016 | 184 | 234 | 162 | 123 | 59.5 | 5,300 | 344,000 |
| 2017 | 120 | 170 | 143 | 151 | 49.7 | 10,300 | 117,000 |
| 2018 | 203 | 255 | 192 | 163 | 56.3 | 5,600 | 123,300 |
| 2019 | 195 | 213 | 144 | 114 | 61.3 | 3,900 | 85,500 |
|
Notes: X indicates the data are suppressed for confidentiality reasons. Dollar values rounded to the nearest hundred. |
|||||||
Although the typical claimant defers less than $10,000, there is an important caveat. This could follow from small dispositions, or it could be that the dispositions are large, but each claimant only reinvested a small portion of the proceeds in eligible replacement shares. While it is not possible to determine the portion of a given disposition that is being rolled over, Table 2 shows that small claimants did not have large net capital gains remaining after claiming their deferral. The 408 claimants that claimed rollovers of less than $10,000 had about $1.8 million in total capital gains among them, for an average capital gain of about $4,400.Footnote 6
| Claims | Capital gain / loss | ||
|---|---|---|---|
| Total | Mean | ||
| Size of deferral | Number | $ | $ |
| Under $1,000 | 195 | 594,100 | 3,000 |
| $1,000 to $10,000 | 213 | 1,173,300 | 5,500 |
| $10,000 to $100,000 | 144 | 5,589,500 | 38,800 |
| $100,000 and over | 114 | 85,850,300 | 753,100 |
| Total | 666 | 93,207,200 | 140,000 |
|
Note: Dollar values rounded to the nearest hundred. |
|||
These patterns are repeated in Table 3, which shows the distribution of deferrals by total income group in 2019. It reveals three subgroups of interest. The first encompasses the majority of claimants (52.3%), who had income under $100,000 and deferrals not exceeding $10,000. These claimants are potentially more limited in their investment means (although the data do not allow for such a determination), in which case the measure could increase the availability of capital and influence their investment decisions. These may be contrasted with the second subgroup, namely claimants with income exceeding $100,000 and deferrals of at least $10,000, characteristic of the angel investor community. A third notable group are those individuals with high deferrals ($10,000 or more) but who report total income not exceeding $100,000; for these individuals, their total income would be substantially higher in the absence of the measure.
| Size of deferral | ||||
|---|---|---|---|---|
| Under $1,000 | $1,000 to $10,000 | $10,000 to $100,000 | $100,000 and over | |
| Total income group | Number | |||
| Under $50,000 | 100 | 102 | 53 | 25 |
| $50,000 to $100,000 | 70 | 76 | 49 | 29 |
| $100,000 to $150,000 | 17 | 23 | 18 | 14 |
| $150,000 to $250,000 | X | 10 | 14 | 16 |
| $250,000 and over | X | X | 10 | 30 |
|
Note: X indicates the data are suppressed for confidentiality reasons. |
||||
Continuing with 2019 as an example year, there is no correlation between the size of deferral and net capital gains (losses) reported (Table 4). In fact, irrespective of the deferral value, the most common net capital gain across all property types is zero. While this may owe to deferrals or losses on other assets,Footnote 7 this reinforces the notion that the typical claimant does not derive large amounts of income from capital gains. However, claimants deferring larger amounts ($10,000 or more) also tend to have zero net capital gains – possibly due to the deferral.
| Size of deferral | ||||
|---|---|---|---|---|
| Under $1,000 | $1,000 to $10,000 | $10,000 to $100,000 | $100,000 and over | |
| Net capital gain (loss) | Number | |||
| Loss | X | X | X | X |
| $0 | 51 | 81 | 82 | 47 |
| $0.01 to $1,000 | 112 | 47 | X | X |
| $1,000 to $10,000 | 23 | 66 | 24 | X |
| $10,000 to $100,000 | X | 18 | 22 | 27 |
| $100,000 and over | X | X | X | 33 |
|
Note: X indicates the data are suppressed for confidentiality reasons. |
||||
Taken together, these results suggest that the cost of the measure, and the high average deferral, is driven by a relatively small number of claimants with characteristics resembling that of angel investors. Moreover, while it is not possible to determine the investment means of a claimant, it is notable that a majority of claimants defer relatively modest amounts (less than $10,000) and have total income not exceeding $100,000. For this group, the measure could potentially influence investment decisions.
Corporations owned by rollover claimants
Private corporations are required to report any shareholder who owns 10% or more of the corporation's common or preferred shares via Schedule 50 of the T2 (defined henceforth as "substantial shareholders"). It is therefore pertinent to ask with what frequency the claimants of the rollovers measure appear as substantial shareholders in private corporations, and whether these corporations are likely those for which the rollovers are being used.
Depending on the year under consideration, between 13.6% and 24.5% of claimants show up in Schedule 50 of the T2, as substantial shareholders of private corporations (Table 5). In other words, the vast majority of rollover claimants are not substantial shareholders of the corporations for which they elect to defer capital gains. This is consistent with the limited deferrals declared by most claimants.
| Claims | |||||
|---|---|---|---|---|---|
| Not a substantial shareholder | Substantial shareholder of at least one corporation | Total | |||
| Tax year | N | % | N | % | N |
| 2010 | 566 | 86.4 | 89 | 13.6 | 655 |
| 2011 | 576 | 82.1 | 126 | 18 | 702 |
| 2012 | 457 | 80.7 | 109 | 19.3 | 566 |
| 2013 | 477 | 80.9 | 113 | 19.2 | 590 |
| 2014 | 496 | 82.1 | 108 | 17.9 | 604 |
| 2015 | 480 | 76 | 152 | 24.1 | 632 |
| 2016 | 579 | 82.4 | 124 | 17.6 | 703 |
| 2017 | 441 | 75.5 | 143 | 24.5 | 584 |
| 2018 | 664 | 81.7 | 149 | 18.3 | 813 |
| 2019 | 558 | 83.8 | 108 | 16.2 | 666 |
In addition, the claimants who are substantial shareholders of corporations via Schedule 50 account for a disproportionate amount of the capital gains being deferred through the rollovers measure, as seen in Table 6. In all years except 2010, despite representing a minority of claimants, they are responsible for most of the gains being deferred. This is consistent with the angel investor profile.
| Deferrals | |||||
|---|---|---|---|---|---|
| Not a substantial shareholder | Substantial shareholder of at least one corporation | Total ($) | |||
| Tax year | Total ($) | % | Total ($) | % | |
| 2010 | 20,893,300 | 54.8 | 17,257,200 | 45.2 | 38,150,500 |
| 2011 | 21,521,200 | 47.3 | 23,970,500 | 52.7 | 45,491,700 |
| 2012 | X | X | X | X | X |
| 2013 | 17,538,100 | 37.9 | 28,689,000 | 62.1 | 46,227,100 |
| 2014 | 22,790,200 | 39 | 35,692,400 | 61 | 58,482,400 |
| 2015 | X | X | X | X | X |
| 2016 | 26,544,300 | 11 | 215,294,600 | 89 | 241,838,900 |
| 2017 | 27,964,700 | 40.9 | 40,354,000 | 59.1 | 68,318,700 |
| 2018 | 39,452,900 | 39.4 | 60,773,100 | 60.6 | 100,226,000 |
| 2019 | 26,242,300 | 46.1 | 30,676,800 | 53.9 | 56,919,200 |
|
Notes: X indicates the data are suppressed for confidentiality reasons. Dollar values rounded to the nearest hundred. Source: Department of Finance calculations. |
|||||
It is then useful to assess whether the substantial shareholders are associated to corporations that are likely a) eligible small business corporations and b) the very corporations for which the rollovers measure is being used. As a counter-example, a claimant may be a substantial shareholder in one or more corporations, some (or all) of which may not be eligible small business corporations, i.e., with no relation to the capital gains deferral claim. Likewise, the claimant could also be a substantial shareholder in an eligible small business corporation but not have sold and acquired new shares that year. The claimant may further be a non-substantial shareholder in either eligible small business corporations or other corporations, neither of which would be picked up by Schedule 50. These possibilities are summarized in Table 7.
| Eligible small business corporation (ESBC) | Other private corporation | ||
|---|---|---|---|
| Type of shareholder | (likely) Rollover | No rollover | No rollover |
| Substantial shareholder (10% or more) |
|
|
|
| Non-substantial shareholder (less than 10%) or non-shareholder |
|
|
|
|
Notes: Observed means the shareholder appears in Schedule 50 of the T2. The criteria used to determine whether a corporation is an eligible small business corporation are: "small size", assets not exceeding $50 million, CCPC, and not a professional corporation, specified financial corporation, corporation that primarily trades in or develops real property, or corporation in the public sector. Rollovers are identified based on whether the claimant was a shareholder in a previous year and, if so, by a positive change in ownership of common shares. |
|||
To help classify claimants according to the table above, it is necessary to identify eligible small business corporations. Thus, a flag was created for T2 Schedule 50 matches of corporations that are CCPCs, of small size, whose assets do not exceed $50 million, and outside of the excluded classifications (professional corporations, specified financial corporations, real estate corporations, and corporations in the public administration domain). The subset of these matches that likely owe to a rollover are those where either a) the substantial shareholder did not appear in Schedule 50 for that corporation in the previous year, or b) the substantial shareholder did appear but has increased their holding of common shares.Footnote 8 Analysis of this data reveals that the linked corporations for these matches are most commonly in the Professional, scientific and technical services 2-digit North American Industry Classification System (NAICS) code, which includes certain "high-technology industries" targeted by the rollovers measures.Footnote 9
Overall, while most of the value of rollovers comes from a relatively small number of claimants, the measure is mostly accessed by claimants with lower income and capital gains in the year of deferral (and for whom the measure may potentially influence their investment behaviour). Moreover, to the extent rollovers are identifiable in the data, they are most often associated to corporations in the Professional, scientific and technical services NAICS group, consistent with the measure's targeting of "high-technology industries".
3.3 Equity
In this section, equity is considered by reference to the distribution of federal benefits that result from claiming rollovers in a given tax year. Generally, claimants of tax expenditures such as the rollovers measure are considered beneficiaries if claiming leads to a reduction in net federal income tax payable, all else being equal.Footnote 10
| Claimants | Beneficiaries | |||||
|---|---|---|---|---|---|---|
| Number | Claim ($, average) |
Number | Benefit ($, average) |
Benefit as % of claim | % of overall benefits | |
| Gender | ||||||
| Male | 381 | 107,600 | 353 | 15,800 | 14.7 | 73.9 |
| Female | 285 | 55,900 | 244 | 7,500 | 13.4 | 26.1 |
| Total income group | ||||||
| Under $50,000 | 280 | 30,400 | 211 | 3,300 | 10.9 | 11.3 |
| $50,000 to $100,000 | 224 | 55,700 | 224 | 7,400 | 13.3 | 20.3 |
| $100,000 to $150,000 | 72 | 112,600 | 72 | 16,700 | 14.8 | 14.8 |
| $150,000 to $250,000 | 45 | 129,300 | 45 | 18,800 | 14.5 | 10.4 |
| $250,000 and over | 45 | 489,900 | 45 | 78,500 | 16 | 43.4 |
| Age group | ||||||
| Under 45 | 98 | 125,900 | 93 | 18,100 | 14.4 | 21.8 |
| 45 to 65 | 265 | 106,200 | 236 | 15,400 | 14.5 | 50.2 |
| 65 and above | 303 | 54,300 | 268 | 7,500 | 13.8 | 28 |
| Total | 666 | 85,500 | 597 | 12,200 | 14.3 | |
|
Notes: Benefits include both direct and indirect benefits (defined in footnote 10), the latter constituting less than 0.5% of overall benefits. Due to rounding, percentages may not add up to 100. Dollar values rounded to the nearest hundred. Source: T1 data; Department of Finance calculations. |
||||||
Table 8 considers the number and value of both claims and benefits for the rollovers measure in 2019, by gender, total income group, and age group. Overall, in 2019 the average claim stood at $85,500, with an average federal benefit across all claimants of $12,200 (or 14.3% of claim value). Average claim and benefit amounts also varied most dramatically across total income groups: those with total income under $50,000 had an average claim of $30,400 and average benefit of $3,300, whereas claimants with income of $250,000 or more had an average claim of $489,900 and average benefit of $78,500. There was also a substantial difference by gender, with men's average claims and benefits approximately twice that of women's ($107,600 vs. $55,900, and $15,800 vs. $7,500, respectively). The benefit to claim ratio, however, was only modestly higher among men (14.7% vs. 13.4%). Variability was relatively muted when considering different age groups, but at $54,300 and $7,500, the claims and benefits of those 65 and above were roughly half that of younger claimants.
Disparities were also seen in the distribution of total benefits. Along the gender dimension, men accounted for 57.2% of claimants but received 73.9% of total benefits. In addition, 75.7% of claimants had total income not exceeding $100,000 but received only 31.6% of total benefits. Finally, the 45-65 age group accounted for 39.7% of claimants and received just over half of all benefits. On the other hand, benefits as a percentage of the claim value varied only modestly (ranging between 10.9% and 16%), with the most substantial differences reported by total income group.
The results shown here are consistent with the Gender-based Analysis Plus in the 2019 and 2021 editions of the Report on Federal Tax Expenditures, which found that the rollovers measure especially benefited men and claimants with higher income. However, there are other important considerations. First, the measure mostly attracts claimants in lower income brackets whose deferrals are modest (as seen in Table 1's median claim). Second, benefits as a proportion of the claimed rollover were relatively stable across all dimensions considered. Finally, as will be addressed in more detail in the next section, the benefits accrued in a given taxation year are the result of a deferral of taxation as opposed to a concrete reduction in net federal tax payable: once the taxpayer shifts the value of the assets out of an eligible small business corporation – or otherwise realizes the latent capital gains being rolled over – the amounts at hand then become taxable.
3.4 Efficiency
Cost over time
Tax measures are considered efficient insofar as they meet their stated objectives in a cost-minimizing fashion. Alternatively, efficiency may be achieved when, for a given cost, the benefits of the measure are maximized.
In the case of the rollovers measure, the first definition is the most pertinent. In a given calendar year, the cost of the measure per investor is equal to the capital gains deferral multiplied by the inclusion rate multiplied by the marginal tax rate. However, once the deferral ends and there is a final realization of the capital gains, the gains become taxable, and the measure's cost becomes limited to the time value of money. Moreover, to the extent the measure assists in directing capital towards corporations with high growth potential, its cost is further minimized.
Indeed, there may even be gains in tax revenue over time. This can occur because of the "lock-in" effect owing to capital gains taxation upon realization (as opposed to accrual), where individuals may hold on to assets with a low rate of return to defer taxation, instead of selling and reinvesting in a more productive asset (Mintz and Wilson, 2006). Allowing the rollover of capital gains gives individuals an opportunity to defer taxation by selling and reinvesting, which encourages the reallocation of capital within the small business sector, to where it can be most productively deployed.
A stylized example in Table 9 illustrates such a scenario. Consider an investor prepared to make a $100,000 investment. In the first year, the investor purchases shares in a low-growth corporation, with yearly returns of 5%. In the absence of the rollovers measure, there may be a lock-in effect such that the investor retains shares in the low-growth corporation for a second year. Capital gains are realized at the end of year two and the tax revenue yielded is $2,562.50 (assuming for simplicity a 50% inclusion rate and 50% marginal tax rate). Under the rollovers measure, however, in the second year the investor may apply for a deferral and move the proceeds of disposition to a high-growth corporation (10% returns per year). At the end of the second year, the capital gains are realized, and the tax revenue is $3,875.
| Year 1 | Year 2 | |
|---|---|---|
| No rollovers (5% growth both years) | $ | $ |
| Investment, beginning of year | 100,000 | 105,000 |
| Value of shares / proceeds of disposition, end of year | 105,000 | 110,250 |
| Capital gains, end of year | 0 (lock-in) | 10,250 |
| Tax revenue, end of year | 0 | 2,562.50 |
| Rollovers (5% growth first year, 10% second) | ||
| Investment, beginning of year | 100,000 | 105,000 |
| Value of shares / proceeds of disposition, end of year | 105,000 | 115,500 |
| Capital gains, end of year | 0 (deferral) | 15,500 |
| Tax revenue, end of year | 0 | 3,875 |
|
Notes: This example assumes a 50% capital gains inclusion rate and 50% marginal tax rate. It does not account for inflation. |
||
Replacement period
As illustrated above, assisting investors in finding an appropriate, high-growth investment enhances the efficiency of the measure. Currently, the rollover requires that replacement shares be purchased during the year of disposition or within 120 days after the end of that year. However, it may be that the right subsequent investment is not always available within this period. It could be argued that expanding the replacement period could assist investors in finding an appropriate, high-growth replacement investment, but on the other hand, the current approach minimizes tax compliance risks by ensuring the replacement shares are acquired by the tax filing deadline. While the risks under a longer replacement period could be managed by having the taxpayer post security until the new shares are purchased,Footnote 11 this would leave investors with fewer funds in the interim. To the extent that an individual investor has limited liquidity, a requirement to post security and wait for a refund could reduce the capital available for reinvestment. As has been demonstrated in the effectiveness section, the majority of claimants make relatively small deferrals and have limited total income, so this may be a salient concern.
Eligible shares at time of issue
It is a core feature of the measure that it is limited to small businesses. The economic rationale for the special tax treatment for small business shares relative to other assets is based on the presumption that, absent government support, these businesses would receive less capital than optimal or incur high capital costs. In principle, limited access to capital markets may reflect: market failures relating to informational asymmetries, the lack of liquidity or collateral to secure financing, and under-developed venture capital markets in Canada. The larger a business is, the less these constraints apply and the less relevant the measure is.Footnote 12 Thus, extending the measure to larger businesses would likely be inefficient.
In addition, shares from professional corporations, specified financial corporations, rental or leasing corporations and real estate corporations are excluded from the rollovers measure. These businesses are often not capital constrained and they are not considered the type of innovative, high-growth potential corporations that the measure is designed to help. This raises a more general question about whether the measure should be more narrowly targeted to "fast-growing high-technology" industries described in Budget 2000. As shown previously, however, the favoured type of business for a rollover appears to be of the Professional, scientific and technical services variety. It also remains that this sector is an imperfect predictor of growth potential and, with limited exceptions, the most efficient allocation of resources is expected to be found by allowing individual investors to find small businesses with the highest expected returns, within and across sectors.
Other potential expansions to eligible dispositions
Under the current rules, both the shares being disposed of and the replacement shares must meet certain criteria, as described above (and subject to timing considerations). In particular, other types of dispositions, such as a capital gain from a disposition of ineligible equity shares (or more generally any capital gain) may not be deferred. While allowing such dispositions could potentially encourage more individuals that have realized a capital gain to reinvest the proceeds in a qualifying small business, the measure would then no longer provide an incentive to choose a small business over a larger more established business for the initial investment.
The considerations addressed in this section point to the measure being efficient overall. While the measure incurs a cost in the short term, over a long enough time horizon, this is recouped as the capital gains are shifted away from eligible small businesses or otherwise realized. Moreover, to the extent that the rollovers encourage an efficient allocation of resources, they may generate additional taxable capital gains compared to a no-rollovers scenario. The existing replacement period, meanwhile, strikes a balance between affording investors the flexibility to find a new business in which to invest, while minimizing compliance and administrative concerns. Finally, the targeting of eligible small businesses is also efficient, considering other small businesses (e.g., professional corporations) are less likely to have high growth potential, and given that larger businesses are less likely to face financial or funding constraints that rollovers could alleviate.
4. Conclusion
This study has examined the rollovers of investments in small businesses measure against the criteria of relevance, effectiveness, equity, and efficiency. Overall, the measure is found to be relevant as it addresses a potential gap in the funding continuum, sits alongside other small business and capital gains tax benefits, and is in line with international practices. With respect to effectiveness, most of the value of rollovers comes from a relatively small number of claimants who have many of the characteristics of angel investors, while the balance is mainly claimants with lower income and limited capital gains in the year of deferral, for whom the measure could potentially influence their investment behaviour (although claimants' overall investment means are not seen in the data). In addition, insofar as rollovers can be identified, a plurality of the associated corporations are in professional, scientific and technical services, which corresponds to the industries targeted by the measure. On the equity front, important discrepancies were noted in terms of the proportion of benefits captured by different groups – in particular, along the gender and total income dimensions – but benefits as a share of the value claimed was both modest and only somewhat sensitive to total income. The measure is also efficient in that the benefit is generally limited to the time value of money as tax will be payable in the longer run upon realization of any capital gains. The measure's efficiency is further reinforced by its design elements: an appropriately long replacement period for shares, and more generally a focus on eligible small businesses who are more likely to face funding or liquidity constraints.
References
Beck, T., Demirgüç-Kunt, A., and V. Maksimovic (2008). "Financing patterns around the world: Are small firms different?", Journal of Financial Economics, Vol. 89, Issue 3.
D'Souza, C., Fudurich, J., and F. Suvankulov (2021). "Small and smaller: How the economic outlook of small firms relates to size", Bank of Canada Staff Analytical Note No. 2021-14.
Department of Finance Canada (2019). "Gender-Based Analysis Plus of Existing Federal Personal Income Tax Measures", Report on Federal Tax Expenditures 2019.
Department of Finance Canada (2021). "Gender-Based Analysis Plus of Federal Personal Income Tax Measures: Impacts by Identity Factors Other than Gender", Report on Federal Tax Expenditures 2021.
Innovation, Science and Economic Development Canada (2022). "Untangling the Seed and Early-Stage Funding Environment in Canada". Accessed August 9, 2023.
Mintz, J. and T. A. Wilson (2006). "Removing the Shackles: Deferring Capital Gains Taxes on Asset Rollovers", C.D. Howe Institute Backgrounder, No. 94. Accessed August 29, 2023.
Appendix
| Canada | United States (US) | Australia1 | |
|---|---|---|---|
| Who can claim the rollover | All individuals other than a trust. | All taxpayers other than a corporation. | A small business entity (SBE), a partner (carrying a business) in a SBE partnership, or any taxpayer with net assets ≤ $6 million Australian dollars (AUD). |
| Requirements for the original share | The share must be a common share issued by a Canadian-controlled private corporation (CCPC). | The share must be issued by a domestic C corporation. | The corporation issuing the share must be a small business entity or have net assets ≤ $6 million AUD. |
| The corporation must be an eligible small business at the time the share is issued. | The corporation must be a qualified small business at the time the share is issued. | At the time a capital gain is made, the taxpayer must be a concession stakeholder in the company (have a participation of at least 20% in the company or have a participation in the company greater than 0% and be the spouse of an individual that has a participation of at least 20% in the company). | |
| The corporation must meet the active business requirement during the time the taxpayer owned the share. | The corporation must meet the active business requirement during substantially all the time the taxpayer holds the share. | The corporation must meet the active asset test. | |
| The corporation must have gross assets ≤ $50 million Canadian dollars immediately before and immediately after issuance of the share. | - | - | |
| Requirements for the replacement share | Same requirements as for the original share issuance. | Same requirements as for the original share issuance, except that the active business requirement must only be met for 6 months after the sale of the replacement share. | No requirements. |
| Small business definition | A CCPC that uses 90% of its assets in an active business carried on primarily in Canada. | A corporation that has aggregate gross assets ≤ $50 million US dollars before and immediately after issuance of the share. | An individual, a partnership, a company, or a trust that is carrying a business and has an aggregate gross income < $2 million AUD. |
| Active business/asset requirement | A taxable Canadian corporation that uses 90% of its assets in an active business carried on primarily in Canada while the taxpayer owns the share or for at least 730 days of the ownership period. | The corporation is a C corporation and at least 80% of the assets of the corporation are used in the active conduct of a trade or business. | The share must have been an active asset for at least half the time it was held by the taxpayer2 and at least 80% of the market value of the assets of the company or trust (or a later entity3) is made up of the active assets of the company or trust (or a later entity) and of the financial instruments and cash that are inherently connected with a business carried on by the company or trust (or a later entity). |
| Minimum holding period of the share (before the taxpayer can claim a rollover) | 185 days. | 6 months. | No minimum. |
| Maximum amount that can be deferred | Capital gain made on the sale of share. | Capital gain made on the sale of share. | Capital gain made on the sale of share. |
| Period during which the replacement asset has to be purchased | Up to 120 days after the end of the year in which the share was sold. | Up to 60 days after the sale of the share. | 1 year before or up to 2 years after the sale of the asset. |
| Can claim a rollover multiple times | Yes. | Yes. | Yes. |
| The holding period of the replacement share includes the holding period of the share that was sold to purchase it. | No (except in particular cases related to the death of an individual, the breakdown of relationships, or the exchange of share). | Yes. | No (except in particular cases related to compulsory acquisition, the death of an individual, the breakdown of a relationship, or loss or destruction). |
|
Notes: 1 Requirements for an asset that is a share in a company or an interest in a trust. However, the rollover can be applied to any type of asset (e.g., land). The requirements are less restrictive for assets other than a share in a company or an interest in a trust. 2 Or for at least 7.5 years if the asset was held for more than 15 years. 3 A later entity is an entity in which the company or trust has a participation of at least 20%. The assets of a later entity are calculated as the assets of the entity multiplied by the participation percentage of the company or the trust in that entity. |
|||